Abstract
In an effort to evaluate the performance of a 5-gallon pot still in separating yeast-derived congeners during the distillation of a grain-based distiller’s beer, the distillates of a fermented mash of cracked corn, malted barley, and wheat were characterized using 1H NMR spectroscopy and GC-MS. A quantitative comparison using these two techniques is uncommon. Results revealed significant variation in congener concentrations across runs, with a notable discrepancy in the third run possibly due to bacterial contamination, as indicated by high 1-propanol levels. Key congeners, such as acetaldehyde, ethyl acetate, furfural, phenylethanol, and 1,1-diethoxyethane, showed expected distillation behavior across ten fractions, based on their respective boiling points. However, methanol and 1-propanol showed a fairly flat concentration profile across all ten fractions, while those for ethyl octanoate and ethyl hexanoate decreased rapidly and were undetected at fraction 5. White dog (unaged whiskey) fractions from column and combination stills were also analyzed, and the results demonstrate that the small 5-gallon still separates congeners as well as these stills. Finally, a comparison of congener concentrations demonstrates that NMR and GC-MS do not yield identical concentrations of congeners, despite exhibiting similar trends in congener concentrations in the fractions from the still, with GC-MS suggesting higher levels.
1. Introduction
The most common stills used in the distillation of distilled spirits are pot stills, column stills, and combination stills (batch distillation), and each still has pros and cons [1,2]. The stills are used to separate volatile congeners from other chemical compounds in a fermented mixture. The American Distilling Institute reports that there are >3800 distilleries in the world currently (https://web.distilling.com/search (accessed on 1 September 2025)), and all three still types are used to help distillers achieve specific flavors and desired quantities.
Despite being against federal law in the United States (26 United States Code (U.S.C.) 5042(a)(2) and 5053(e)) [3] with fines up to $10,000 and a 5-year imprisonment, several states allow at-home distilling (Alaska, Arizona, Maine, North Dakota, Massachusetts, Missouri, Indiana, and West Virginia; this list varies on different websites) in modest quantities for personal consumption (some of these states do require permits). Recently, a federal judge in Texas ruled that the ban on at-home distillation is unconstitutional [4]; this decision is currently under appeal. Despite the different laws governing at-home distillation, this activity is very prevalent, with many social media posts, and there are commercial stills available for purchase by at-home distillers.
Most large commercial distilleries have the ability to use analytical tools, in addition to sensory approaches and careful monitoring of temperatures/pressures/proof/volumes, to inform distillers where to make “cuts” during runs. The most common of these analytical tools is gas chromatography (GC), with a wide variety of detectors, including mass spectrometry (MS) and flame ionization detection (FID) [5,6,7,8,9]. GC allows for the detection of volatile yeast-derived congeners, such as acetaldehyde, methanol, ethyl carbamate, and fusel oils. NMR spectroscopy has also been used to analyze distillates for congeners [10,11,12,13]; however, the costs to purchase and to maintain an NMR spectrometer is prohibitive for most distilleries. Most analytical studies to date are directed to the presence of compounds in aged distillates or during the aging process.
Most small distilleries and home distillers cannot afford GC or NMR instruments to analyze distillates to inform where to make cuts. Most home distillers rely on specific gravities, temperatures on the still, sensory analyses, and volumes and proofs of distillates. The determination of pesticides [14] and heavy metals [14,15], such as lead and copper, have been reported in fruit brandies produced by home distillation. To the best of our knowledge, determination of the chemicals, particularly those present at the trace level, in such distillate fractions from small home stills before aging, has not been reported before.
In this work we evaluated the performance of a readily available 5-gallon still by monitoring how well the still separates yeast-derived congeners. We also compared the performance of this still with distillates from other stills and through GC-MS and NMR quantitation of yeast-derived congeners. A quantitative comparison of proton NMR and GC-MS techniques is not common in the literature and has not been reported for distillates.
2. Materials and Methods
Chemicals. The following chemicals were purchased from Sigma Aldrich (St. Louis, MO, USA): ethyl acetate (≥99.5%), acetaldehyde diethyl acetal (diethoxyethane) (99%), isobutanol (99.5%), ethyl hexanoate (≥99%), ethyl octanoate (≥99%), furfural (99%), glacial acetic acid (≥99.7%), methyl decanoate (99%), 2-phenylethanol (99%), sodium acetate-d3 (99 atom%), acetic acid-d4 (99.5 atom%), and 3-(trimethylsilyl) propionic acid-2,2,3,3-d4 (98 atom%). Isoamyl acetate (≥98%) was purchased from TCI America (Portland, OR, USA), and methanol (LiChrom, HPLC grade) was obtained from Dawn Scientific (Metuchen, NJ, USA). Deuterium oxide (D2O) (99.8%) was purchased from Acros Organics (Fair Lawn, NJ, USA).
Preparation of the distiller’s beer. The 5-gallon NGSC cracked corn, malted barley, and wheat kit from the North Georgia Still Company (Dahlonega, GA, USA) was used to prepare the distiller’s beer, according to the instructions included in the kit. Initially, 3 gallons of heated water are added to a 7-gallon fermenter. The cracked corn and α-amylase are added, and after an hour, the other milled grains are added. After another hour, 3 gallons of room temperature water are added to the mash. The total volume of the fermenter at this point was nearly 7 gallons making it very difficult to stir the mash and aerate later in the procedure. The original densities of the mashes, determined using an Anpro refractometer (Fuzhou, China; sourced from Amazon.com) and sucrose as the standard, for the three runs were 1.071, 1.062, and 1.072.
The mashes were fermented in a dark room at 68–70 °F for 10–14 days. The vapor lock bubbled for 5–7 days for the runs, and the specific (final) gravities after fermentation were 1.023, 1.018, and 1.023, respectively, corresponding to %ABV values of 5.8–6.5. We noticed that the mash of the 3rd run had a slight acidic odor after day 7 of the fermentation.
Distillation set-up using the Vevor still. A 5-gallon Vevor still (Figure S1) was purchased from Amazon and used according to instructions, with one exception. A 9.5-inch piece of copper tubing (3/8” ID) was cut and welded to the input port of the thumper top so that the tubing extended into the liquid in the thumper. The thumper was charged with 150 mL of heads/tails collected from a previous distillation run. During distillation, a submergible pump, used to cool the condenser, was placed in a cooler filled with iced water. The kettle was heated using a Fisher Brand heating plate/stirrer (max heating setting of 540 °C), and the distiller’s beer was stirred during distillation to reduce the chances of scalding and to more uniformly heat the distiller’s beer during distillation (Figure S2). A schematic diagram of the Vevor still is shown below in Figure 1.
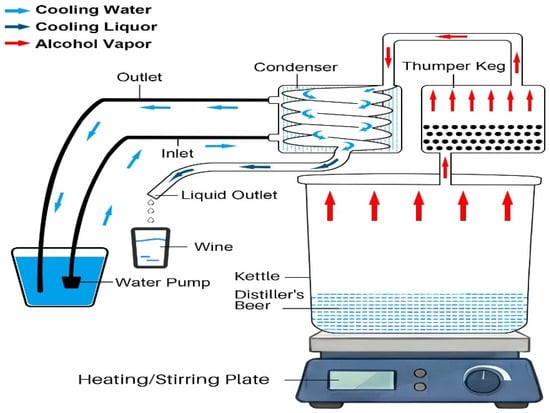
Figure 1.
Diagram of the 5-gallon Vevor still.
Temperatures from the thermometer on top of the kettle were recorded as the fractions were collected, and the proof of each fraction was determined using an Anton Paar Snap 41 portable alcohol meter (Vernon Hills, IL, USA) and confirmed using a LD Carlson hydrometer (Kent, OH, USA; sourced from Amazon.com) (corrected for temperature, as described in the manufacturer’s instructions). To verify the proofs revealed by the alcohol meter and hydrometer, the concentration of ethanol in fractions from Run #2 were also determined by using a Thermo Scientific Ultimate 3000 High-Performance Liquid Chromatography (HPLC) system (Waltham, MA, USA) equipped with a Refractive Index Detector (RID) and Bio-Rad Aminex HPX-87H column. The mobile phase was 5 mM H2SO4 in water, and the flow rate was 0.600 mL/min. Samples were prepared in duplicate for HPLC analysis by diluting 100-fold in MilliQ ultrapure water. Samples were maintained at 4 °C while awaiting analysis, and a volume of 2 µL of the diluted sample was injected. Quantification was performed by comparison to a standard curve (range: 40–200 proof; R2 = 0.9998) generated similarly using absolute ethanol. The observed retention time for ethanol was 21.15 min.
Distillation procedure using the Vevor still. The distiller’s beer was filtered into the kettle through cheese cloth, held in a colander, to remove solids. All of the distiller’s beer could not be distilled in a single run on the 5-gallon still (Figure S3), so only 4 gallons of the distiller’s beer was distilled in each run. The first drops of distillate appeared about 90 min after the heater was turned on, and the thermometer on the top of the kettle read between 180 and 182 °F (Table S1). Fractions were collected from the still; 100 mL in the first fraction (foreshots) and 200 mL in all subsequent fractions (total of 10 fractions). In the first run, fraction #10 was cloudy, and we stopped distillation after this fraction was collected. In the second run, fractions #9 and #10 were cloudy, while in the third run, none of the fractions were cloudy. In the second run, we noticed that a light fluffy blue matter appeared after a few days. This same matter was not present in the fractions from the first and third runs. The #10 fraction for all three runs was collected in 2 to 2.5 h after starting the heating, and the temperature measured at the top of the kettle never exceeded 192 °F (Table S1).
The ten fractions from each of the three 4-gallon distillations were analyzed. The proofs of sample #1 in the first two runs were 162, while that of sample #1 in the third run was 156 (Table S1). As expected, the %ABV (proof) dropped (Figure S4) for all subsequent samples ending with all three #10 sample fractions exhibiting proofs under 100. The %ABV (proof) for Run #2 was identical if measured with the alcohol meter and HPLC (Figure S4).
NMR Analysis of fractions from the still. Each fraction from the still was analyzed for the presence of congeners with 1H NMR spectroscopy and Chenomyx, as previously reported [10]. A solution of 25 mM sodium acetate-d3, 25 mM acetic acid-d4, and 1 mM 3-(trimethylsilyl) propionic acid 2,2,3,3-d4 in D2O (pH 4.82) was prepared. Calibration curves for the congeners were used to determine concentrations in the distillates, and errors in replicate measurements were ±4.4%, as described previously [10].
GC-MS Analysis of fractions from the still. An Agilent GC-MS system, consisting of an 8860 GC and a 5977B MSD, equipped with an Agilent VF-WAXms (CP9205) capillary column (30 m × 0.25 mm ID, 0.25 µm film thickness) (Santa Clara, CA, USA), was used for sample analysis. Based on the van Deemter equation, this narrow column diameter and thin film thickness minimized the height equivalent theoretical plate and maximized plate count for a standard 30 m column. Instrument control, data collection, and both qualitative and quantitative analyses were conducted using an Agilent MassHunter Workstation (version 10.0). Chromatographic separation was achieved using a helium flow rate of 1.2 mL/min at a steady flow, an inlet temperature of 220 °C, split injection at a ratio of 30:1, and an injection volume of 0.5 µL. The temperature program started at 30 °C and was maintained for 4 min, then increased at a rate of 4 °C/min to 110 °C, followed by a ramp to 230 °C at a rate of 30 °C/min. The oven was allowed to equilibrate for 2 min before sample injection. The transfer line temperature was maintained at 220 °C. The MS ion source temperature was set to 230 °C, and the quadrupole was set at 150 °C. The data acquisition delay was 2.8 min to extend the lifespan of the ion-source filament. The analytes studied included ethyl acetate, diethoxyethane, methanol, isobutanol, isoamyl acetate, ethyl hexanoate, ethyl octanoate, furfural, acetic acid, and 2-phenylethanol.
During method development using the total ion chromatogram (TIC) mode, the peaks of the studied analytes and the internal standard (methyl decanoate) were all well-resolved, except for ethyl acetate, diethoxyethane, and methanol. Subsequent method optimization focused on selecting specific quantifier and qualifier ions for each analyte to ensure an analyte-specific response under the selected ion monitoring (SIM) mode. The selected quantifier and qualifier ions for each analyte are given in Table S2. Peak purity for the weakly retained acetaldehyde was poor and SIM qualifier and quantifier ions could not be assigned. The SIM parameters, including monitored ions, retention time windows, and dwell times, are detailed in Table 1.

Table 1.
The mass spectrometer settings for the selected-ion monitoring (SIM) of the studied analytes.
Calibration standard mixtures containing all target analytes were prepared in ethanol at various concentrations that cover the expected levels in the distillate fractions. A 10 μL aliquot of the internal standard solution (methyl decanoate, 10 mg/mL in ethanol) was added to 990 μL of each calibration standard solution, and the mixtures were then analyzed using the optimized chromatographic SIM method. For each analyte, an appropriate calibration model was developed to provide an adequate fit using a weighted or unweighted least-squares regression analysis (Table S3). The samples from the distillation fractions underwent similar processing prior to their GC-MS analysis.
3. Results and Discussion
NMR Analysis of fractions from the still. 1H NMR spectroscopy was used to analyze all of the fractions. While 17 congeners in bourbons were quantitated in our previous work [10], we were only able to quantitate 10 congeners in these samples, 5-hydroxymethylfurfural, formic acid, gallic acid, glucose, syringaldehyde, syringic acid, and vanillin, quantitated in that previous work [10], are introduced into bourbon during barrel aging, and therefore, not present in these samples. In previous NMR studies on whiskies, a 1H NMR peak at 3.32 ppm was used to quantitate methanol in the samples [10,11,12,13]. When we started the analyses of the distillates, we noticed very low concentrations of methanol even in the first fractions from the still (Table S1), which are often called the foreshots. Therefore, we conducted an experiment in which we titrated a bourbon sample with different concentrations of methanol, and the NMR spectra of those samples are shown in Figure 2. The peak at 3.35 ppm increased upon addition of methanol, strongly indicating that the peak used to quantitate methanol in previous studies was not the correct one. During the analysis (and re-analysis of previous samples) of the distillates, we noticed that the peak position of methanol changes as a function of proof, with samples at lower proof generally having methanol peak positions at lower (3.348) ppm values. In this work, we used the correctly assigned NMR peak to quantitate methanol.
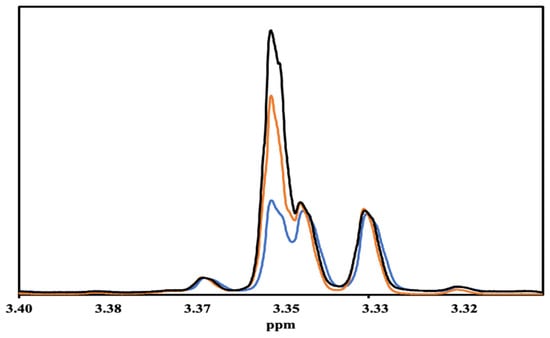
Figure 2.
1H NMR spectra of Evan Williams Bottled-in-Bond sample titrated with methanol: no added methanol (blue line), 1.8 mM added methanol (orange line), and 3.5 mM added methanol (black line).
The concentrations of the congeners determined by NMR are presented as bar graphs in Figure 3 and in tabular form in Table S4. Despite using the same grain kits for the three runs and observing similar OG’s, SG’s, and final proofs, it is clear that the concentrations of the congeners vary widely from run to run. It is not clear why this occurred but it is likely due to different activities of the yeast (Red Star Distiller’s Active Dry Yeast) in the kits. Since fermentation was done in the same fermenter and in the same room, other factors must have led to stress of the yeast [16]. However as mentioned earlier, there was an acidic odor to the third run, which may be indicative of a bacterial contamination of this specific mash, despite using the same sanitizing agent (Star San) and cleaning method. As shown in Figure 3, the third run exhibited very high levels of 1-propanol, which has been reported to be evidence of bacterial contamination of a yeast fermentation [17,18]. We predict that the bacterial contaminant was not an Acetobacter strain since the concentration of acetic acid was relatively low in Run #3 (Figure 3); it is likely that the contaminant was a Lactobacillus strain [19]. The different concentrations of congeners (and different final proofs) offer a possible explanation of why there was cloudiness in later fractions of some of the runs but not in all.
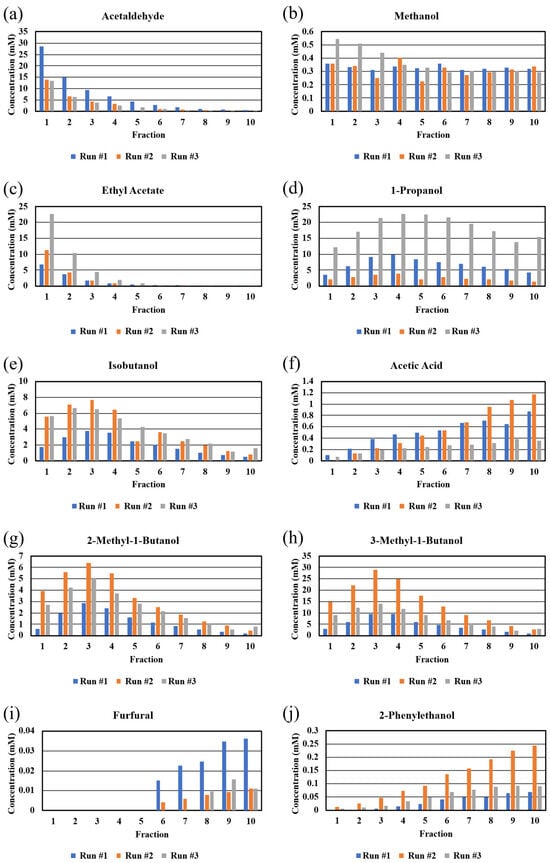
Figure 3.
Bar graphs of congener concentrations taken by NMR in different fractions from a 5-gallon Vevor still. Fractions from the three runs are presented independently to show run-to-run variability in absolute value, but similarity in congener concentration trends across the 10-fraction distillation run. Congeners: (a) acetaldehyde, (b) methanol, (c) ethyl acetate, (d) 1-propanol, (e) isobutanol, (f) acetic acid, (g) 2-methyl-1-butanol, (h) 3-methyl-1-butanol, (i) furfural, (j) 2-phenylethanol.
The congener concentrations were plotted as a function of fraction number (Figure 3). The congeners (boiling points in parentheses) with boiling points lower than that of ethanol (173.1 °F/78.4 °C), such as acetaldehyde (68.4 °F/20.2 °C) and ethyl acetate (170.8 °F/77.1 °C), exhibited expected plots showing high concentrations in the early fractions and rapid decreases in later fractions. On the other hand, methanol (148.5 °F/64.7 °C) exhibited a plot that showed slightly higher concentrations in early fractions and a constant level in all subsequent fractions, indicating that methanol could not be separated from the other congeners as a function of boiling point [1]. Similar behavior has been reported for distillates from fruit mashes [1,20,21]. This behavior suggests that methanol forms an azeotrope with one or more of the congeners, such as a short chain ester [22] in the whiskey distillate, and calls into question the longstanding belief that discarding the foreshots when running a pot still on fermented grain mashes will remove most of the methanol [23]. The fact that the NMR peak position for methanol changes as a function of proof (see above) might be due to changes in methanol–water clustering, which is favored for chain alcohols [24].
1-Propanol (206.6 °F/97.0 °C) exhibits similar behavior as methanol. The concentration of 1-propanol is low in the early fractions and increases until fraction #4. While the concentration of 1-propanol drops a little, it is clearly present in all fractions collected from the still. Given the boiling point of 206.6 °F, we expected a plot that showed a rapid decrease in concentration after the maximum at fraction #4. It is well known that alcohols other than methanol form azeotropes with water [24], and this may be the reason for the consistent presence of 1-propanol in all the fractions.
The primary alcohols, isobutanol (226.4 °F/108.0 °C), 2-methylbutanol (262.4 °F/128.0 °C), and 3-methylbutanol (266 °F/132 °C), exhibited plots that were expected given their respective boiling points. There were low concentrations of all three congeners in fraction #1 in all runs, and fraction #3 in all 3 runs contained the highest concentration of the congener. After fraction #3, there was a drop in concentration of the congeners in later samples. As the proof decreases, possibly clustering of longer chain and likely branched alcohols with water is less likely [24].
The plot for acetic acid (244.2 °F/117.9 °C) was not expected, given that the boiling point of acetic acid is lower than those of 2-methylbutanol and 3-methylbutanol. Acetic acid exhibited a plot that showed low levels of congener in early fractions and an increase across all subsequent fractions. This result demonstrates that the actual temperature needed to volatilize acetic acid in the wash is higher than the published boiling point of pure acetic acid (see below for comments about furfural and phenylethanol). This behavior is most likely due to hydrogen bonding between acetic acid and water. This result may be important for subsequent barrel aging, since it assumed that acetic acid is the most concentrated acid in bourbon distillates and there are higher concentrations of acetic acid in later fractions (tails), which are often excluded when final cuts are made.
The final two congeners (furfural (323.1 °F/161.7 °C) and phenylethanol (399.2 °F/204 °C)) exhibit plots similar to that of acetic acid. These plots were expected since both of these congeners have relatively high boiling points and are not expected to exhibit hydrogen bonding to any appreciable extent.
GC-MS analysis of fractions from the still. Since GC-MS can be used to detect and quantitate congeners at lower concentrations than NMR [25], this technique was also used to analyze the fractions from the Vevor still. We were unable to analyze fractions from the first distillation run, since we ran out of many of the samples before GC-MS analyses. Therefore, we analyzed the fractions from Runs #2 and #3 for the concentrations of methanol (148.5 °F/64.7 °C), ethyl acetate (170.8 °F/77.1 °C), 1,1-diethoxyethane (215.6 °F/102 °C), isoamyl acetate (287.6 °F/142 °C), ethyl hexanoate (334.4 °F/168 °C), ethyl octanoate (406.4 °F/208 °C), isobutanol (226.4 °F/108 °C), furfural (323.1 °F/161.7 °C), acetic acid (244.2 °F/117.9 °C), and phenylethanol (399.2 °F/204 °C). Figure 4 shows a representative selected ion monitoring (SIM) chromatogram, indicating excellent peak resolution of the nine analytes retained beyond 5 min. The peaks for the three low boiling components ethyl acetate, diethoxyethane, and methanol overlapped but could still be quantified through SIM mode.
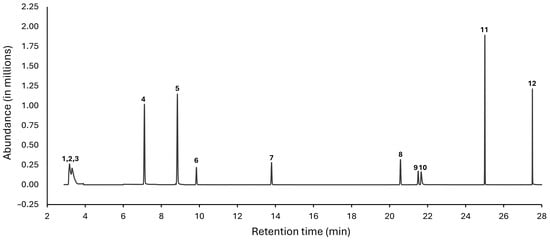
Figure 4.
Representative SIM chromatogram of the studied analytes. The chromatogram was acquired in SIM mode using the GC-MS method described in Section 2. Peak identification: 1 = ethyl acetate; 2 = 1,1-diethoxyethane; 3 = methanol; 4 = 1-propanol; 5 = isobutanol; 6 = isoamyl acetate; 7 = ethyl hexanoate; 8 = ethyl octanoate; 9 = furfural; 10 = acetic acid; 11 = methyl decanoate (internal standard); 12 = 2-phenylethanol.
The accuracy and intraday precision of the GC-MS method was excellent, as shown by the recovery and RSD values (Table 2), except for methanol.
Table 2.
Accuracy and intraday precision of the GC-MS method.
Bar graphs of the GC-MS-determined congener concentrations are shown in Figure 5. As observed with similar plots of the NMR data (Figure 3), there were significant differences in the congener concentrations in the two distillation runs. While the GC-MS-determined congener concentrations were different than those determined from NMR (see below), the overall shapes and trends of the bar graphs for phenylethanol, isobutanol, furfural, methanol, and acetic acid, including the unexpected behaviors of methanol and acetic acid, were similar to those observed with the NMR data (Figure 3). The plot for 1,1-diethoxyethane (diethyl acetyl), an important flavor compound in whiskies [26], was expected, given its boiling point, with the congener found in fractions 1–8. The plots for isoamyl acetate, ethyl hexanoate, and ethyl octanoate, with these congeners found only in the early fractions, were unexpected based on their boiling point range of 140–210 °C (Figure 5). However, Esteban-Decloux et al. reported that some congeners at low concentrations, such as esters, exhibit increased volatilities (solubilities in the vapor) in high levels of ethanol [27]. The observed behavior in our data with these esters is consistent with previous reports [28] and explains how these important flavor compounds appear in the distillate cuts. In fact, the profiles shown in Figure 5 for isobutanol, furfural, ethyl octanoate, acetic acid, phenylethanol, and isoamyl acetate match those shown for the concentration versus %ABV from 80 to 10% collected from the distillation of wine at the 600 L and 2500 L scale [29]. Diethoxyethane, ethyl hexanoate, and methanol profiles were not reported [29].
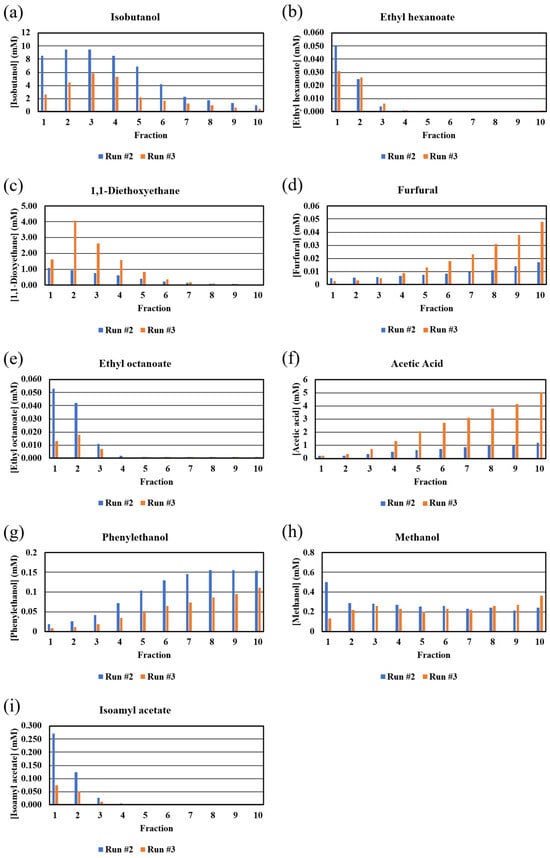
Figure 5.
GC-MS-derived congener concentrations (mM) in fractions from Run #2 and Run #3. Congeners: (a) isobutanol, (b) ethyl hexanoate, (c) 1,1-diethoxyethane, (d) furfural, (e) ethyl octanoate, (f) acetic acid, (g) phenylethanol, (h) methanol, (i) isoamyl acetate.
Comparison of congener concentrations as determined from NMR and GC-MS. An additional goal of our study was to compare congener concentrations as determined by NMR and GC-MS. Initially, we were concerned that the use of deuterated solvents in the NMR sample preparation might lower the solubilities of some of the congeners [30] and that the solvent suppression technique, which is required to use NMR for whiskey analyses, might suppress other signals close to the signals for water and ethanol [31]. Both of these issues would lead to lower concentrations of affected congeners after analyses. We were also concerned that vaporization of congeners in GC-MS might be affected by the presence of so many other species [32]. This issue would likely lead to lower concentrations of congeners after analyses. Our ability to quantitate several congeners by both techniques allowed for us to probe these issues.
Generally, the trends in congener concentrations as a function of fractions are similar for both techniques (Figure 6). Both techniques yielded similar concentrations of ethyl acetate (both runs), phenylethanol (run #3), furfural (run #3), and acetic acid (run #3) (Figure 6). The concentrations of methanol, as determined by the two techniques, are different, in the early fractions, in which the ethanol concentration is high (Figure 6). The concentrations of methanol, as determined by NMR, are affected by overlapping peaks (Figure 2) and by peak position being affected by the concentration of ethanol (see above). In addition, the peak for methanol in the GC-MS is often difficult to quantitate, given how close it is to other peaks (Figure 4). It is not clear why the concentrations of acetic acid and furfural in Run #3, as determined by GC-MS, are so different than the concentrations as determined by NMR; however, in our studies, the 20–50 M concentration range is very close to the detection limits for NMR in the case of furfural. Similarly, it is not clear why there is a difference in the NMR and GC-MS concentrations for phenylethanol in the later fractions. The concentrations of isobutanol, as determined by NMR and GC-MS, are very different in early fractions (Figure 6). In the case of NMR, all three sets of peaks for isobutanol overlap with other peaks, but the peaks at 1.7 ppm are almost completely removed from overlapping peaks to allow for confident quantitation. Nonetheless, we cannot rule out the possibility that there is some error in quantitating isobutanol with NMR.
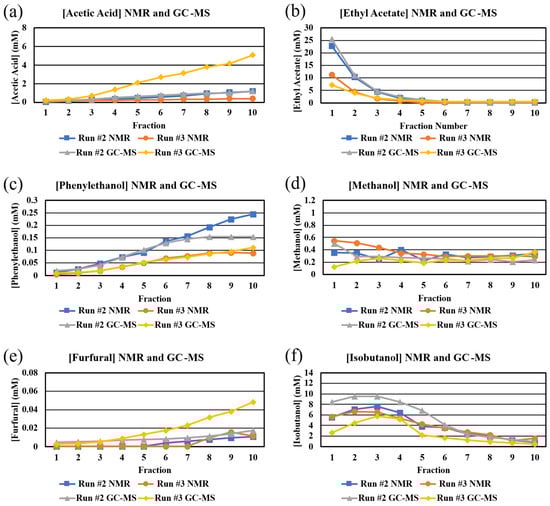
Figure 6.
Comparison of NMR- and GC-MS-determined congener concentrations (mM) in each fraction from Run #2 and Run #3. Congeners: (a) acetic acid, (b) ethyl acetate, (c) phenylethanol, (d) methanol, (e) furfural, (f) isobutanol.
The results in these analyses suggest that there are differences when using NMR and GC-MS to determine the concentrations of congeners in distillates. A comparison of NMR and GC-MS for the determination of short chain fatty acids also showed the NMR data were about 30% lower than the GC-MS data at the 10 and 25 mg/L levels [25]. A best practice may be to choose one technique, based on which congener(s) is(are) of most interest, and analyze all fractions using just that technique.
Comparison of performance of commercial pot still with other stills. The ability to analyze distillates allows for us to evaluate the performance of a small commercial pot still as compared to other stills. We were able to obtain and analyze commercial samples of white dog (unaged whiskey) produced from a column still and from a combination still. To prepare a white dog sample from our pot still, we combined fractions 3–6 from Runs #1 and #2; Run #3 was excluded due to the suspicion of bacterial contamination. We analyzed the white dog samples from the different stills using NMR spectroscopy (Table 3). The concentrations of 2-methylbutanol, 3-methylbutanol, acetaldehyde, ethyl acetate, isobutanol, and methanol were similar in the white dog samples from the different stills. The concentrations of phenylethanol were similar in samples from the pot still and combination still, and the concentration of phenylethanol was higher in the sample from the Coffey still. The Coffey still and pot still produced white dogs with similar concentrations of acetic acid, while the white dog from the combination still exhibited a lower concentration of acetic acid. The Coffey and combination stills produced samples that had similar concentrations of 1-propanol, while the sample from the pot still exhibited much higher levels of 1-propanol. Many of the differences can be attributed to different mash bills, yeasts, fermentation conditions, and distillation decisions (i.e., when to make cuts). Nonetheless, it is clear that a single run on this 5-gallon pot still yields white dog samples similar, in terms of the relative concentrations of these congeners, to those produced on Coffey and combination stills.
Table 3.
Comparison of congener concentrations (mM) in white dog samples produced from different stills.
We were also able to obtain and analyze heads, hearts, and tails fractions from a combination still using NMR (Table 4). Generally, trends observed with our 5-gallon still were consistent with those for the combination still. For example, acetaldehyde and ethyl acetate were high in the heads with rapid decreases in the hearts and tails. Alcohols (1-propanol, 2-methylbutanol, 3-methylbutanol, and isobutanol) were at high levels in both the heads and hearts, with a significant drop off in the tails. Methanol and acetic acid concentrations were similar in all three fractions, and 2-phenylethanol concentrations were low in the heads and hearts and high in the tails. As discussed above, a comparison of the absolute numbers in this table with averages from our pot still should not be done, since the samples from the combination still in Table 4 were prepared using very different mash bills, yeast, fermentation, and distillation conditions.
Table 4.
Congener concentrations (mM) in heads, hearts, and tails from combination still.
4. Conclusions
Profiling distillate fractions from home stills has been compared using two different analytical techniques. This work demonstrates that a small commercial pot still can result in similar separation trends of yeast-derived congeners as column and combination stills. Interestingly, many of the congeners do not separate in the pot still, consistent with their respective pure component boiling points, suggesting more complex intermolecular interactions during the separation process than initially thought. Determination of specific intermolecular or azeotropic interactions which could explain the observed trends is beyond the scope of the current study, but future studies in this area would benefit the general understanding of the primary separations process in the spirits production industry. Of particular interest is the fractions analyzed from the home still as well as those samples from the combination and column stills show that discard of the foreshots does not completely remove methanol. Since we observed similar levels of methanol in the white dog samples from the combination and column still, we believe that these stills also do not remove large levels of methanol. Fortunately, the concentrations of methanol in the samples are very low and do not approach the toxic levels [33]. This work also demonstrates that using specific gravities of the wash and temperature and proof of the distillation cuts does not directly correlate with the concentrations of congeners in those cuts. Sensory analysis, for the congeners that we can sense, will continue to be very important for congeners like acetaldehyde. Finally, our data show that while GC-MS and NMR do reveal similar overall trends in congener concentrations across the distillation fractions, the concentration magnitude as determined from these techniques can vary.
Supplementary Materials
The following supporting information can be downloaded at: https://www.mdpi.com/article/10.3390/separations13010027/s1, Figure S1: Labeled photograph of the 5-gallon Vevor still; Figure S2: Configuration of the home still in our laboratory; Figure S3: Distiller’s beer in Vevor kettle; Figure S4: Plot of %ABV versus fraction number for the three runs using alcohol meter data from Table S1 and data obtained with HPLC for Run #2. The data points for Run #2 (alcohol meter) were made smaller so that the data points for Run #2 (HPLC) could be visualized; Table S1: Fractions from 5-gallon Vevor pot still; Table S2: Quantifier and qualifier ions used in the selected-ion monitoring of the studied analytes by gas chromatography-mass spectrometry (GC-MS); Table S3: Summary of regression data of target analyte; Table S4: Congener concentrations (mM) in different fractions from 5-gallon Vevor still, as determined by 1H NMR. (nd—not detected).
Author Contributions
Conceptualization, M.A.A., N.D.D. and M.W.C.; Methodology, H.A., M.A.A., N.D.D. and M.W.C.; Software, M.A.A.; Validation, J.A.J.; Formal analysis, H.A., M.A.A., J.A.J., N.D.D. and M.W.C.; Investigation, H.A. and M.A.A.; Writing—original draft, M.W.C.; Writing—review & editing, H.A., M.A.A., J.A.J., N.D.D. and M.W.C.; Supervision, N.D.D. and M.W.C.; Project administration, M.W.C.; Funding acquisition, M.W.C. All authors have read and agreed to the published version of the manuscript.
Funding
The authors thank Miami University (Research Graduate Assistantship for one of us, HA) for funding this work.
Data Availability Statement
The original contributions presented in this study are included in the article/Supplementary Material. Further inquiries can be directed to the corresponding authors.
Acknowledgments
The authors thank Clay Smith at Moonshine University for providing the combination still samples that were analyzed in this study.
Conflicts of Interest
The authors declare no conflicts of interest.
References
- Spaho, N. Distillation Techniques in the Fruit Spirits Production. In Distillation—Innovative Applications and Modeling; Marisa Fernandes, M., Ed.; IntechOpen: London, UK, 2017. [Google Scholar]
- Walker, G.M.; Abbas, C.; Ingledew, W.M.; Pilgrim, C. (Eds.) The Alcohol Textbook, 6th ed.; Lallemand Biofuels & Distilled Spirits: Milwaukee, WI, USA, 2017; p. 592. [Google Scholar]
- Available online: https://www.ttb.gov/regulated-commodities/beverage-alcohol/distilled-spirits/penalties-for-illegal-distilling (accessed on 12 December 2025).
- Available online: https://cei.org/news_releases/federal-court-declares-federal-ban-on-at-home-distilling-unconstitutional/ (accessed on 12 December 2025).
- Bigão, V.L.C.P.; Mangabeira da Silva, J.J.; Anzolini Cassiano, M.H.; Brandão da Costa, B.R.; Gomes, N.C.; Marinho, P.A.; Pinke Rodrigues, C.H.; Aguilar, G.J.; Bruni, A.T.; Tapia-Blácido, D.R.; et al. Uncovering the Counterfeit: A study of whiskey authenticity through volatile organic compound fingerprinting, aroma and color sensory analysis. Food Chem. 2024, 447, 139023. [Google Scholar] [CrossRef]
- Xu, R.; Chen, L.; Zhang, H.; Crowder, M.W.; Zhu, J. Characterizing bourbon whiskey via the combination of LC-MS and GC-MS based molecular fingerprinting. Food Chem. 2023, 423, 136311. [Google Scholar] [CrossRef]
- Ashmore, P.L.; DuBois, A.; Tomasino, E.; Harbertson, J.F.; Collins, T.S. Impact of Dilution on Whisky Aroma: A Sensory and Volatile Composition Analysis. Foods 2023, 12, 1276. [Google Scholar] [CrossRef] [PubMed]
- Wiśniewska, P.; Dymerski, T.; Wardencki, W.; Namieśnik, J. Chemical composition analysis and authentication of whisky. J. Sci. Food Agric. 2015, 95, 2159–2166. [Google Scholar] [CrossRef] [PubMed]
- Arrelli, P.; Biancolillo, A. Flavour fingerprint for the differentiation of Grappa from other Italian distillates by GC-MS and chemometrics. Food Control 2019, 105, 123–130. [Google Scholar] [CrossRef]
- Zhang, H.; Eric, C.; Johnson, E.C.; Carroll, A.; Pryor, C.; Howe, K.; Kramer, R.; Rajesh, N.; Meyer, E.; Shurina, B.; et al. Profling bourbons based on congener concentrations. J. Food Comp. Anal. 2023, 115, 105019. [Google Scholar] [CrossRef]
- Kew, W.; Bell, N.G.A.; Goodall, I.; Uhrin, D. Advanced solvent signal suppression for the acquisition of 1D and 2D NMR spectra of Scotch Whisky. Magn. Reson. Chem. 2017, 55, 785–796. [Google Scholar] [CrossRef]
- Kew, W.; Goodall, I.; Uhrín, D. Analysis of scotch whisky by 1H NMR and chemometrics yields insights into its complex chemistry. Food Chem. 2019, 298, 125052. [Google Scholar] [CrossRef]
- Stockwell, M.; Goodall, I.; Uhrín, D. Quantification of whisky congeners by 1H NMR spectroscopy. Anal. Sci. Adv. 2020, 1, 132–140. [Google Scholar] [CrossRef]
- Rusu (Coldea), T.D.; Socaciu, C.; Parau, C.; Mocan, A.A.; Rusu, T.E. Quality and Safety Analysis for some Traditional Homemade Fruit Distillates from Transylvania (North West Romania). Bull. UASVM Agric. 2010, 67, 395–403. [Google Scholar] [CrossRef]
- Muntean, N.; Frentiu, T.; Rakos, G.; Covacit, E. The influence of the distillation process on the content of metals in home- and industrially-brewed alcoholic beverages—Risk assessment to human health. Stud. Ubb Chem. 2022, 67, 215–234. [Google Scholar] [CrossRef]
- Postaru, M.; Tucaliuc, A.; Cascaval, D.; Galaction, A.-I. Cellular Stress Impact on Yeast Activity in Biotechnological Processes—A Short Overview. Microorganisms 2023, 11, 2522. [Google Scholar] [CrossRef] [PubMed]
- Apostolopoulou, A.A.; Flouros, A.I.; Demertzis, P.G.; Akrida-Demertzi, K. Differences in concentration of principal volatile constituents in traditional Greek distillates. Food Control 2005, 16, 157–164. [Google Scholar] [CrossRef]
- Plutowska, B.; Biernacka, P.; Wardencki, W. Identification of volatile compounds in raw spirits of different organoleptic quality. J. Inst. Brew. 2010, 116, 433–439. [Google Scholar] [CrossRef]
- van Beek, S.; Priest, F.G. Evolution of the Lactic Acid Bacterial Community during Malt Whisky Fermentation: A Polyphasic Study. Environ. Microbiol. 2002, 68, 297–305. [Google Scholar] [CrossRef]
- Hernandez-Gomez, L.F.; Ubeda, J.; Briones, A. Melon fruit distillates: Comparison of different distillation methods. Food Chem. 2003, 82, 539–543. [Google Scholar] [CrossRef]
- Vaikikauskyte, I.; Poskus, V.; Nekrosius, V.; Vickackaite, V.; Kareiva, A. Home-made cider brandy (Calvados): Analysis of distillation fractions by gas chromatography-mass spectrometry method. Chemija 2021, 32, 83–91. [Google Scholar]
- Available online: https://en.wikipedia.org/wiki/Azeotrope_tables (accessed on 14 December 2025).
- Available online: https://homedistiller.org/wiki/index.php/Using_a_Pot_Still#:~:text=Make%20sure%20you%20throw%20away,lots%20as%20it%20comes%20off (accessed on 12 December 2025).
- Wakisaka, A.; Matsuura, K.; Uranaga, M.; Sekimoto, T.; Takahashi, M. Azeotropy of alcohol–water mixtures from the viewpoint of cluster-level structures. J. Mol. Liq. 2011, 160, 103–108. [Google Scholar] [CrossRef]
- Cai, J.; Zhang, J.; Tian, Y.; Zhang, L.; Hatzakis, E.; Krausz, K.W.; Smith, P.B.; Gonzalez, F.J.; Patterson, A.D. Orthogonal Comparison of GC–MS and 1H NMR pectroscopy for Short Chain Fatty Acid Quantitation. Anal. Chem. 2017, 89, 7900–7906. [Google Scholar] [CrossRef]
- Kelly, T.J.; O’Connor, C.; Kilcawley, K.N. Sources of volatile aromatic congeners in whiskey. Beverages 2023, 9, 64. [Google Scholar] [CrossRef]
- Esteban-Decloux, M.; Grangeon, H.; Tano, N.C.R. Behavior of volatile compounds during batch multi-state distillation of whisky: Experimental and simulation data. J. Inst. Brew. 2023, 129, 192–208. [Google Scholar] [CrossRef]
- Martin, A.; Carrillo, F.; Trillo, L.M.; Roselló, A. A quick method for obtaining partition factor of congeners. Eur. Food Res. Tech. 2009, 4, 697–703. [Google Scholar] [CrossRef]
- Douady, A.; Puentes, C.; Awad, P.; Esteban-Declou, M. Batch distillation of spirits: Experimental study and simulation of the behaviour of volatile aroma compounds. J. Inst. Brew. 2019, 125, 268–283. [Google Scholar] [CrossRef]
- Giubertoni, G.; Bonn, M.; Woutersen, S. D2O as an imperfect replacement for H2O: Problem or opportunity for protein research? J. Phys. Chem. B 2023, 127, 8086–8094. [Google Scholar] [CrossRef]
- Bharti, S.K.; Roy, R. Quantitative 1H NMR spectroscopy. TrAC Trends Analyt. Chem. 2012, 35, 5–26. [Google Scholar] [CrossRef]
- Saka, K.; Kudo, K.; Hayashida, M.; Kurisaki, E.; Niitsu, H.; Terada, M.; Yamaguchi, K.; Yoshida, K. Relationship between the matrix effect and the physiochemical properties of analytes in gas chromatography. Anal. Bioanal. Chem. 2013, 405, 9879–9888. [Google Scholar] [CrossRef]
- Available online: https://www.ncbi.nlm.nih.gov/books/NBK482121/ (accessed on 14 December 2025).


Disclaimer/Publisher’s Note: The statements, opinions and data contained in all publications are solely those of the individual author(s) and contributor(s) and not of MDPI and/or the editor(s). MDPI and/or the editor(s) disclaim responsibility for any injury to people or property resulting from any ideas, methods, instructions or products referred to in the content. |
© 2026 by the authors. Licensee MDPI, Basel, Switzerland. This article is an open access article distributed under the terms and conditions of the Creative Commons Attribution (CC BY) license.