


Abstract
The evaluation of sweet spots for infill wells is critical to identifying premium reservoir zones, avoiding fracture hits, and achieving safe, efficient development with maximum production potential. Firstly, considering that geological and engineering factors—such as high fracability and good reservoir quality—are conducive to the formation of complex fracture networks and sufficient gas production after fracturing, quantitative evaluation indicators for fracability and geological properties have been established. Secondly, a classification method for different sweet spot tiers in infill wells was proposed. Lastly, taking the Changning infill pilot wells as an example, for sections not affected by fracture interference, higher sweet spot evaluation scores show a strong correlation with improved predictive performance of tracer-based gas production forecasts. Conversely, in fracture-interfered zones, a discrepancy was observed between the sweet spot evaluation results and actual gas production volumes. The horizontal wellbores were classified into a six-tier system (L1–L6), with tailored fracturing design recommendations provided accordingly. This study offers scientific guidance for the precise evaluation of sweet spots in infill wells and the design of customized staged fracturing, thereby significantly enhancing fracturing effectiveness.
1. Introduction
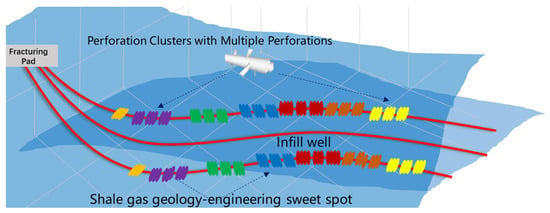
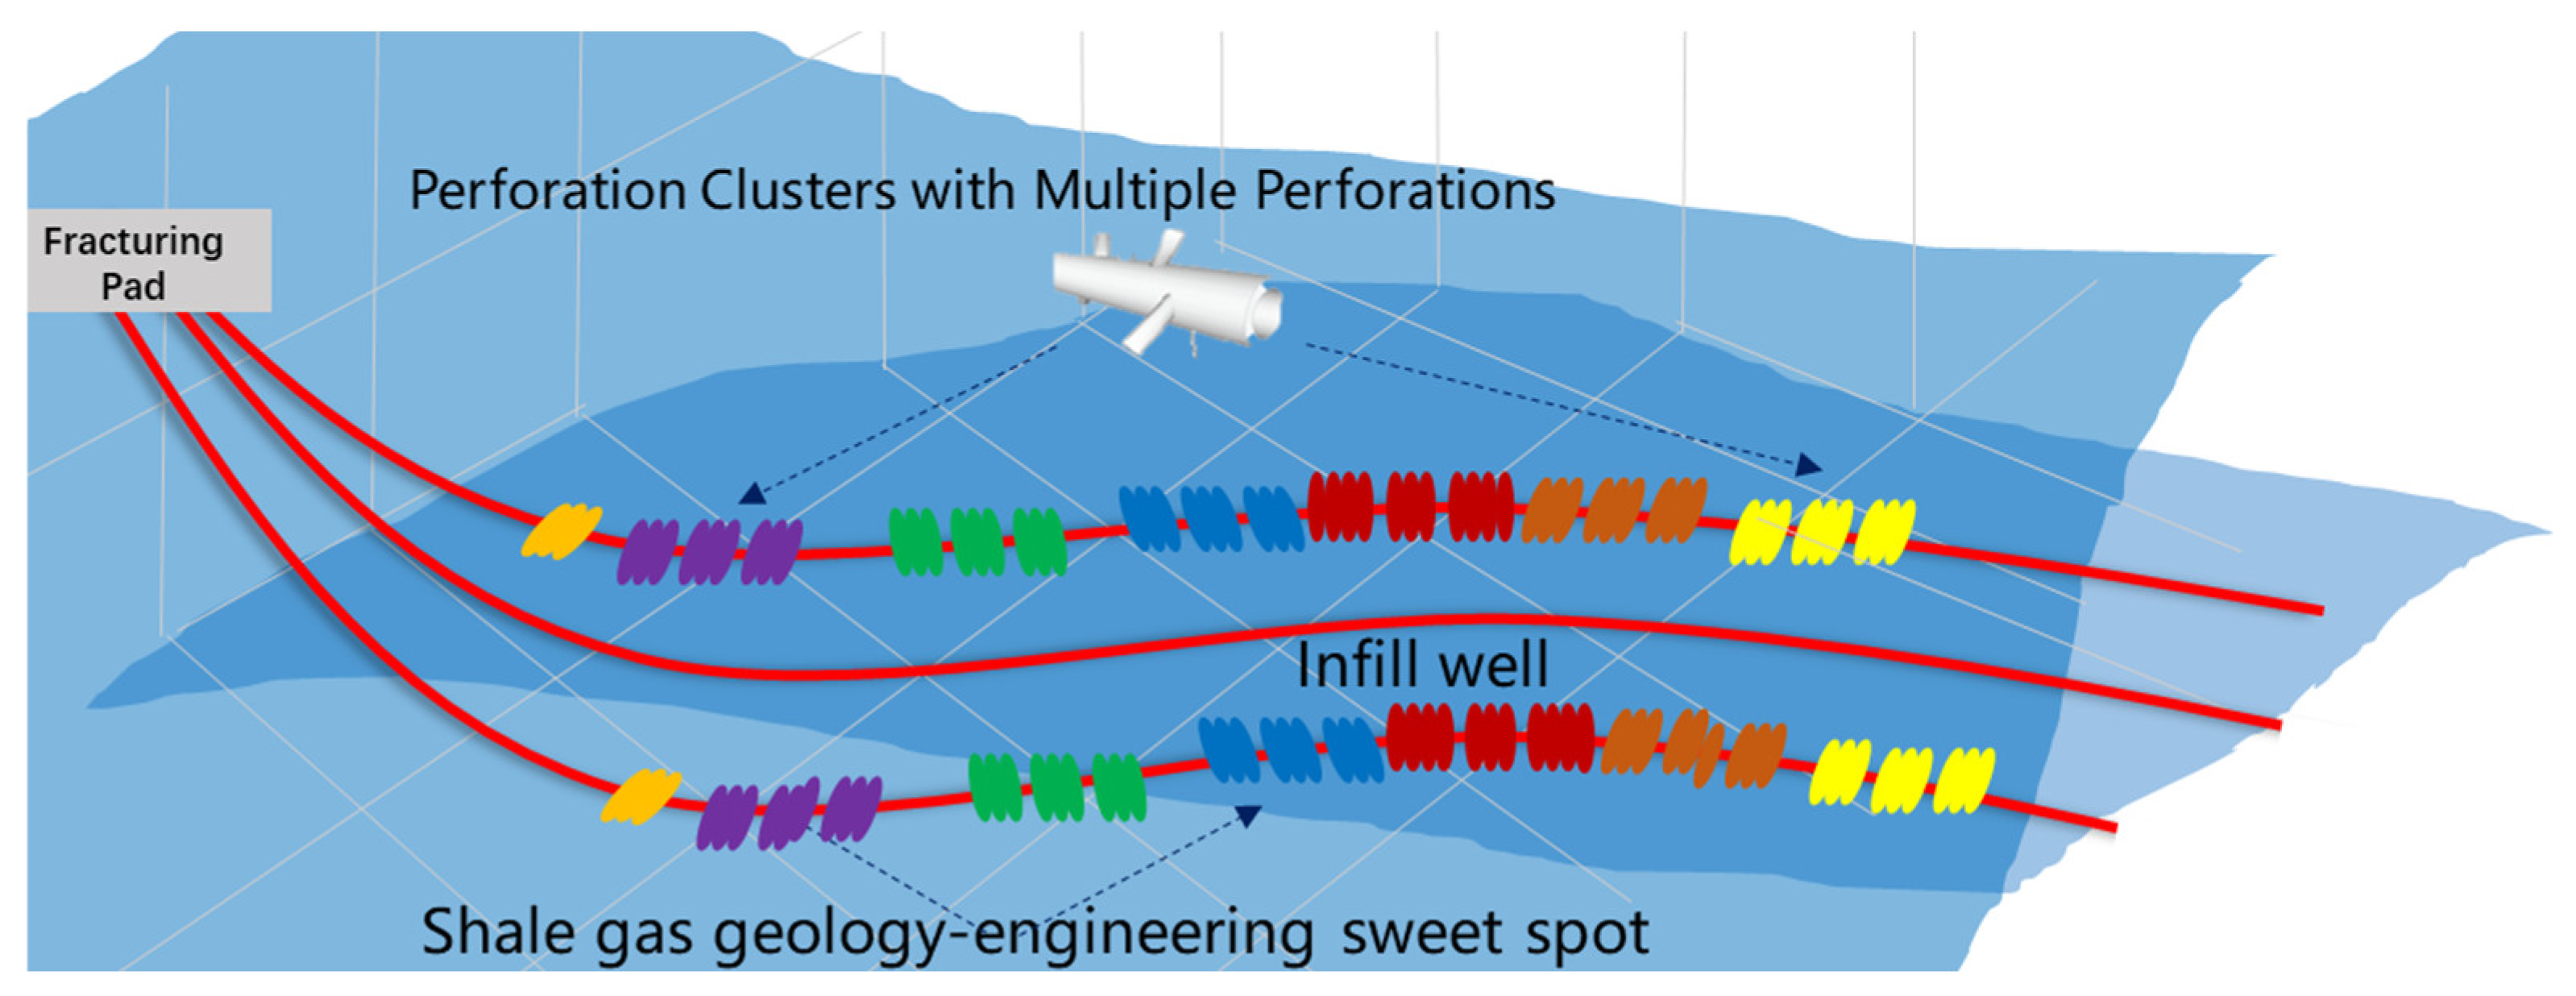
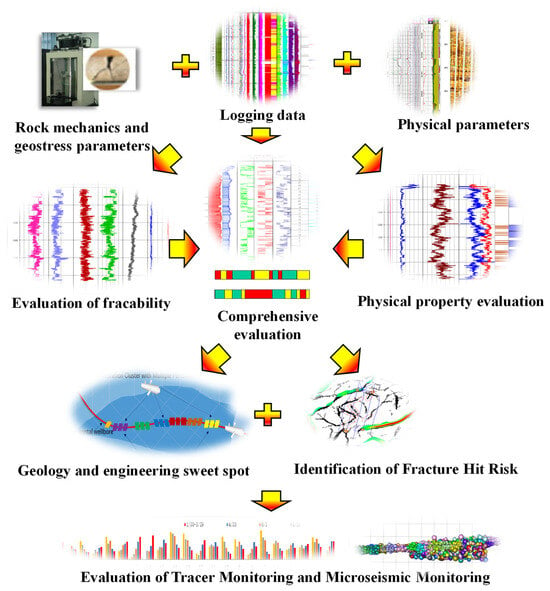
During the long-term production of shale gas wells, output declines year by year, posing a significant challenge to sustaining high and stable production [1,2,3]. To address this, implementing infill wells with fracturing treatments between existing parent wells has become an effective measure to enhance the overall recovery of the block [4,5,6]. Infill wells or child wells refer to wells drilled later between parent wells, aiming to recover remaining reserves and potentially affected by the fracture network of parent wells. This strategy can effectively enhance reservoir drainage efficiency. Nevertheless, well monitoring shows that a considerable number of wells have a large number of non-contributing perforation clusters after fracturing. The production profile along the horizontal section is extremely uneven, and there are problems of low completion efficiency and low production contribution after multi-cluster perforation fracturing [7,8]. Consequently, sweet spot evaluation for infill wells is imperative. By precisely targeting premium reservoir zones, this approach prevents fracture-driven interference while maximizing production potential, constituting a critical step toward safe and efficient resource development (Figure 1).
Figure 1.
Diagram of infill wells with fracturing treatments in shale gas reservoir.
Extensive research has been conducted on the dual sweet spot evaluation for horizontal wells [9,10]. Rickman et al. proposed that predicting fracture potential and obtaining greater SRV is a prerequisite for optimizing well completion segmentation design and suggested screening fracturing sections through mechanical brittleness in unconventional shale gas reservoirs [11]. Jin and Guo et al. considered the non-uniformity of horizontal wellbore stimulation potential and proposed a fracability index model. Based on logging data, the fracability was calculated to optimize the location of the fracturing stage [12,13,14]. Meanwhile, some scholars proposed that, by combining the rock physics and geomechanics analysis of reservoirs, the engineering dessert and optimal completion fracturing section of fractured horizontal wells can be obtained, thereby obtaining the best gas production of horizontal wells [15,16,17]. Lu et al. studied the optimal location for shale oil hydraulic fracturing based on significant differences in reservoir heterogeneity in the Jimusaer Formation in order to minimize its ineffective clusters [18]. Li et al. proposed an effective method for designing perforation cluster positions by combining logging data with precise fiber optic monitoring results, introducing correlation analysis and random forest for principal component analysis. The K-means clustering method was also used to evaluate the reservoir quality. A fracturing sweetness index was proposed to quantitatively measure various fracturing performance [19]. Xia et al. evaluated and identified locations with good rock types and relatively low fracture pressures based on logging for high fracture pressure wells, optimized ideal perforation positions, and selected the correct perforation strategy accordingly [20]. Zeng et al. proposed an integrated fracability evaluation model for shale reservoirs, defining it as the formation capacity for complex fracture networks under stimulation [21]. Li et al. established a validated integrated evaluation system for geological and engineering sweet spots (ESSs/GSSs) in deep coal seams using AHP-TOPSIS methodology, correlating assessment scores with enhanced fracture propagation, stimulated reservoir volume, and gas production—providing actionable criteria for optimized well placement and stimulation design [22].
Although there have been some meaningful studies on dual sweet spot evaluation in the early stage, existing studies predominantly focus on conventional fracturing wells, with comparatively limited research dedicated to sweet spot evaluation specifically for infill wells [23,24,25,26,27]. Current engineering sweet spot evaluations suffer from three critical limitations: inadequate consideration of the influence of net pressure on fracture network generation and fracture complexity in fracability evaluation models; arbitrary assignment of weighting coefficients for geological indicators without rigorous justification; and consequently insufficient attention to fracture-driven interference risks within the sweet spot classification framework for infill wells [28,29,30,31,32,33].
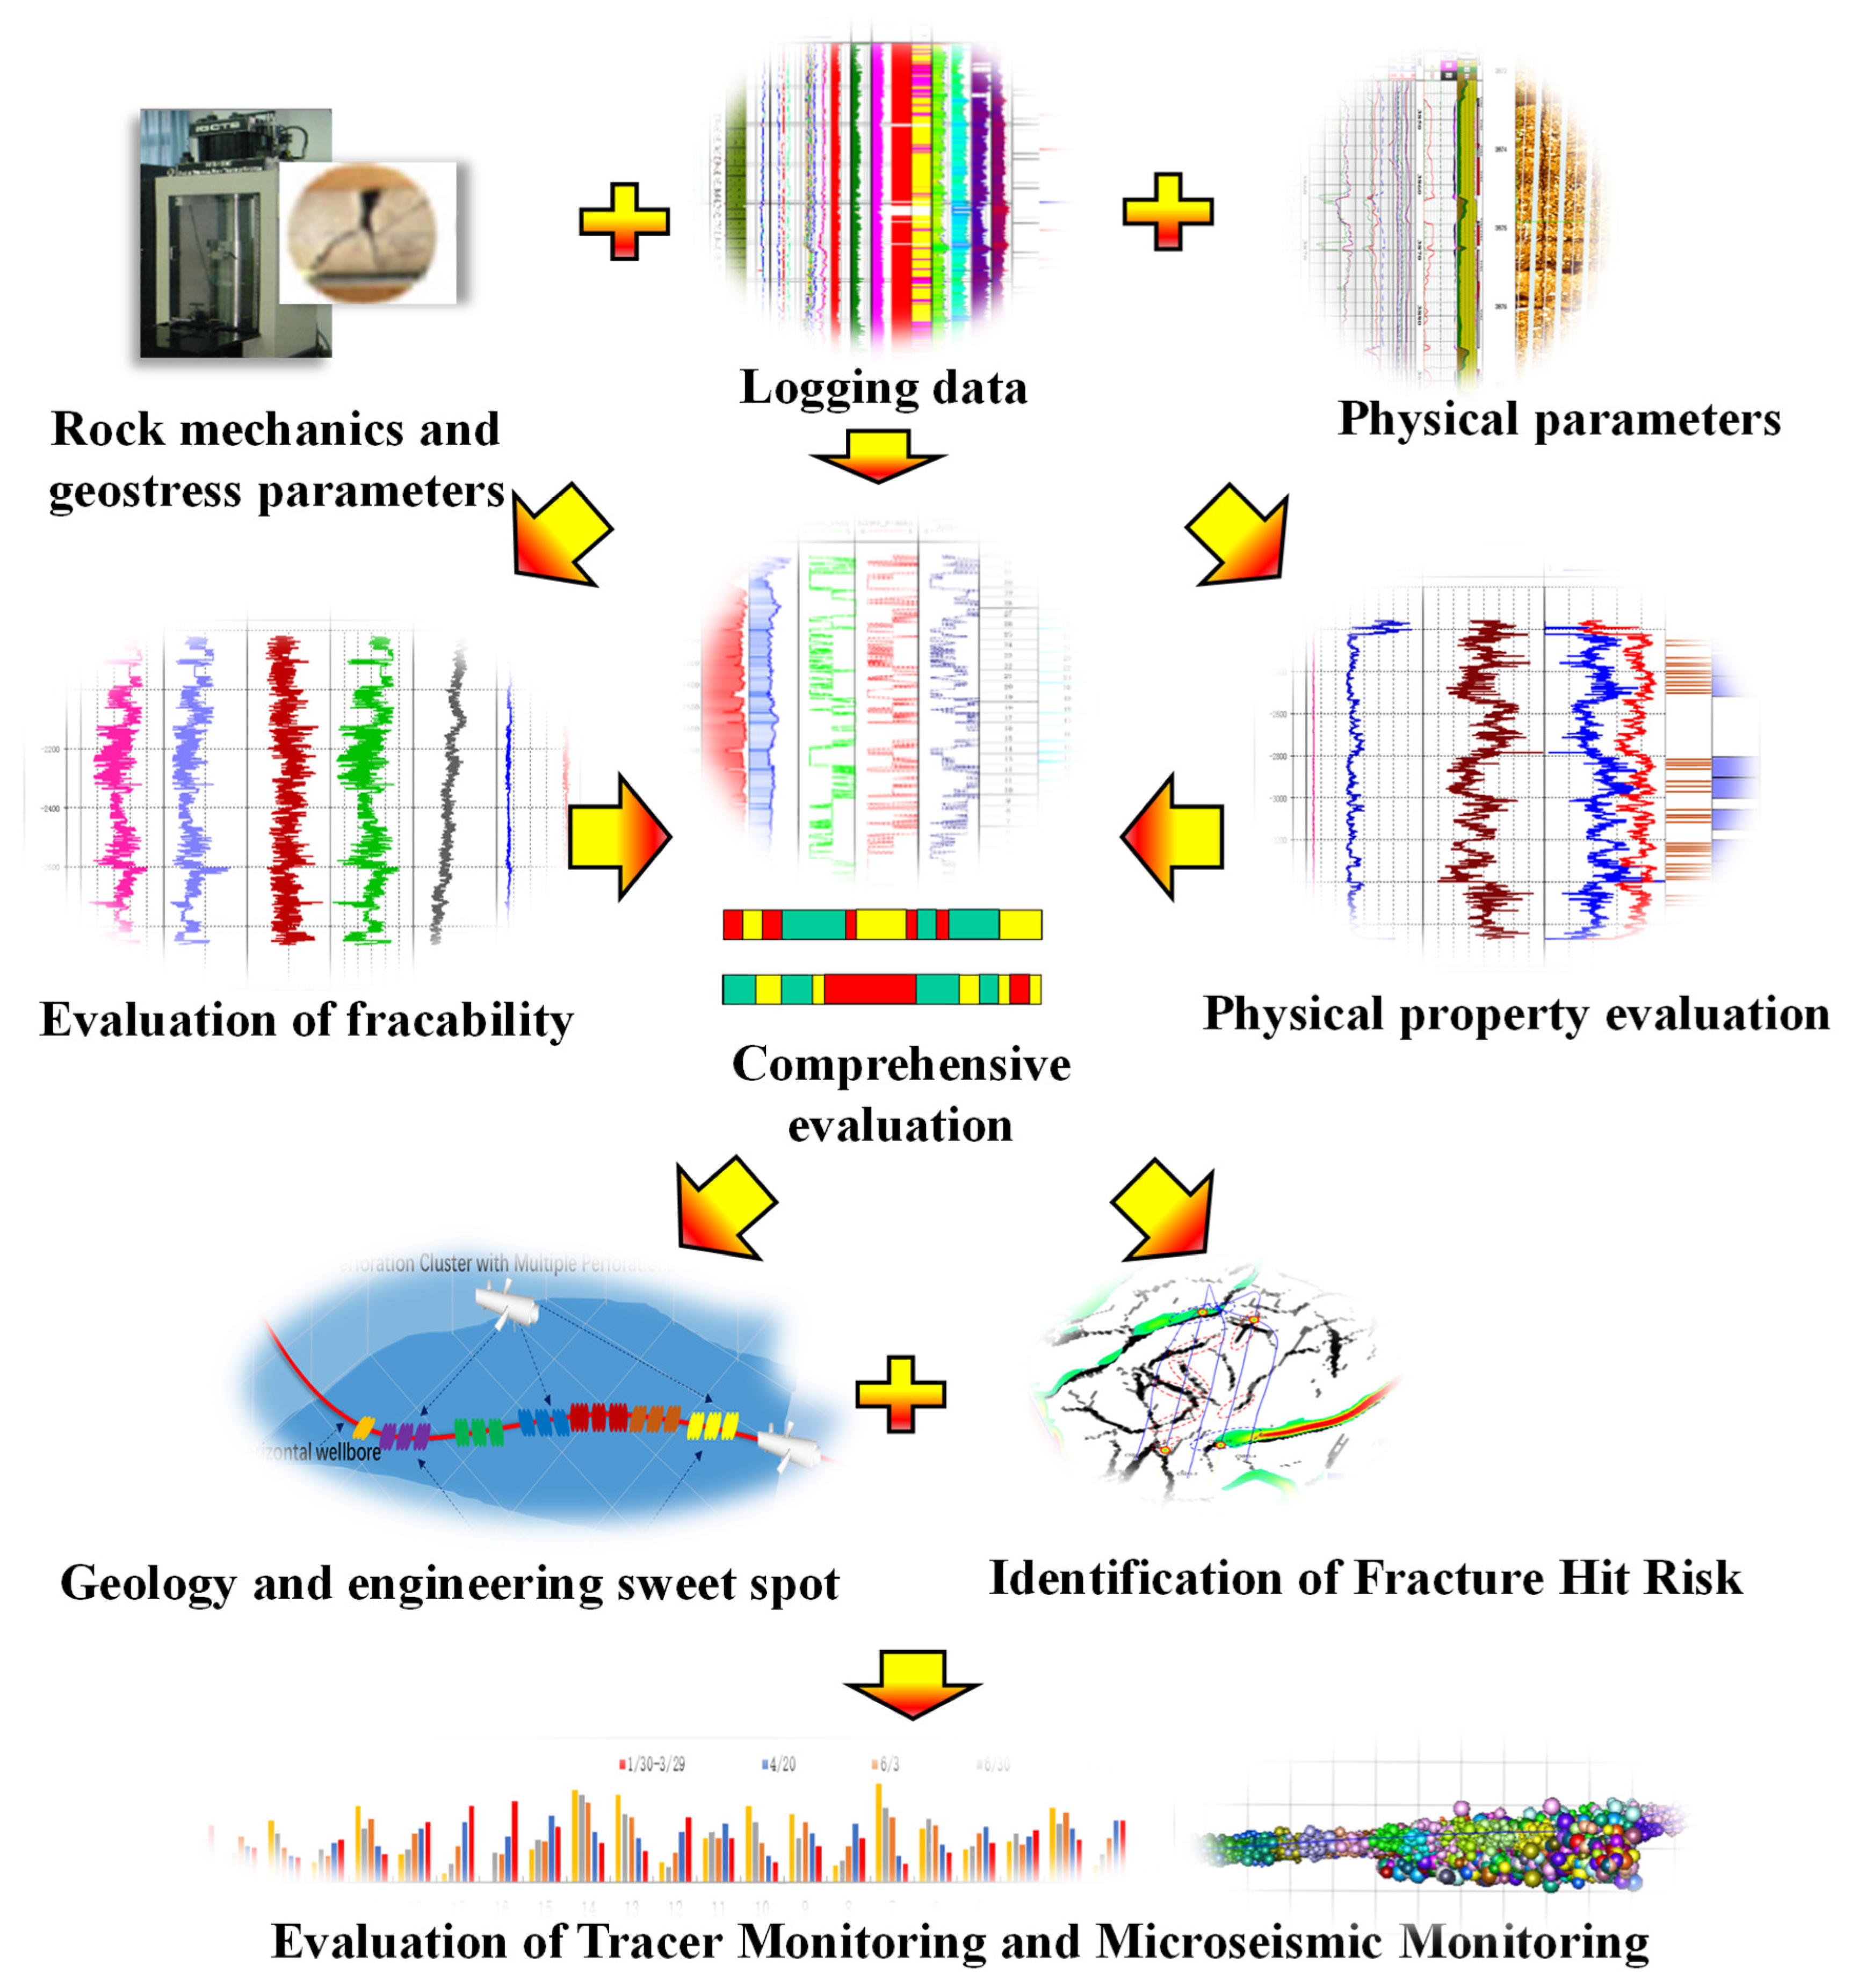
In this paper, firstly, a quantitative evaluation index for fracability based on rock mechanics parameters, net pressure, and brittleness, as well as a continuous profile prediction method for fracability index based on logging parameters, are proposed. Secondly, considering the porosity, permeability, saturation, and TOC of shale gas reservoirs, reservoir quality indicators are established based on logging data. They can quantitatively evaluate the reservoir quality along the horizontal section. Thirdly, an evaluation method for fracturing sweet spots of infill wells is proposed. The evaluation methodology was applied to a single pilot infill well for onsite testing. After conducting a sweet spot evaluation of the infill well’s horizontal section, stage-specific fracturing design recommendations are provided.
2. Methodology
2.1. Engineering Sweet Spot Evaluation Model
The brittleness of rocks refers to the characteristic of rocks that do not undergo significant shape changes until they are broken under external forces, reflecting the lack of significant absorption of mechanical energy in the rock before it is deformed. Brittle rocks are prone to fracture and form complex cracks during hydraulic fracturing, while plastic rocks undergo plastic deformation and are less prone to crack formation. Alternatively, artificial cracks formed during the closure stage may experience the embedding of proppants, reducing the flow capacity of the artificial cracks. The higher the brittleness of rocks, the greater the probability of the formation of complex fracture networks in reservoirs [24,25,26,27,28,29]. Rickman [11] proposed the concept of brittle characteristic parameters, where the mechanical brittleness index (B1) can be expressed as:
where
where νi is the static Poisson’s ratio of each point in the horizontal segment, νmax and νmin are the maximum and minimum values; Ei is static Young’s modulus at each point in the horizontal segment, Emax and Emin are the maximum and minimum values.
The mineral composition of reservoir rocks, such as the relative content between siliceous and calcareous minerals and clay, has a significant impact on the brittleness of reservoir rocks. Considering the combined effects of mechanical properties and mineral composition on rock brittleness, the total brittleness index can be expressed as [14,31]:
where α and β are the mineral brittleness influence coefficient and mechanical brittleness influence coefficient, respectively.
The internal friction angle of rocks can be calculated by the longitudinal wave velocity, which can be expressed by [31]:
where vp is the longitudinal wave velocity, m/s; φ is the internal friction angle, °.
Fracture toughness refers to the resistance of the rock to the propagation of existing fractures, which is an inherent property of the rock. It also characterizes the singularity strength of linear elastic cracks at the crack tip and is related to the properties of the rock itself, crack size, and stress state. Higher fracture toughness also reflects higher fracture pressure, which is an unfavorable factor in reservoir fracability. After extensive experiments by previous researchers, it was found that Mode-I and Mode-II fracture toughness can be expressed as [14]:
where, KIC and KIIC are the Mode-I and Mode-II toughness, respectively, MPa · m1/2; ρ is the density of the gas shale, g/cm3; Vcl is the shale content of the gas shale, %; DT is the acoustic travel time, us/ft. a1, a2, b1, b2, c1, c2, d1, and d2 are site-specific coefficients and for Longmaxi gas shale, a1 = 0.45, b1 = −0.151, c1 = 0.201, d1 = −0.877; a2 = 2.121, b2 = −0.245, c2 = 1.152, d2 = −8.378.
The smaller the stress difference, the easier it is for multi-cluster fracturing to produce complex fracture networks. Olson’s stress coefficient, defined as the ratio of net treating pressure to horizontal stress difference, characterizes the ability of hydraulic fractures to reorient and connect with natural fractures, which can be expressed as [14]:
where pn is the net pressure in MPa; σH is the maximum horizontal principal stress in MPa; σh is the minimum horizontal principal stress in MPa.
Based on the PKN model, the net treating pressure during multi-cluster fracturing operations can be expressed as [34,35]:
where E is Young’s modulus, MPa; hr is fracture height, m; μ is fracturing fluid viscosity, mPa·s; v is Poisson’s ratio.
Fracability is an important parameter for evaluating the potential of shale gas reservoirs to be effectively fractured in engineering. Considering various influencing factors such as the overall brittleness index, internal friction angle, and fracture toughness of shale gas reservoir rocks, as well as the influence of the stress coefficient, a practical fracability index model can be represented as:
where FRi is the fracability index of each position point in the horizontal well section; φ is the internal friction angle, °; KIC is the Type I fracture toughness, MPa·m1/2; BT is the brittleness index; and a, b are weight coefficients. The values (a = b = 0.5) are adopted from Zeng et al. [21].
The fracability index of each point in the normalized horizontal segment is expressed as:
where FRAC is the fracability index of each point in the dimensionless horizontal well section, the normalized parameter scaled to a range of 0–1. FRmin and FRmax are the minimum and maximum fracability indices of the horizontal well section.
2.2. Geological Sweet Spot Evaluation Model
The evaluation and classification of reservoir quality in shale gas reservoirs play an important role in the arrangement of segmented and clustered positions for multi-cluster fracturing in horizontal wells and cannot be ignored in the production of shale gas after fracturing. With reference to the evaluation methods of geological sweet spots for sandstone reservoirs and unconventional reservoirs, the influences of porosity, permeability, gas saturation, and TOC content are of great significance [30,31]. Therefore, this article characterizes the size of the reservoir space based on the porosity obtained from geological logging. Due to the varying sizes and ranges of reservoir porosity along different horizontal sections of the well, this paper adopts range normalization to normalize and transform the logging interpretation porosity of the horizontal section, eliminating the influence of inconsistent units and orders of magnitude of the original data for each variable. The dimensionless expression for porosity can be expressed as [32]:
where Φi is the porosity of the reservoir at each point within the horizontal section, while Φmin and Φmax represent the minimum and maximum porosity values within the horizontal section, respectively.
The permeability of shale gas reservoirs is also an important parameter for effectively characterizing for evaluating the quality of shale gas reservoirs. By normalizing the range of permeability interpreted by horizontal logging, it can be expressed dimensionlessly as [32]:
where Ki is the permeability of the reservoir at each point within the horizontal section, while Kmin and Kmax represent the minimum and maximum values of permeability within the horizontal section, respectively.
The attachment state of shale gas in reservoir rock pores is different from that of conventional reservoirs, but the gas saturation of a shale gas reservoir is still an important characteristic parameter of shale gas. By normalizing the gas saturation range interpreted by horizontal logging, it can be expressed dimensionlessly as [32]:
where Si is the gas saturation of the shale gas reservoir at each point in the horizontal section, while Simax and Simin represent the maximum and minimum values of gas saturation.
Total organic carbon (TOC) content is a key indicator for identifying geologic sweet spots. Higher TOC content indicates greater potential for both the generation and storage capacity of natural gas in shale. Total organic carbon (TOC) content was estimated from well logs using the ΔlogR method which utilizes the separation between the resistivity and porosity curves in organic-rich shale intervals [36]. The dimensionless TOC content can be expressed as [17]:
where TOCi is the total organic carbon of the shale gas reservoir at each point in the horizontal section, while TOCmax and TOCmin represent the maximum and minimum values of total organic carbon.
The porosity, permeability, gas saturation, and TOC are the most core, commonly used indicators for evaluating the “reservoir capacity” and “gas-bearing property” of shale gas reservoirs and can usually be reliably obtained through conventional logging. By taking into account the differences in the weight of different reservoir types, a reservoir quality index model is established to identify reservoir quality and optimize the “dessert section” of the horizontal section. The geological property index can be expressed as [17]:
where ω1, ω2, ω3, ω4 are the porosity weight, permeability, gas saturation weight, and TOC weight respectively.
In determining the weights of various influencing factors within the geological indicators, the analytic hierarchy process (AHP) method was employed [33]. This method analyzes the interrelationships among the evaluation indicators by decomposing the problem system into a multi-level hierarchical decision structure (encompassing all categories of indicators) and then evaluates the relative importance between these indicators. The procedure involves: first, establishing a hierarchical structural model; second, constructing judgment matrices based on comparative evaluation principles; and finally, calculating the weight of each indicator through matrix operations, including eigenvector methods and consistency checks.
Normalize the column vectors of the analysis matrix [37]:
Calculate the weights for the geological sweet spot indicators [37]:
where represents the normalization process applied to the j-th column vector of the judgment matrix. is the sum of the i-th row of the judgment matrix after normalization by column vectors. vj is the weight value assigned to the j-th evaluation parameter indicator.
Random index (RI) is a fixed value obtained from lookup tables, depending on the matrix order. For n = 4, the standard RI value is 0.882, which may differ slightly among different reference tables [37]. If CR < 0.1, the judgment matrix is deemed consistently acceptable. The formula for consistency index (CI) is [37]:
The consistency ratio (CR) is calculated as [37]:
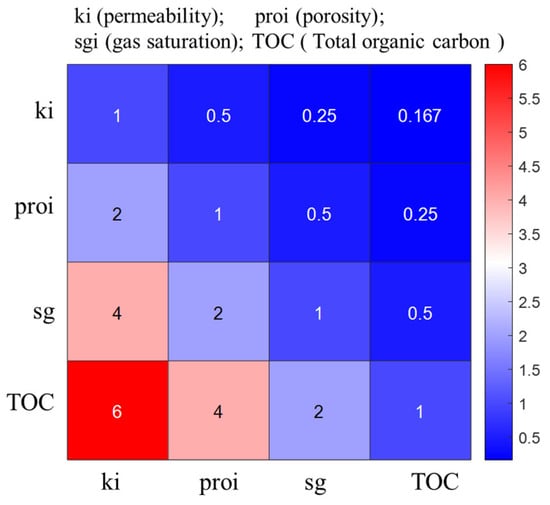
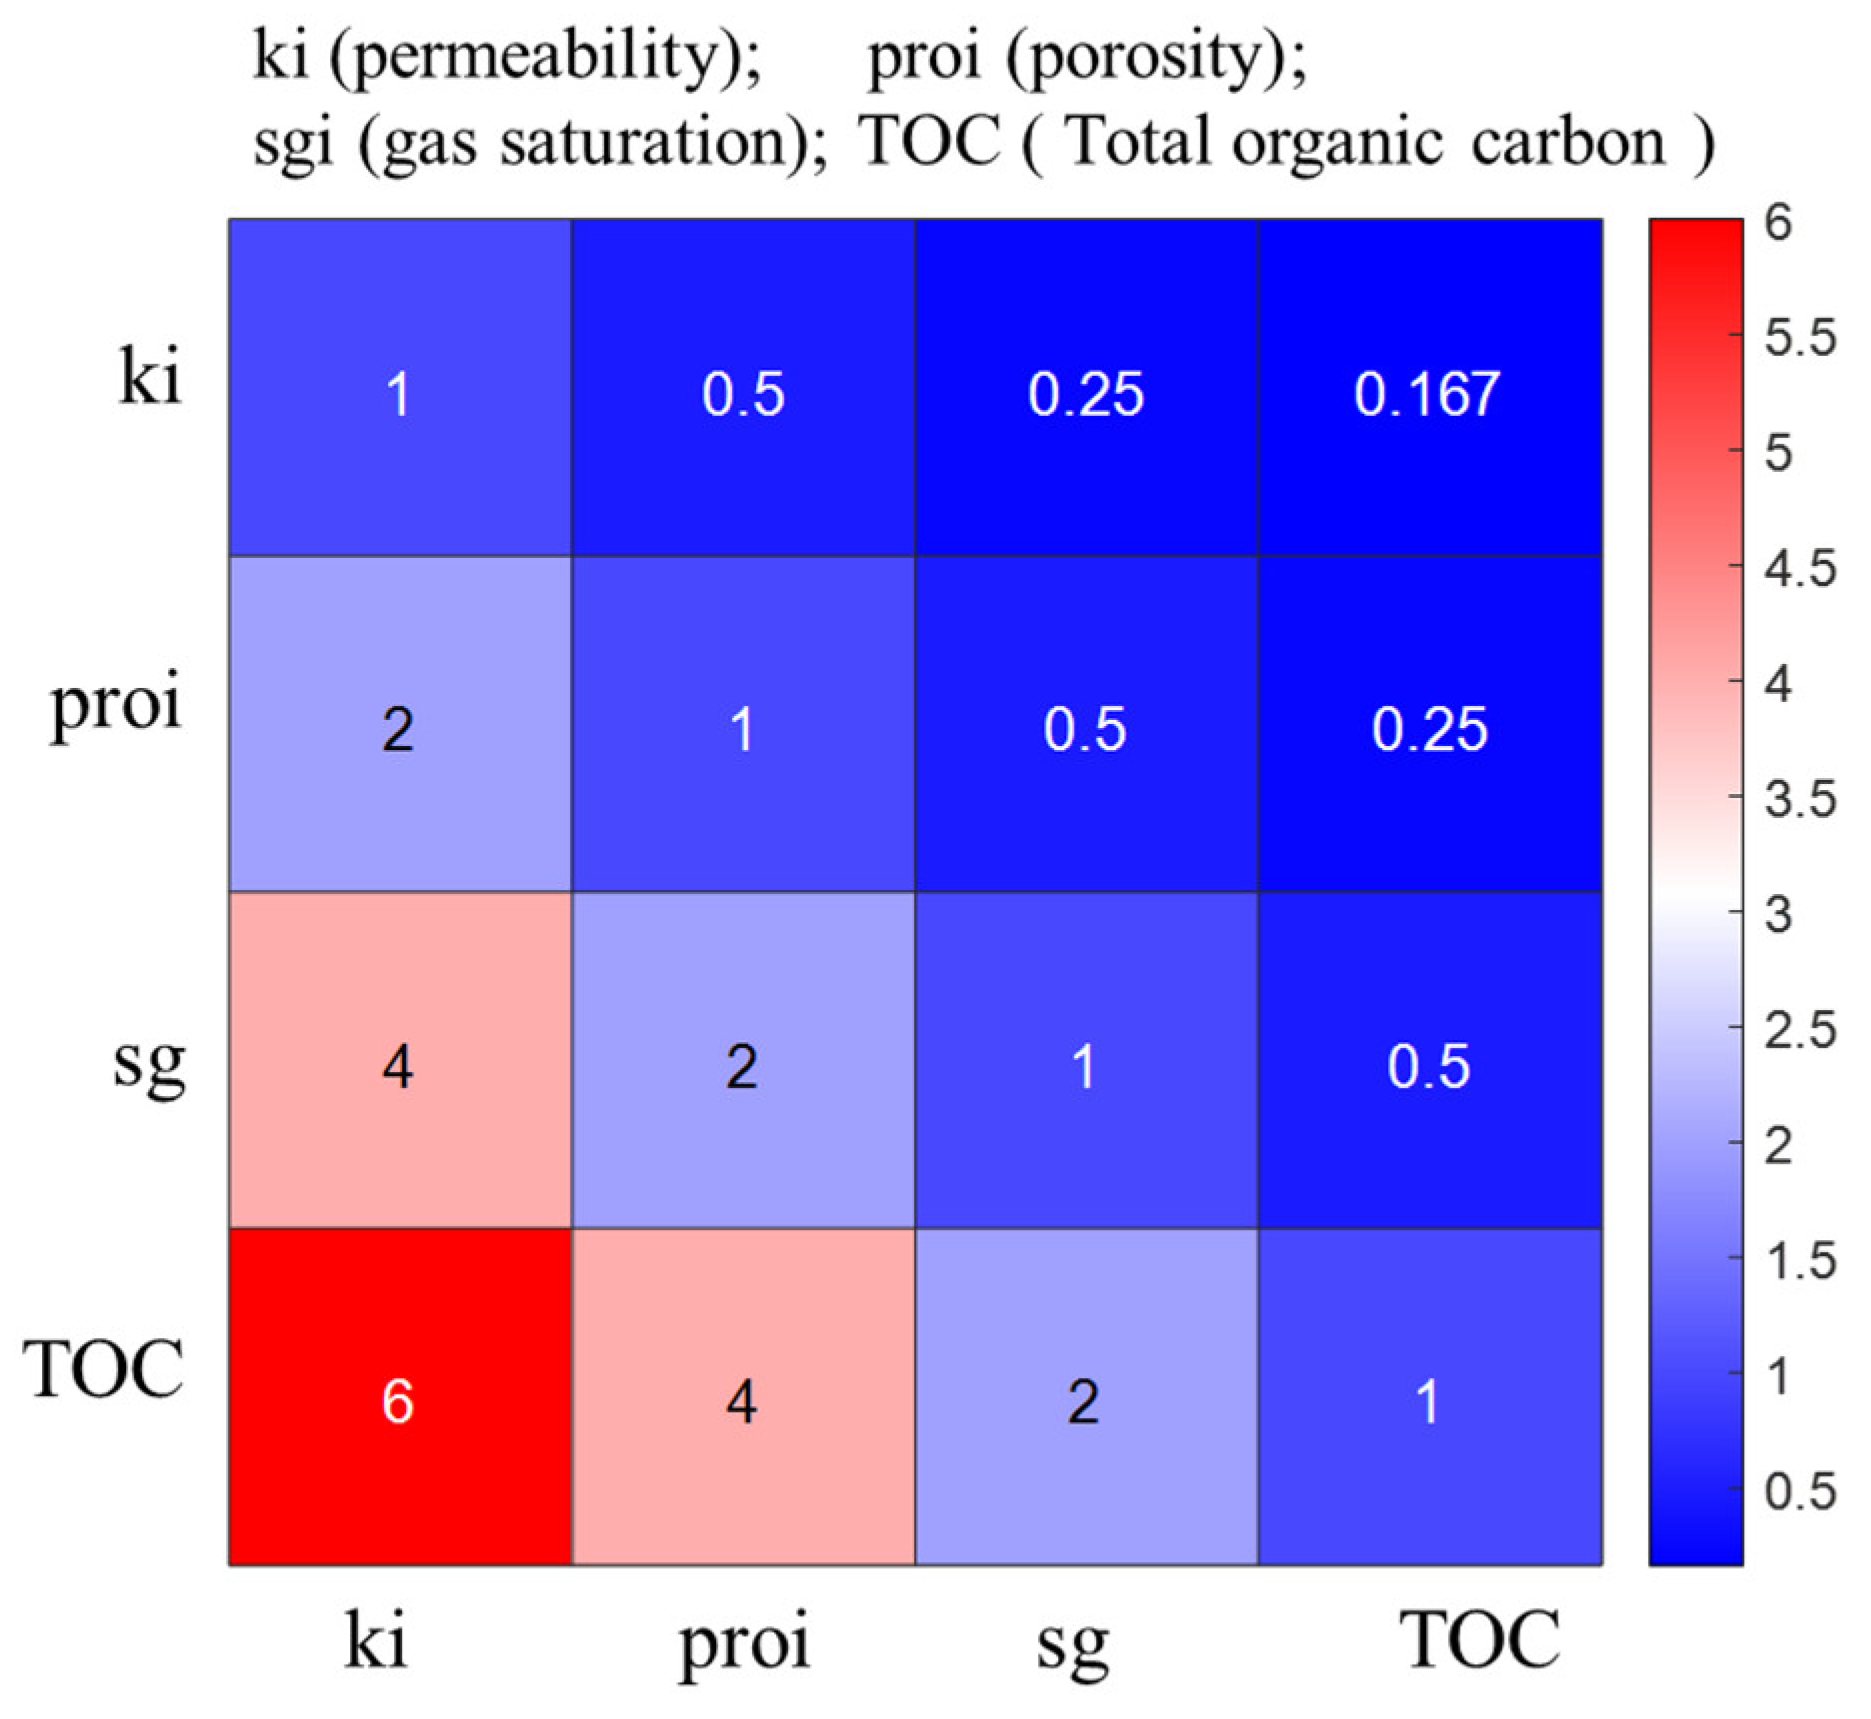
Based on the previously described analytical hierarchy process (AHP), this study determines the corresponding weight values of geological sweet spot indicators. The pairwise comparison matrix (Figure 2) was constructed using Saaty’s 1–9 scale, reflecting the relative importance of each parameter for shale gas reservoir quality. The procedural implementation involves first constructing the judgment and evaluation matrices shown in Figure 2, followed by employing the geometric mean method to derive eigenvectors and calculate each indicator’s weight (Table 1).
Figure 2.
Evaluation matrix for geological sweet spot determination.
Table 1.
AHP weighting results.
The table above presents the constructed judgment matrix and associated weight calculations resulting from the analytical hierarchy process. Computational analysis determined the maximum eigenvalue to be 4.01. The RI value of 0.882 was utilized, yielding a consistency index (CI) of 0.003 and a consistency ratio (CR) of 0.004. This consistency ratio (CR) is substantially below the acceptable limit of 0.1, confirming successful consistency verification. The resultant AHP weight distribution highlights the critical contributions of key parameters: permeability at 7.430%, porosity at 13.774%, gas saturation at 27.547%, and total organic carbon at 51.249%.
Based on the normalization concept, the dimensionless geological property index at each point along the horizontal section can be expressed as [38]:
2.3. Evaluation Method for Fracturing Sweet Spots of Infill Wells
The evaluation of sweet spots in infill horizontal wells is divided into the following three steps. Firstly, the target segment has high fracability, which is conducive to the formation of complex fracture networks after compression. Secondly, the target segment also has good reservoir quality conditions and compressed gas production. Third, there is a risk of fracture interference during infill well stimulation, where fractures from new wells may propagate into existing fractures of offset wells, potentially causing casing deformation and production impairment in legacy wells. This primarily arises from two aspects: high-density natural fractures surrounding infill wells make hydraulic fractures difficult to control. Close lateral or vertical spacing between new and existing wells increases the likelihood of fracture communication. The specific process is shown in Figure 3.
Figure 3.
Optimization design flowchart for horizontal well perforation section.
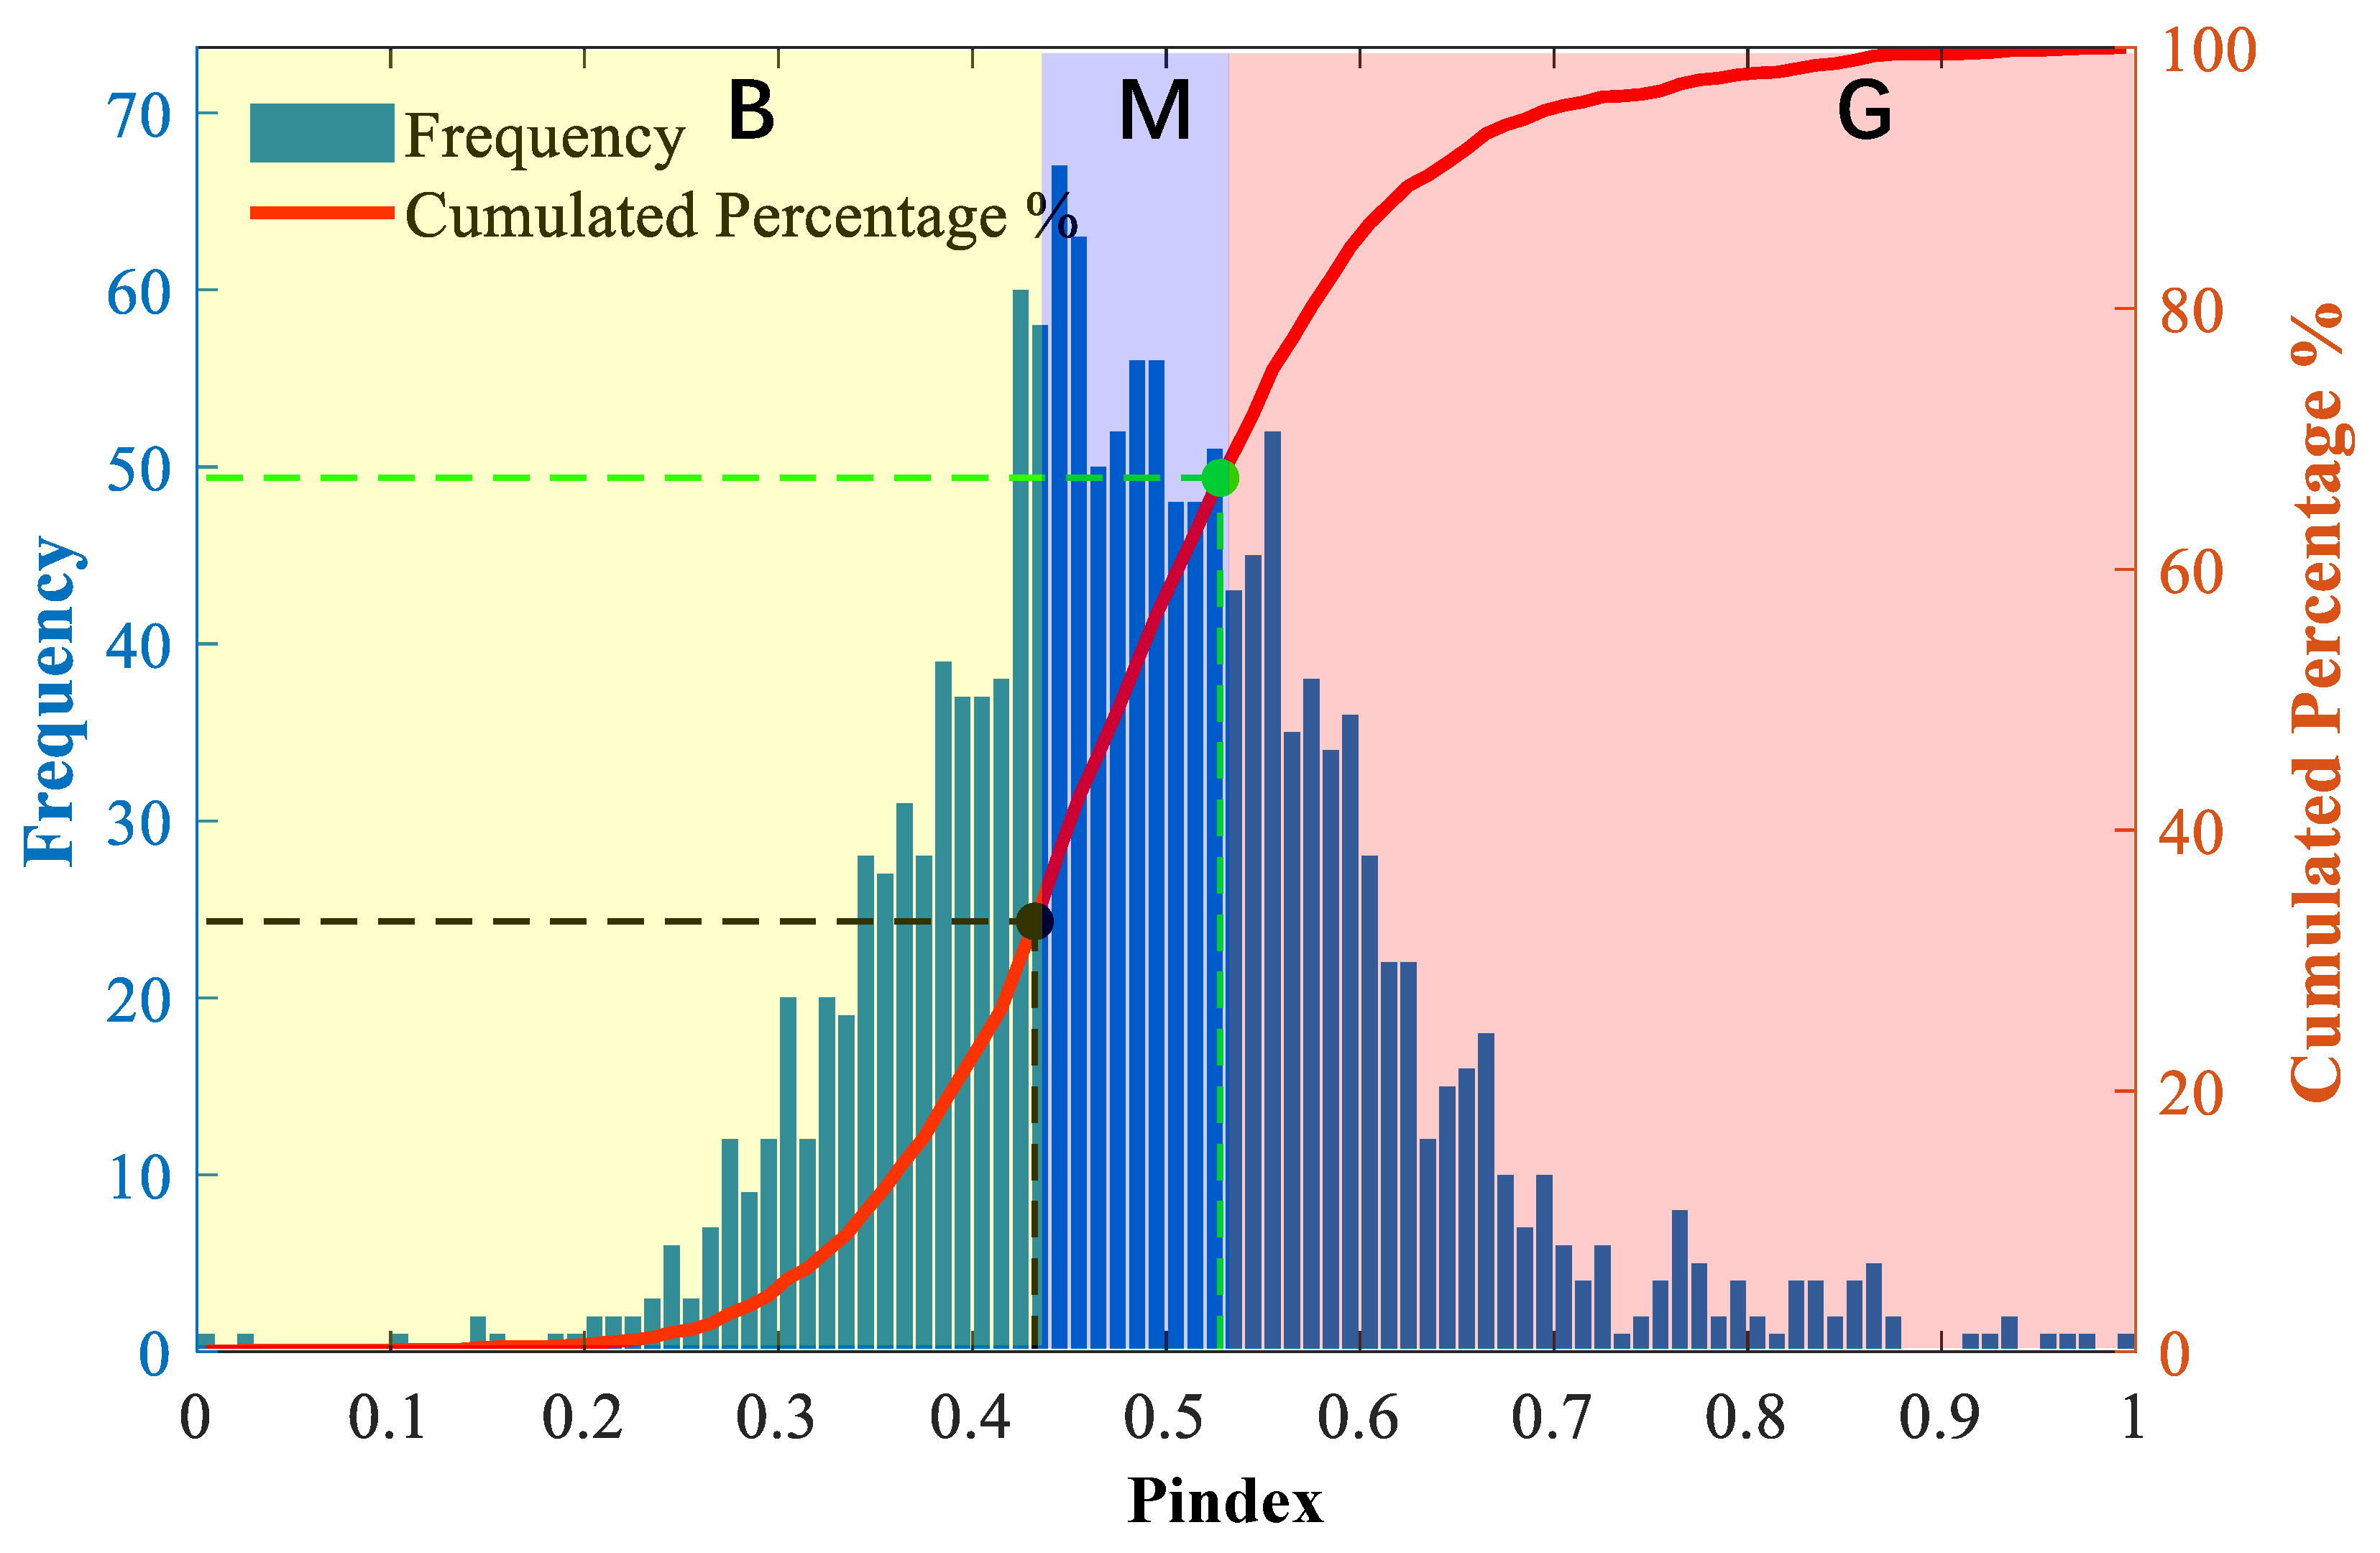
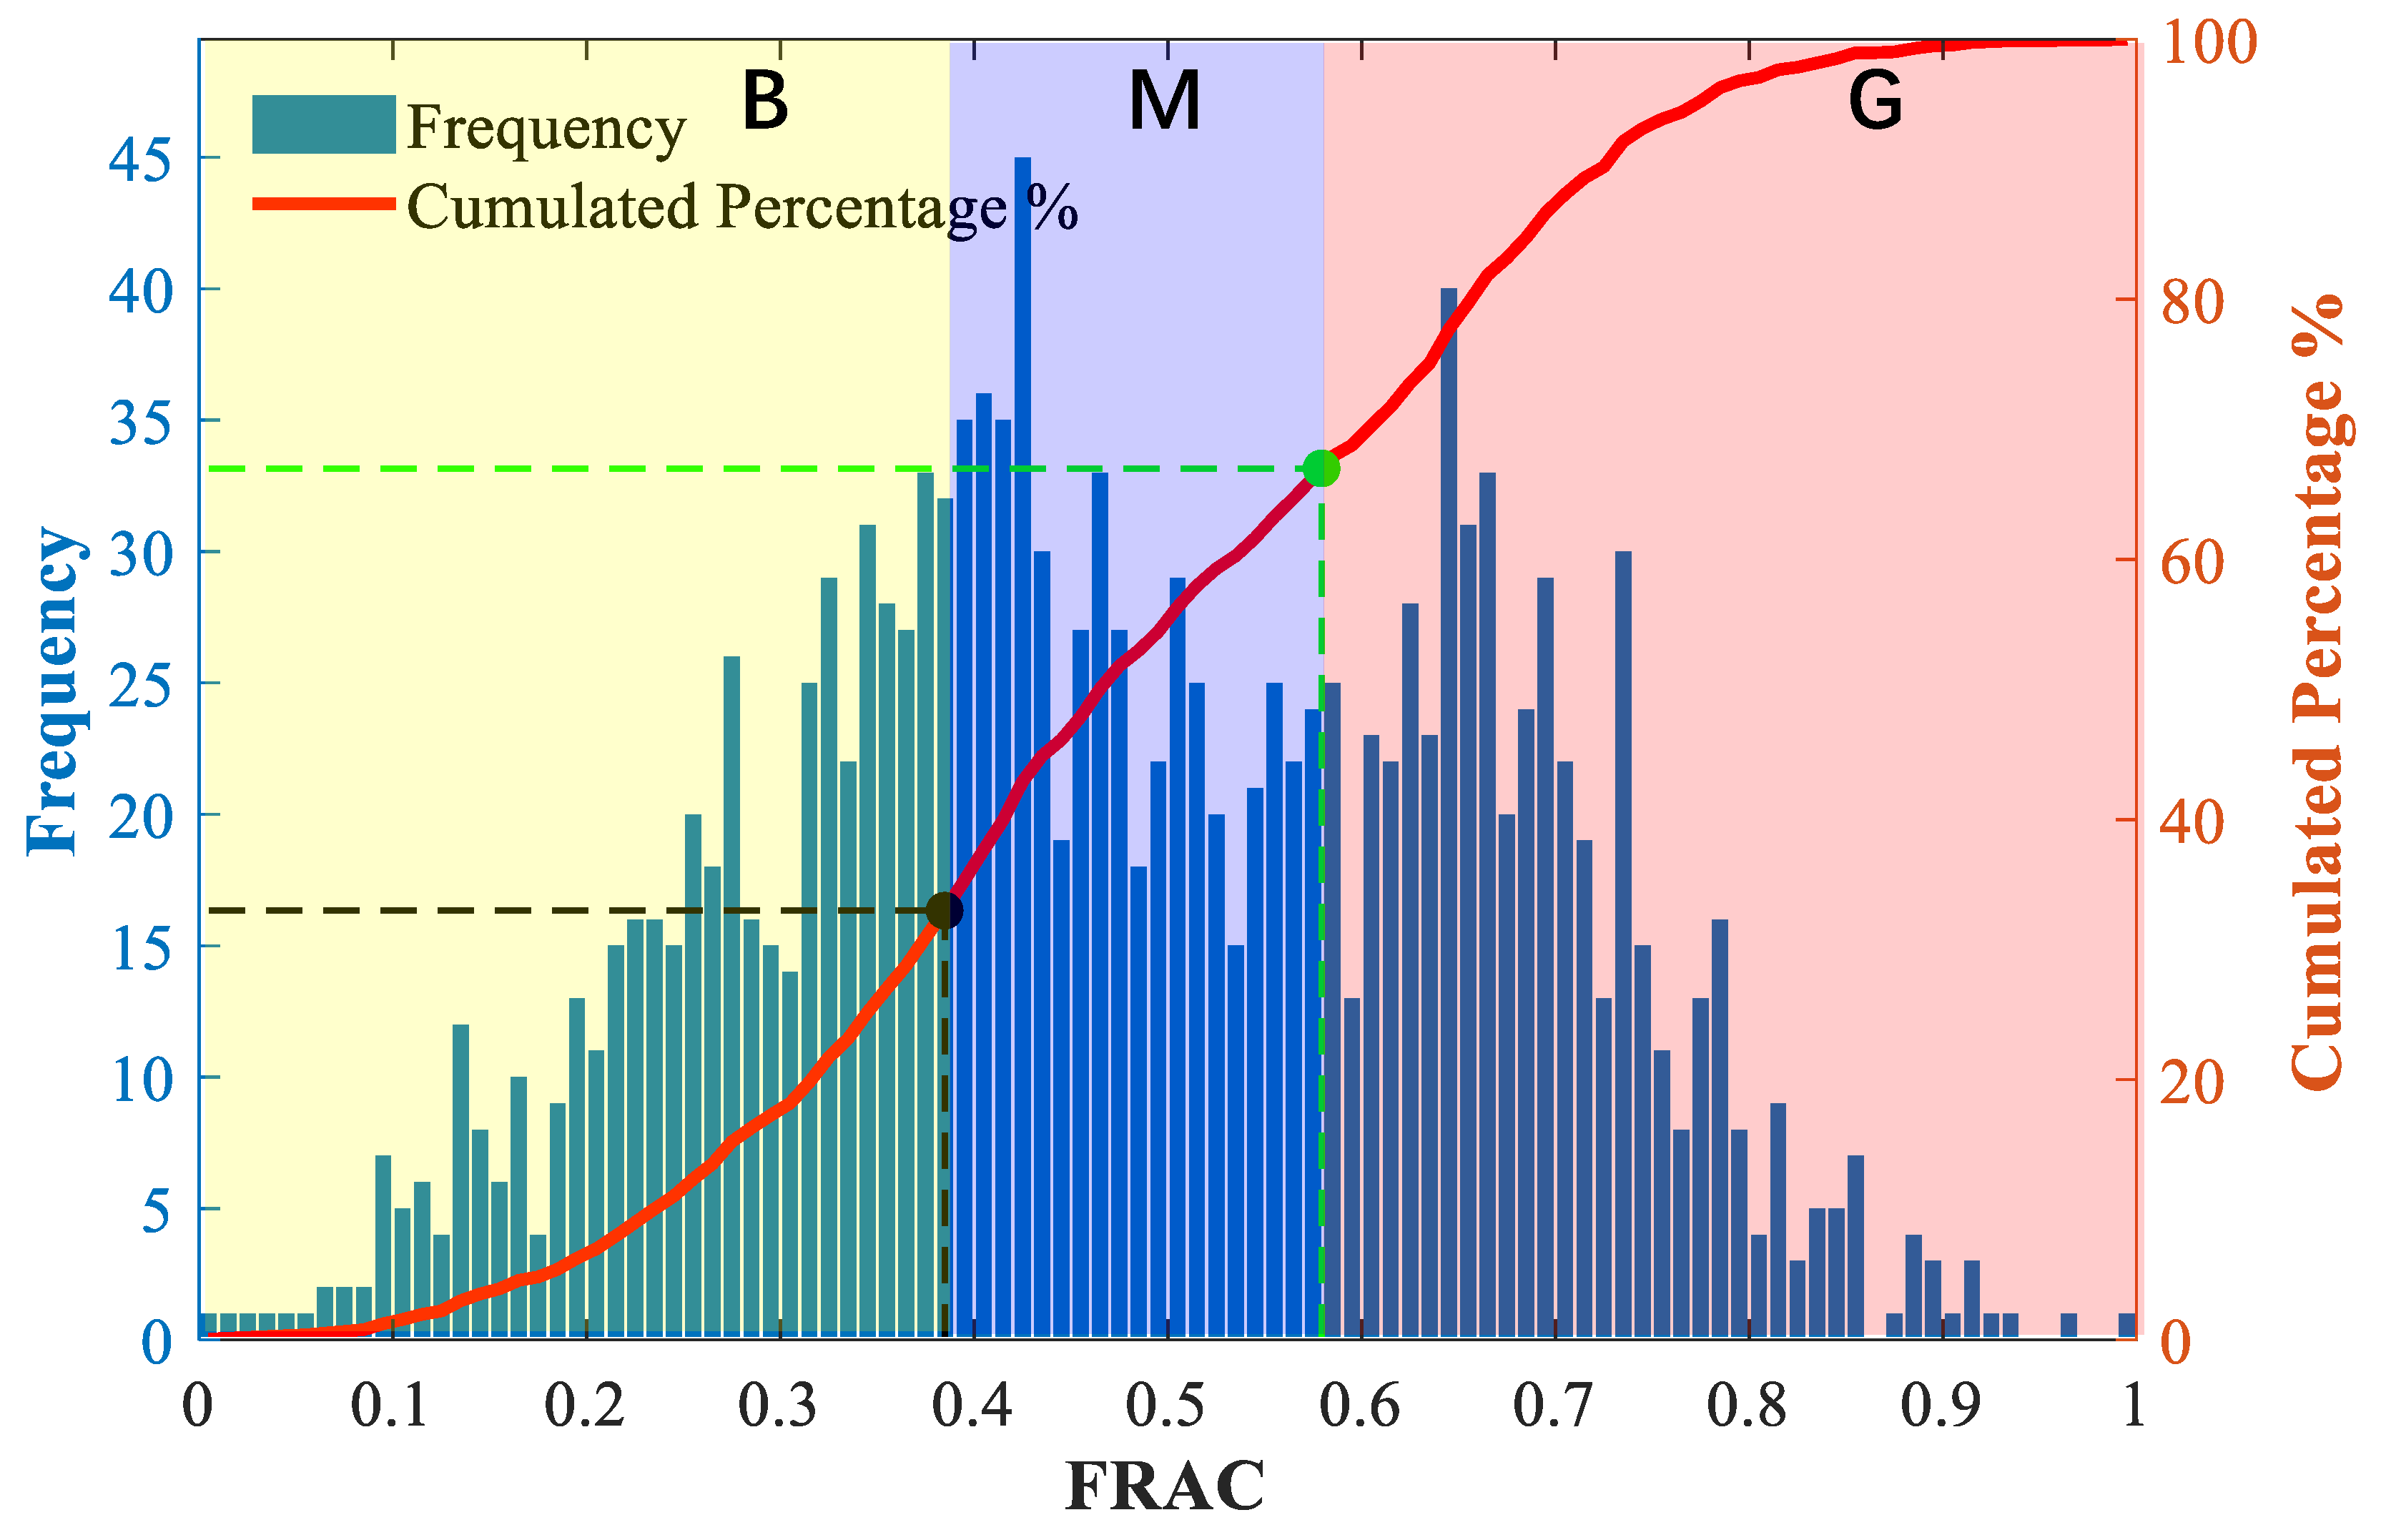
Due to the lack of unified standards for evaluating the fracability and geological properties of shale gas single wells both domestically and internationally, the range of fracability index and geological property index values corresponding to good, medium, and poor fracability and geological properties of different wells are also not the same. Therefore, the “one well, one policy” sweet spot evaluation method has been formulated using probability statistical methods. The fracability index values and reservoir quality indicators along the horizontal well are evaluated and graded. The geological properties and fracability ratings of the horizontal section of a single well are divided into three levels: good, medium, and poor, respectively represented by G, M, and B. By using the fracability model established, calculate the fracability index value within the horizontal segment, draw the frequency histogram and cumulative distribution map of FRAC, and statistically analyze the frequency of occurrence of fracability index values along the horizontal segment in various ranges, as well as the cumulative percentage of occurrence. The total cumulative percentage is 1, which is divided into 3 segments on average. This equal-interval division of the cumulative frequency provides an objective, data-driven approach to categorize the continuous indices into three tiers without prior assumptions. The fracability index values and reservoir quality index corresponding to cumulative frequencies I of 33% and 67% are used as the dividing points. This article adopts a 5-point scale to score the fracability index and reservoir quality index. The corresponding scoring criteria for each level are: G = 5 points, M = 3 points, B = 1 point (Table 2).
Table 2.
Single factor scoring criteria.
The evaluation indicators for fracability and reservoir quality indicators, as well as single factor scoring, can be determined based on the range of cumulative distribution rates for different shale gas horizontal wells using the aforementioned rating and scoring criteria. Then, taking into account the fracability of the horizontal wellbore and reservoir characteristics, a composite scoring index is used to quantitatively characterize the likelihood of each position in the horizontal section becoming a fracturing section. The higher the composite score, the greater the likelihood of becoming a fracturing position. A comprehensive score of 6 or higher means each indicator reaches at least the medium (M) level and is defined as a Type I sweet spot representing priority fracturing intervals. A comprehensive score between 2 and 6 is classified as a Type II sweet spot corresponding to selective or optimized fracturing intervals. A comprehensive score of 2 indicates both indicators are rated poor (B) and is categorized as a Type III sweet spot, referring to intervals to be temporarily avoided or considered last. The composite scoring index for each point in the horizontal section can be expressed as [32]:
where gFrac is the fracability index score, gpindex is the reservoir quality index score.
Based on this method, after segmentation, the comprehensive dessert score of each fracturing section and the total score of all sections can be expressed as:
where i is the depth of the well, m; gt represents the score of the i-th depth position; Gaver is the average fracability score of segment j; Ls is the segment length; sn is the number of segments.
3. Results and Discussion
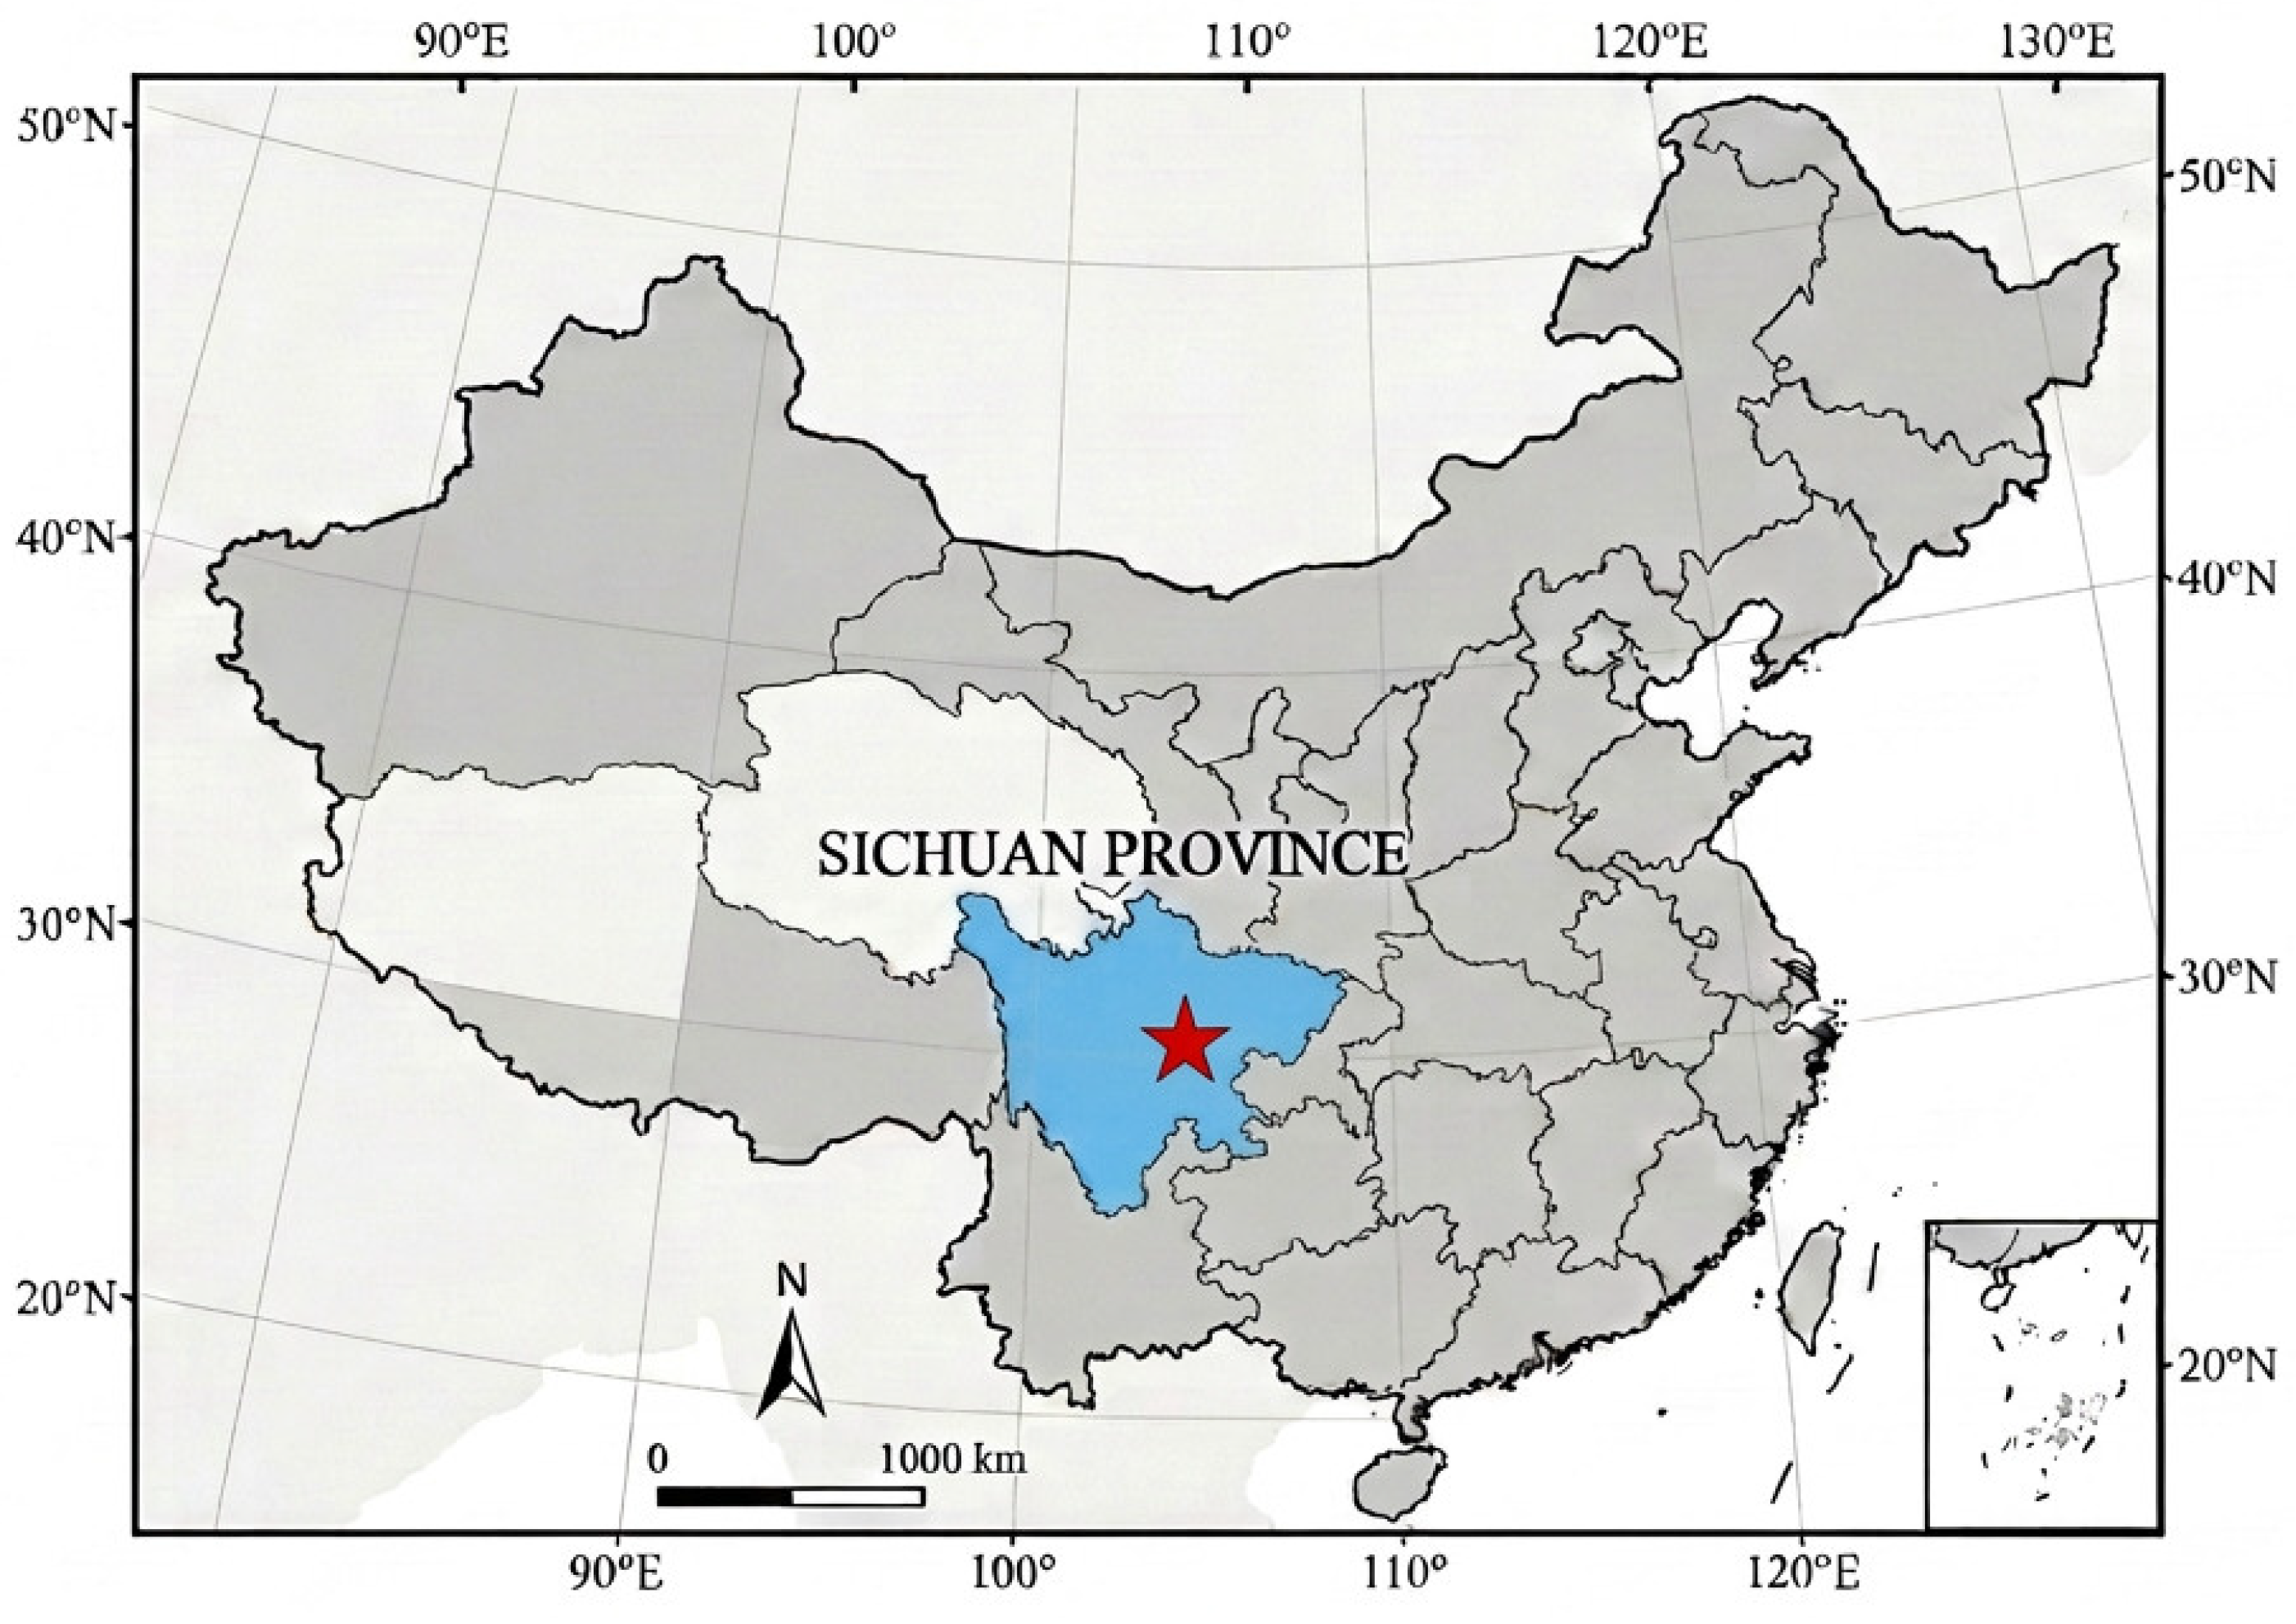
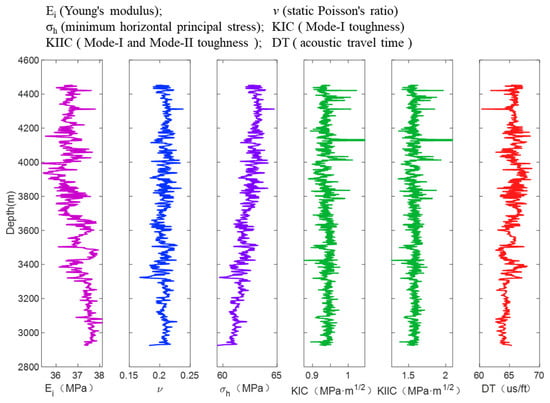
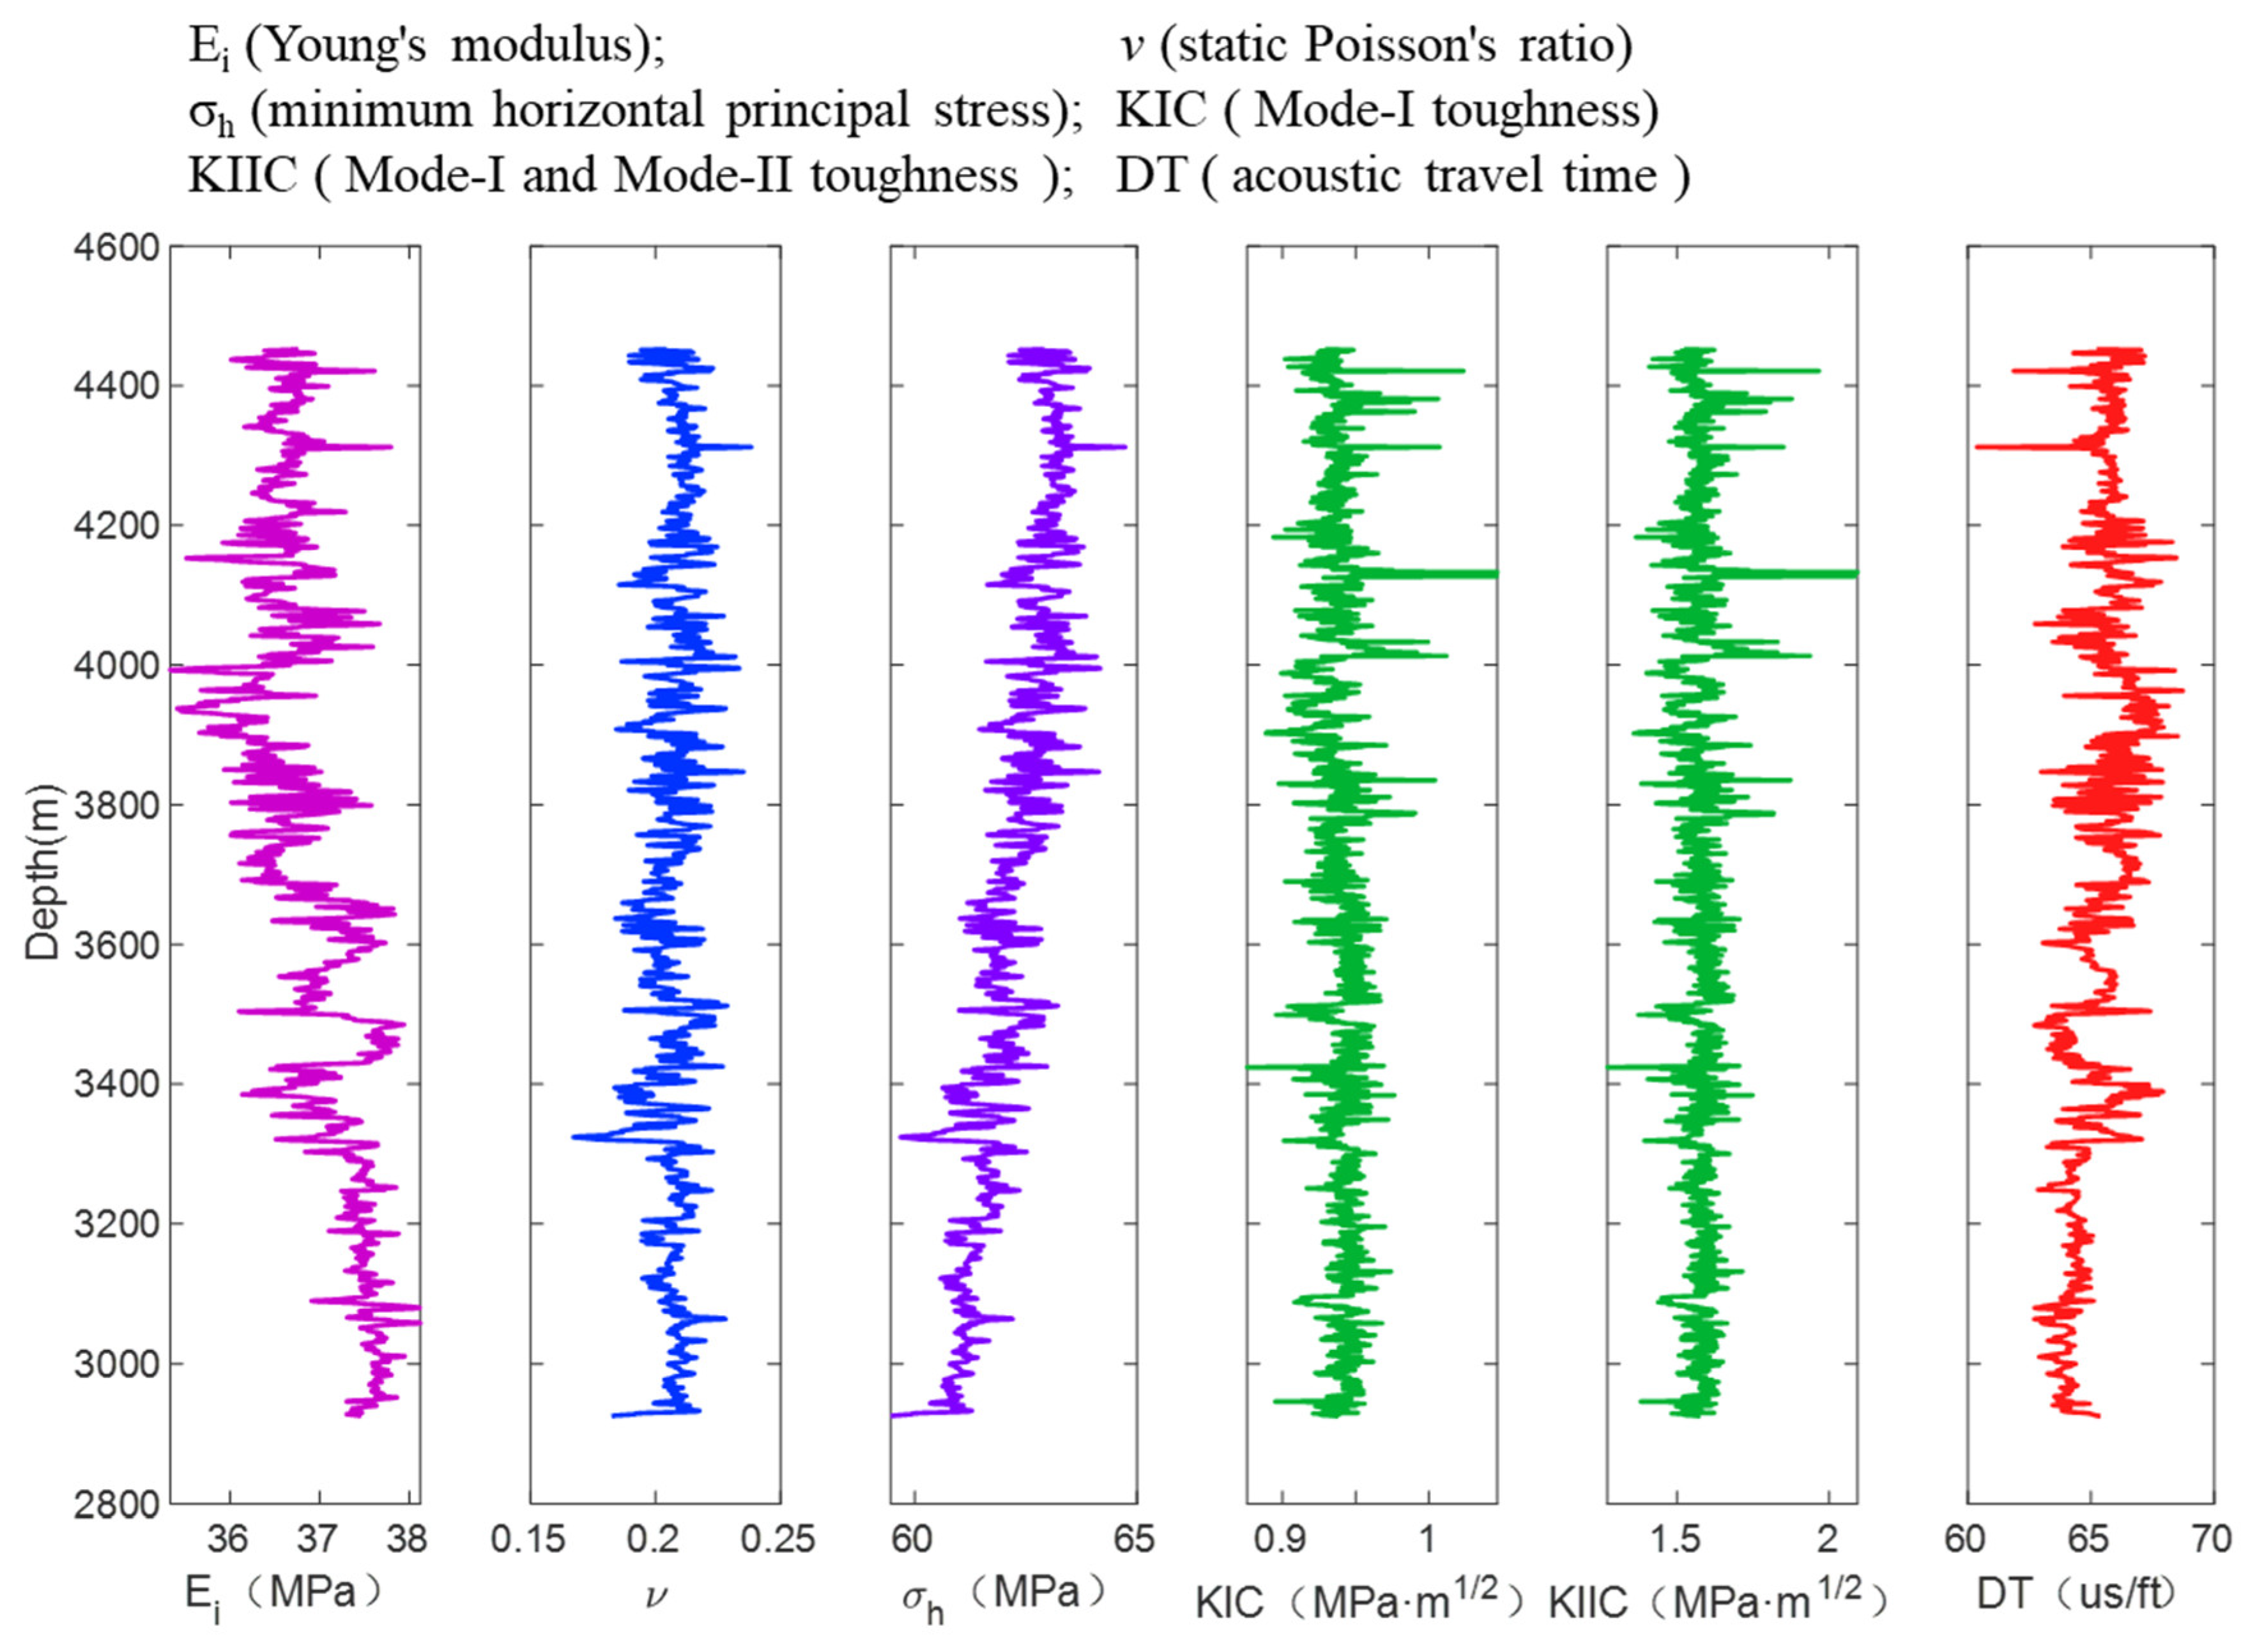
Well Y4 is situated in Shangluo Town, Gong County, Yibin City, Sichuan Province, and is structurally located on the southern limb of the Zhong’aoding structure within the Changning Anticline (Figure 4). It is developed for the shale gas resources of the Longmaxi Formation in the Changning area. The structural pattern of the Changning target well area is characterized by gentle slopes in the north and south and a gentle central zone. The target interval is the Longmaxi Formation, whose lithology at this well is dominated by grayish-black and black shales, overlain by the Shiniulan Formation. The well was drilled to the Longmaxi Formation, with a vertical depth of 2652.08 m. Since the focus of this paper is the evaluation method of fracturing sweet spots for infill wells, the sweet spot study was only performed on the horizontal interval of this reservoir. Figure 5 shows the basic logging curve of the horizontal section of the well. The longitudinal wave acoustic time difference range of the well is between 60.37 and 68.73 μs/ft. The minimum horizontal stress range is 59.46~64.73 MPa, with an average value of 62.18 MPa. The static elastic modulus ranges from 35.33 to 38.12 GPa, with an average of 36.94 GPa. The static Poisson’s ratio is 0.167~0.238, with an average value of 0.207. Mode-I fracture toughness value ranges from 0.876 to 1.0467 MPa·m1/2. The Mode-II fracture toughness value ranges from 1.272 to 2.093 MPa·m1/2 (Figure 5).
Figure 4.
Geographic location of well Y4 (marked with a red star) in Changning Shale Gas Area in Sichuan Province, China.
Figure 5.
Prediction of rock mechanics parameter along the wellbore.
3.1. Evaluation of “Engineering Sweet Spot” in the Horizontal Segment
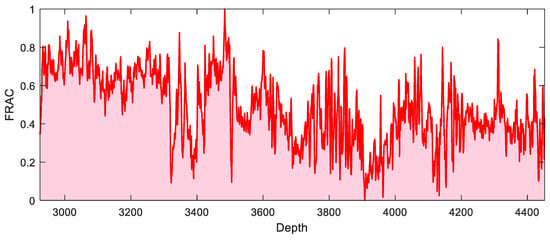
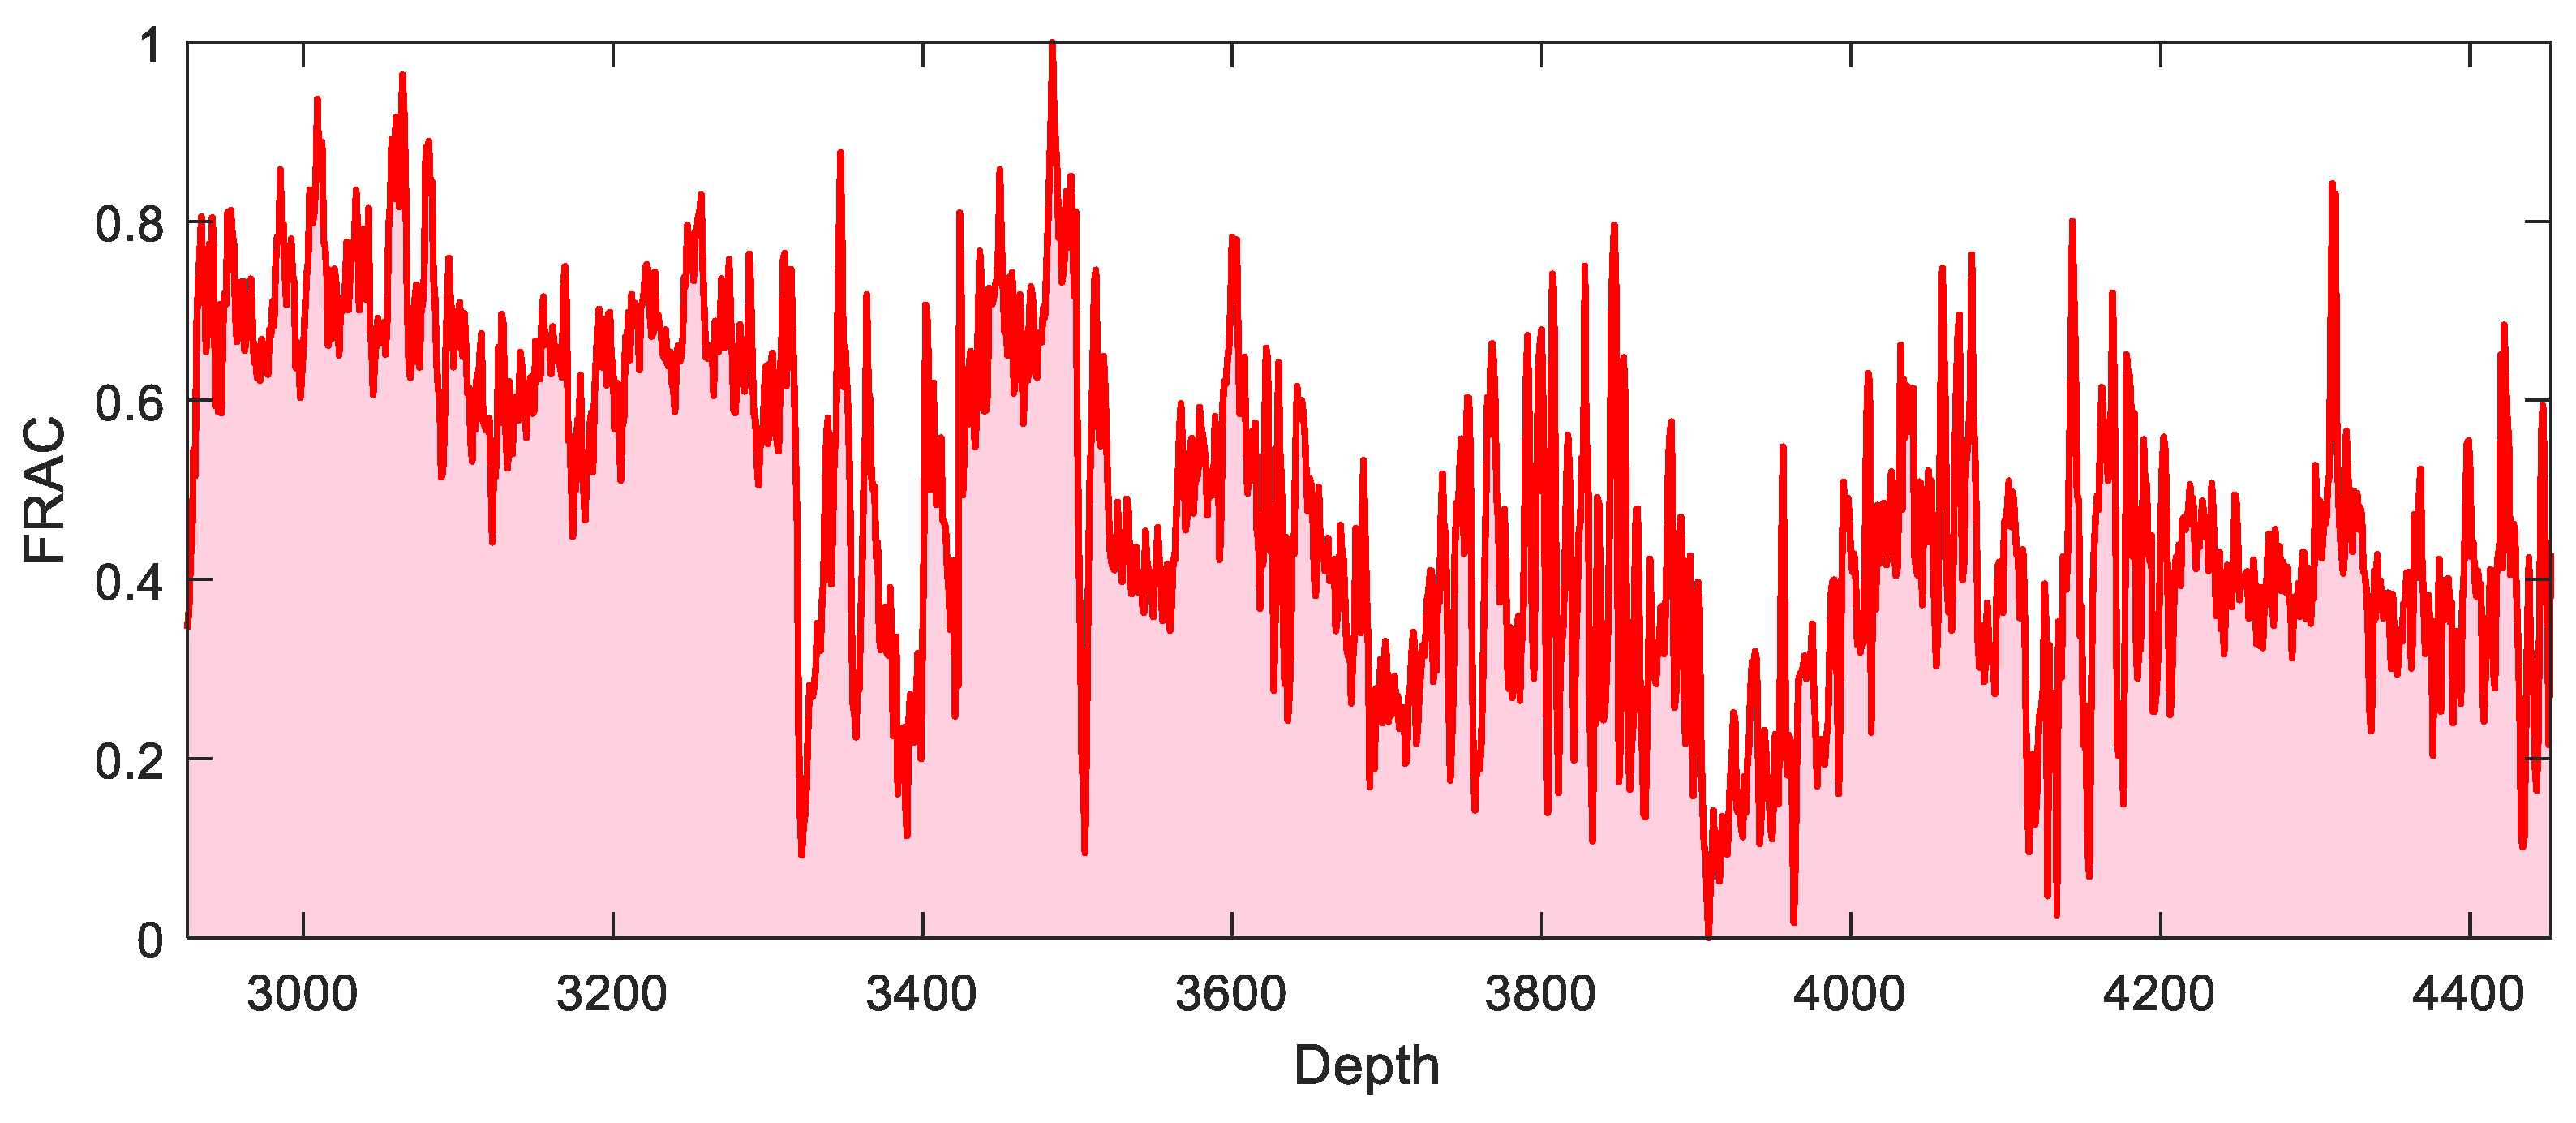
The calculations and statistical analyses in this study were performed using MATLABR2021a. According to the method proposed in this paper, the fracability index profile of the target horizontal well is calculated using the logging parameters of the target well. As shown in Figure 6, it can be seen that the FRAC remain between 0 and 1, and the non-uniformity of hydraulic fracturing index along the horizontal wellbore is severe. The high fracability score indicates better fracturing potential and strong formation of complex fracture networks at that location.
Figure 6.
FRAC along the wellbore.
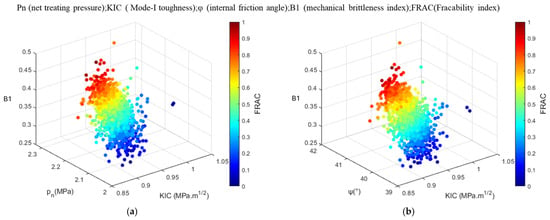
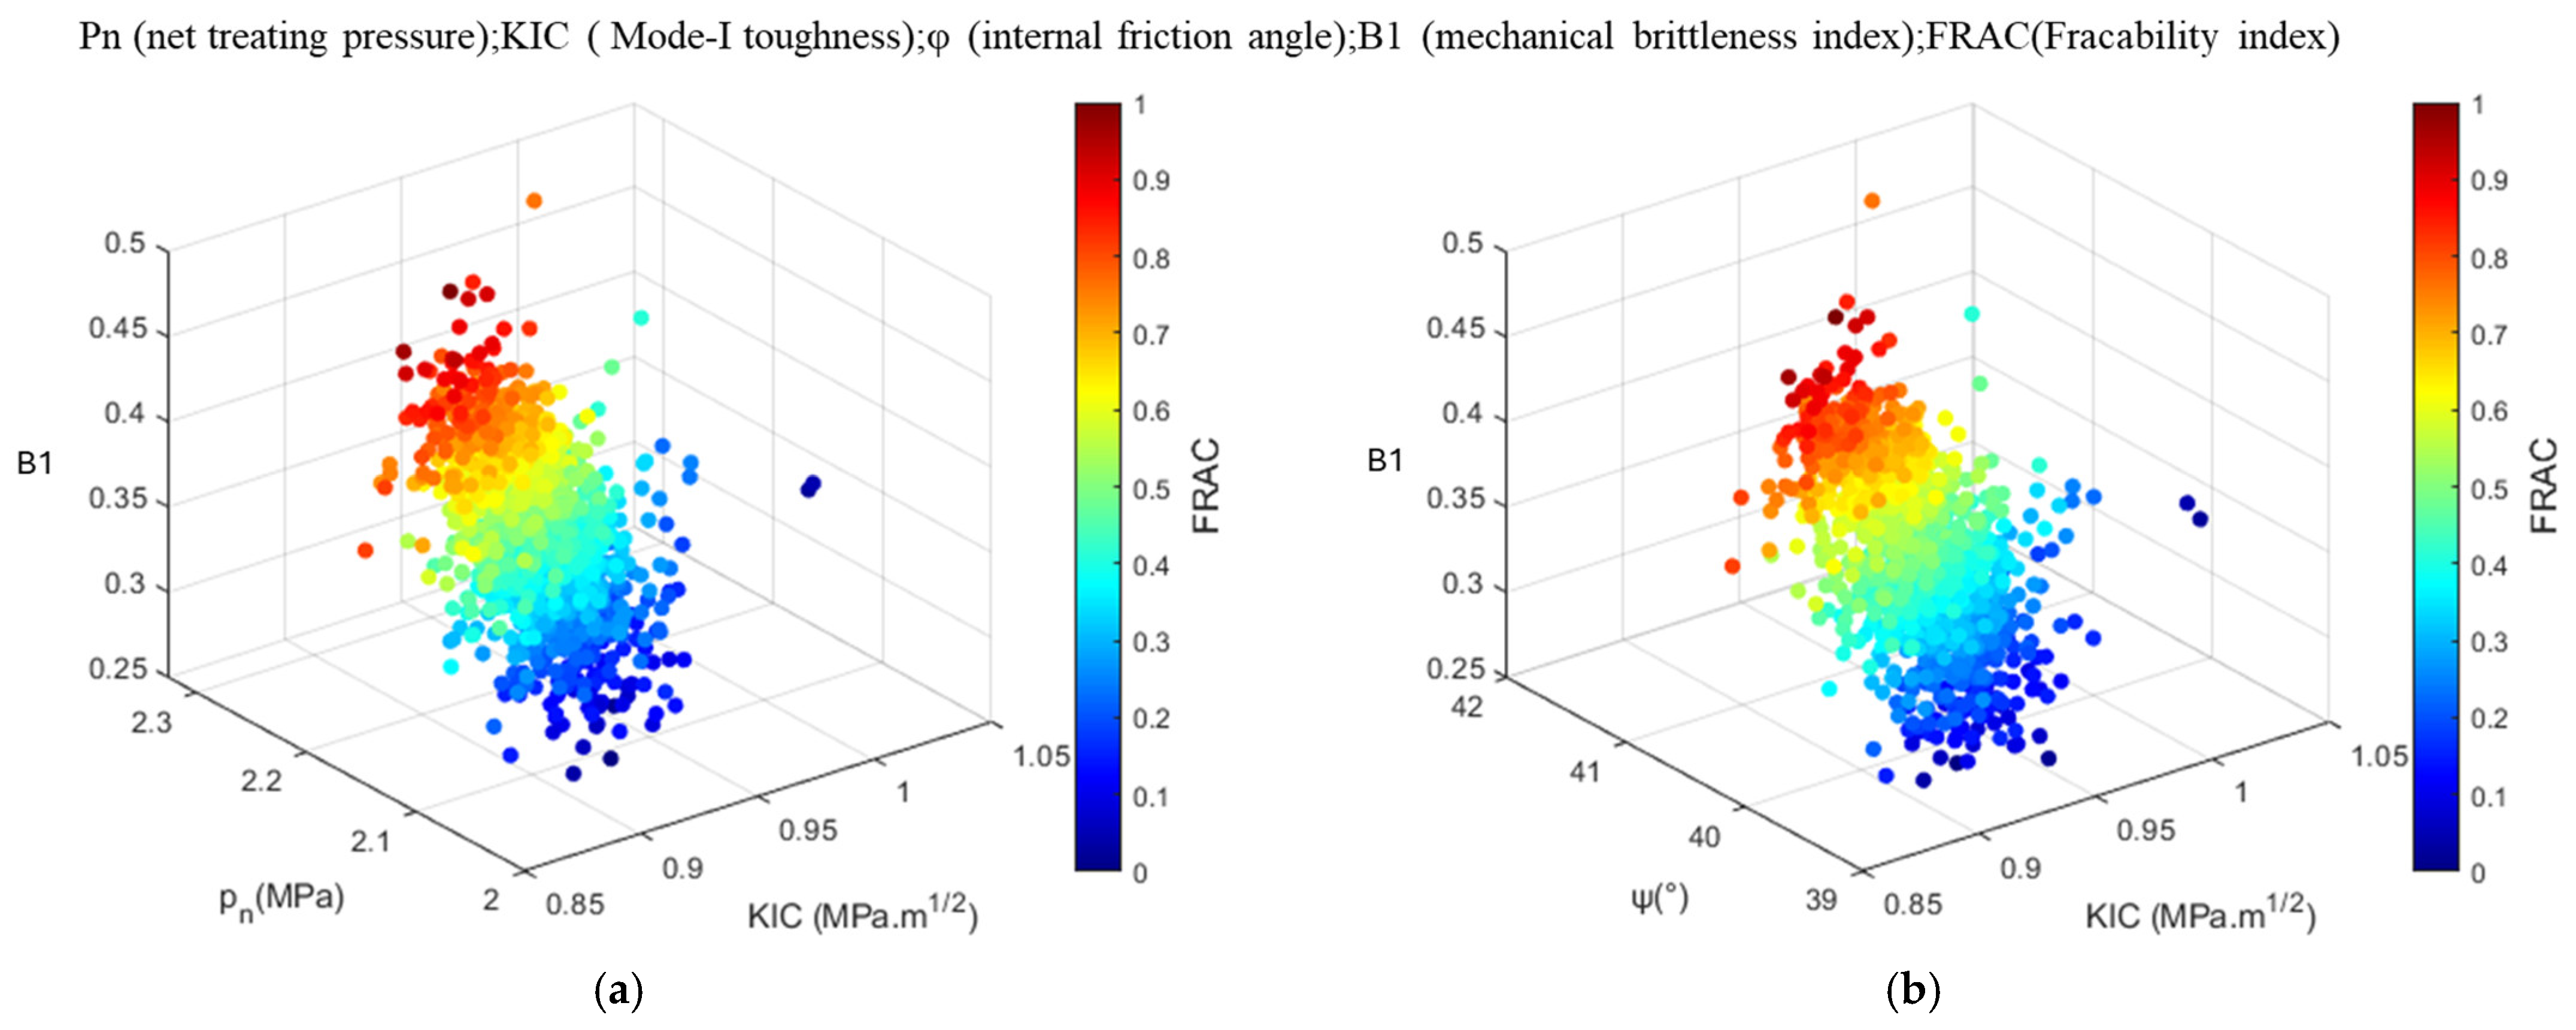
As shown in Figure 7, the higher the brittleness index, the bigger the net pressure, the lower the fracture toughness index, and the higher the FRAC. The higher the brittleness index, the larger the internal friction angle, and the lower the fracture toughness, the greater the FRAC. The larger the FRAC in the horizontal well section of the reservoir, the better the fracability conditions of the reservoir.
Figure 7.
Relationship between fracability index, brittleness, fracture index, and internal friction angle of Well Y4 (a,b).
3.2. Evaluation of “Geological Sweet Spot” in Horizontal Sections
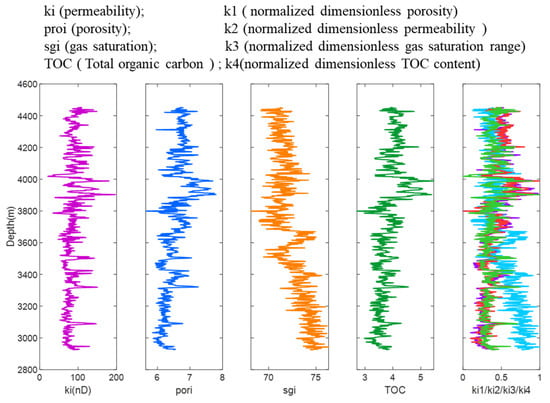
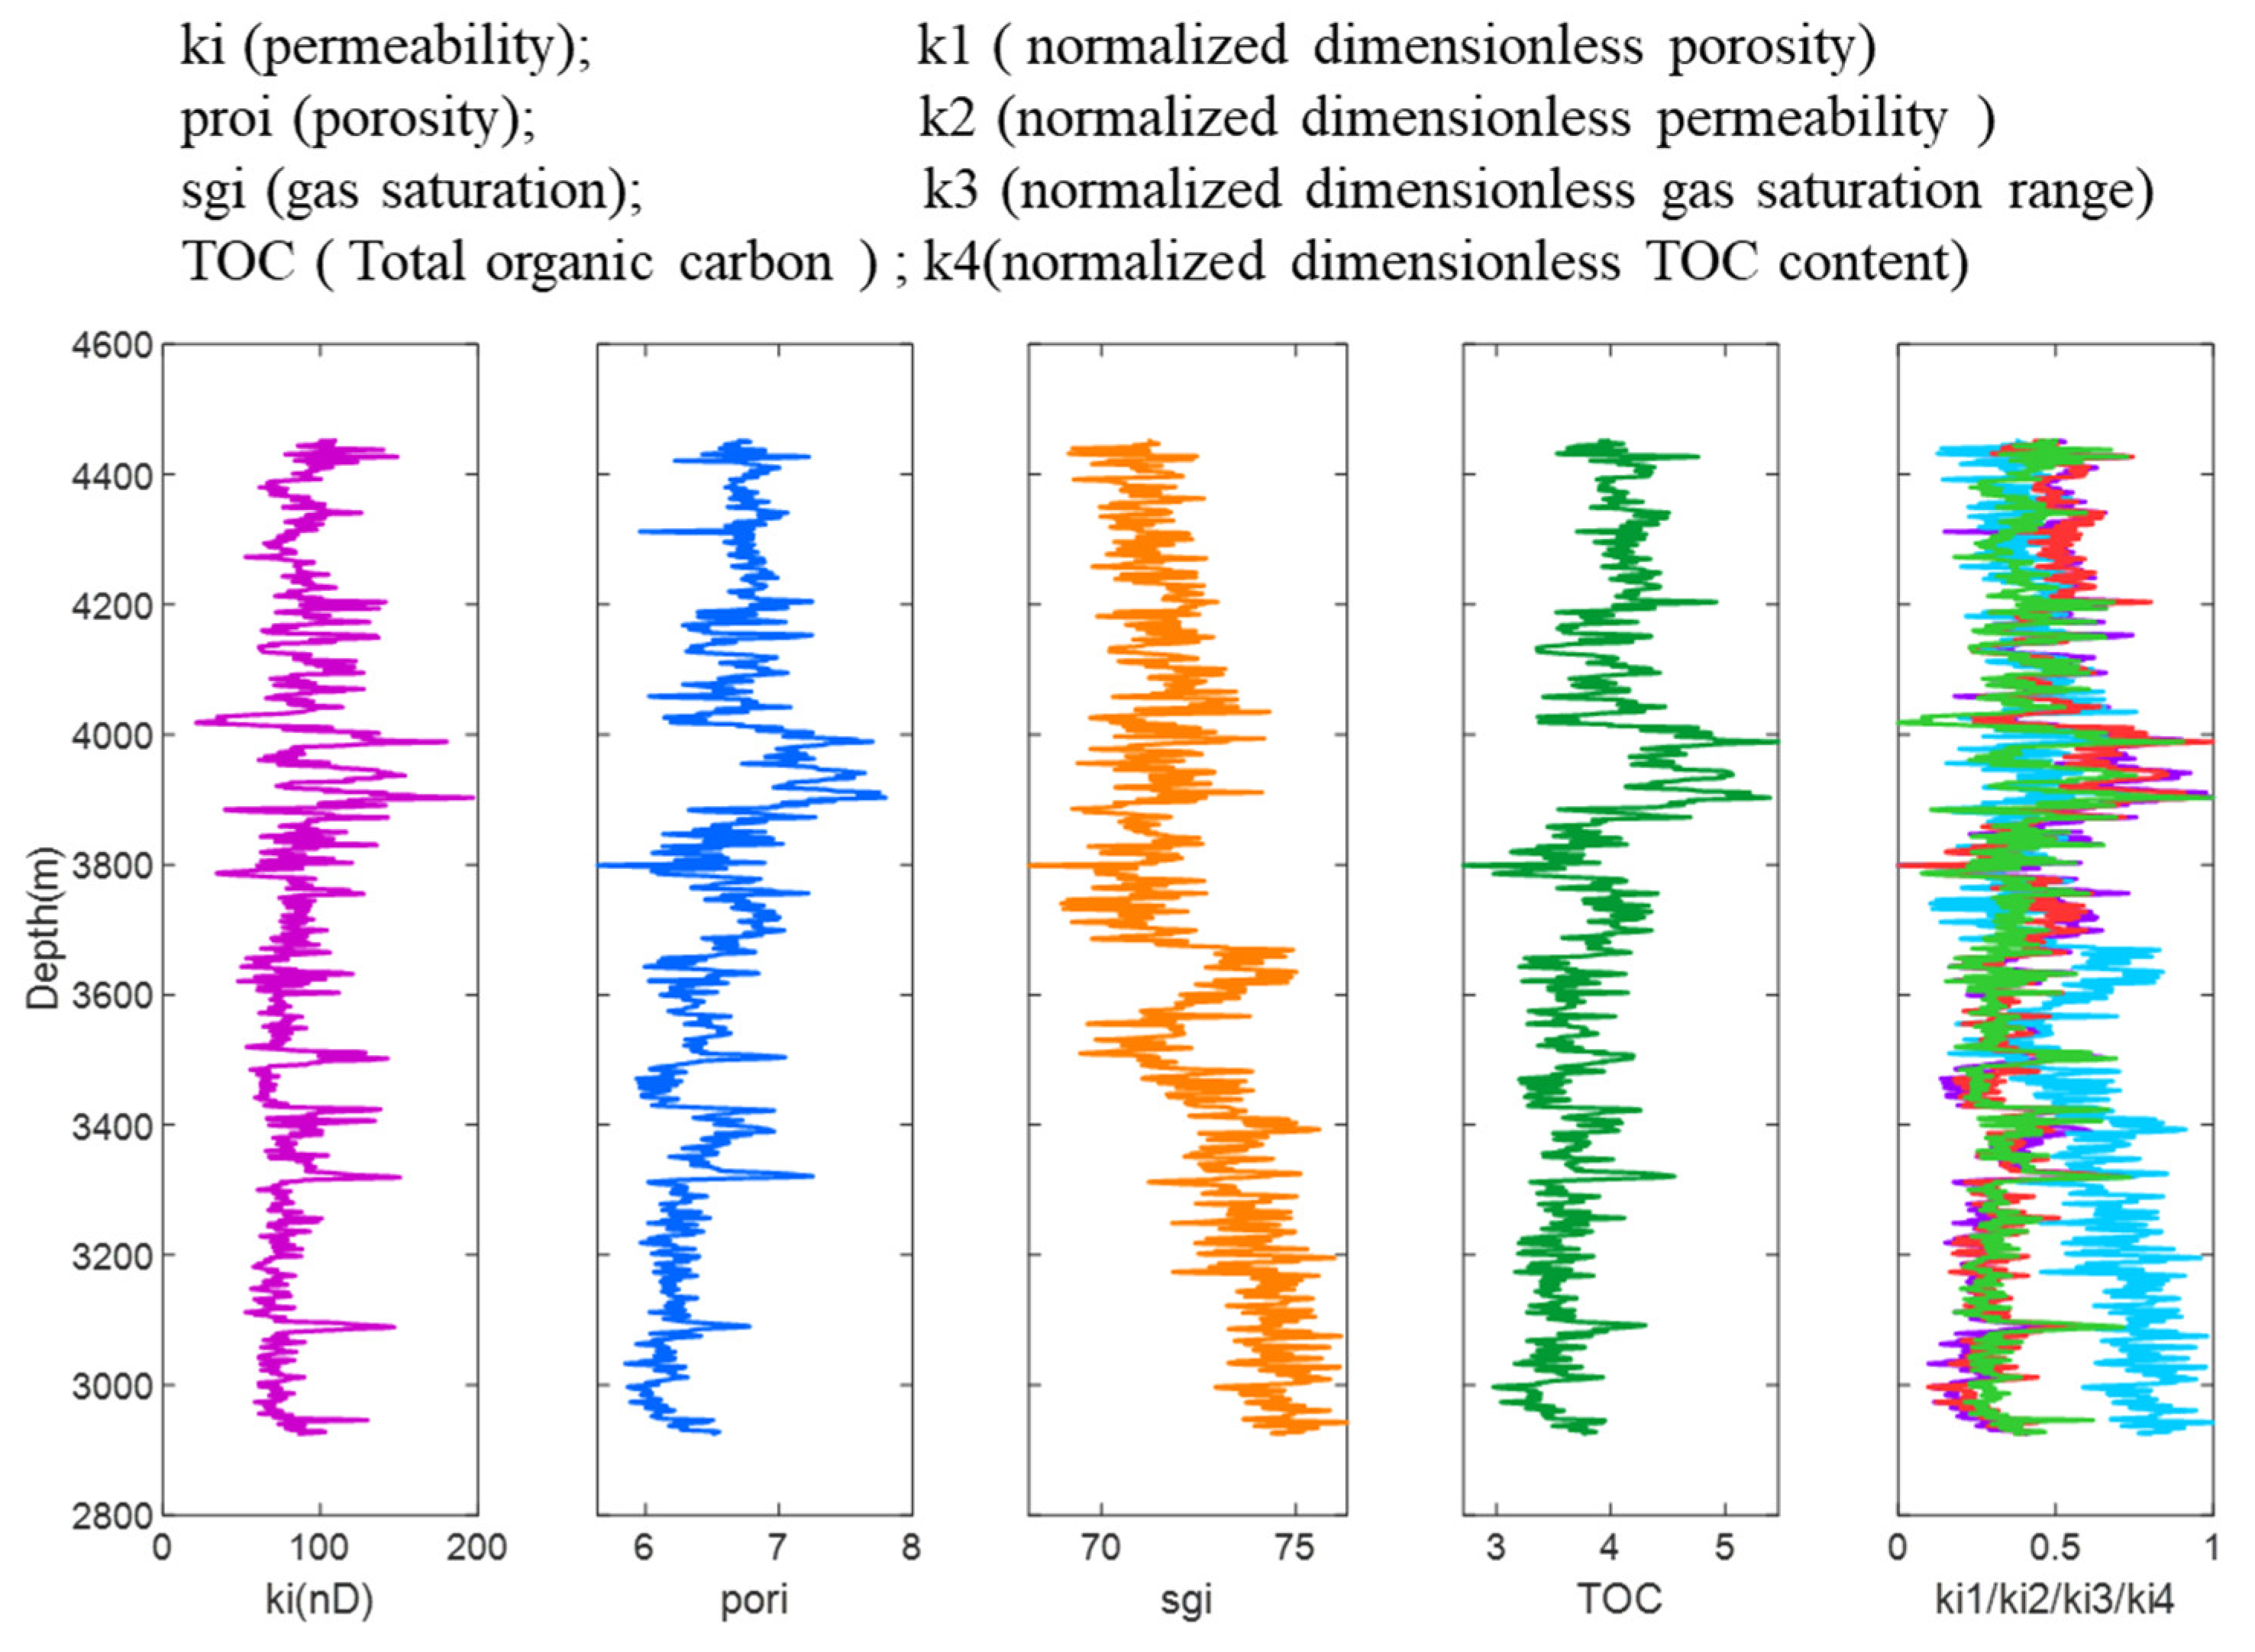
The porosity ranges from 5.6390–7.799%, and gas saturation varies from 68.1317–76.3145%. The TOC content of this well ranges between 2.7123 and 5.4646%. Maturity of this shale gas (Ro) is a key parameter for evaluating shale gas generation [39]. The shale of the Longmaxi Formation in the Changning block is in a high-maturity stage. Figure 8 shows the distribution curves along the horizontal section in the dimensionless plots of permeability, porosity, and gas saturation, and TOC content. These values are non-uniformly distributed, making it difficult to identify a clear boundary or classification patterns.
Figure 8.
Dimensionless saturation, porosity, permeability, and TOC profiles of well Y4.
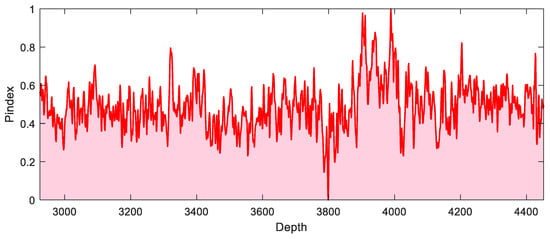
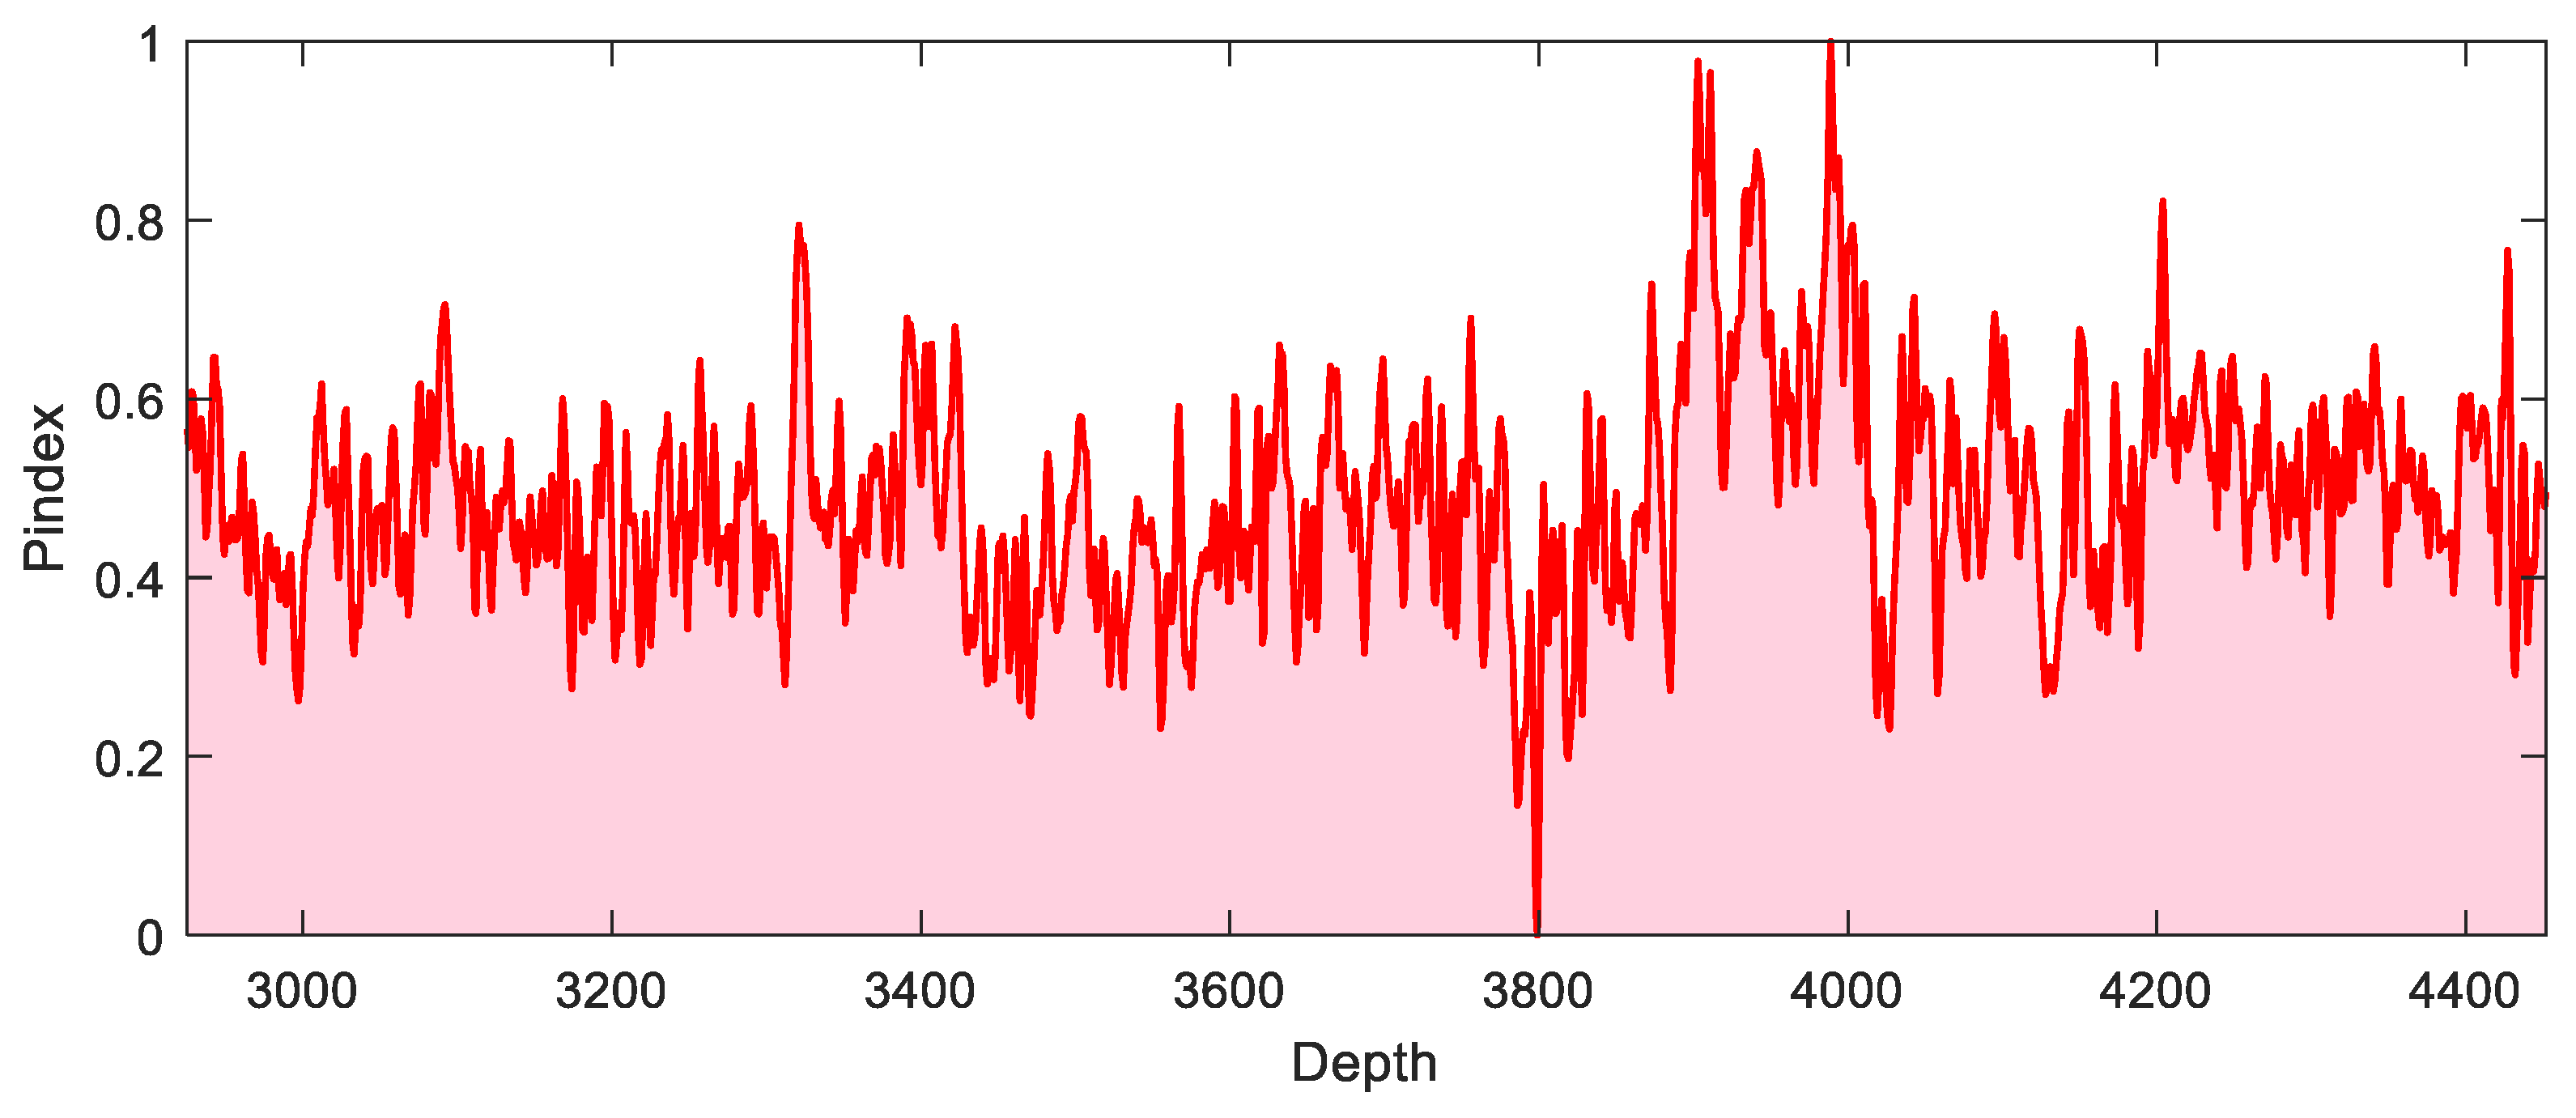
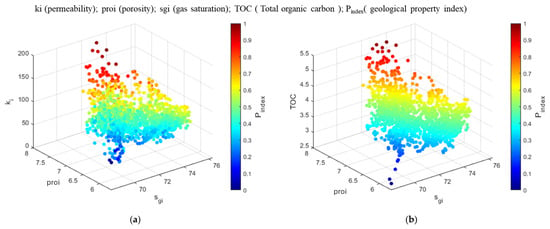
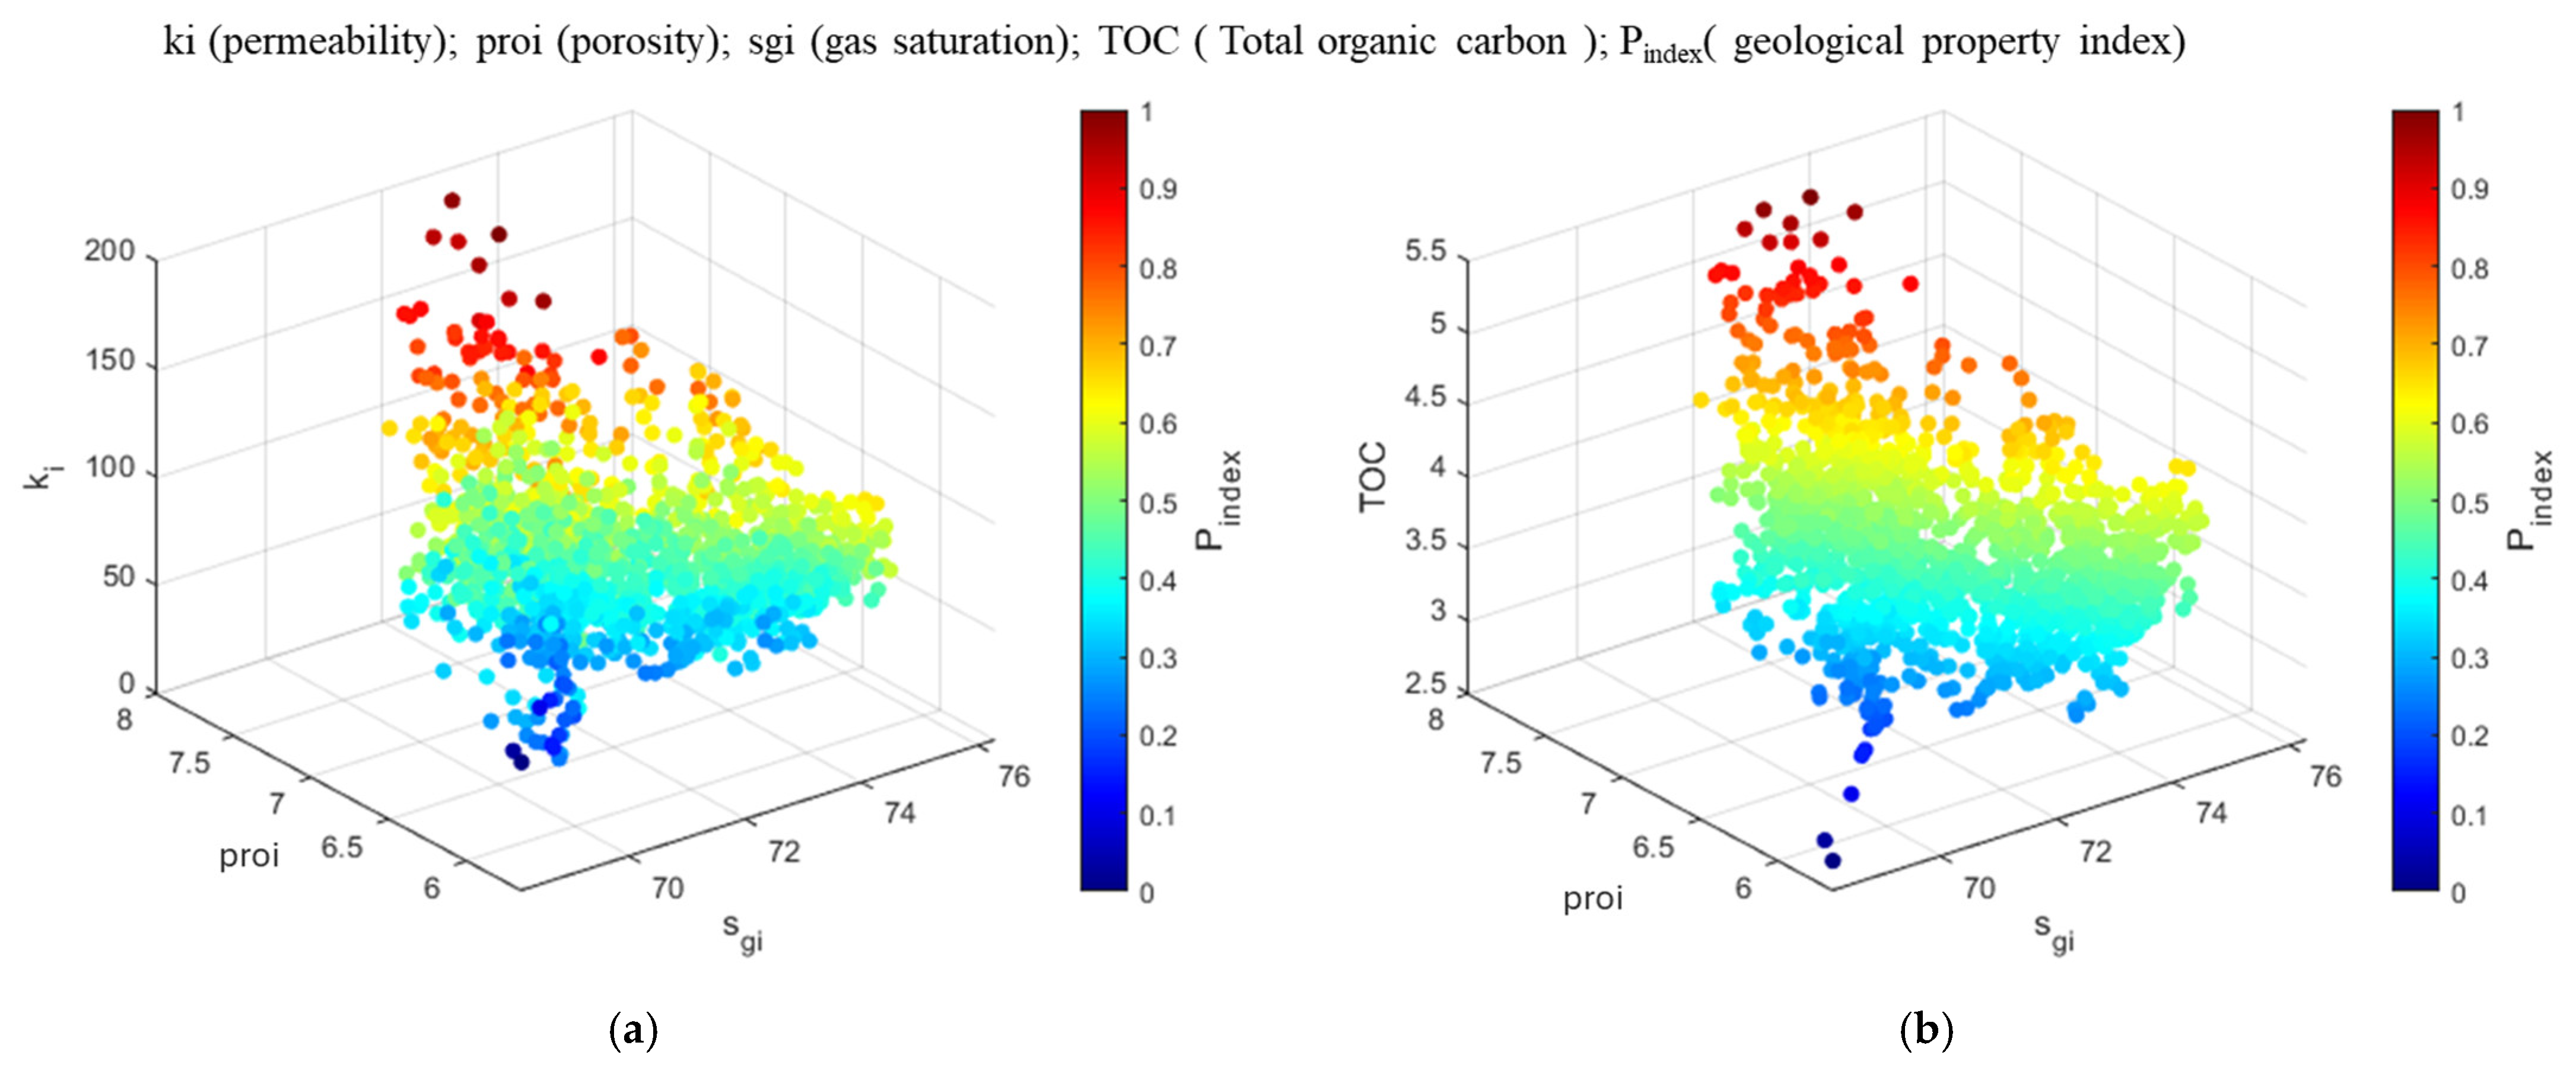
Based on the geological sweet spot index calculation model, the geological sweet spot evaluation index for the horizontal section was calculated. This yields the geological sweet spot index profile along the horizontal section of the target well. The Pindex profile exhibits a non-uniform distribution (Figure 9). The larger the value of the Pindex, the better the geological properties and gas production capacity of the area. The reservoir geological property index is determined by porosity, permeability, and gas saturation. As shown in Figure 10, with the increase in gas saturation, porosity, permeability, and TOC, the Pindex increases.
Figure 9.
Pindex along the wellbore.
Figure 10.
Reservoir geological property index of well Y4 (a,b).
3.3. Sweet Spot Evaluation of Infill Horizontal Well
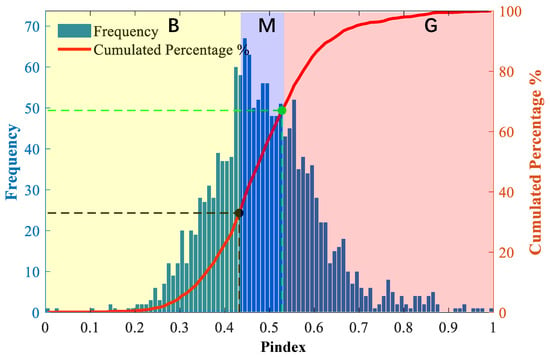
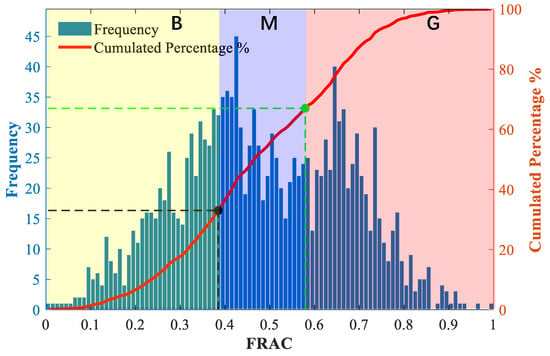
The frequency histograms and cumulative distribution maps of the FRAC and Pindex along the horizontal segment are shown in Figure 11 and Figure 12. Table 3 presents the fracability and reservoir quality index ratings and scoring results of the well, with a comprehensive score of 1–5 for the horizontal well section. In the horizontal section of the target well, the section with a FRAC greater than 0.5793 is rated as 5 points, the section between 0.3848 and 0.5793 is rated as 3 points, and the section below 0.48 is rated as 1 point. Similarly, 0.4323 and 0.528 are selected as the most suitable geological property index scoring indicators, and the corresponding scores are evaluated. Finally, the corresponding Y4 well section scores of the two indices are added to obtain a comprehensive evaluation score for a horizontal well section. According to the marked engineering desserts, horizontal well segmentation operations are performed and well sections with poor cementing quality are removed during the segmentation process.
Figure 11.
Histogram of frequency distribution of geological property index.
Figure 12.
Histogram of frequency distribution of fracability index.
Table 3.
Rating and scoring results of fracability and geological property index.
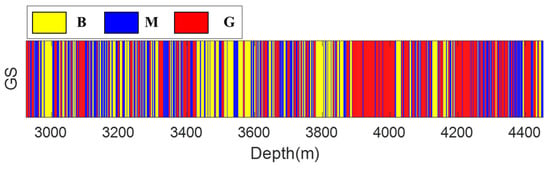
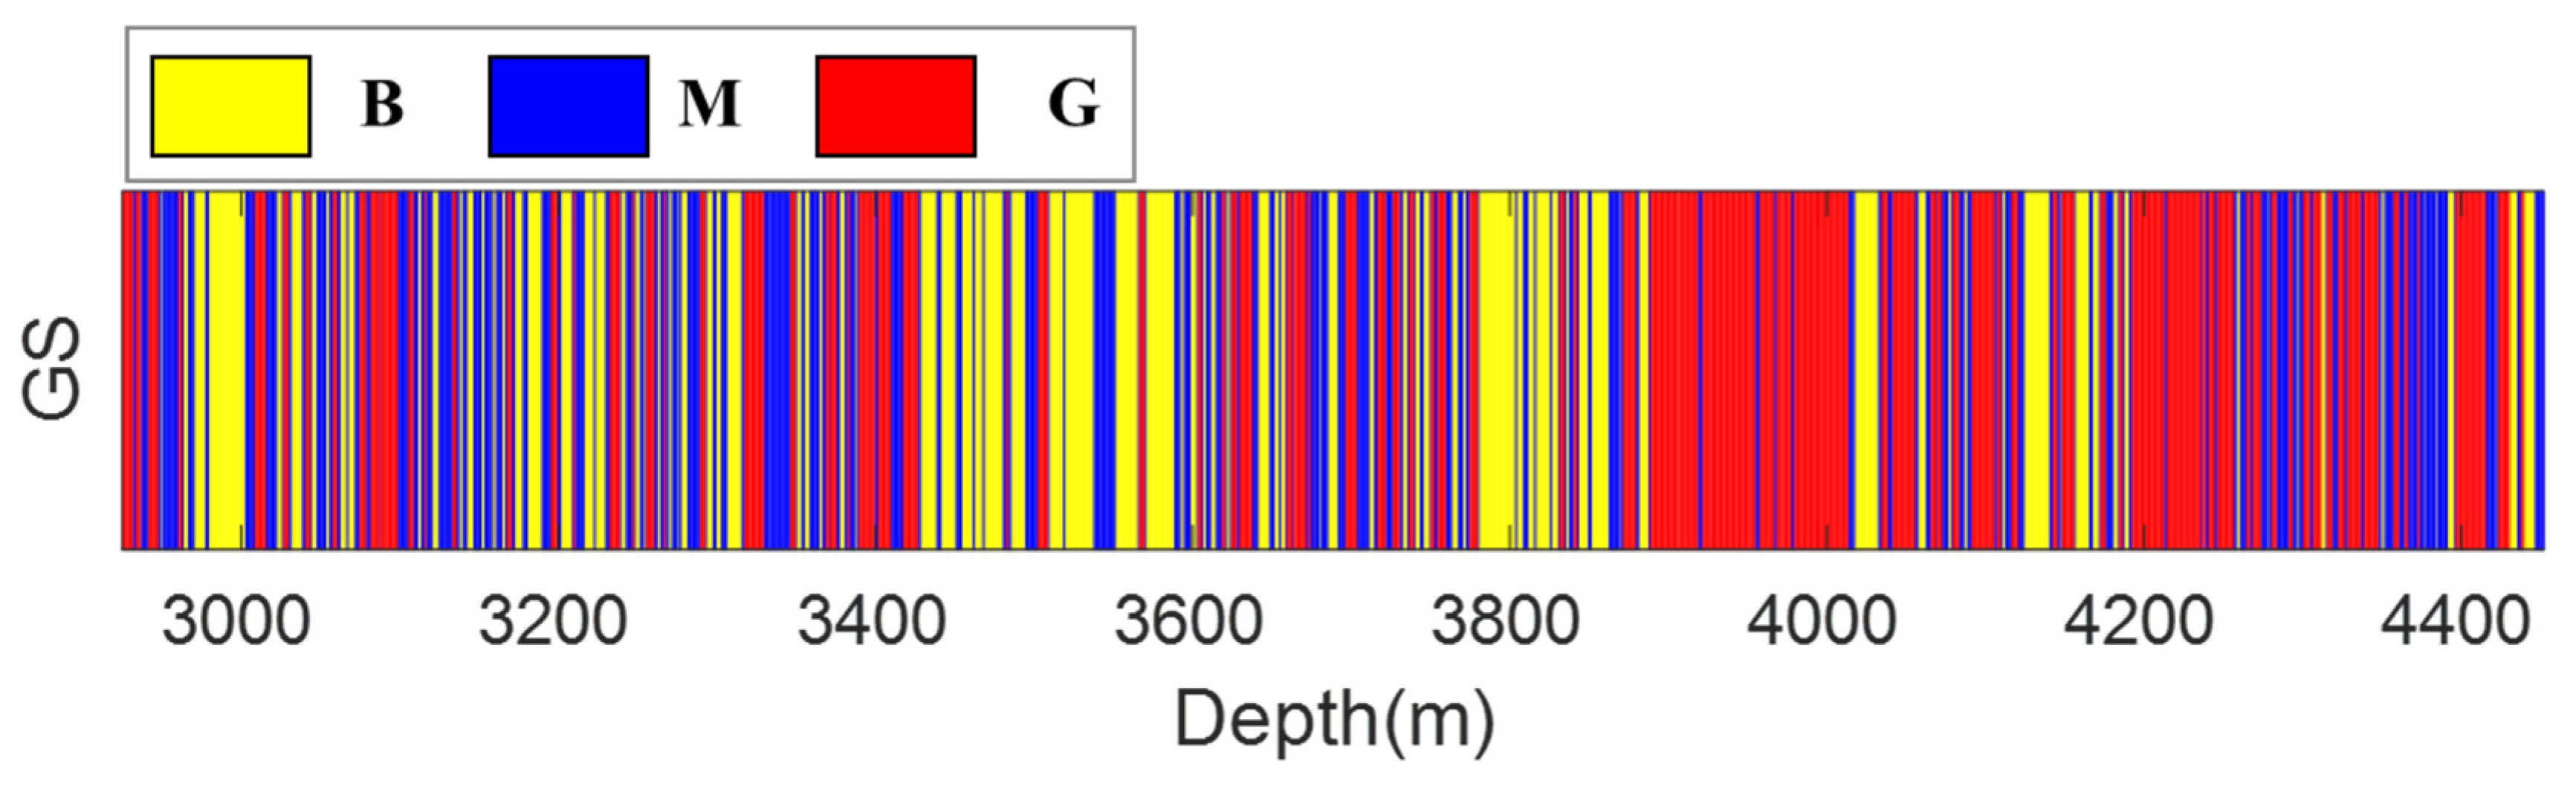
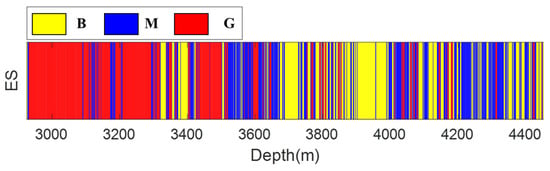
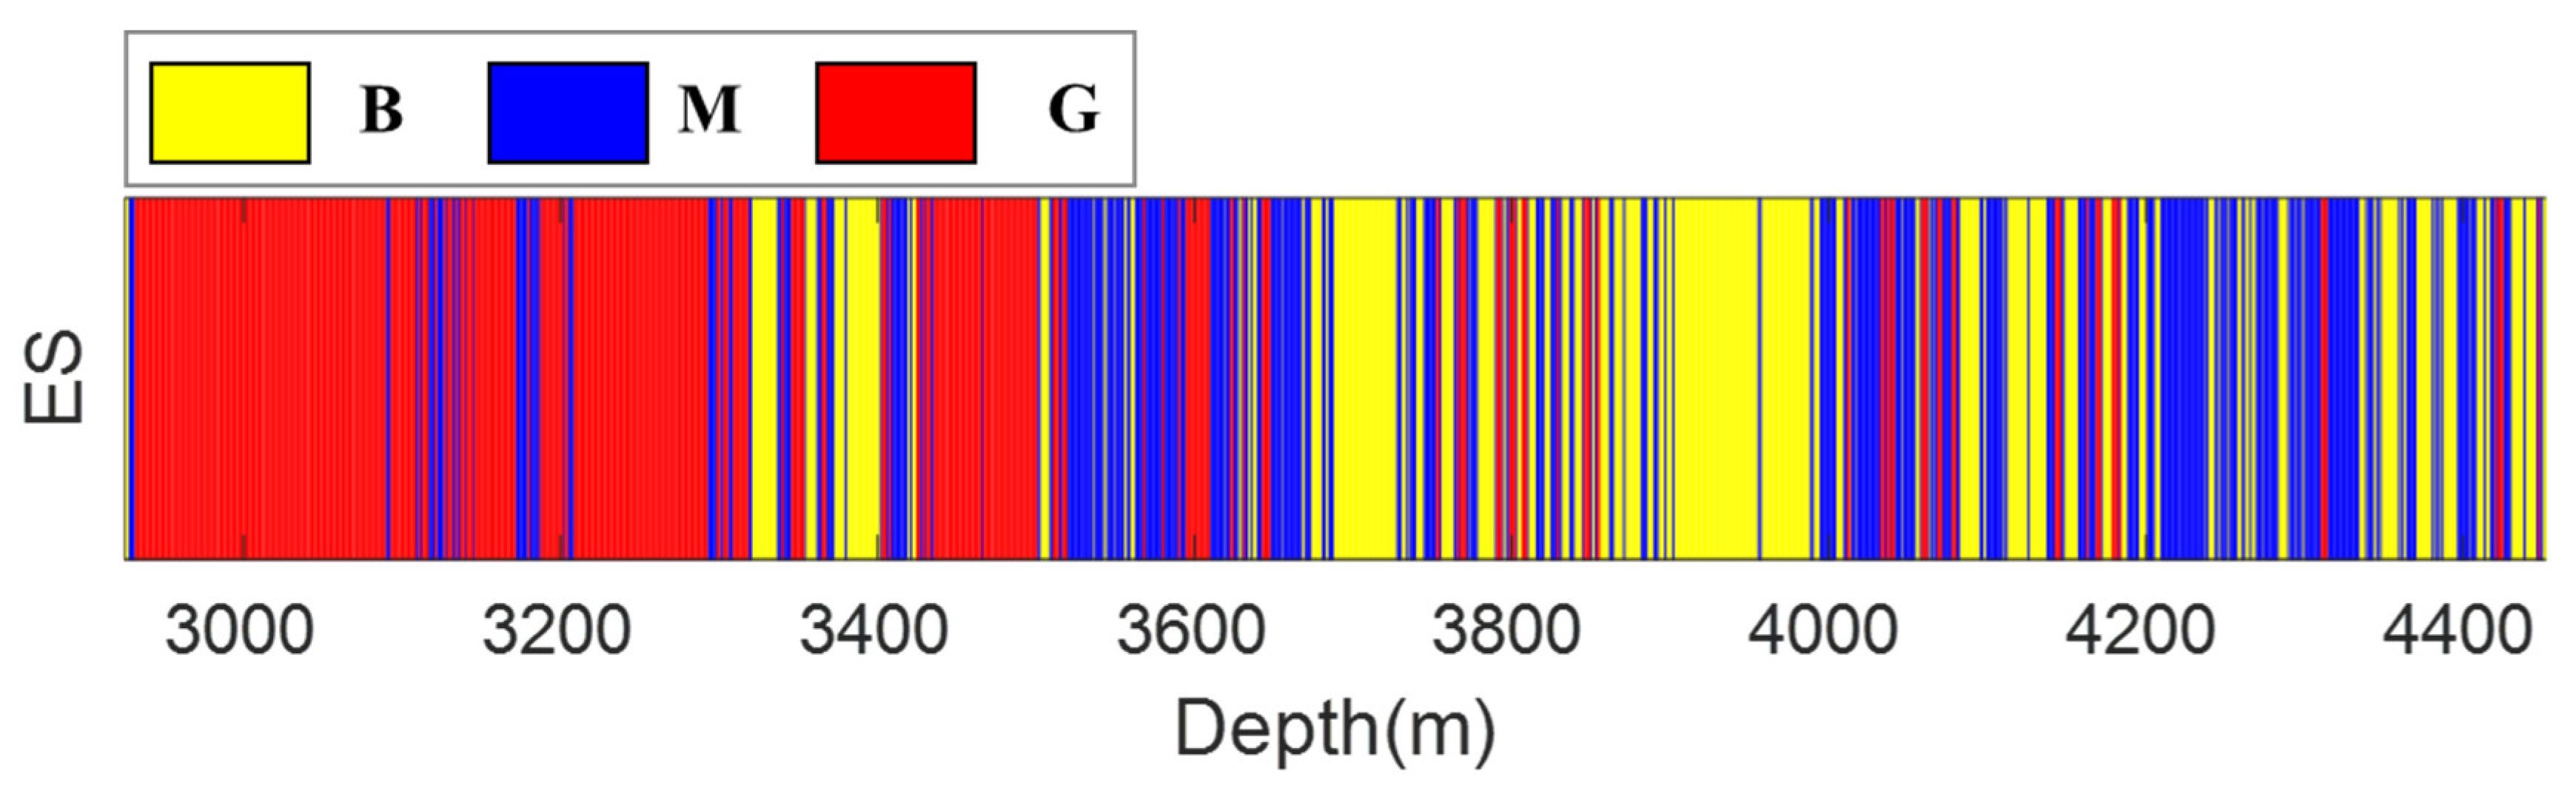
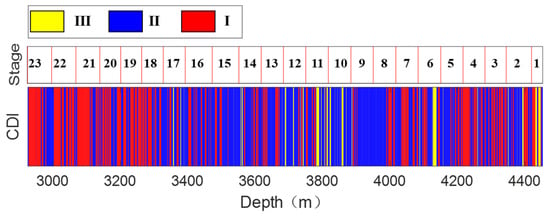
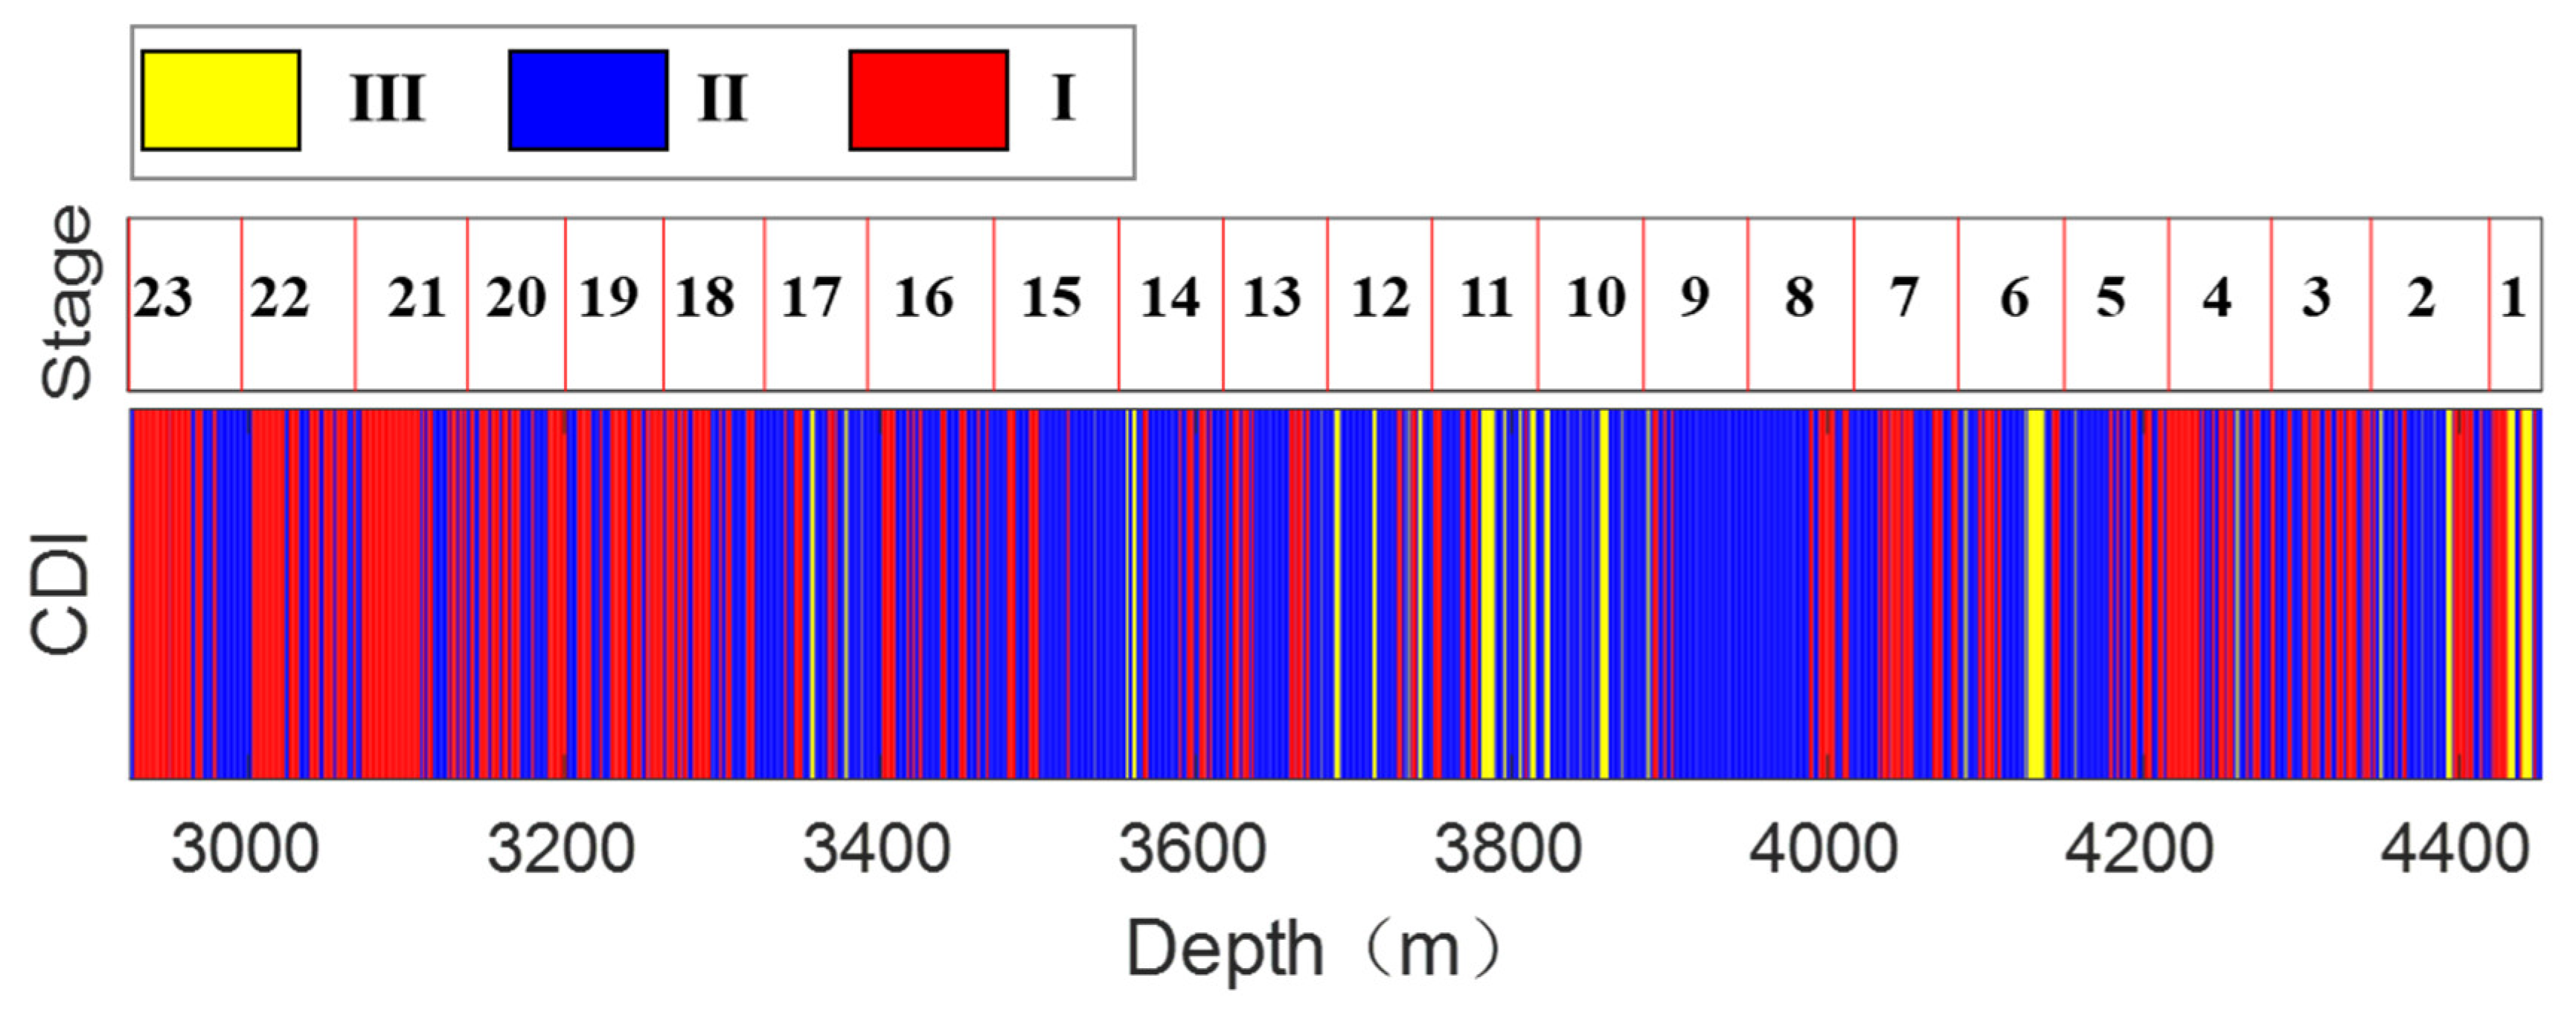
Based on the scoring criteria, the FRAC and Pindex were scored to obtain the score profiles along the wellbore profile, as shown in Figure 13 and Figure 14. Eliminating differences in geological properties and fracability within a certain range is beneficial for classification. It can be observed that, in the red zones indicating good fracability, medium-to-poor geological property indices are present, revealing a disconnection between the two parameters. The staged results integrating geological and engineering sweet spots are presented in Figure 15. Red zones indicate optimal fracturing stages geologically and engineering-wise. Areas scoring six points or higher are labeled red and classified as class I segments; zones scoring at least two but less than six points are designated in blue as class II segments; sections below two points are assigned yellow, indicating class III segments.
Figure 13.
Geological sweet (GS) spot distribution along the horizontal wellbore.
Figure 14.
Engineering sweet (ES) spot distribution along the horizontal wellbore.
Figure 15.
Composite dessert index (CDI) distribution along the horizontal wellbore.
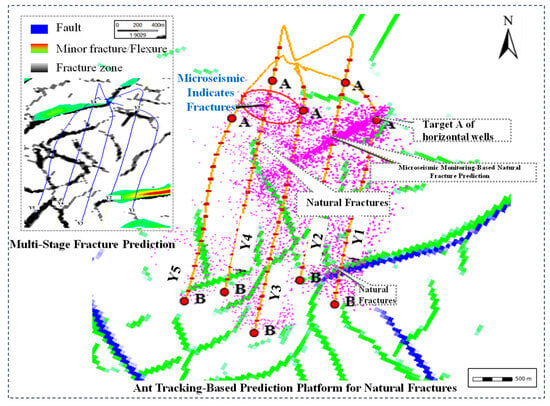
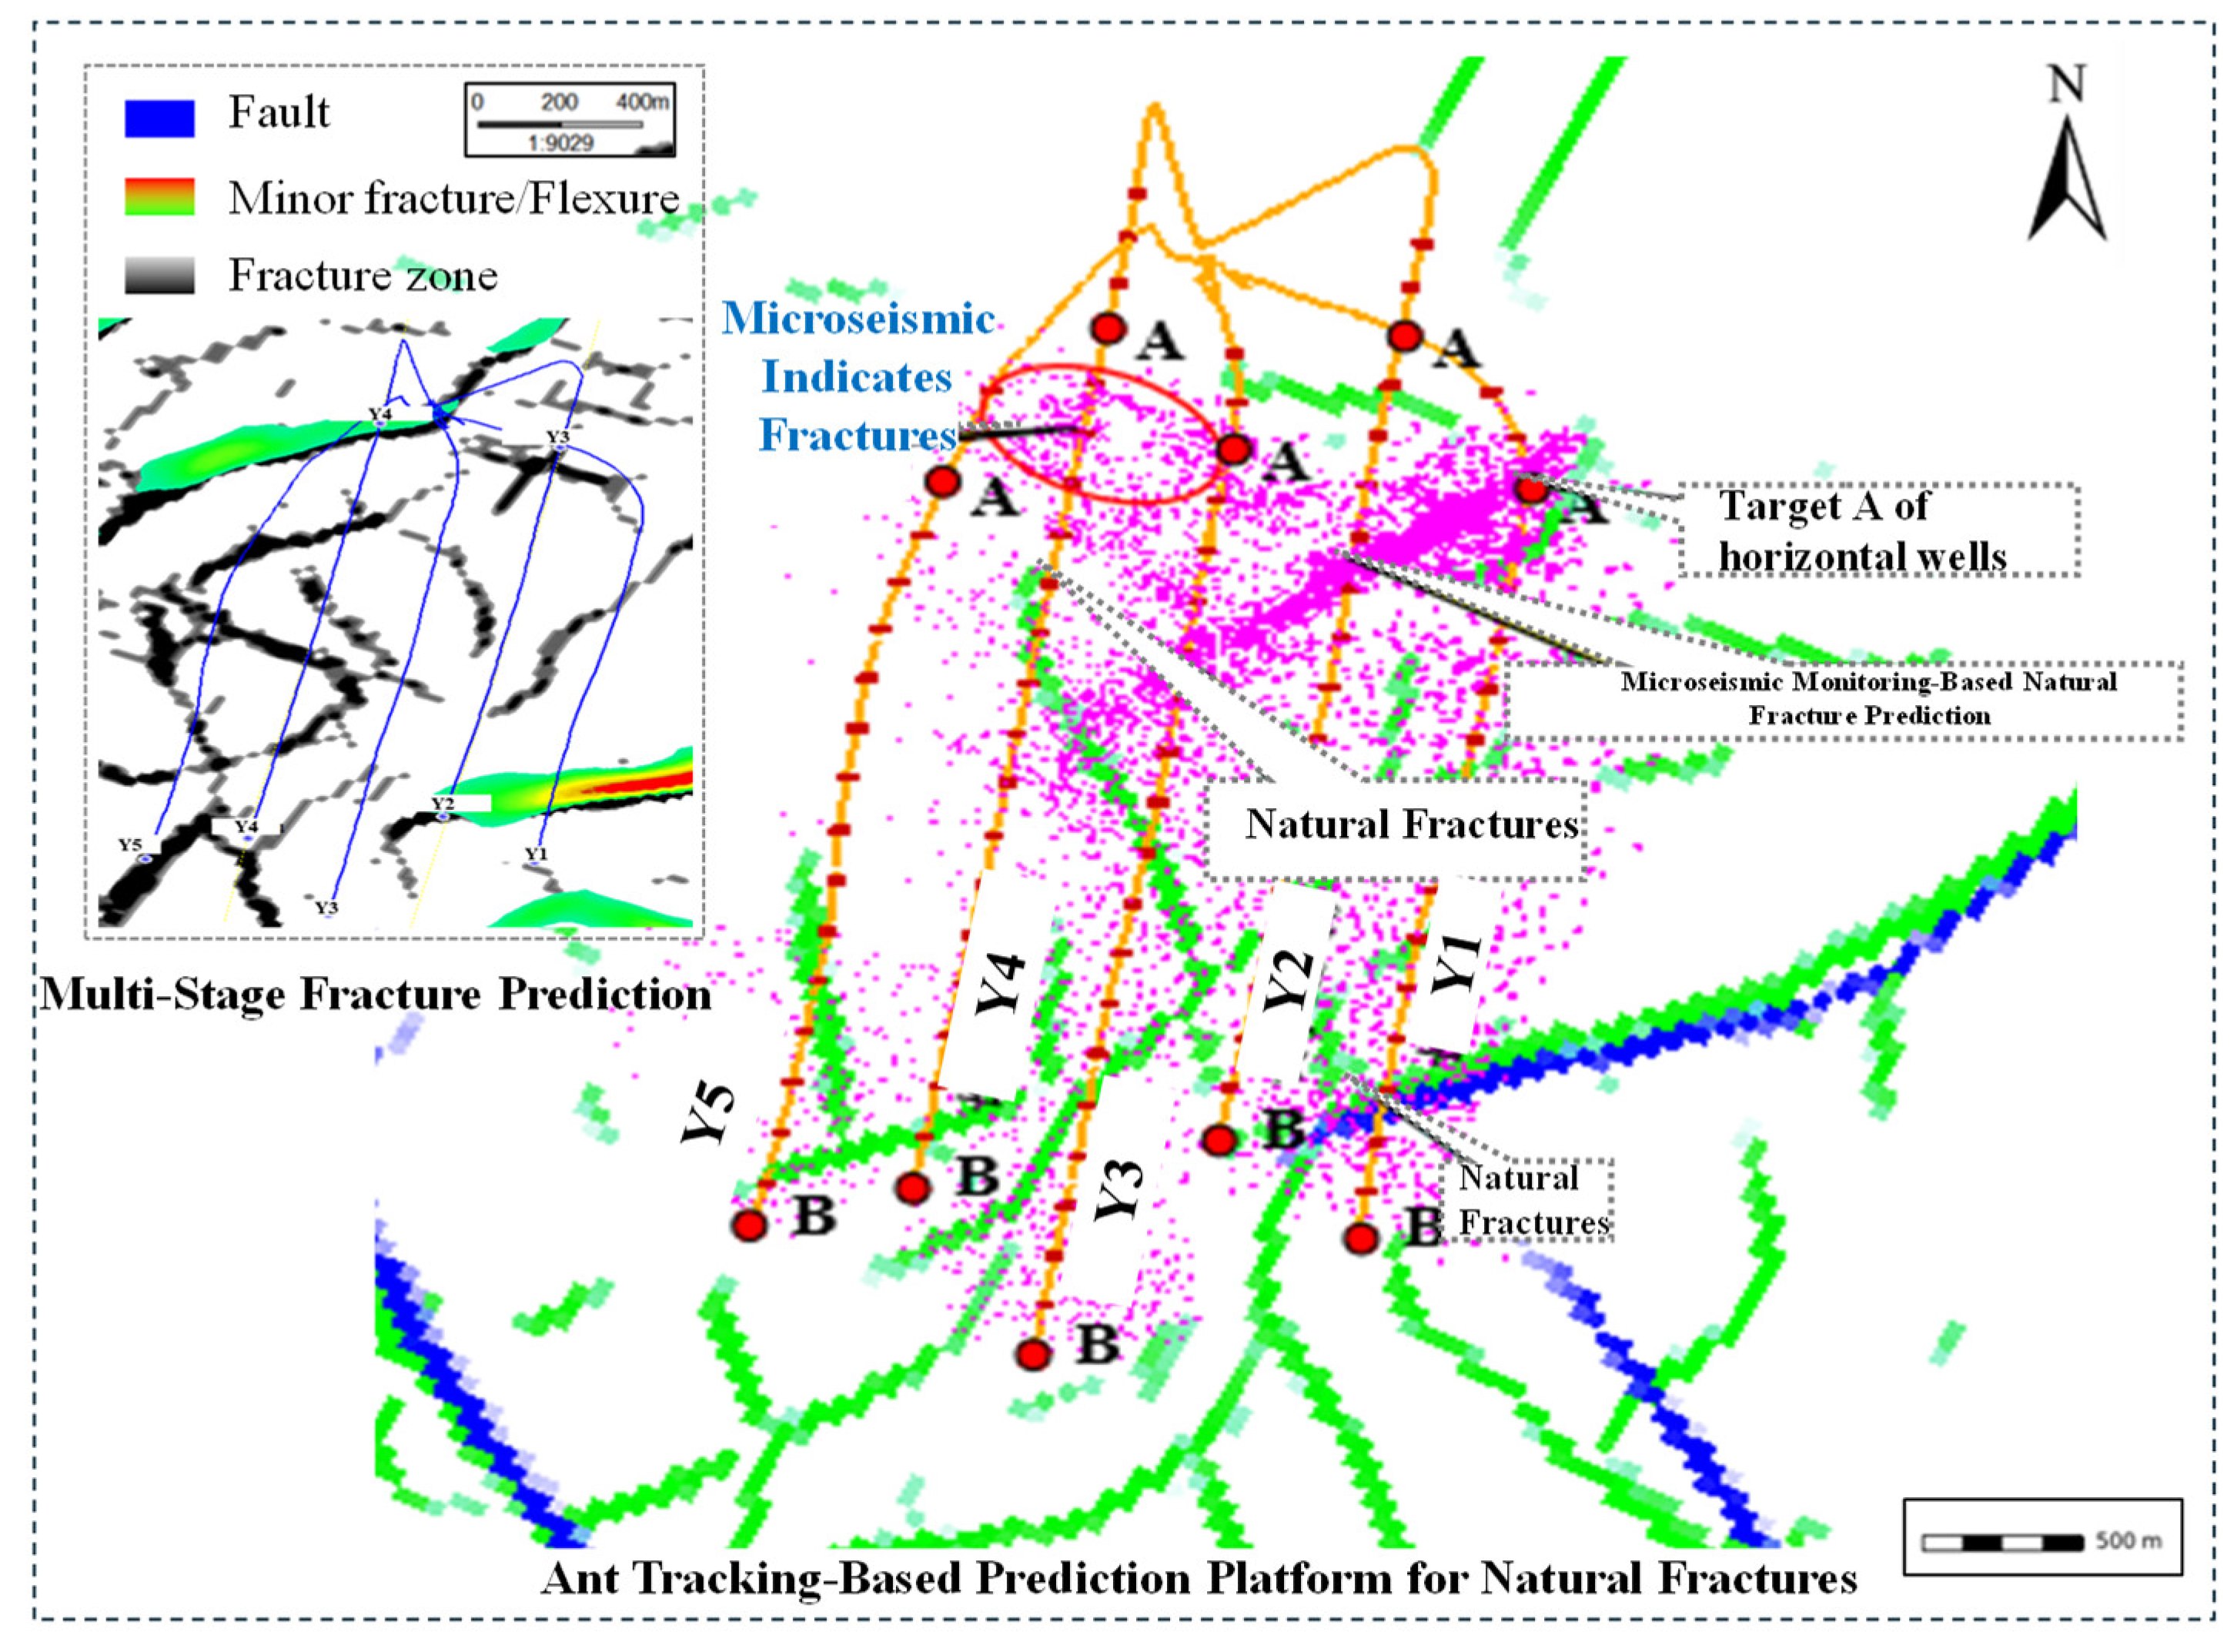
In the development of unconventional reservoirs, regardless of lithology, the detailed characterization of natural fracture systems and their role during hydraulic fracturing—serving as hydrocarbon flow pathways while potentially causing ineffective fracturing fluid loss or interwell interference—represents a common and critical research topic [40]. Fracture risk analysis was conducted employing the Petrel R2020 software platform. As depicted in Figure 16, natural fracture development was determined by overlaying microseismic events from legacy wells Y1, Y2, and Y3 with seismic-predicted fractures, combined with drilled flexural or curvature anomaly mapping. Adjacent casing deformation zones correspond to stages 6–9 in well Y4. Integrated analysis incorporating natural fracture predictions, microseismic monitoring, and offset well fracturing data reveals significant fracture development across stages 2, 3, 5 through 9, 11, 12, 15, 16, and 20 through 23, while identifying fracture-driven interference risks in two distinct patterns: first in stages 6 to 13 and 19 to 21 determined by lateral/vertical proximity to legacy wells and subsequently confirmed in stages 6 to 15 and 19 to 21 through combined evaluation of natural fracture networks and interwell distance assessments.
Figure 16.
Combined map modified fromthe map of microseismic events and fracture distribution for the fracturing pad of Well Y in the Changning Shale Gas Block [41].
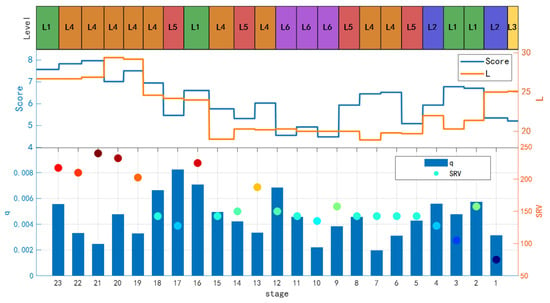
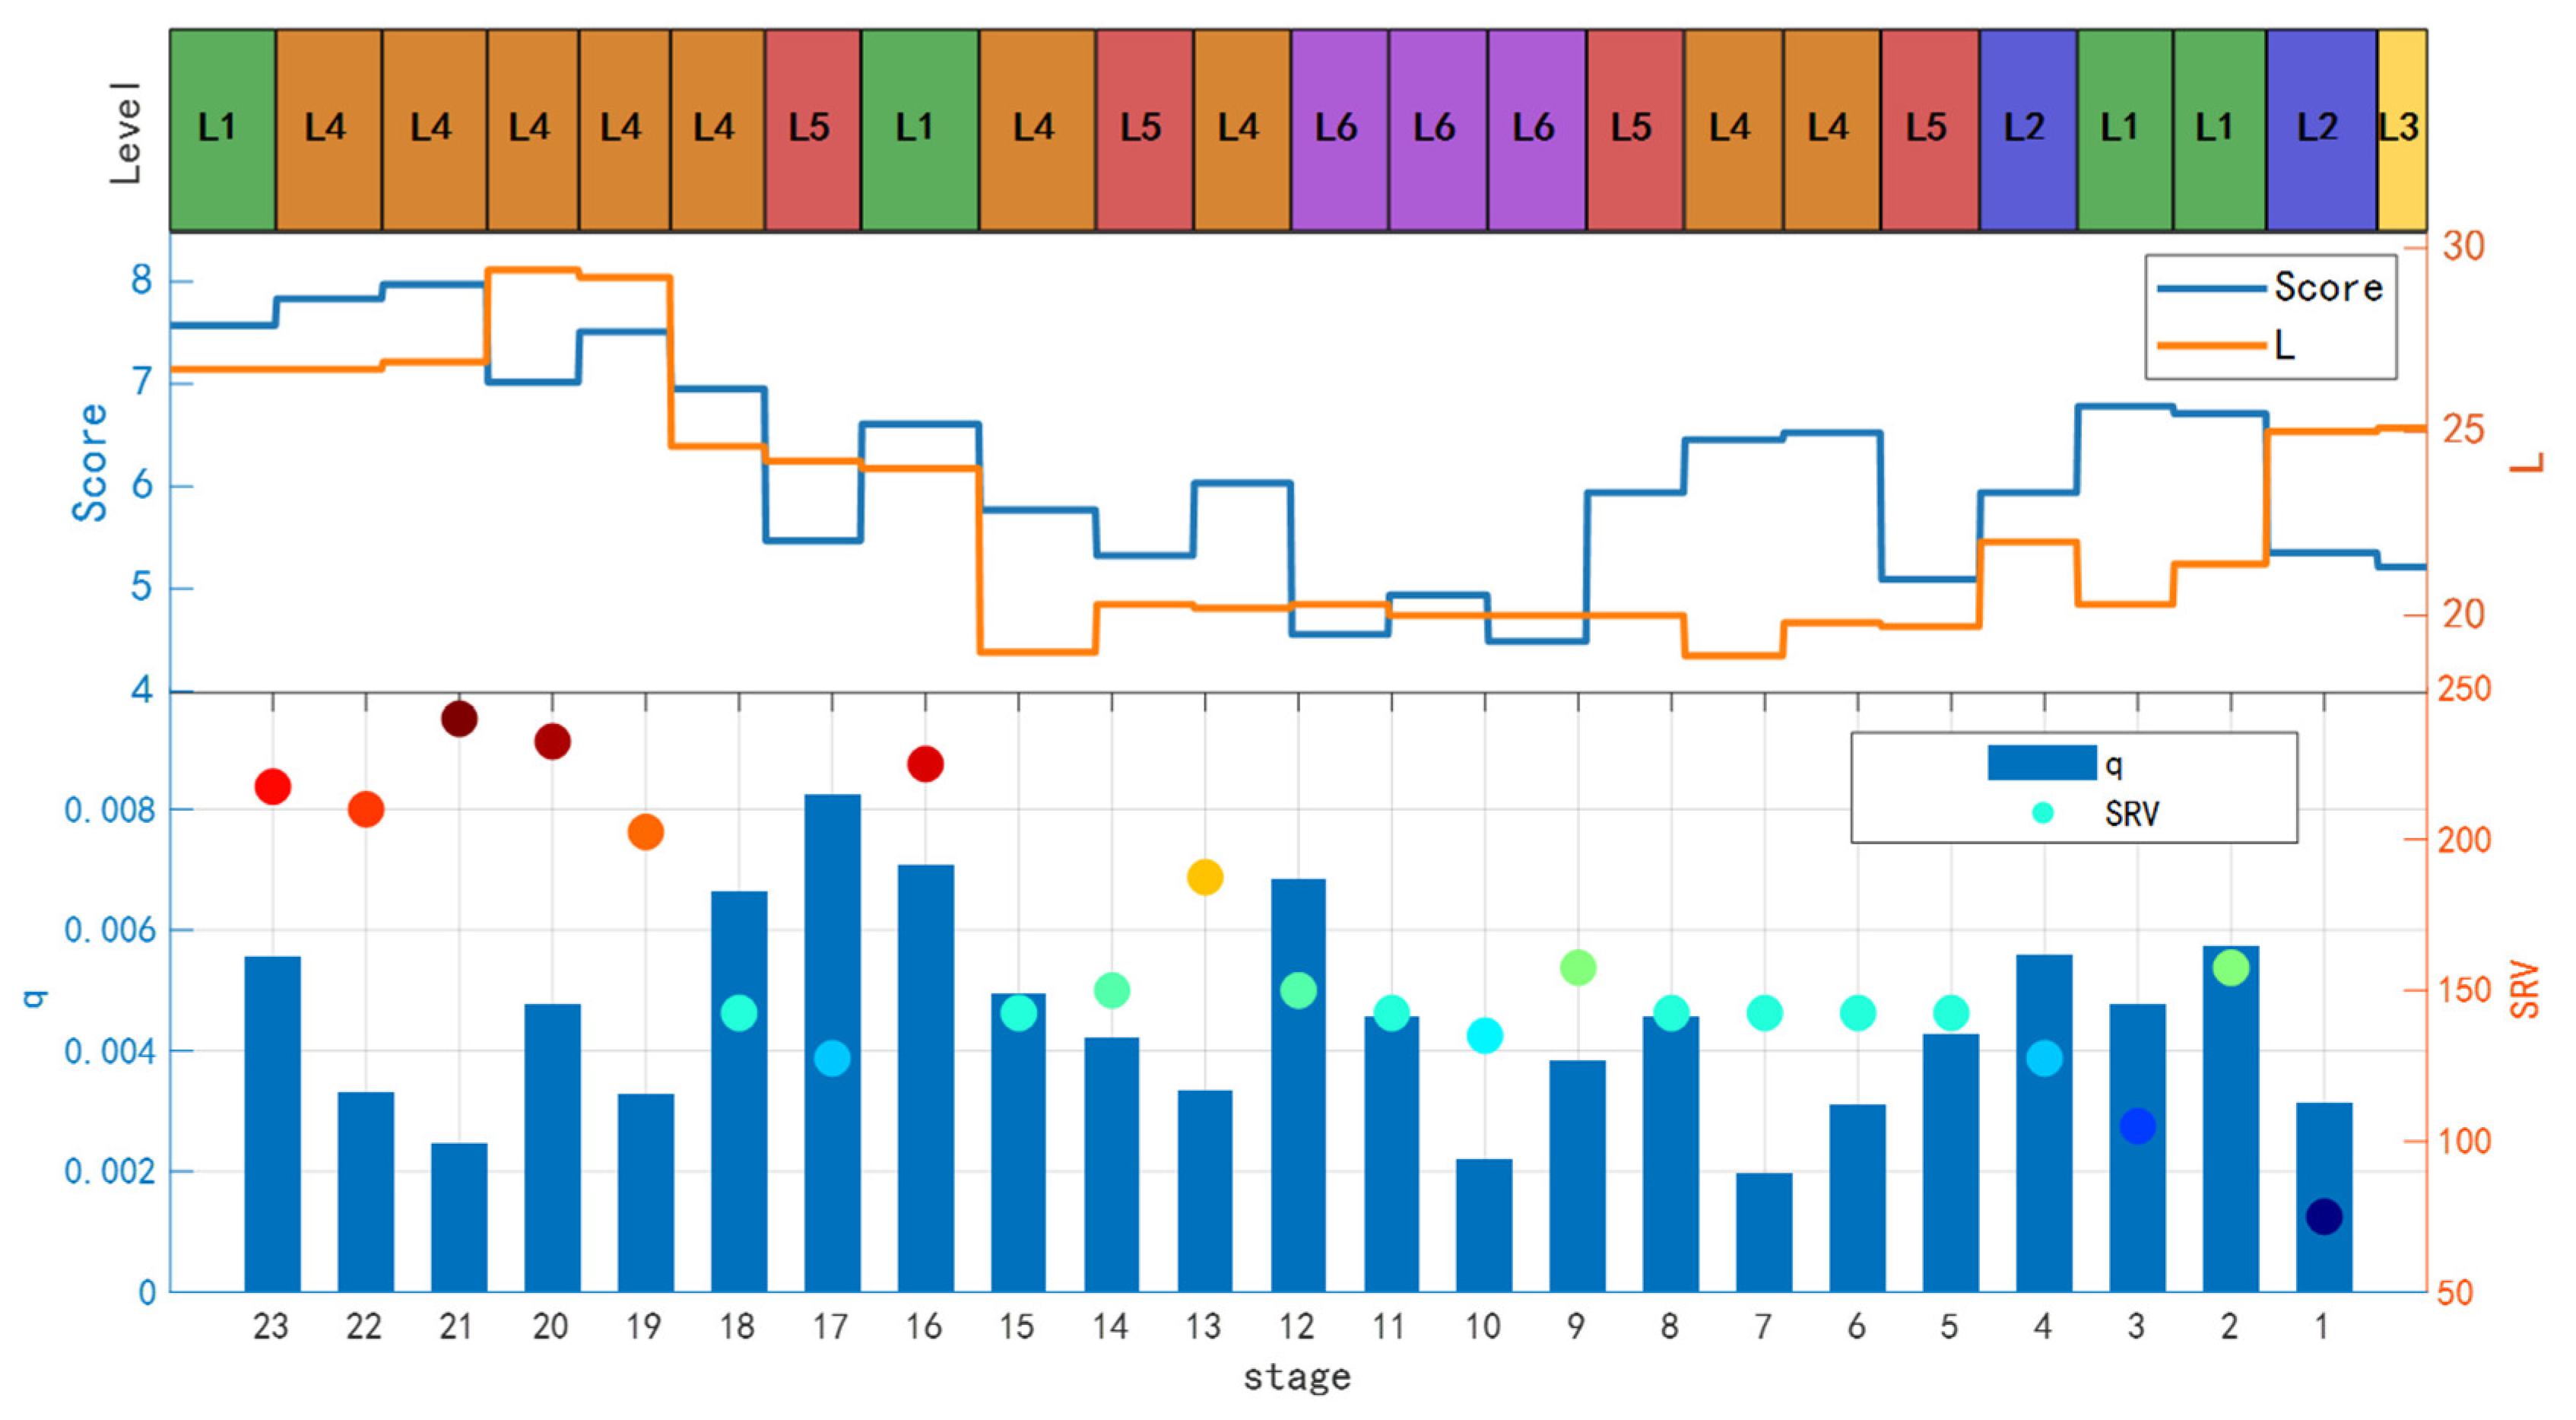
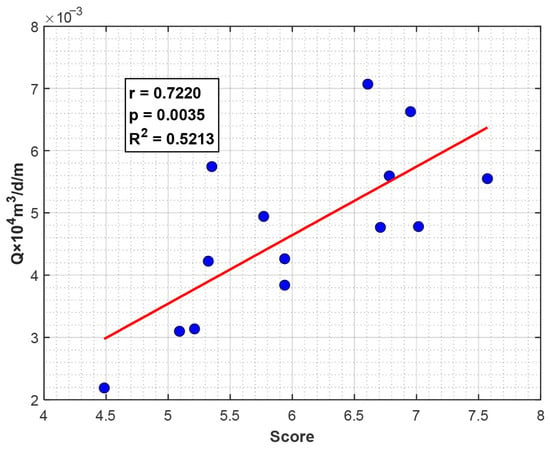
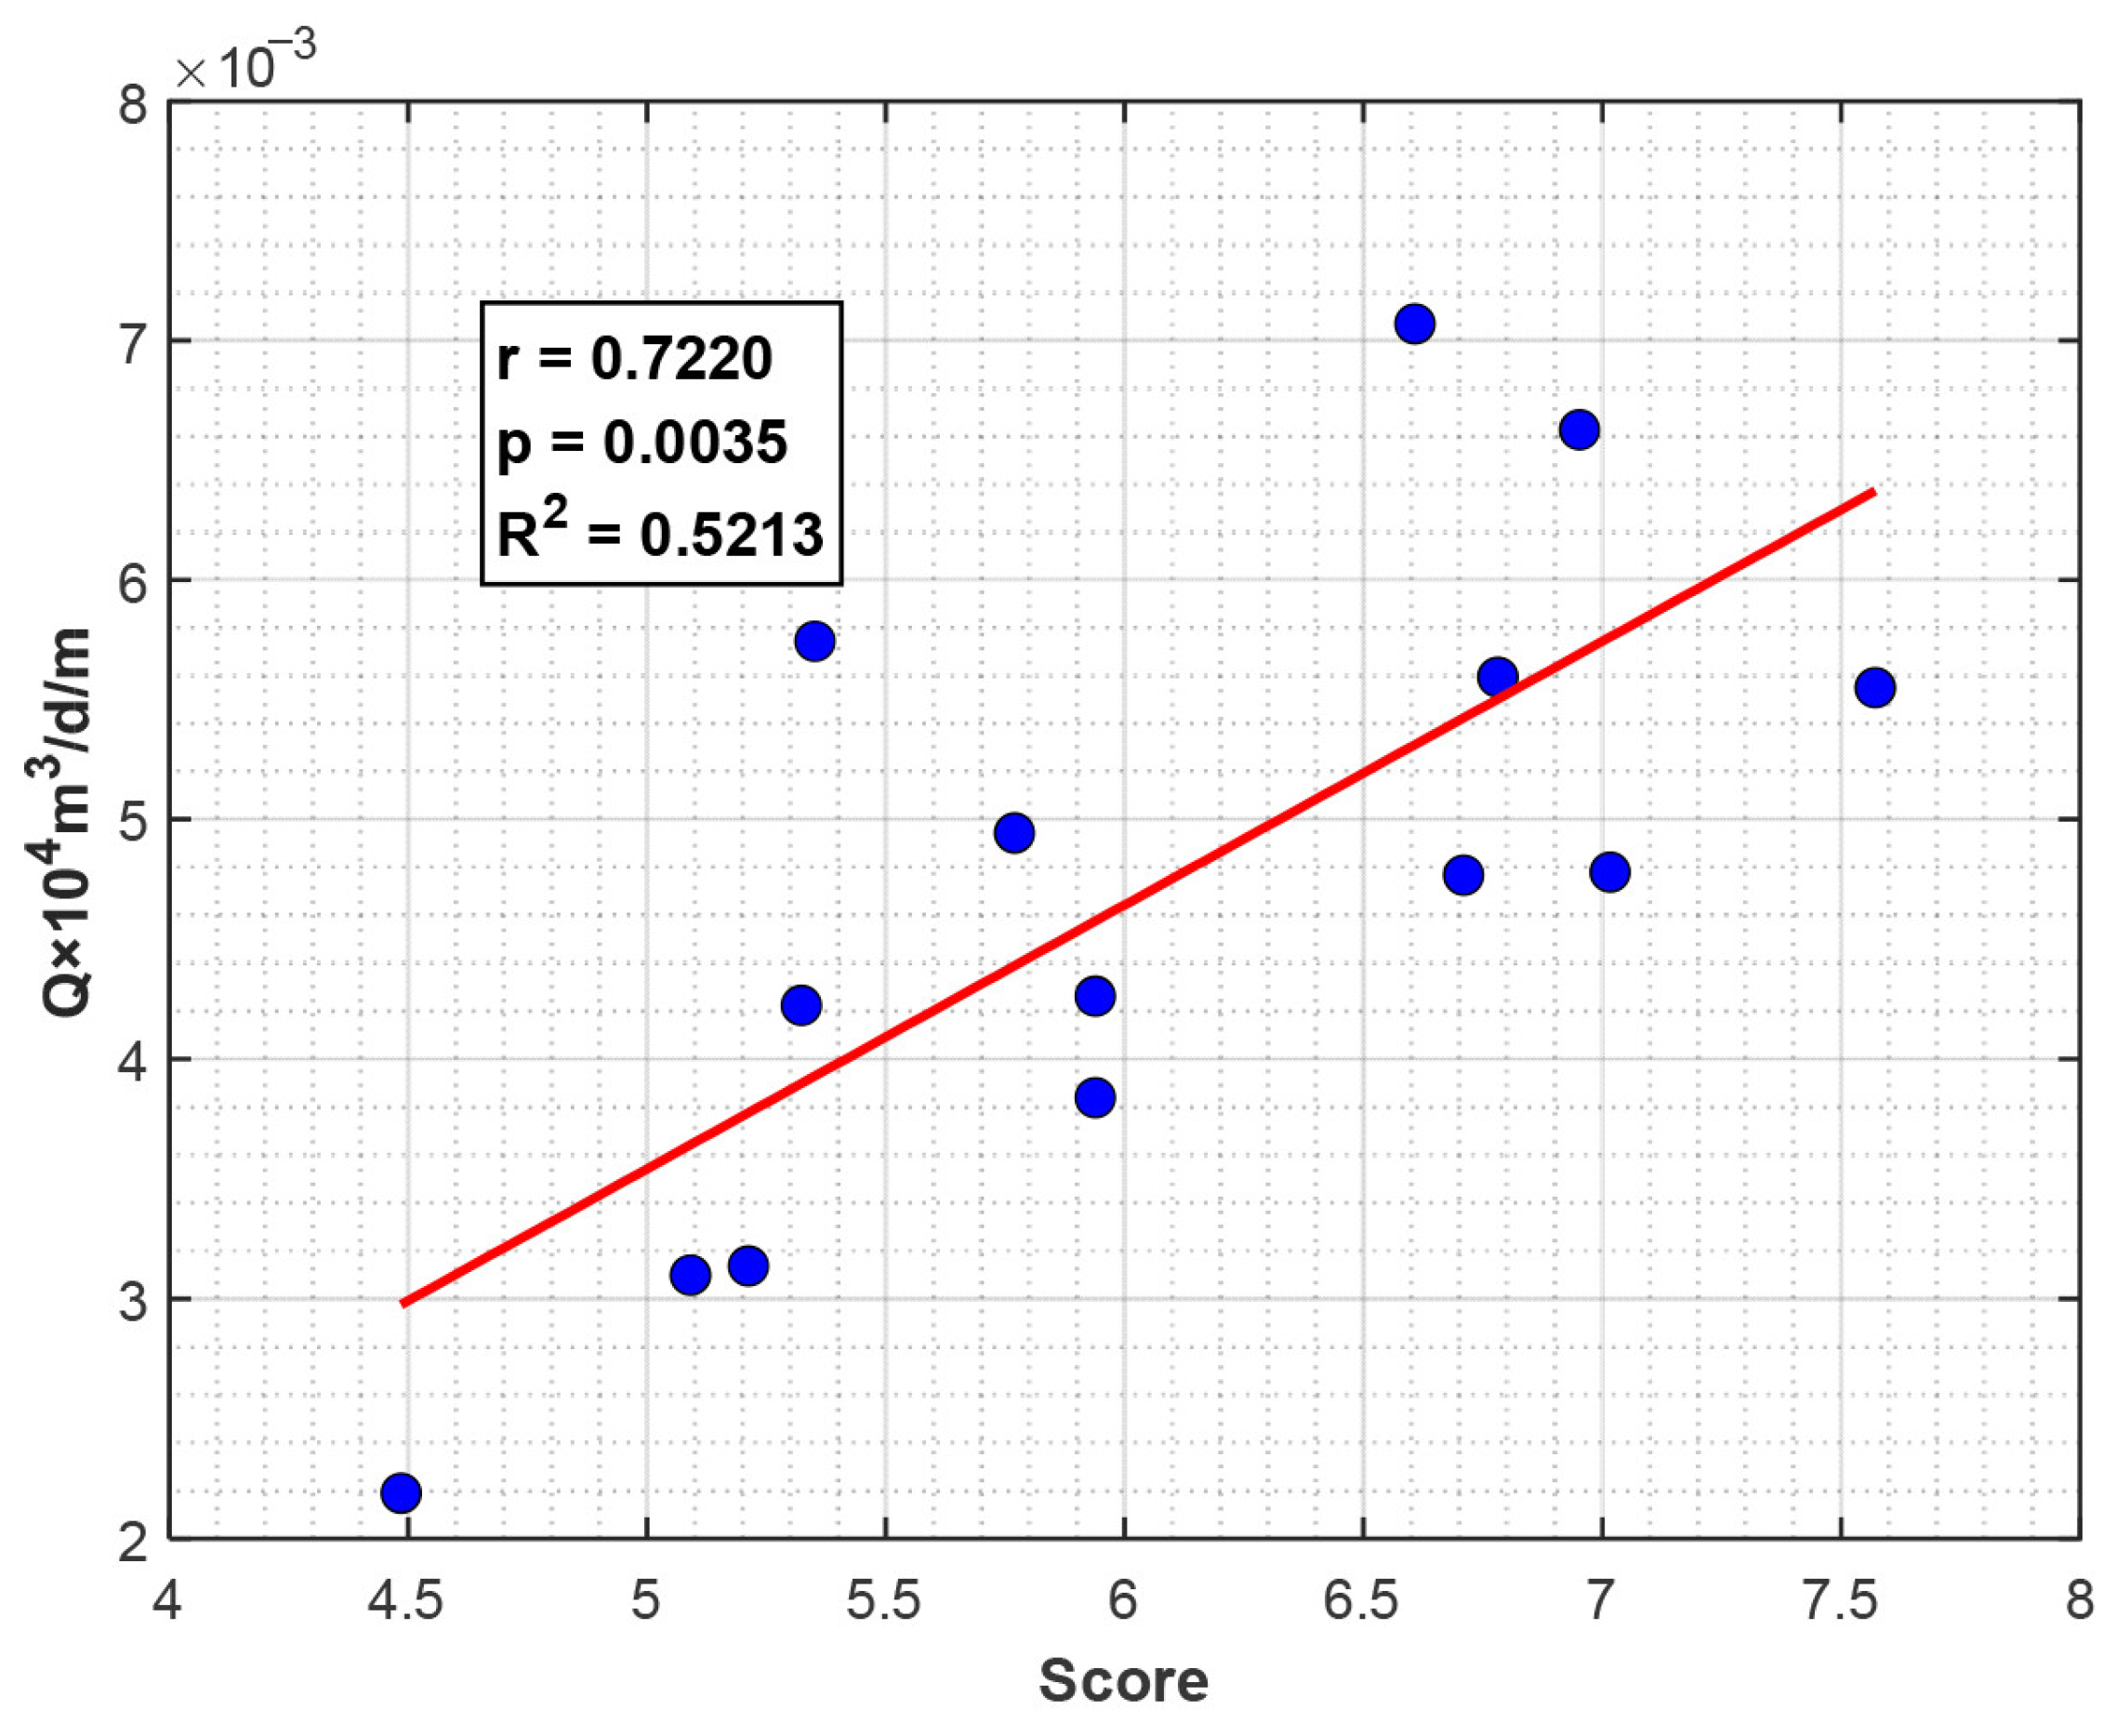
As illustrated in Figure 17 and Figure 18, analysis across 23 designed fracturing stages reveals that dual sweet spot model performance scores classify outcomes as poor below 5.2, good above 6.6, and fair for intermediate values. Correspondingly, tracer-monitored production thresholds define poor performance below 0.031 × 10⁴ m3/d/m and good above 0.047 × 10⁴ m3/d/m, with intermediate results designated as fair. Stages 1, 2–6, 9, 10, 14–16, 18, 20, and 23 demonstrate strong correlations where higher-scoring segments exhibit elevated tracer production, consistently aligning with actual gas production profiles. Observed discrepancies primarily originate from fracture-driven interference, exemplified by stage 1 which achieved category II fair scoring yet delivered good production through elevated fluid volume implementation. Gas tracer diagnostics combined with offset well pressure responses confirm specific stage-to-well connectivity, identifying stages 7, 8, 11, 13, and 17 as linking to well 5 while stages 19, 21, and 22 connect to well 6. Sweet spot predictions demonstrate high accuracy in non-interfered stages, though stage 8 requires implementation of category I anti-interference measures alongside enhanced stimulation intensity, whereas stage 12 exhibits rapid production decline absent interference and consequently necessitates fluid volume augmentation.
Figure 17.
Tracer monitoring results, microseismic monitoring, and six-tier classification of infill well stages for well Y4.
Figure 18.
Correlation analysis between score and gas production per meter for stages 1–6, 9, 10, 14–16, 18, 20, and 23.
As illustrated in Figure 17, we use boxes filled with different colors to represent the levels L1 to L6. L1, L2, L3, L4, L5, and L6 are represented by green, blue, yellow, orange, red, and purple, respectively. This pilot well’s fracturing stages are classified into six types (L1–L6) based on interference risk and sweet spot evaluation: sweet spot categories I–III under low interference risk correspond to L1–L3, while high-risk counterparts correspond to L4–L6. For L1/L2 stages, maximize the stimulation scale using high-rate/high-fluid-intensity treatments to fracture undeveloped zones; for L3/L4 stages, moderately control fluid volume while enhancing balanced lateral extension; for L5/L6 stages, further restrict fluid intensity (Table 4). Differentiated fracturing designs are implemented by grouping intervals with similar reservoir/engineering parameters according to dual sweet spot/risk assessments, including: reducing treatment scale for short fractures, decreasing injection rates in naturally fractured zones, enhancing diverter efficiency for asymmetric half-lengths through real-time monitoring adjustments, and dynamically optimizing parameters. This methodology significantly improves stimulation effectiveness and provides critical guidance for tailored infill well completions across the block.
Table 4.
Definition and fracturing design strategy for the six-tier classification (L1–L6) of infill well stages.
4. Conclusions
In this paper, a practical sweet spot evaluation method for shale gas infill wells is proposed for horizontal wells in shale gas reservoirs. The key conclusions are as follows:
- (1)
- A quantitative fracability evaluation index has been established based on rock mechanics parameters, net pressure, and brittleness. The indicator can quantitatively assess the fracability along the horizontal section.
- (2)
- A geological property index model considering the weighting effects of reservoir quality indicators has been established for geological sweet spot evaluation. Simultaneously, a comprehensive evaluation and grading method integrating both geological and fracability assessments has been developed, which enables the precise identification of fracturing sweet spots along horizontal well sections.
- (3)
- Field application in pilot well Y4 of the Changning block indicates that the proposed sweet spot evaluation scores exhibit a strong correlation with tracer-measured gas production in non-interfered intervals, verifying the reliability of its predictive capability. For sections affected by fracture interference, the mismatches between evaluation results and production performance were analyzed, and a six-level stage classification system (L1–L6) was established by integrating sweet spot types and interference risks.
Author Contributions
Conceptualization, Y.L.; methodology, Y.X., L.L., H.Z., X.L.; C.W., R.W., H.L. (Hengbao Li), H.L. (Hong Liu), Y.L.; software, J.Z.; formal analysis, L.L.; investigation, J.Z.; H.L. (Hengbao Li), H.Z.; R.W.; resources, C.W.; writing—original draft preparation, Y.X.; writing—review and editing, Y.L.; supervision, H.L. (Hong Liu); project administration, X.L.; funding acquisition, H.L. (Hong Liu). All authors have read and agreed to the published version of the manuscript.
Funding
The paper is supported by National Natural Science Foundation of China (52274033) and the Science and Technology Research Program of Chongqing Municipal Education Commission (Grant No. KJQN202301514).
Data Availability Statement
The original contributions presented in this study are included in the article. Further inquiries can be directed to the corresponding author.
Conflicts of Interest
Authors Yongjun Xiao, Chunlin Wu, Lei Liu, Ran Wen, Jian Zheng, and Xin Luo were employed by the company Sichuan Changning Natural Gas Development Company Limited, while the author Hao Zhao was employed by the PetroChina Southwest Oil & Gasfield Company. The remaining authors declare that the research was conducted in the absence of any commercial or financial relationships that could be construed as a potential conflict of interest. The Sichuan Changning Natural Gas Development Company Limited and PetroChina Southwest Oil & Gasfield Company had no role in the design of the study; in the collection, analyses, or interpretation of data; in the writing of the manuscript, or in the decision to publish the results.
Abbreviations
| TOC | Total Organic Carbon |
| AHP | Analytic Hierarchy Process |
| SRV | Stimulated Reservoir Volume |
| ESS | Engineering Sweet Spot |
| GSS | Geological Sweet Spot |
| FRAC | Fracability Index |
| Pindex | Geological Property Index |
| CI | Consistency Index |
| RI | Random Index |
| CDI | Composite Dessert Index |
References
- Yang, B.; Zhang, H.; Kang, Y.; You, L.; She, J.; Wang, K.; Chen, Z. In Situ Sequestration of a Hydraulic Fracturing Fluid in Longmaxi Shale Gas Formation in the Sichuan Basin. Energy Fuels 2019, 33, 6983–6994. [Google Scholar] [CrossRef] [Scilit]
- Meng, H.; Ge, H.; Fu, D.; Wang, X.; Shen, Y.; Jiang, Z.; Wang, J. Numerical investigation of casing shear deformation due to fracture/fault slip during hydraulic fracturing. Energy Sci. Eng. 2020, 8, 3588–3601. [Google Scholar] [CrossRef] [Scilit]
- Zhan, J.; Lu, J.; Fogwill, A.; Ulovich, I.; Cao, J.P.; He, R.; Chen, Z. An integrated numerical simulation scheme to predict shale gas production of a multi-fractured horizontal well. In Proceedings of the Abu Dhabi International Petroleum Exhibition and Conference (ADIPEC), Abu Dhabi, United Arab Emirate, 13–16 November 2017; SPE: Richardson, TX, USA, 2017; D031S087R002. [Google Scholar]
- Tan, Y.; Li, Q.; Xu, L.; Ghaffar, A.; Zhou, X.; Li, P. A critical review of carbon dioxide enhanced oil recovery in carbonate reservoirs. Fuel 2022, 328, 125256. [Google Scholar] [CrossRef] [Scilit]
- Wang, K.; Li, H.; Wang, J.; Jiang, B.; Bu, C.; Zhang, Q.; Luo, W. Predicting production and estimated ultimate recoveries for shale gas wells: A new methodology approach. Appl. Energy 2017, 206, 1416–1431. [Google Scholar] [CrossRef] [Scilit]
- Cipolla, C.L.; Weng, X.; Onda, H.; Nadaraja, T.; Ganguly, U.; Malpani, R. New algorithms and integrated workflow for tight gas and shale completions. In Proceedings of the SPE Annual Technical Conference and Exhibition, Denver, CO, USA, 30 October–2 November 2021; Society of Petroleum Engineers: Richardson, TX, USA, 2011. [Google Scholar]
- Maity, D.; Ciezobka, J. Using microseismic frequency-magnitude distributions from hydraulic fracturing as an incremental tool for fracture completion diagnostics. J. Pet. Sci. Eng. 2019, 176, 1135–1151. [Google Scholar] [CrossRef] [Scilit]
- Patterson, R.; Yu, W.; Wu, K. Integration of microseismic data, completion data, and production data to characterize fracture geometry in the Permian Basin. J. Nat. Gas Sci. Eng. 2018, 56, 62–71. [Google Scholar] [CrossRef] [Scilit]
- Waters, G.; Weng, X. The Impact of Geomechanics and Perforations on Hydraulic Fracture Initiation and Complexity in Horizontal Well Completions. In Proceedings of the SPE Annual Technical Conference and Exhibition, Dubai, United Arab Emirates, 26–28 September 2016; Society of Petroleum Engineers: Richardson, TX, USA, 2016. [Google Scholar] [CrossRef] [Scilit]
- Atanayev, A.; Nadezhdin, S.; Zeidi, O.A.; Batmaz, T.; Kurnaidi, S.D. An Advanced Workflow for Determining Fracture Geometry in Complex, Shale gas Formations in the Sultanate of Oman. In Proceedings of the SPE/IADC Middle East Drilling Technology Conference and Exhibition, Abu Dhabi, United Arab Emirates, 26–28 January 2016; Society of Petroleum Engineers: Richardson, TX, USA, 2016. [Google Scholar] [CrossRef] [Scilit]
- Rickman, R.; Mullen, M.J.; Petre, J.E.; Grieser, W.V.; Kundert, D. A Practical Use of Shale Petrophysics for Stimulation Design Optimization: All Shale Plays Are Not Clones of the Barnett Shale. In Proceedings of the SPE Annual Technical Conference and Exhibition, Denver, CO, USA, 21–24 September 2008; Society of Petroleum Engineers: Richardson, TX, USA, 2008. [Google Scholar]
- Jin, X.; Shah, S.N.; Roegiers, J.C.; Zhang, B. Fracability evaluation in shale reservoirs-an integrated petrophysics and geomechanics approach. In Proceeding of the SPE Hydraulic Fracturing Technology Conference, The Woodlands, TX, USA, 4–6 February 2014; Society of Petroleum Engineers: Richardson, TX, USA, 2014. [Google Scholar]
- Guo, Z.; Li, X.-Y.; Liu, C.; Feng, X.; Shen, Y. A shale rock physics model for analysis of brittleness index, mineralogy and porosity in the Barnett Shale. J. Geophys. Eng. 2013, 10, 025006. [Google Scholar] [CrossRef] [Scilit]
- Yuan, J.; Zhou, J.; Liu, S.; Feng, Y.; Deng, J.; Xie, Q.; Lu, Z. An Improved Fracability-Evaluation Method for Shale Reservoirs Based on New Fracture Toughness-Prediction Models. SPE J. 2017, 22, 1704–1713. [Google Scholar] [CrossRef] [Scilit]
- Weng, D.W.; Zhang, Q.H.; Guo, Z.Y.; Zheng, L.H.; Liang, H.B.; Liu, Z. Multi-stage and cluster fracturing design in horizontal wells for shale gas production. J. China Univ. Pet. (Ed. Nat. Sci.) 2015, 39, 117–123. [Google Scholar]
- Wang, H.; Jiang, T.; Li, Y.; Bian, X.; Hua, J. Method for Fracturing Stage and Cluster Optimization in Shale Gas Horizontal Well. Xinjiang Pet. Geol. 2016, 37, 218–221. [Google Scholar]
- Shen, C.; Ren, L.; Zhao, J.; Tan, X.; Wu, L. A comprehensive evaluation index for shale reservoirs and its application: A case study of the Ordovician Wufeng Formation to Silurian Longmaxi Formation in southeastern margin of Sichuan Basin, SW China. Pet. Explor. Dev. 2017, 44, 686–695. [Google Scholar] [CrossRef] [Scilit]
- Lu, C.; Jiang, H.; Qu, S.; Zhang, M.; He, J.; Xiao, K.; Yang, H.; Yang, J.; Li, J. Hydraulic fracturing design for shale oils based on dessert mapping: A case study of the Jimusar formation in China. J. Pet. Sci. Eng. 2022, 214, 110568. [Google Scholar] [CrossRef] [Scilit]
- Li, L.; Wang, B.; Ge, H.; Zhou, H.; Wang, Y.; Zhang, L.; Zhou, F. The intelligent optimization of perforation cluster locations incorporating the fiber optics monitoring results. Phys. Fluids 2023, 35, 126605. [Google Scholar] [CrossRef] [Scilit]
- Xia, K.; Wang, W.; Cui, Y. Identifying perforation locations for hydraulic fracturing treatment in deep and tight sandstone gas reservoirs. Rock Mech. Bull. 2024, 3, 100131. [Google Scholar] [CrossRef] [Scilit]
- Zeng, F.; Gong, G.; Zhang, Y.; Guo, J.; Jiang, J.; Hu, D.; Chen, Z. Fracability evaluation of shale reservoirs considering rock brittleness, fracture toughness, and hydraulic fracturing-induced effects. Geoenergy Sci. Eng. 2023, 229, 212069. [Google Scholar] [CrossRef] [Scilit]
- Li, Y.; Zhou, F.; Li, Y.; Zhang, K.; Chen, T.; Zhou, L.; Li, B. Engineering sweet spot evaluation of deep coal seam: Algorithm construction and application integrated with geological sweet spot—A case study in Ordos basin, China. SPE J. 2025, 30, 20. [Google Scholar] [CrossRef] [Scilit]
- Mack, M.G.; Elbel, J.L.; Piggott, A.R. Numerical Representation of Multilayer Fracturing. In Rock Mechanics; Tillerson, J.R., Wawersik, W.R., Eds.; Balkema: Rotterdam, The Netherlands, 1992; ISBN 9054100451. [Google Scholar]
- Guo, S. Rock mechanical parameter modeling of Fuyu shale gas reservoir in Well Block T30 of Daqing Oilfield. Pet. Geol. Oilfield Dev. Daqing. 2020, 39, 169–174. [Google Scholar]
- Zhao, J.; Yang, Z.; Ren, L.; Lin, R.; Yu, Z.; Wu, J.; Song, Y.; Shen, C. Optimized Shale Gas Fracturing Design Based on Three Sweet Spots Identification: A Case Study from the Southern Sichuan Basin. In Proceedings of the Abu Dhabi International Petroleum Exhibition and Conference; SPE: Richardson, TX, USA, 2025. [Google Scholar]
- Moghadam, A.; Harris, N.B.; Ayranci, K.; Gomez, J.S.; Angulo, N.A.; Chalaturnyk, R. Brittleness in the Devonian Horn River shale, British Columbia, Canada. J. Nat. Gas Sci. Eng. 2019, 62, 247–258. [Google Scholar] [CrossRef] [Scilit]
- Leem, J.; Reyna, J. Shale geomechanics: Optimal multi-stage hydraulic fracturing design for shale and shale gas reservoirs. In Proceedings of the ISRM Regional Symposium—EUROCK 2014, Vigo, Spain, 26–28 May 2014; International Society for Rock Mechanics and Rock Engineering: Lisbon, Portugal, 2014. [Google Scholar]
- Fulks, R.; Hughes, S.; Geldmacher, I. Optimizing Unconventional Completions-An Integrated Approach. In Proceedings of the Abu Dhabi International Petroleum Exhibition & Conference, Abu Dhabi, United Arab Emirates, 7–10 November 2016; Society of Petroleum Engineers: Richardson, TX, USA, 2016. [Google Scholar]
- Baker, R.O.; Yarranton, H.W.; Jensen, J. Practical Reservoir Engineering and Characterization; Gulf Professional Publishing: Houston, TX, USA, 2015. [Google Scholar]
- Fang, D.; Ma, W.; Li, X.; Bao, L.; Zhang, F.; Liu, H.; Liu, Y. Identification of ‘Geology–Engineering’ Sweet Spots in Shale Gas Reservoirs Based on the TBO-XGBoost-GAFM Model: A Case Study of the Nanchuan Block in the Sichuan Basin. Processes 2025, 13, 3853. [Google Scholar] [CrossRef] [Scilit]
- Guo, J.C.; Luo, B.; Zhu, H.Y.; Wang, Y.H.; Lu, Q.L.; Zhao, X. Evaluation of fracability and screening of perforation interval for tight sandstone gas reservoir in western Sichuan Basin. J. Nat. Gas Sci. Eng. 2015, 25, 77–87. [Google Scholar] [CrossRef] [Scilit]
- Lu, Y.; Li, H.; Lu, C.; Liu, C.; Chen, Z. An Integrated Approach to Optimize Perforation Cluster Parameters for Horizontal Wells in Shale gas reservoirs. In Proceedings of the SPE/AAPG Eastern Regional Meeting, Pittsburgh, PA, USA, 7–11 October 2018; OnePetro: Richardson, TX, USA, 2018. [Google Scholar]
- Tang, X.; He, Y.; Zhu, H.; Wang, D.; Li, K.; Xiao, J.; Liu, L.; Feng, N.; Kong, F.; Yang, H.; et al. Mechanisms of old well pressure buildup and energy increase by hydraulic fracturing of infill wells in shale gas reservoirs: A case study on Fuling national shale gas demonstration area. Nat. Gas Ind. 2025, 45, 85–97. [Google Scholar]
- Zhao, J.Z.; Chen, X.Y.; Li, Y.M.; Fu, B.; Xu, W. Modeling analysis of multi-stage multi-cluster fracturing in horizontal wells and perforation optimization. Pet. Explor. Dev. 2017, 44, 117–124. [Google Scholar] [CrossRef] [Scilit]
- Economides, M.J.; Nolte, K.G. Reservoir Stimulation, 3rd ed.; Wiley: Hoboken, NJ, USA, 2000; Available online: https://books.google.com.sg/books?id=rDlQAQAAIAAJ&hl=zh-CN&source=gbs_book_other_versions (accessed on 13 April 2026).
- Passey, Q.R.; Creaney, S.; Kulla, J.B.; Moretti, F.J.; Stroud, J.D. A practical model for organic richness from porosity and resistivity logs. AAPG Bull. 1990, 74, 1777–1794. [Google Scholar] [CrossRef] [Scilit]
- Franek, J.; Kresta, A. Judgment Scales and Consistency Measure in AHP. Mult. Criteria Decis. Mak. 2014, 9, 7–21. [Google Scholar] [CrossRef] [Scilit]
- Jiang, M.; Peng, C.; Wu, J.; Wang, Z.; Liu, Y.; Zhao, B.; Zhang, Y. A New Approach to a Fracturing Sweet Spot Evaluation Method Based on Combined Weight Coefficient Method—A Case Study in the BZ Oilfield, China. Processes 2024, 12, 1830. [Google Scholar] [CrossRef] [Scilit]
- Gou, Q.-Y.; Shang, X.; Fang, H.; Shu, Z.-G.; Yang, G.; Lu, Y.-B.; Zhang, A.-H.; Wang, Y.-X.; Cheng, X.; Qing, J.-W.; et al. A comprehensive evaluation index of gas-bearing property of shale reservoirs based on grey relation and its application: Case study of Jiaoshiba area, Sichuan Basin. Nat. Gas Geosci. 2019, 30, 1045–1052. [Google Scholar]
- El Mahdy, M.; Fagelnour, M. Application of structural seismic attributes for the determination of the polygonal faults in unconventional carbonate reservoir. In Proceedings of the Eastern Mediterranean Mega-Basin: New Data, New Ideas and New Opportunities, Alexandria, Egypt, 25 September 2019. [Google Scholar]
- Zheng, J.; He, Y.; Wang, Y.; Cai, J.; Tang, X.; Zhu, H. Propagation and optimization of complex fractures of shale gas wells based on FEM-DFN: Taking horizontal well group X1 in Changning shale gas reservoir as an example. Fault-Block Oil Gas Field 2024, 31, 415–423. [Google Scholar]

Disclaimer/Publisher’s Note: The statements, opinions and data contained in all publications are solely those of the individual author(s) and contributor(s) and not of MDPI and/or the editor(s). MDPI and/or the editor(s) disclaim responsibility for any injury to people or property resulting from any ideas, methods, instructions or products referred to in the content. |
© 2026 by the authors. Licensee MDPI, Basel, Switzerland. This article is an open access article distributed under the terms and conditions of the Creative Commons Attribution (CC BY) license.