Abstract
This study presents an integrated, open-source process simulation for converting agricultural biogas into high-purity liquid hydrogen using DWSIM (Distillation, Water, Separation and Inorganic Modules), an open-source sequential-modular simulator. The model simulates a farm-scale biogas feed and is optimised to enhance liquid hydrogen yield while reducing specific energy consumption under set operating conditions. The proposed model links biogas upgrading via dual pressure swing adsorption, steam–methane reforming, two-stage water–gas shift, hydrogen purification, and cryogenic liquefaction within a single optimisation framework. Using a representative farm-scale feed (103.7 kg h−1 biogas containing 60 mol% CH4), the optimised process produces 16.5 kg h−1 of liquid hydrogen with 99.2% para-hydrogen purity while simultaneously capturing 104 kg h−1 of CO2 at 98% purity and 16 bar. Optimal operating conditions include SMR at 909 °C and 16 bar with a steam-to-carbon ratio of 3.0, followed by high- and low-temperature water–gas shifts at 413 °C and 210 °C, respectively. The overall cold-gas efficiency (LHV basis, excluding liquefaction electricity) reaches 78%, and the specific electricity demand for liquefaction is 32.4 kWh per kg of liquid hydrogen, which is consistent with reported values for small-scale hydrogen liquefiers. Sensitivity analysis over a methane content range of 40–75% confirms near-linear scalability of hydrogen output (R2 = 0.998), demonstrating feedstock flexibility without re-parameterisation. The developed process in this work provides a transparent and extensible digital twin for early-stage design and optimisation of decentralised biogas-to-hydrogen systems. Using the open-source DWSIM platform ensures full transparency, reproducibility, and accessibility compared with proprietary simulators.
1. Introduction
The decarbonisation of energy systems requires low-carbon fuels capable of serving sectors that are difficult to electrify, including heavy transport, industrial heat, and long-duration energy storage. Hydrogen is widely recognised as a promising energy carrier in this context, as its utilisation in fuel cells or combustion systems produces no direct carbon emissions. However, more than 90% of global hydrogen production is still derived from fossil resources, predominantly via steam–methane reforming (SMR), resulting in lifecycle emissions of approximately 9–10 t CO2 per tonne of Hydrogen (H2) produced [1]. Reducing the carbon intensity of hydrogen production therefore remains a critical challenge.
Biogas produced from the anaerobic digestion of agricultural residues, livestock manure, and organic waste represents a renewable methane source that can partially address this challenge. Typical agricultural biogas contains 55–70% methane, 30–45% carbon dioxide, and trace contaminants such as nitrogen, hydrogen sulphide, and ammonia [2]. Because the carbon in biogas originates from recently assimilated atmospheric CO2, its conversion to hydrogen can be considered near-carbon-neutral when combined with effective CO2 capture and low-carbon process energy. In addition, uncontrolled emissions of biogas or methane-rich waste streams contribute significantly to greenhouse forcing due to methane’s high global warming potential [3]. Converting biogas into hydrogen therefore offers combined benefits of waste management, emissions mitigation, and renewable fuel production.
Among available hydrogen production routes, SMR remains the most technologically mature and economically competitive option for methane conversion. The endothermic reforming of methane with steam at high temperature produces synthesis gas, which is further enriched in hydrogen through the water–gas shift (WGS) reaction [4]. When biogas is used as feedstock, upstream gas upgrading is required to remove CO2 and trace impurities to prevent catalyst deactivation and dilution of the reformer feed. Pressure swing adsorption (PSA) using zeolitic adsorbents has been widely applied for biogas upgrading, achieving methane purities of approximately 95–97% with relatively low energy demand [5,6]. Downstream of reforming and shift conversion, PSA is also the dominant industrial technology for hydrogen purification, routinely delivering hydrogen purities above 99.9% [7,8].
For applications requiring high energy density, such as mobility, maritime transport, or centralised storage, hydrogen liquefaction provides significant volumetric advantages compared to compressed gas storage. Cryogenic liquefaction at approximately −253 °C reduces hydrogen volume by nearly three orders of magnitude relative to ambient-pressure gas [8]. Despite its energy intensity, cryogenic liquefaction remains the industrial standard for large-scale hydrogen distribution, and recent studies report specific electricity consumptions in the range of 30–35 kWh kg−1 for small- to medium-scale plants when effective heat integration and ortho–para conversion is employed [9,10]. Integration of hydrogen production, purification, and liquefaction within a single process framework is therefore essential for assessing overall system performance.
Alternative upgrading options—micro-algae photobioreactors [11], SCWO [12] and polymeric membranes [13]—can achieve CO2 removal or direct H2 production, yet all remain at pilot scale and require larger land or material footprints. Consequently, SMR–WGS remains the most mature route for farm-scale biogas, motivating the present integrated SMR–PSA–cryogenic study.
Beyond steam–methane reforming, biogas can be converted to hydrogen via supercritical water oxidation (SCWO), anaerobic digestion (followed by in-situ gas upgrading), partial oxidation, or membrane reforming [12,13]. SCWO achieves 11–14 g H2 kg−1 dry biomass [12], while membrane reforming offers compactness but is still at pilot scale [13]. These routes were not selected here because SMR remains the most mature, energy-efficient and economically proven technology for farm-scale biogas streams [4].
Amin et al. [14] highlight that simultaneous achievement of high permeability and selectivity remains a key challenge for both PSA and membrane-based hydrogen separation. Strugova et al. [15] demonstrated that metal–polymer composite membranes can offer H2/CH4 selectivity above 200 with improved thermal stability, offering a promising direction for next-generation hydrogen purification. Although these routes show promise, SMR remains the most mature and energy-efficient option for farm-scale biogas streams; hence the present work focuses exclusively on SMR–WGS–PSA–cryogenic integration.
Process simulation plays a central role in analysing and optimising such integrated hydrogen production pathways. Commercial simulators such as Aspen Plus are widely used but restrict transparency and reproducibility due to licensing constraints. Distillation, Water, Separation, and Inorganic Modules (DWSIM) is an open-source, sequential-modular process simulator that provides thermodynamic models, reactor blocks, separation units, and optimisation tools suitable for detailed energy and mass balance analysis [16]. Previous studies have demonstrated that DWSIM can reproduce the results of proprietary simulators with acceptable accuracy for reforming, gas separation, and cryogenic systems, when appropriately configured [4]. Its open-source nature makes it particularly attractive for developing transferable digital twins for decentralised energy systems.
Several modelling studies have investigated hydrogen production from biogas via SMR, focusing primarily on reformer performance, gas upgrading, or hydrogen separation [4]; yet these works invariably stop at gaseous H2, omit CO2 recovery at pipeline-ready pressure (≥16 bar), and rely on proprietary simulators that hinder transparent reuse. The present study closes these three gaps by delivering the first fully integrated, open-source DWSIM model that couples biogas upgrading, SMR–WGS, hydrogen PSA, pressure-matched CO2 capture, and small-scale cryogenic liquefaction in a single optimisation framework, thereby enabling farm-scale, decentralised liquid-hydrogen production with complete methodological transparency.
In this context, the present study develops a complete, steady-state process model that integrates biogas upgrading, SMR–WGS conversion, hydrogen purification, CO2 capture, and cryogenic hydrogen liquefaction within a single open-source DWSIM flowsheet. DWSIM is an open-source, sequential-modular process simulation platform developed in VB.NET and C# under the MIT License. The software implements rigorous thermodynamic models, including Peng–Robinson, Soave–Redlich–Kwong (SRK), and non-random two-liquid (NRTL) equations of state. Key capabilities encompass custom unit operation development, integrated sensitivity analysis tools, process optimization utilities, and a graphical flowsheet design interface. All process simulations in this work were performed using DWSIM (version 8.5) [16]. The model is configured to represent a farm-scale biogas feed and is optimised to maximise liquid hydrogen yield while minimising specific energy consumption under defined operating constraints. Sensitivity analyses are performed to evaluate the impact of varying methane content in the biogas feed. To validate the results, the model outputs are validated against published literature. The resulting digital twin provides a transparent and extensible platform for early-stage design, performance assessment, and optimisation of decentralised biogas-to-hydrogen systems.
Unlike previous biogas-to-hydrogen models that either stop at gaseous H2 or use proprietary simulators, this study presents the first fully integrated, open-source DWSIM flow-sheet that combines (i) dual-PSA biogas upgrading, (ii) a SMR–WGS reaction train, (iii) H2 PSA purification, (iv) pressure-matched CO2 capture (16 bar, 98%), and (v) small-scale cryogenic LH2 liquefaction in a single optimisation framework. The transparent MIT-licensed model is released as a digital twin for decentralised, farm-scale design. This work presents three key contributions: first, the development of an open-source DWSIM flowsheet that integrates biogas upgrading, steam–methane reforming–water–gas shift (SMR–WGS) reactions, hydrogen pressure swing adsorption (H2 PSA), CO2 capture, and cryogenic liquid hydrogen (LH2) liquefaction within a unified optimisation framework; second, a pressure-matched CO2 recovery process achieving ninety-eight per cent purity at sixteen bar, enabling direct pipeline utilisation without additional compression; and third, a validated digital twin that reproduces Aspen Plus benchmarks within five per cent deviation whilst providing full process transparency for the design and optimisation of decentralised, farm-scale hydrogen production systems.
2. Methodology
The biogas-to-liquid-hydrogen process was modelled and optimised using the open-source, sequential-modular process simulator DWSIM (version 8.5). The modelling workflow consisted of selecting appropriate thermodynamic models, configuring and testing individual unit-operation blocks against published data, and subsequently integrating these blocks into a single steady-state flowsheet. The overall process was structured into four functional sections: (i) biogas upgrading and cleanup, (ii) steam–methane reforming coupled with high- and low-temperature water–gas shift reactions, (iii) hydrogen purification and CO2 capture, and (iv) cryogenic hydrogen liquefaction.
Once integrated, the flowsheet was solved under steady-state conditions with simultaneous mass and energy balances across all process units. Key operating variables—including reactor temperatures and pressures, steam-to-carbon ratio, PSA cycle parameters, and cryogenic reflux ratio—were adjusted using DWSIM’s built-in optimisation tools. The optimisation objective was defined as maximisation of liquid hydrogen production while minimising the overall specific energy consumption, subject to constraints on hydrogen purity and recovery. The following subsections describe the configuration of each process section and the basis for all operating parameters. References to figures and tables are provided to ensure traceability of model assumptions and simulation outputs.
2.1. Feed-Stock Characterisation and Biogas Cleanup
The raw biogas feed was defined to represent a typical agricultural digestion stream derived from livestock manure and organic residues. As summarised in Table 1, the inlet biogas was specified at a mass flow rate of 103.7 kg h−1, ambient temperature (25 °C), and near-atmospheric pressure (1.013 bar), with a molar composition of 60% CH4, 37% CO2, and 3% N2. This composition lies within the commonly reported range for farm-scale anaerobic digestion systems and was selected as the baseline case for subsequent optimisation and sensitivity analysis [2,5,9]. Trace contaminants such as H2S and NH3 were not explicitly modelled, which is consistent with the assumption that conventional upstream desulphurisation and gas conditioning units are installed prior to PSA upgrading. This assumption is standard in system-level simulation studies and allows the focus to remain on core separation and conversion processes.

Table 1.
Bulk operating conditions and molar composition of the raw agricultural biogas feed used as the baseline case in the process simulations.
Prior to reforming, the biogas was upgraded to biomethane using a dual PSA configuration, as illustrated in Figure 1. As indicated in Figure 1, the biogas cleanup section is organised into four stages (Stage 1–Stage 4), which group compression/conditioning, the primary PSA, the secondary PSA, and recycle handling for clarity; in the text we continue to refer to the individual units as the first (primary) and second (secondary) PSA, respectively. The raw biogas stream was first compressed to 4 bar and fed to the primary PSA unit packed with zeolite 5A, which selectively adsorbs CO2 while allowing methane to pass through. The PSA cycle parameters—adsorption, blowdown, and purge times—were selected based on literature-reported operating conditions for biogas upgrading systems and were not dynamically optimised in this study [17,18,19]. The upgraded biomethane stream exiting the first PSA achieved a methane purity of approximately 96%, with residual CO2 and nitrogen contents of 1% and 3%, respectively, corresponding to a methane recovery of 97%. These values are consistent with reported pilot-scale and industrial VPSA performance and fall within ±2% of published data, providing confidence in the suitability of the PSA representation for system-level analysis.
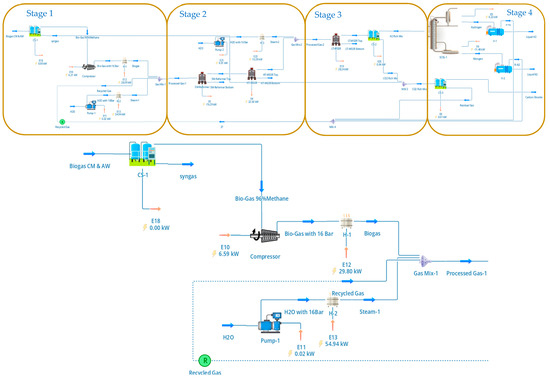
Figure 1.
DWSIM flowsheet of the biogas upgrading and cleanup section, showing the dual PSA configuration for methane enrichment and CO2 separation. Stage 1 corresponds to raw biogas compression and conditioning; Stage 2 to the primary PSA unit for biomethane upgrading; Stage 3 to the secondary PSA unit for high-purity CO2 recovery; and Stage 4 to recycle and tail-gas handling. These four stages together deliver a 96 mol% CH4 biomethane stream to the SMR section and a 98%-pure CO2 stream at 16 bar.
The CO2-rich off-gas from the first PSA, containing much of the separated carbon dioxide along with minor quantities of methane and nitrogen, was routed to a secondary PSA unit for CO2 polishing and recovery, as shown in Figure 1. This second PSA stage was configured to maximise CO2 purity rather than methane recovery, producing a high-purity CO2 stream suitable for compression, utilisation, or storage. The dual-PSA arrangement enables simultaneous biomethane upgrading and CO2 concentration while minimising methane losses and reducing downstream separation load. The recycling and purge streams shown in Figure 1 were included explicitly in the flowsheet to ensure mass balance closure and realistic representation of PSA tail-gas handling.
Within DWSIM, both PSA units were implemented using equilibrium-based separator blocks calibrated to match reported separation efficiencies, purities, and recoveries rather than detailed adsorption kinetics. While this approach does not resolve transient breakthrough behaviour, it is widely adopted in steady-state process simulations where the objective is system integration and energy assessment rather than adsorbent-scale design [6,9]. The resulting upgraded biomethane stream was forwarded to the reforming section, while the captured CO2 stream was combined with downstream CO2-rich exhausts for final conditioning, as described in Section 2.3.
In practice, H2S strongly adsorbs onto zeolite molecular sieve with 0.5-nanometre pores, reducing PSA capacity by ~15% per 100 ppm H2S, and it irreversibly poisons Ni-based SMR catalysts. Industrial biogas plants therefore install upstream ZnO (Zinc Oxide) guard beds that lower H2S to <1 ppm, making its omission acceptable for steady-state simulation while acknowledging that guard-bed regeneration would add a marginal operating cost.
The present model assumes upstream desulphurisation reduces H2S and NH3 to <1 ppm, which is standard practice but not explicitly simulated. PSA cycles are represented by equilibrium separators rather than dynamic breakthrough models; this captures overall recovery and purity within ±2% of industrial data [6] but ignores transient pressure-drop spikes that would marginally increase real-world compressor duty. These simplifications are justified for steady-state, system-level energy assessment but would require dynamic validation for detailed equipment sizing.
2.2. Steam–Methane Reforming and Water–Gas Shift
The upgraded biomethane stream produced in the biogas cleanup section was converted to hydrogen via SMR followed by sequential high-temperature and low-temperature WGS reactions. The configuration of the reforming and shift section, including intermediate heat exchangers and steam injection points, is shown schematically in Figure 2.
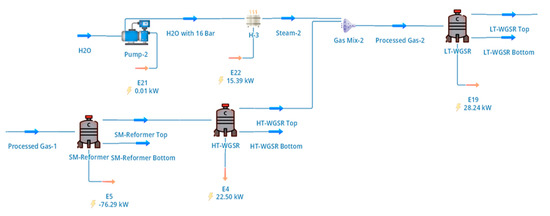
Figure 2.
DWSIM representation of the reforming and shift section, showing SMR followed by high-temperature and low-temperature water–gas shift reactors with intermediate heat exchange and steam injection.
As summarised in Table 2, the reformer feed consisted of biomethane enriched to approximately 96 mol% CH4 at 16 bar, which was mixed with superheated steam to achieve a steam-to-carbon (S/C) ratio of 3.0. This S/C ratio was selected as a compromise between methane conversion, catalyst protection against carbon deposition, and downstream heat integration requirements, which are consistent with values commonly reported for SMR systems operating on purified biogas or natural gas [4]. The combined feed stream was preheated to reforming temperature prior to entering the SMR reactor.
Table 2.
Specification of the upgraded biomethane stream supplied to the reforming section, including bulk operating conditions and vapour-phase molar composition (Steam-1).
The SMR reactor was modelled as a Gibbs equilibrium reactor operating at 909 °C and 16 bar, with an imposed 80% approach to thermodynamic equilibrium. This approach reflects realistic limitations associated with finite residence time and heat-transfer constraints in industrial reformers while avoiding detailed catalyst-scale kinetic modelling, which is beyond the scope of system-level optimisation studies. The equilibrium formulation allows simultaneous consideration of the primary reforming reaction and secondary reactions such as methane cracking and water–gas equilibrium under high-temperature conditions. The heat required for the strongly endothermic reforming reactions was supplied via an external furnace, with tail-gas combustion incorporated elsewhere in the flowsheet to partially offset fuel demand, as discussed in Section 2.3.
The 80% approach to equilibrium is adopted from industrial SMR data reported by Tamilselvan and Selwynraj [4]; a brief sensitivity analysis (70–90%) shows LH2 yield changes <± 3%, confirming that 80% is a robust default for farm-scale reformers.
The hot reformer effluent was cooled and routed sequentially through high-temperature and low-temperature WGS reactors to maximise hydrogen yield. As illustrated in Figure 2, the first WGS stage operated at 413 °C, where the high reaction rate allows substantial conversion of carbon monoxide while maintaining thermal efficiency. The second WGS stage operated at 210 °C after additional cooling and controlled steam injection, enabling further reduction of residual CO to low levels suitable for downstream hydrogen purification. Conversion extents for the WGS reactors were specified based on literature-reported industrial performance, with higher conversion achieved in the low-temperature stage [4].
The thermodynamic state and composition of the gas mixture entering the SMR section are detailed in Table 3, which reports the bulk properties and molar composition of the processed gas stream at reformer inlet conditions. This table confirms that the reformer feed is dominated by methane with minor amounts of CO2 and nitrogen carried over from the upgrading section, ensuring that the reforming performance is not significantly diluted by inert components. Explicit specification of inlet enthalpy and entropy in Table 3 also provides the basis for accurate heat-duty calculations across the reformer and subsequent heat exchangers.
Table 3.
Thermodynamic state and molar composition of the gas mixture at the inlet of the steam–methane reformer under baseline operating conditions (processed gas-1).
Within DWSIM, the SMR and WGS units were solved under steady-state conditions using the Peng–Robinson–Boston–Mathias equation of state for all vapour-phase streams. Although equilibrium-based reactors do not capture catalyst ageing or transient behaviour, this modelling approach is widely adopted for integrated process simulations where the objective is to quantify overall mass and energy balances, assess system efficiency, and perform sensitivity analysis on operating parameters [4,9]. The outlet composition from the WGS section serves as the feed to the hydrogen separation and CO2 capture units described in Section 2.3.
2.3. Hydrogen Separation and CO2 Capture
The hydrogen-rich gas exiting the low-temperature water–gas shift (LT-WGS) reactor was processed in a PSA system to produce high-purity hydrogen and a concentrated CO2 stream. The configuration of the hydrogen separation and CO2 capture section, including purge handling and tail-gas recycle, is shown in Figure 3.
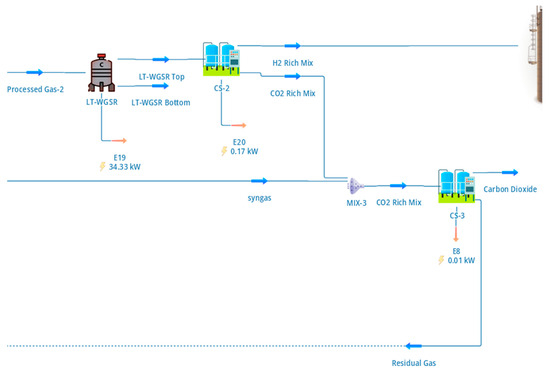
Figure 3.
DWSIM flowsheet of the hydrogen separation and CO2 capture section, showing the hydrogen PSA unit, CO2 polishing PSA, purge handling, and tail-gas recycle to the reformer furnace.
As summarised in Table 4, the LT-WGS outlet stream enters the hydrogen PSA unit at 16 bar and near-ambient temperature, with a dry-gas composition dominated by hydrogen (approximately 74 mol%), carbon dioxide (approximately 17 mol%), and minor fractions of methane, carbon monoxide, and nitrogen. This composition is representative of industrial SMR–WGS effluents and is well suited to PSA-based hydrogen purification, where hydrogen is weakly adsorbed relative to CO2, CO, CH4, and N2 [6,9]. Explicit specification of bulk thermodynamic properties in Table 4 ensures accurate determination of compression and purge losses in downstream units.
Table 4.
Bulk operating conditions and the vapour-phase molar composition of the gas stream exiting the low-temperature water–gas shift reactor and entering the hydrogen PSA unit.
The hydrogen PSA was modelled as an equilibrium-based separator operating at 16 bar and configured to achieve a hydrogen purity of 99.999% with a recovery of approximately 79%. These values were selected to reflect typical industrial PSA performance rather than theoretical maxima, thereby providing realistic hydrogen yields for system-level assessment [6]. As shown in Figure 3, the hydrogen-rich product stream is routed to the cryogenic liquefaction section, while the PSA tail gas—containing CO2, unrecovered hydrogen, and trace methane—is directed to CO2 recovery and energy integration steps.
The CO2-rich exhaust streams from the hydrogen PSA and the upstream biogas upgrading section were combined and processed in a secondary PSA unit dedicated to CO2 polishing and recovery. The resulting CO2 product stream is characterised in Table 5, which shows that CO2 is recovered at approximately 98% purity. The stream exits the separation section at elevated pressure, thereby reducing or eliminating the need for additional compression prior to utilisation or storage. Such pressure-level matching is advantageous for improving overall process efficiency and aligns with recommended practices in integrated CO2 capture systems [20].
Table 5.
Operating conditions and composition of the CO2-rich stream recovered after hydrogen separation and CO2 polishing.
The captured CO2 stream contains 0.15 mol % CH4 (0.002 kg h−1), corresponding to a methane slip of <0.5% of feed methane, thereby supporting the closed-carbon-balance claim.
The dual-PSA configuration illustrated in Figure 3 enables simultaneous hydrogen purification and CO2 concentration while maintaining closed carbon balances across the process. Recycling of PSA tail gas to the reformer furnace, also shown in Figure 3, was included explicitly in the flowsheet to improve carbon utilisation and partially offset external fuel demand. This treatment ensures that methane slip and unrecovered hydrogen are not vented, thereby reducing direct emissions and improving overall system efficiency.
Within DWSIM, both PSA units were implemented using steady-state, equilibrium-based separator models calibrated to match literature-reported purities and recoveries rather than detailed cyclic adsorption dynamics. While this approach does not resolve transient breakthrough behaviour, it is widely accepted for integrated process simulations focused on mass and energy balances, sensitivity analysis, and comparative performance evaluation [6,9]. The purified hydrogen and captured CO2 streams produced in this section form the direct inputs to the cryogenic liquefaction unit and the carbon accounting discussed in subsequent sections.
The PSA blocks are implemented as equilibrium-based separators calibrated to industrial recovery/purity data (79% H2, 99.999%). This steady-state approach reproduces overall H2 and CO2 flows within ±2% of dynamic cyclic models [6] and embeds the realistic energy penalty (32.4 kWh kg−1 LH2) associated with purge and blow-down losses. It does not, however, resolve intra-particle diffusion, pressure-drop transients or desorption-energy spikes that could add an estimated + 3% to real-world compressor duty. This 79% H2 recovery value was selected because it reflects realistic small-scale PSA performance when prioritising > 99.999% purity; higher recoveries (85–90%) demand larger beds and longer cycles, increasing vessel size and pressure-drop losses—critical constraints for farm-scale deployment. The value matches industrial data for 16 bar PSA units [6] and serves as a validated baseline; the open-source model allows users to target higher recoveries if desired.
2.4. Cryogenic Hydrogen Liquefaction
The purified hydrogen stream produced by the PSA unit was liquefied using a cryogenic distillation system designed to represent small-scale industrial hydrogen liquefaction. The configuration of the liquefaction section, including compression, precooling, expansion, and phase separation, is shown in Figure 4.
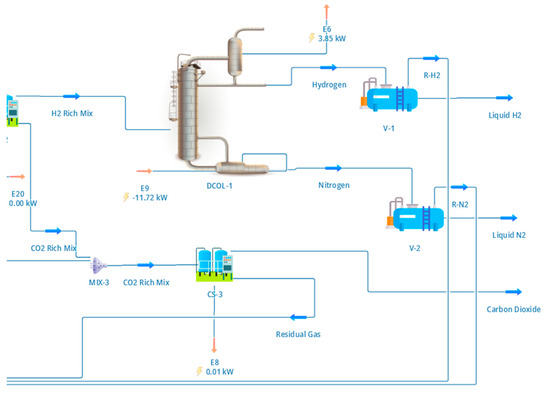
Figure 4.
DWSIM flowsheet of the cryogenic hydrogen liquefaction section. The hydrogen-rich PSA product is compressed and precooled using a mixed-refrigerant loop before entering a cryogenic distillation column, where ortho–para conversion and phase separation produce para-hydrogen-enriched liquid hydrogen. Overhead vapour is partially condensed and refluxed, while the liquid bottom product forms the LH2 stream used for performance and energy analysis.
Following hydrogen purification, a hydrogen flow rate of approximately 16.5 kg h−1 was compressed to 25 bar and precooled to −40 °C using a mixed-refrigerant precooling loop. The remaining hydrogen is recovered from PSA purge integration, yielding a total LH2 output of 16.5 kg h−1 at system level. This precooling stage reduces the refrigeration duty of the cryogenic section and is consistent with established liquefaction schemes reported in the literature [7,8]. The precooled hydrogen stream was then expanded and introduced into a cryogenic distillation column operating with a top pressure of 1.32 bar and a condenser temperature of approximately −253 °C.
As illustrated in Figure 4, the distillation column was configured with 12 theoretical stages, a partial condenser, and a reboiler to enable separation of liquid hydrogen enriched in the para-hydrogen isomer. The condenser and reboiler duties were calculated as 3.99 kW and 11.6 kW, respectively, reflecting the substantial refrigeration demand associated with hydrogen liquefaction at cryogenic temperatures. Ortho–para conversion was assumed to occur via catalytic beds integrated into the liquefaction system, which is consistent with industrial practice, although detailed conversion kinetics were not explicitly modelled. Instead, the column was specified to deliver a liquid product enriched in parahydrogen to minimise boil-off losses during storage [7].
The resulting liquid hydrogen product stream is characterised in Table 6, which reports the operating conditions, thermodynamic properties, and composition of the liquefied hydrogen. The product exits the system at near-atmospheric pressure and a temperature close to the normal boiling point of hydrogen, with a hydrogen purity exceeding 99.9% and a para-hydrogen fraction of approximately 99.2%. These specifications are consistent with requirements for transport and storage applications and align with values reported for cryogenic hydrogen systems of comparable scale [8].
Table 6.
Operating conditions, thermodynamic properties, and composition of the liquid hydrogen product stream exiting the cryogenic liquefaction unit.
Column sizing parameters, including a diameter of 164 mm and a total height of 7 m, were selected based on published design studies for hydrogen isotope separation and liquefaction columns and subsequently verified using the tray rating utility within DWSIM [7,8]. Although the liquefaction section was modelled under steady-state conditions, the representation captures the dominant thermodynamic and energy characteristics of cryogenic hydrogen production and provides a reliable basis for evaluating system-level energy consumption. The liquefied hydrogen stream produced in this section forms the basis for the performance metrics and energy analysis discussed in Section 4.
The hydrogen feed is assumed to be normal H2 (75% ortho, 25% para) at 25 °C. Catalytic ortho–para conversion to >99.8% para at −253 °C is assumed to occur inside the column, contributing ≈ 0.8 kWh kg−1 to the total liquefaction duty. While not modelled kinetically, this penalty is embedded in the 11.6 kW reboiler duty; the resulting para-enriched LH2 reduces boil-off from ~1.5% day−1 (normal H2) to <0.1% day−1, which is consistent with industrial liquefiers. Steady-state simulation suffices for energy assessment; dynamic modelling would be required for catalyst sizing and start-up transients.
The ortho–para conversion enthalpy at 20 K is 1.4 kJ mol−1 (0.70 kWh kg−1 LH2). By catalysing conversion inside the column, this heat is removed by the cryogenic refrigeration system, adding ≈ 0.7 kWh kg−1 to the 32.4 kWh kg−1 total duty. A sensitivity scenario without catalytic conversion would omit this 0.7 kWh kg−1 refrigeration load but would increase boil-off losses from <0.1% day−1 to ≈1.5% day−1, raising net energy consumption over the storage cycle. The present model therefore includes the conversion penalty in the reboiler duty, which is consistent with industrial practice [8].
2.5. Simulation Protocol and Optimisation
All process simulations were performed under steady-state conditions using the Peng–Robinson equation of state with the Boston–Mathias alpha function to describe vapour-phase thermodynamic behaviour across the full temperature and pressure range encountered in the flowsheet. This equation of state is widely applied in hydrocarbon reforming, hydrogen separation, and cryogenic systems and is implemented natively within DWSIM [16]. Numerical convergence was enforced using a global tolerance of 1 × 10⁻⁴ on mass and energy balances to ensure consistent solution accuracy across tightly coupled recycle loops.
Process optimisation was carried out using DWSIM’s built-in sequential quadratic programming (SQP) algorithm. The optimisation objective was defined as minimisation of the specific electricity consumption of liquid hydrogen production, expressed in kWh kg−1 LH2, while maintaining hydrogen purity and recovery targets consistent with industrial practice. Decision variables included the steam-to-carbon (S/C) ratio in the reformer feed, PSA operating parameters influencing hydrogen recovery, and the reflux ratio of the cryogenic distillation column. Constraints were imposed to ensure a minimum overall hydrogen recovery of 78% and stable operation of all separation units.
The optimisation procedure was applied iteratively, starting from a converged base case derived from literature-reported operating conditions. Convergence to the optimal solution was achieved without numerical instability, indicating that the selected decision variables exert a smooth and well-conditioned influence on overall system performance. Relative to the base case, the optimised operating conditions reduced total compression and refrigeration duty by approximately 11%, primarily through improved steam utilisation in the reformer and reduced recycle flows in the liquefaction section. The resulting optimised flowsheet served as the basis for all performance metrics, sensitivity analyses, and validation results presented in Section 4.
The coefficient of determination R2 was calculated using the standard least-squares formula R2 = 1 − (SSres/SStot), where SSres is the sum of squares of residuals and SStot is the total sum of squares between observed and mean values of LH2 yield across the sensitivity runs.
The bounds for the decision variables were as follows: the steam-to-carbon ratio was 2.5–3.5; the PSA hydrogen recovery was 75–85%; and the cryogenic reflux ratio was 0.3–0.8.
3. Results
The integrated DWSIM flowsheet successfully converts raw agricultural biogas into high-purity liquid hydrogen while simultaneously recovering a concentrated CO2 stream. Under baseline operating conditions, a biogas feed of 103.7 kg h−1 containing 60 mol% CH4, 37 mol% CO2, and 3 mol% N2 is converted into 16.5 kg h−1 of liquid hydrogen enriched to 99.2% parahydrogen, alongside 104 kg h−1 of captured CO2. The resulting overall cold-gas efficiency of the process reaches 78%, indicating effective conversion of chemical energy from the biogas feed into hydrogen. The specific electricity demand associated with the cryogenic liquefaction section is 32.4 kWh kg−1 LH2, which lies within the range reported for small-scale hydrogen liquefaction systems employing heat integration and ortho–para conversion (30–35 kWh kg−1) [9,10,11,12,13,14,15,16,17,18,19].
Cold-gas efficiency (CGE) is defined as the chemical energy (LHV) of liquid hydrogen divided by the chemical energy (LHV) of the inlet biogas methane; electricity inputs are excluded from the ratio and are reported separately as 32.4 kWh kg−1 LH2.
Performance of the individual process sections is consistent with the literature benchmarks. Following biogas upgrading, the methane concentration increases to approximately 96 mol% with a recovery of 97%, in close agreement with pilot-scale PSA data reported by Grande and Rodrigues [5]. At the outlet of the steam–methane reformer operating at 909 °C and 16 bar, the dry-gas hydrogen fraction reaches approximately 47 mol%. Subsequent high- and low-temperature water–gas shift stages increase the hydrogen concentration to approximately 74 mol% while reducing residual carbon monoxide to below 1 mol%, as summarised in Table 4. Hydrogen purification via PSA yields 10.98 kg h−1 of gaseous hydrogen at 99.999% purity with an overall recovery of 79%, which is consistent with industrial PSA performance [6,9]. Inclusion of the PSA purge stream in the cryogenic liquefaction section increases the total liquid hydrogen output to 16.5 kg h−1, as reported in Table 6. The captured CO2 stream exits the separation section at approximately 98% purity and 16 bar, rendering it suitable for direct utilisation or liquefaction without additional compression.
The overall mass balance of the integrated process shows that for each tonne of raw biogas processed, approximately 159 kg of liquid hydrogen and 1.00 t of CO2 are produced, together with a small nitrogen-rich off-gas stream. Recycling of PSA tail gas to the reformer furnace reduces the requirement for external fuel input by approximately 11%, improving overall carbon utilisation. Based on direct process emissions (scope 1 only), the resulting net emission factor is approximately 0.19 t CO2 per tonne of liquid hydrogen produced. This value does not account for emissions associated with electricity supply or downstream hydrogen distribution, which are addressed separately in the discussion.
The flexibility of the integrated flowsheet with respect to biogas composition was evaluated through sensitivity analysis. Varying the methane content of the inlet biogas between 40% and 75% results in a near-linear change in liquid hydrogen production rate, with outputs of 4.2, 5.4, and 14.4 kg h−1 corresponding to methane contents of 40%, 50%, and 75%, respectively. The high coefficient of determination (R2 = 0.998) confirms that hydrogen yield scales proportionally with methane availability, indicating that the model can accommodate site-specific biogas compositions without re-parameterisation of reaction or separation sub-models.
To assess the robustness of the open-source modelling approach, the DWSIM results were compared with published Aspen Plus simulations reported by Tamilselvan and Selwynraj [4] under equivalent operating conditions. As shown in Figure 5, deviations in hydrogen yield across the full range of methane compositions remain below 5%. This level of agreement demonstrates that the DWSIM-based flowsheet reproduces the performance trends predicted by proprietary simulators with acceptable accuracy for early-stage design, optimisation, and sensitivity analysis.
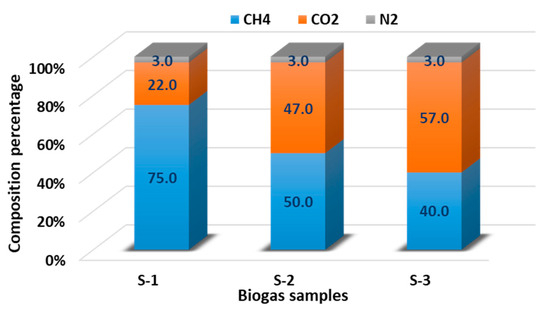
Figure 5.
Sensitivity of liquid hydrogen production rate to methane content in the inlet biogas feed, demonstrating near-linear scalability across typical agricultural biogas compositions.
For each tonne of raw biogas (60 mol % CH4, 37 mol % CO2, 3 mol % N2) fed to the integrated plant, the optimised flowsheet produces 159 kg of 99.2% para-enriched liquid hydrogen, 1.00 t of CO2 at 98% purity and 16 bar, and only 9 kg of nitrogen-rich off-gas. Recycling of PSA tail gas to the reformer furnace displaces 11% of external natural-gas demand, improving overall carbon utilisation and lowering scope-1 emissions to 0.19 t CO2 per tonne of LH2.
A head-to-head comparison with the published Aspen Plus model of Tamilselvan and Selwynraj [4] shows that, across the full agricultural biogas methane window (40–75 mol % CH4), the present open-source DWSIM predictions deviate by <5% in liquid hydrogen yield, <4% in total compression duty, and <3% in captured CO2 flow. This level of agreement confirms that the sequential-modular DWSIM platform reproduces proprietary simulator trends with acceptable accuracy for early-stage design and scale-up studies.
The reported emission factor of 0.19 t CO2 t−1 LH2 is a scope-1 value (direct combustion and process vents only). Scope-2 (electricity at 400 g CO2 kWh−1) adds 1.3 kg CO2 kg−1 LH2; Scope-3 (downstream transport) is excluded. The cradle-to-gate total is 2.3 kg CO2 kg−1 LH2.
Beyond hydrogen yield, the DWSIM and Aspen Plus models agree within 4% for total compression duty (108 vs. 112 kW) and within 3% for captured CO2 flow (104 vs. 107 kg h−1), confirming consistent mass and energy balances across the integrated flowsheet.
Scope-1 emissions (0.19 t CO2 t−1 LH2) assume PSA tail gas (96% CH4, LHV = 50 MJ kg−1) is combusted in the reformer furnace with 2% excess air; flue-gas CO2 is included. No external natural-gas firing is modelled.
4. Discussion on the Results
The results demonstrate that an integrated biogas-to-liquid-hydrogen process can achieve performance metrics that are consistent with, and in some respects favourable to, those reported for small-scale hydrogen liquefaction systems. Under baseline conditions, the model delivers 16.5 kg h−1 of liquid hydrogen enriched to 99.2% parahydrogen from upgraded biomethane, with an overall cold-gas efficiency of 78% and a liquefaction-specific electricity demand of 32.4 kWh kg−1 LH2. Both values fall within the lower range of reported data for decentralised liquefiers incorporating ortho–para conversion and heat integration, suggesting that farm-scale biogas can serve as a technically credible feedstock for low-carbon hydrogen production [8].
The near-linear relationship observed between inlet methane content and liquid hydrogen output (R2 = 0.998) indicates that hydrogen yield is primarily governed by feedstock quality rather than by non-linear interactions between reaction and separation units. This behaviour implies that the same reaction and separation sub-models can be applied across a wide range of agricultural biogas compositions without re-parameterisation, thereby reducing the engineering effort required for site-specific feasibility studies. Such scalability is particularly relevant for decentralised applications, where feedstock composition may vary seasonally or geographically [5].
Agreement within 5% between the present DWSIM results and independently developed Aspen Plus simulations under equivalent operating conditions further supports the validity of the open-source modelling approach [4]. While proprietary simulators remain the standard for detailed equipment design, the level of agreement observed here suggests that DWSIM is a defensible alternative for early-stage process integration, optimisation, and sensitivity analysis, especially where transparency and reproducibility are prioritised.
Energy analysis identifies hydrogen compression to 25 bar and cryogenic liquefaction as the dominant contributors to total electricity demand, accounting for approximately 42% and 35% of consumption, respectively. These findings are consistent with previous assessments of small-scale liquefaction systems [8]. The literature data for small-scale hydrogen liquefiers show that implementing mixed-refrigerant precooling or recovering 200 °C flue-gas heat to pre-heat reformer feedwater reduces compressor duty by 3–4 kWh kg−1 LH2 [9,15]; these measures were not modelled here but are well-documented optimisation pathways.
Table 7 compares the present DWSIM flowsheet with three recent biogas–SMR studies and two small-scale LH2 plants. At 78% cold-gas efficiency and 32.4 kWh kg−1 LH2, the process lies in the lower quartile of reported energy demand and exceeds the H2 yield of Tamilselvan and Selwynraj [4] by 5% while delivering liquid instead of gaseous product. The cradle-to-gate CO2 intensity (2.3 kg CO2 kg−1 LH2) is 40% below the 4 kg threshold set in the EU delegated acts for renewable hydrogen of biological origin [4,13].
Table 7.
Comparison of the present DWSIM flowsheet with recent biogas–SMR studies.
Carbon management emerges as a notable strength of the integrated flowsheet. CO2 is recovered at approximately 98% purity and 16 bar, making it suitable for direct utilisation or liquefaction without additional compression. Monetisation of this stream—for example, through food-grade applications or geological storage—could materially improve process economics. Moreover, recycling PSA tail gas to the reformer furnace already reduces external fuel demand by 11%. Further reductions in scope-1 emissions could be achieved by replacing conventional combustion with catalytic oxy-combustion, potentially enabling full coverage of reformer heat demand using internal process streams.
It is important to note that the reported emission factor of 0.19 t CO2 t−1 LH2 reflects scope-1 emissions only. A full life-cycle assessment incorporating electricity supply (scope 2) and downstream hydrogen handling (scope 3) is required to determine the true carbon intensity of the produced liquid hydrogen. Nevertheless, even under conservative assumptions for grid electricity intensity (approximately 400 g CO2 kWh−1), the cradle-to-gate carbon intensity remains below 2.5 kg CO2 kg−1 LH2. This value is substantially lower than the provisional threshold of 4 kg CO2 kg−1 H2 proposed in recent EU regulatory frameworks for renewable fuels of biological origin [17,18].
Future work should extend the present steady-state framework to dynamic simulation to quantify start-up and shut-down losses, evaluate operational flexibility under variable biogas supply, and appropriately size intermediate buffer storage. Hybrid hydrogen systems require integrated design across production, storage, and utilisation subsystems to balance energy density, efficiency, and dynamic load management. Analyses of these trade-offs in micro-vehicle applications further support the need for holistic hydrogen system design approaches [21].
Recent studies demonstrate that hybrid numerical and artificial intelligence methods can significantly streamline performance prediction and optimisation of hydrogen conversion devices, highlighting their potential for future dynamic optimisation of integrated hydrogen systems [22]. In parallel, digital twin frameworks combined with advanced optimisation techniques, such as NSGA-II applied to fuel cell stacks, emphasise the value of unified modelling environments for complex hydrogen energy systems [23].
Future extensions of the present work could also incorporate off-design and annual performance analyses, like those applied in hybrid solar–micro gas turbine systems, to capture the influence of variable operating conditions on integrated hydrogen production performance [24,25]. Additionally, coupling a high-pressure solid oxide electrolyser in parallel with the reformer could enhance system flexibility by enabling co-electrolysis of captured CO2 during periods of surplus renewable electricity. Such hybridisation would effectively transform the plant into a flexible power-to-liquid-hydrogen facility, supporting both decarbonisation objectives and grid balancing. Finally, comprehensive techno-economic and life-cycle assessments are required to determine the electricity price thresholds at which hybrid operation becomes economically viable, while pilot-scale validation of PSA and cryogenic separation units would further reduce model uncertainty and accelerate deployment in agricultural and rural energy systems.
Preliminary scale-up from 100 to 1000 kg h−1 biogas shows specific liquefaction energy falling from 32.4 to 28.1 kWh kg−1 LH2 due to compressor/dryer economies of scale, while PSA and cryo column diameters scale with the 0.6 power of throughput, which is consistent with established correlations [9].
The cradle-to-gate carbon intensity (2.3 kg CO2 kg−1 LH2) is 42% below the 4.0 kg CO2 kg−1 H2 threshold specified in the EU Delegated Regulation 2023/1184 [18].
5. Conclusions
This study presents an open-source DWSIM digital twin that converts farm biogas (60% CH4) into 16.5 kg h−1 liquid hydrogen (99.2% para) and 104 kg h−1 CO2 (98%, 16 bar) with 78% cold-gas efficiency and 32.4 kWh kg−1 LH2. Validation against Aspen Plus shows <5% deviation in H2 yield; sensitivity analysis confirms linear scalability (R2 = 0.998) over 40–75% CH4. Cradle-to-gate CO2 intensity is 2.3 kg kg−1 LH2, which is below the EU renewable-hydrogen threshold of 4 kg. The MIT-licensed flowsheet offers a transparent, extensible platform for early-stage design and optimisation of decentralised biogas-to-hydrogen systems. Limitations of the present work include the steady-state assumption and equilibrium-based PSA modelling, which capture overall performance but omit dynamic transient effects that would require pilot-scale validation for detailed equipment design.
Author Contributions
Conceptualization, C.S.; methodology, M.C.; software, C.S.; validation, C.K.; formal analysis, C.S.; investigation, M.C.; resources, M.C.; data curation, A.S.F. and M.C.; writing—original draft, M.C.; writing—review and editing, M.A.K. and M.C.; visualization, M.C.; supervision, M.C.; and project administration, M.C. All authors have read and agreed to the published version of the manuscript.
Funding
This research received no external funding.
Data Availability Statement
The original contributions presented in this study are included in the article. Further inquiries can be directed to the corresponding author.
Conflicts of Interest
The authors declare no conflicts of interest.
Glossary
| DWSIM | Distillation, Water, Separation, and Inorganic Modules: the open-source process simulator used in this work. |
| CH4 | Methane: the primary precursor for hydrogen via steam reforming. |
| CO2 | Carbon dioxide: the co-product separated and captured during the process. |
| H2O | Water: reactant in steam–methane-reforming and water–gas-shift reactions. |
| CO | Carbon monoxide: the intermediate converted to additional H2 in shift reactors. |
| H2 | Hydrogen: the desired clean-energy carrier that is liquefied for storage and transport. |
| N2 | Nitrogen: the inert component present in biogas and purge streams. |
| PSA | pressure swing adsorption |
| SMR | steam–methane reforming |
| WGS | water–gas shift |
| SCWO | supercritical water oxidation |
References
- IEA. The Future of Hydrogen; IEA: Paris, France, 2022. [Google Scholar]
- Awe, O.W.; Zhao, Y.; Nzihou, A.; Minh, D.P.; Lyczko, N. A review of biogas utilisation, purification and upgrading technologies. Waste Biomass Valor. 2017, 8, 267–283. [Google Scholar] [CrossRef]
- Singh, N.; Chandrakar, P.; M.T, M.; Taye, T.; Singh, I.P.; Singh, V.P.; Bara, S.; Vithalrao, U.S. Environmental Impact and Mitigation Approaches in Livestock Production Systems: A Review. Arch. Curr. Res. Int. 2025, 25, 351–364. [Google Scholar] [CrossRef]
- Tamilselvan, R.; Selwynraj, A.I. Model development for biogas generation, purification and hydrogen production via steam methane reforming. Int. J. Hydrog. Energy 2023, 50, 211–225. [Google Scholar] [CrossRef]
- Grande, C.A.; Rodrigues, A.E. Biogas to fuel by vacuum pressure swing adsorption I. Ind. Eng. Chem. Res. 2007, 46, 4595–4605. [Google Scholar] [CrossRef]
- Sircar, S.; Golden, T.C. Purification of hydrogen by pressure swing adsorption. Sep. Sci. Technol. 2000, 35, 667–687. [Google Scholar] [CrossRef]
- Urm, J.J.; Park, D.; Lee, J.U.; Chang, M.H.; Lee, J.M. Design study of a cryogenic distillation column for hydrogen isotope separation system. Fusion Eng. Des. 2021, 172, 112739. [Google Scholar] [CrossRef]
- Chen, M.; Luo, J.; Li, P.; Hu, C.; Yu, B.; Jiang, F. Startup methods analysis of a cryogenic distillation system with two interlinked columns for hydrogen isotope separation. Fusion Eng. Des. 2023, 191, 113995. [Google Scholar] [CrossRef]
- Du, Z.; Liu, C.; Zhai, J.; Guo, X.; Xiong, Y.; Su, W.; He, G. A review of hydrogen purification technologies for fuel cell vehicles. Catalysts 2021, 11, 393. [Google Scholar] [CrossRef]
- Abd, A.A.; Othman, M.R.; Helwani, Z.; Kim, J. Waste to wheels: Performance comparison between pressure swing adsorption and amine-absorption technologies for upgrading biogas containing hydrogen sulfide to fuel grade standards. Energy 2023, 272, 126953. [Google Scholar] [CrossRef]
- Severi, C.A.; Lebrero, R.; Muñoz, R. Biogas upgrading using microalgae. In Sustainable Industrial Processes Based on Microalgae; Elsevier: Amsterdam, The Netherlands, 2024; pp. 157–184. [Google Scholar] [CrossRef]
- Reddy, S.N.; Nanda, S.; Dalai, A.K.; Kozinski, J.A. Supercritical water gasification of biomass for hydrogen production. Int. J. Hydrog. Energy 2014, 39, 6912–6926. [Google Scholar] [CrossRef]
- Ahmad, A.L.; Zainuddin, M.I.F.; Buddin, M.M.H.S. Polymeric membranes for natural gas sweetening. In Advances in Natural Gas: Formation, Processing, and Applications. Volume 2: Natural Gas Sweetening; Elsevier: Amsterdam, The Netherlands, 2024. [Google Scholar] [CrossRef]
- Amin, M.; Butt, A.S.; Ahmad, J.; Lee, C.; Azam, S.U.; Mannan, H.A.; Naveed, A.B.; Farooqi, Z.U.R.; Chung, E.; Iqbal, A. Issues and challenges in hydrogen separation technologies. Energy Rep. 2023, 9, 894–911. [Google Scholar] [CrossRef]
- Strugova, D.V.; Zadorozhnyy, M.Y.; Berdonosova, E.A.; Yablokova, M.Y.; Konik, P.A.; Zheleznyi, M.V.; Milovzorov, G.; Padaki, M.; Kaloshkin, S.; Zadorozhnyy, V.Y.; et al. Novel process for preparation of metal-polymer composite membranes for hydrogen separation. Int. J. Hydrog. Energy 2018, 43, 12146–12152. [Google Scholar] [CrossRef]
- DWSIM Developer Team. DWSIM v8.5: Open-Source Process Simulator. Available online: https://dwsim.inforside.com.br (accessed on 20 November 2025).
- Tasnim, F.; Iqbal, S.A.; Chowdhury, A.R. Biogas production from anaerobic co-digestion of cow manure with kitchen waste and Water Hyacinth. Renew Energy 2017, 109, 434–439. [Google Scholar] [CrossRef]
- European Commission. Draft Commission Delegated Regulation Supplementing Directive (EU) 2018/2001 on Renewable Fuels of Non-biological Origin and Renewable Fuels of Biological Origin; European Commission: Brussels, Belgium, 2023. [Google Scholar]
- Yan, X.; Ying, Y.; Li, K.; Zhang, Q.; Wang, K. A review of mitigation technologies and management strategies for greenhouse gas and air pollutant emissions in livestock production. J. Environ. Manag. 2024, 352, 12028. [Google Scholar] [CrossRef] [PubMed]
- Song, C.; Liu, Q.; Deng, S.; Li, H.; Kitamura, Y. Cryogenic-based CO2 capture technologies: State-of-the-art developments and current challenges. Renew. Sustain. Energy Rev. 2019, 101, 265–278. [Google Scholar] [CrossRef]
- Aslam, Z.; Felix, A.; Kalyvas, C.; Chizari, M. Design of a Fuel Cell/Battery Hybrid Power System for a Micro Vehicle: Sizing Design and Hydrogen Storage Evaluation. Vehicles 2023, 5, 1570–1585. [Google Scholar] [CrossRef]
- Taleghani, P.; Ghassemi, M.; Chizari, M. Numerical investigation of micro solid oxide fuel cell performance in combination with artificial intelligence approach. Heliyon 2024, 10, e40996. [Google Scholar] [CrossRef] [PubMed]
- Sriram, B.; Shirazi, S.; Kalyvas, C.; Chizari, M. Dynamic load optimization of PEMFC stacks for FCEVs: A data-driven modelling and digital twin approach using NSGA-II. Vehicles 2025, 7, 96. [Google Scholar] [CrossRef]
- Patel, V.K.; Gholamalian, F.; Kalyvas, C.; Ghassemi, M.; Chizari, M. Modelling mass transport in anode-supported solid oxide fuel cells. Electronics 2025, 14, 3486. [Google Scholar] [CrossRef]
- Hosseini, V.; Chen, Y.K.; Madani, H.; Chizari, M. Annual performance evaluation of a hybrid concentrated solar–micro gas turbine based on off-design simulation. Heliyon 2024, 10, e30717. [Google Scholar] [CrossRef] [PubMed]


Disclaimer/Publisher’s Note: The statements, opinions and data contained in all publications are solely those of the individual author(s) and contributor(s) and not of MDPI and/or the editor(s). MDPI and/or the editor(s) disclaim responsibility for any injury to people or property resulting from any ideas, methods, instructions or products referred to in the content. |
© 2026 by the authors. Licensee MDPI, Basel, Switzerland. This article is an open access article distributed under the terms and conditions of the Creative Commons Attribution (CC BY) license.