


Abstract
NaClO3 is a major by-product of the chlor-alkali industry. Establishing a corrosion damage prediction method for 316L stainless steel (316L SS) in NaClO3 and NaCl cooperative environments is crucial for maintaining the service safety of chlor-alkali equipment. Electrochemical tests were conducted to obtain the reaction kinetic parameters of 316L SS in NaClO3 and NaCl environments. Based on COMSOL Multiphysics 6.2.290 simulation, the pitting corrosion behavior of 316L SS in a saturated NaCl and NaClO3 solution at 90 °C and the effect of by-product NaClO3 concentration on corrosion damage evolution were investigated. The simulated pitting depth of 316L SS in a saturated NaCl environment at 90 °C for 30 days was 18.7 μm, and the average pitting depth of the immersion experiment was approximately 21.1 μm, indicating that the simulated pitting depth was in good agreement with the experimental results. Furthermore, the potential, maximum current density and active-state dissolution of the metal were analyzed in NaCl and NaClO3 solutions. After adding NaClO3, the maximum potential, maximum current density and concentration of Cr(OH)2+ decreased by more than 41.5%, 86.4% and 91.2%, respectively. Both the tendency for pitting initiation and the pitting propagation rate of 316L SS were significantly reduced. It is noted that NaClO3 inhibits pitting of 316L SS in saturated NaCl environments.
1. Introduction
The chlor-alkali chemical industry is a key component of the modern chemical industry, which produces essential chemical products, such as hydrogen, chlorine and sodium hydroxide, through the electrolysis of brine [1]. 316L stainless steel (316L SS) is an important structural material for chlor-alkali equipment, which is widely used in brine pipelines, lye storage tanks and evaporator shells. In the chlor-alkali electrolysis and synthesis sections, the high concentration of Cl− and the by-product NaClO3 in the catholyte expose the equipment to high corrosion risks in service [2,3,4,5,6,7,8]. However, the effect of this on corrosion behavior is not clear in the chlor-alkali industry. Therefore, it is of great theoretical and practical significance to investigate the corrosion behavior of 316L SS in the cooperative environment of NaCl and NaClO3 for the safety assessment of chlor-alkali equipment.
Most existing studies have focused on the corrosion resistance of metals under the action of chloride ions alone or a single chlorate ion [9,10,11]. The corrosion resistance of 316L SS primarily stems from the dense passivation film formed on the surface, and 316L SS is highly susceptible to chloride ion-induced corrosion [12,13,14]. The point defect model (PDM) is one of the important theories for explaining the damage of corrosive ions to passivation films. According to the PDM and other relevant theories, aggressive Cl− are prone to adsorption on the passive film surface through hydration, inducing the accumulation of metal ion vacancies on the passive film surface. This ultimately leads to the damage of the passive film and further pitting corrosion and other local corrosion [15,16,17,18,19]. Meng et al. reported that an increase in Cl− concentration in dilute solutions leads to an increase in the vacancy density and vacancy diffusion coefficient in the 316L passivation film, thereby accelerating vacancy aggregation and defect formation [20]. Decreases in pH and increases in temperature will cause an increase in the roughness and a reduction in the thickness of the 316L SS passivation film, resulting in a higher defect density of the passive film in NaCl solutions [21]. Moreover, it has been reported that NaClO3 often promotes corrosion due to oxidability and hydrolyzed chloride ions. Liu et al. investigated the corrosion resistance of steels in ClO3−- and NO3−-containing solutions, and the results indicated that the passivation film in the presence of NaClO3 exhibited poorer stability compared to that in NaNO3 [22]. ClO3− may undergo reduction reactions and introduce additional Cl− into the system, thus accelerating the destruction of the passivation film [23]. At present, research on the effect of NaClO3 on the corrosion of 316L SS in NaCl solution is still insufficient.
Computer simulation is applied to study corrosion mechanisms [24,25,26]. It is challenging to monitor various parameters throughout the entire process of long-term corrosion via corrosion tests. Numerical simulation enables the acquisition of the electric potential and current distribution of metals and compound variations during corrosion, providing a reference for predicting corrosion evolution and formulating corrosion protection strategies [27,28,29].
Therefore, the reaction kinetic parameters of 316L SS in the cooperative environment of NaCl and NaClO3 were obtained through electrochemical tests in this study. Based on COMSOL Multiphysics 6.2.290 simulation, an analysis of corrosion damage evolution of 316L stainless steel in saturated NaCl with different NaClO3 contents was carried out. The effect of by-product NaClO3 concentration on corrosion damage evolution was clarified. Our investigations provide a deep understanding of corrosion damage in the complex environment of the chlor-alkali industry.
2. Experimental Procedures
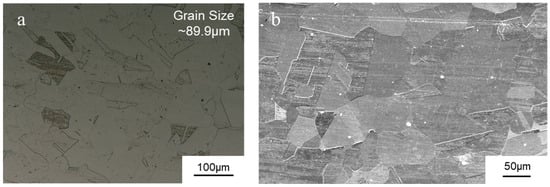
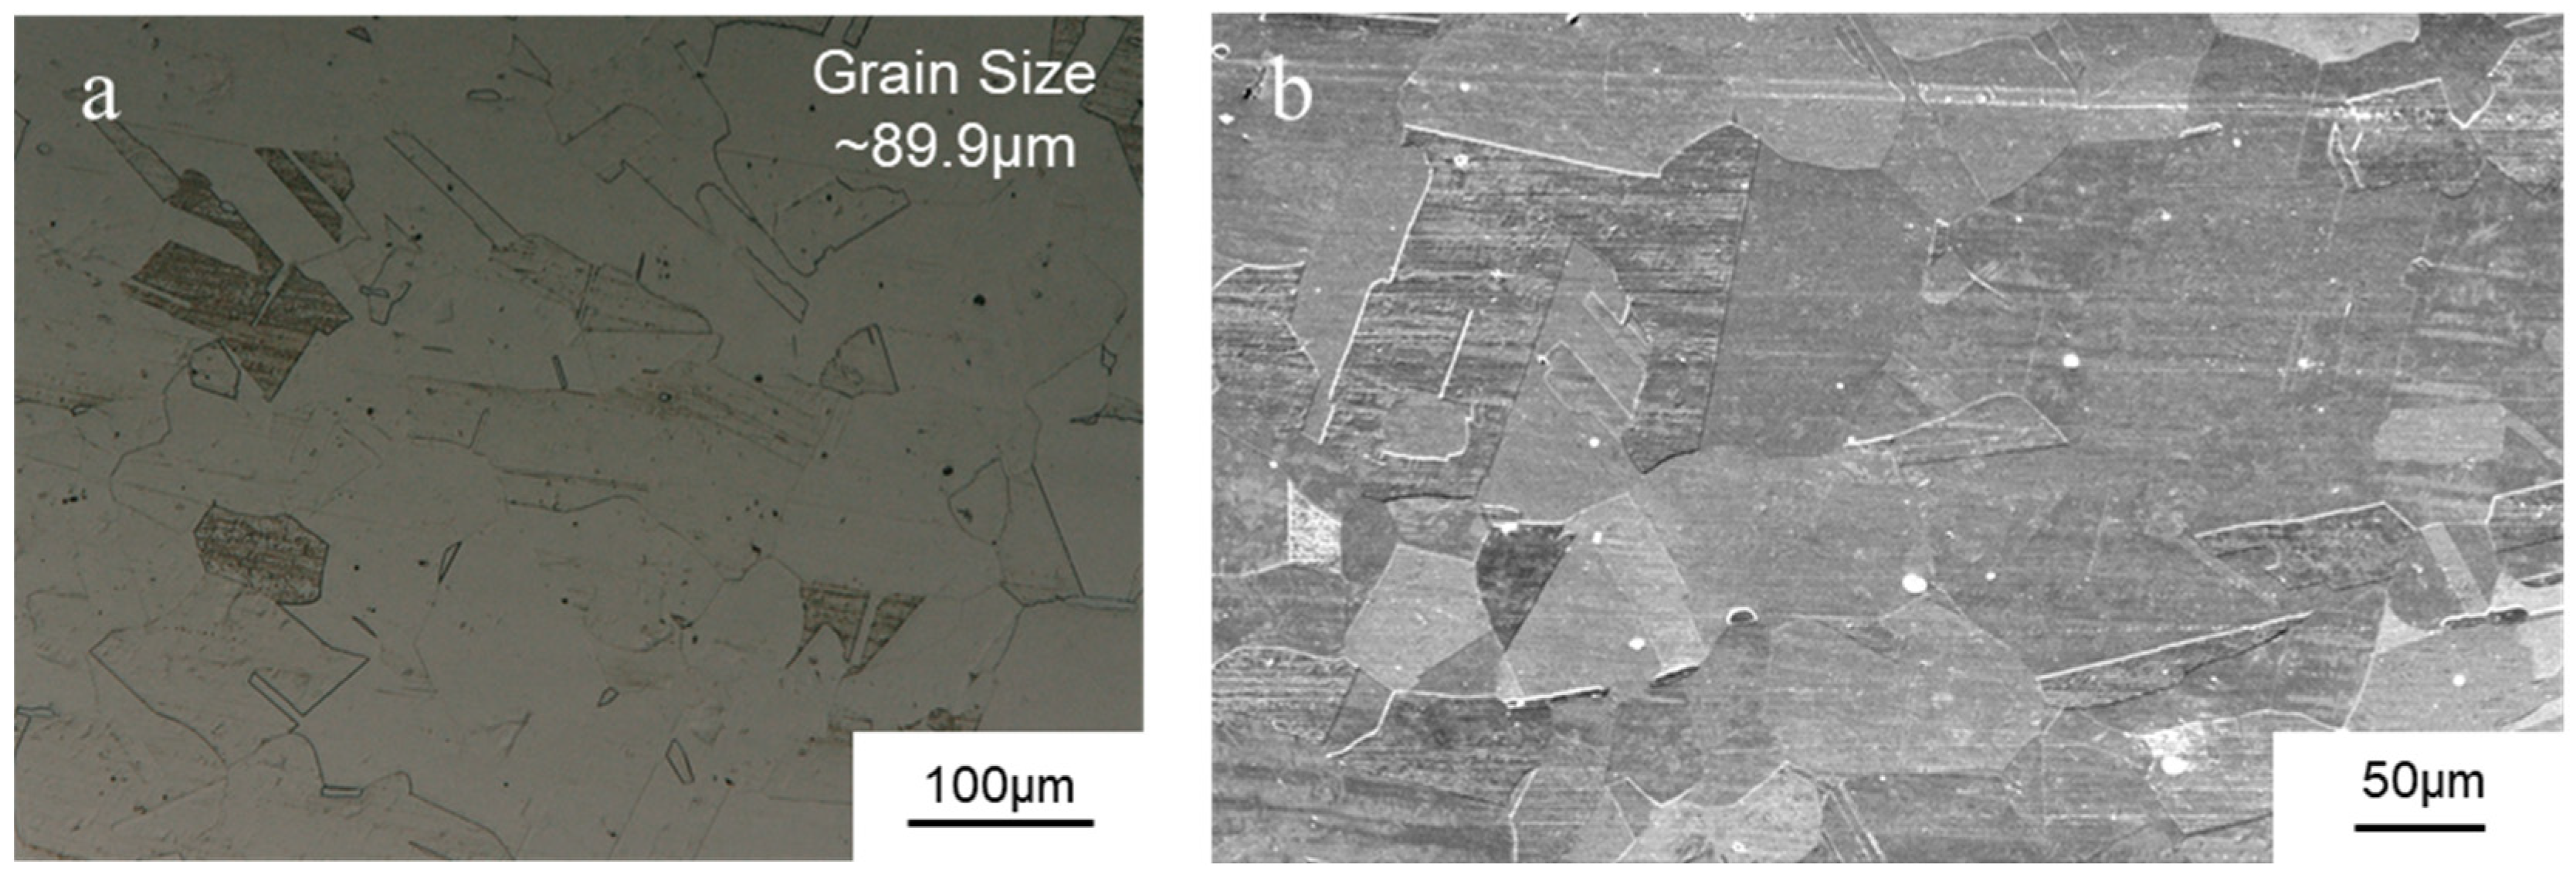
Commercial 316L SS was studied in the present work; the chemical composition is shown in Table 1. Figure 1 shows a metallography image of the as-received 316L SS, and the average grain size is approximately 89.9 μm. Samples were wire-cut into cylindrical discs (Ø25 mm × 3 mm) for electrochemical tests and rectangular coupons (20 mm × 25 mm × 2 mm) for immersion tests. The exposed area of the disc samples was standardized to 1.0 cm2. All samples were mechanically ground with 180#-2000# SiC paper, polished with 1 μm diamond paste, ultrasonically cleaned in deionized water and dried. The samples were electrolytically etched in 10% oxalic acid solution, which was prepared from analytical-grade oxalic acid (Tianjin Heowns Biochem Technologies LLC., Tianjin, China) with a voltage of 6 V for 50 s.
Table 1.
Chemical composition of commercial 316L stainless steel.
Figure 1.
Microstructure of as-received 316L stainless steel: (a) OM and (b) SEM images.
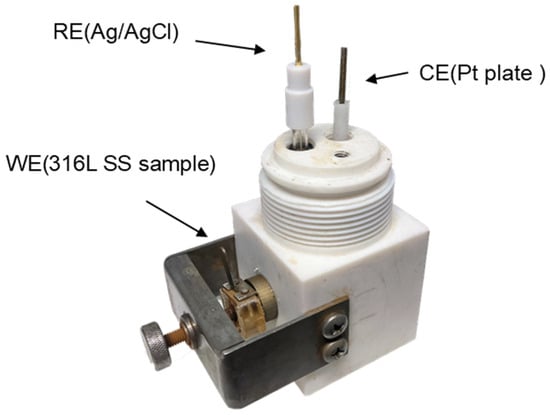
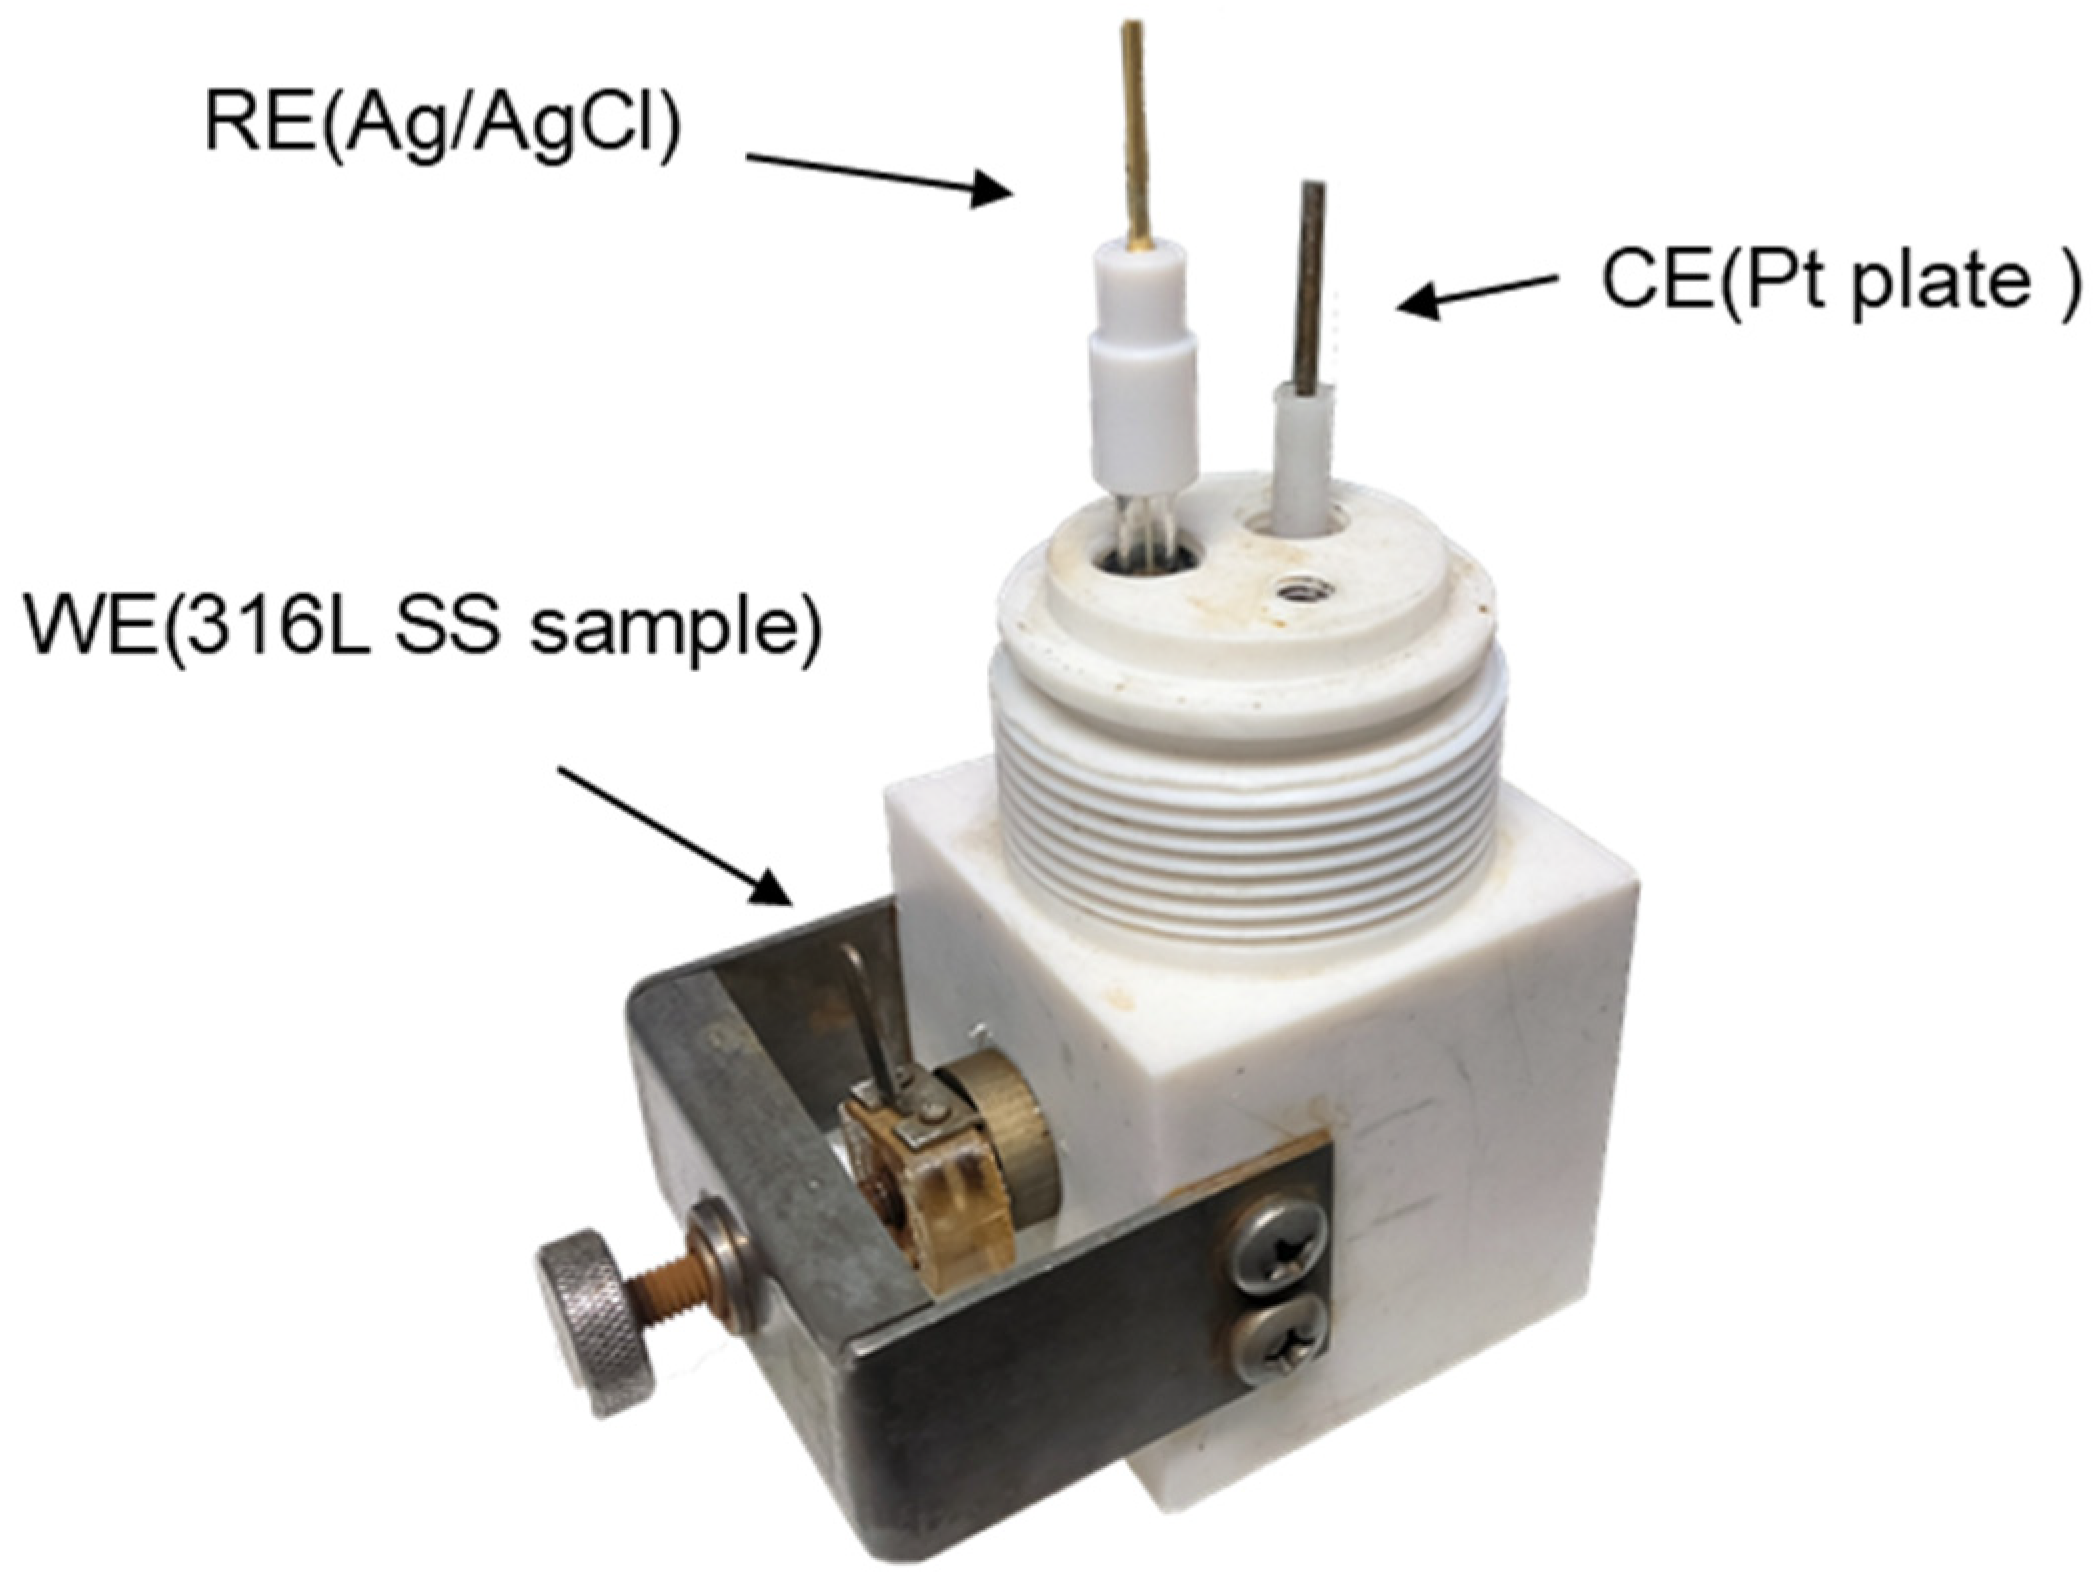
The potentiodynamic polarization curves of the 316L SS in NaCl and NaClO3 solutions were obtained through electrochemical tests. The electrochemical tests were performed on an electrochemical workstation (CS350H; Wuhan Corrtest Instruments Co., Wuhan, China). The test solutions included saturated NaCl solutions and mixed solutions with the addition of 6 g/L, 20 g/L and 40 g/L NaClO3, which were prepared using deionized water and analytical-grade NaCl (Tianjin Heowns Biochem Technologies LLC., Tianjin, China) and analytical-grade NaClO3 (Tianjin Damao Chemical Reagent Co., Tianjin, China). As shown in Figure 2, a standard three-electrode system was adopted for the electrochemical tests, a platinum sheet was used as the counter electrode (CE), an Ag/AgCl electrode was used as the reference electrode (RE) and the surface-treated 316L SS specimen was used as the working electrode (WE). The temperature was controlled by an oven (202-00AB; Tianjin Saidilisi Instruments Co., Tianjin, China).
Figure 2.
Setup of three-electrode electrochemical cell.
According to the temperature in chlor-alkali electrolysis, the electrochemical tests were controlled at 90 °C. The specimen surface was subjected to cathodic polarization at −0.5 VAg/AgCl for 1 min to remove the surface passivation film in the test area. An open-circuit potential (OCP) test was performed for 1 h to ensure that the final segment of the OCP curve remained stable, so that the test system reached a steady state. Subsequently, to obtain the potential–current relationship of the anodic metal dissolution contained in the anodic polarization curves, potentiodynamic polarization curve testing was carried out, scanning from −0.5 V relative to the open circuit to 0.5 V at a scanning rate of 0.1667 mV/s. To obtain the cathodic surface potential–current relationship contained in the anodic polarization curves, after removing the film from the same batch of samples, they were exposed to air for 24 h to allow the reformation of the passivation film on the specimen surface. Then, anodic polarization was performed at room temperature in the passive region potential for 5 min to thicken the passivation film on the specimen surface, followed by potentiodynamic polarization testing. Partial IR compensation (80%) was used to reduce the impact of IR drop caused by solution resistance on the measured potential during the polarization test. Each measurement was repeated at least three times to ensure reproducibility.
For immersion tests, samples were suspended in PTFE holders within sealed reactors containing 300 mL test solutions. Immersion tests were conducted at 90 °C for 30 days. The depth of pits was measured using an ultra-depth three-dimensional optical microscope (VHX-7000; Keyence, Osaka, Japan), and microstructural characterization was carried out by means of an ultra-depth three-dimensional optical microscope (VHX-Z250R; Keyence, Japan) and scanning electron microscopy (SEM; Phenom XL, Eindhoven, The Netherlands). Immersion results were used to confirm the simulated pitting depth.
3. Multiphysics Simulation
3.1. Passivation Film Defect Pitting Model of 316L Stainless Steel
Although 316L SS has excellent corrosion resistance, due to the presence of non-metallic inclusions, cavities, cracks and other defects on the metal material surface, during processing, mechanical micro-defects are inevitably present on the metal surface, with sizes typically in the range of a few micrometers [30]. For metals exposed to chlorine-containing environments, corrosive ions such as Cl− are often adsorbed on the metal surface through the oxygen atom vacancies in the metal passivation film and form metastable pits on the passivation film with the gradual accumulation of vacancies. According to the potentiostatic polarizations and XPS, most of the metastable pits are quickly repassivated, while a small portion are transformed into stable pits. As the exposure time increases, the number of stable pits increases. The higher the chloride ion concentration, the longer the life of metastable pits and the greater the probability of their transition to stable pits [31,32]. The electrolyte contacts the metal matrix from the damaged area, electrochemical autocatalytic corrosion occurs at the passivation film interface [33]. The passivation film exhibits stronger chemical inertness compared to the metal matrix, making the oxide layer assume the cathodic function, and the reduction reaction occurs on the passivation film surface; the metal matrix serves as the anode of the galvanic cell, and the oxidation reaction occurs at the contact between the metal matrix and the electrolyte. This causes the corrosion of the metal matrix and the generation of metal ions. This process continues, making the corrosion interface continuously penetrate into the metal matrix from the passivation film defect, forming pitting corrosion.
3.2. Local Electrode Reactions
In the electrode kinetics simulation, only the local dissolution of the metal matrix was considered in the anodic region. During the pitting process, localized acidification occurs in pits, and the cathodic reaction is controlled by the hydrogen evolution reaction (HER). Therefore, it was assumed that the system is oxygen-free and only the hydrogen evolution reaction was considered in the cathodic part. For the electrochemical corrosion reaction of 316L SS in NaCl solution, Cl− and ClO3− do not participate in the chemical reaction. The anodic reaction is as follows:
The cathodic reaction is as follows:
where M represents the three main elements in 316L SS (Fe, Cr and Ni) and n is the number of electrons lost by each metal element during the oxidation reaction [34]. It is assumed that the electrochemical reaction occurs at the metal–electrolyte solution interface, and the metal elements in 316L SS contribute to the total corrosion reaction according to their molar fractions [35]. The content of other elements in 316L SS is too low to be ignored, so only the dissolution of these three anodic metal elements is considered, with an average number of electrons of 2.16. The total anodic current is as follows:
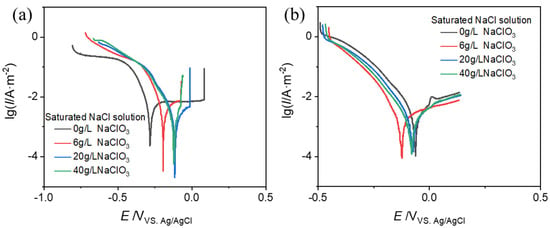
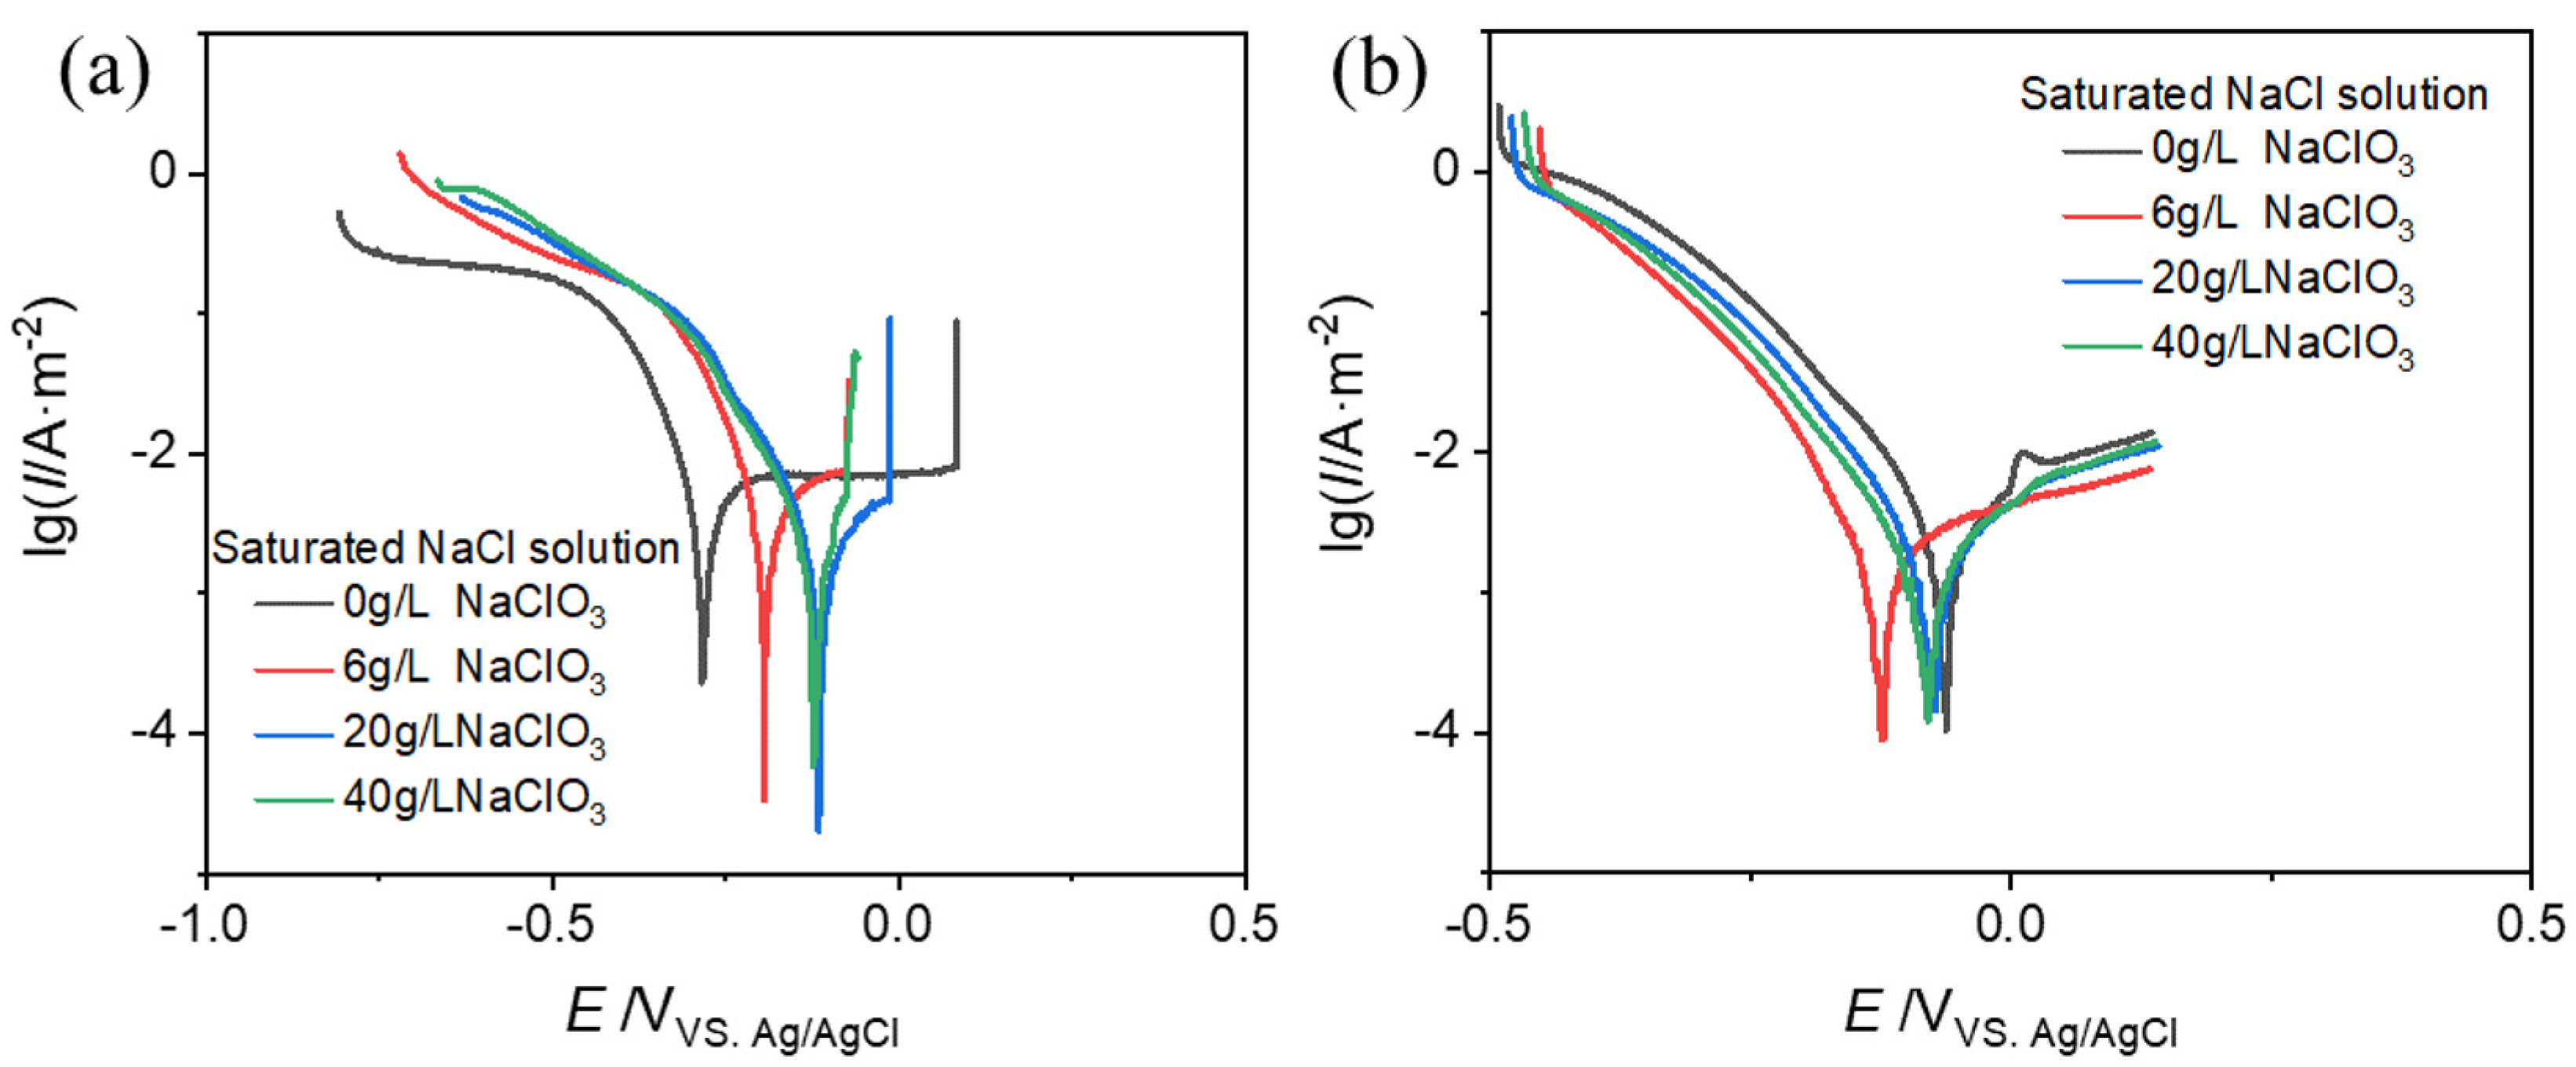
The potentiodynamic polarization curves of 316L SS in saturated NaCl solution and saturated NaCl solutions with the NaClO3 addition of 6 g/L, 20 g/L and 40 g/L were measured through electrochemical tests at 90 °C. The transient relationship between the electrode potential and current density in the diffusion layer was described by the active dissolution segment of the polarization curve. The anodic and cathodic polarization curves are shown in Figure 3.
Figure 3.
316L stainless steel (a) anodic and (b) cathodic polarization curves.
3.3. Mass Transfer and Charge Conservation Equations
During the electrochemical corrosion process, the electrolyte continuously undergoes mass transport with the electrode surface, affecting the ion concentration and distribution in the electrolyte solution. For the mass transfer model in this study, the mass transfer process in the dilute solution is expressible via the Nernst–Planck equation [24]:
where Ni is the ion flux, Di is the diffusion coefficient of the ion in the electrolyte, Ci is the concentration of the substance in the electrolyte, F is the Faraday constant, Zi is the charge number of the ion, ϕl is the potential gradient in the electrolyte, U is the convection velocity of the electrolyte and ui is the ion mobility. In the dilute electrolyte solution, the ion mobility can be described using the Nernst–Einstein equation:
Equation (1) represents the total ion flux at the corrosion interface. Among the terms on the right-hand side of the equation, the first term represents the diffusion process of the substance, the second term represents the migration process of charged particles and the third term represents the convection process of the substance. In this model, the electrolyte is stationary. Thus, the convection of the substance is not considered, and the third term can be omitted. According to the principle of mass conservation, the mass balance of each substance can be expressed as follows:
where Ri is the source term of ions in the flux.
The diffusive transport and directional migration of charged species give rise to a current, il, in the electrolyte solution, and its current density is as follows:
This model incorporates no external current source, with charge conservation maintained in the electrochemical system. Based on Gauss’s law, the divergence of the current density vector equals 0:
According to the local electroneutrality assumption, the net electric charge at any point within the electrolyte is equivalent to 0, and the potential distribution in the electrolyte can be obtained:
During the electrochemical reaction, the 316L SS serving as the anode electrode continuously dissolves. According to Faraday’s law, the reaction rate of anode dissolution is calculated by the current density of the anodic reaction. For the flux of each ion entering the electrolyte solution, the following obtains:
where vi is the stoichiometric coefficient of the reaction and il is the anodic current density of the reaction.
The metal elements dissolve into metal cations, Fe2+, Cr3+ and Ni2+, and enter the electrolyte solution, undergoing multi-step hydrolysis and complexation reactions. Taking iron as an example, the first-step hydrolysis and complexation reactions are as follows:
The reaction rate, Ri, is the source term of Equation (1), which is expressed by the forward and reverse reaction rate constants and the concentrations of various reactants in the homogeneous reaction. Taking the first-step hydrolysis reaction of Fe2+ as an example:
where C represents the concentrations of various ionic substances in the homogeneous reaction and kf and kb correspond to the forward and reverse reaction rate constants, whose values are related to the equilibrium constants of their respective reactions:
The reaction rate of each ion can be calculated. Due to the extreme complexity of hydrolysis reactions in pitting pits, only some of the main reactions are considered in this model, and the relevant parameters of the reactions are derived from data at 25 °C [36,37,38]. The particle diffusion coefficient was corrected according to the Stokes–Einstein equation:
where D is the diffusion coefficient, k is the Boltzmann constant, T is the absolute temperature, η is the fluid viscosity and r is the ion radius. The fluid viscosity was corrected to the value of saturated NaCl solution at 90 °C [39]. The diffusion coefficients of various ions involved in the model are shown in Table 2.
Table 2.
The calculated diffusion coefficients of the ions involved in the present model.
The equilibrium constant was calculated using the definite integral form of the van’t Hoff equation:
where ΔHθ is the enthalpy change of the reaction at 25 °C. The equilibrium constants of various reactions involved in the model are shown in Table 3.
Table 3.
The calculated equilibrium constants of reactions involved in the present model.
3.4. Numerical Calculation Method
The phase-field equation was used to describe the evolution of the interface between the metal and the electrolyte solution, capturing the diffusion boundary between immiscible phases [20]. The evolution of the corrosion front was tracked by the dimensionless phase-field variable, ϕ, which transitions from −1 (electrolyte domain) to 1 (metal electrode) at the diffusion interface, as dictated by the Cahn–Hilliard equation:
where u is the interface moving speed, λ is the mixing energy density, ψ is the phase-field auxiliary variable, σ is the surface tension coefficient, ϵ = hmax/16 is the interface thickness parameter (hmax is the maximum mesh size) and γ is the mobility.
In the phase-field interface, we designate the electrolyte domain phase as Fluid 1 and assign the metal electrode phase to Fluid 2. The volume fractions between the two phases in the results are as follows:
The interface moving speed, u, represents the dissolution rate of the anode metal electrode, which is obtained through the current density generated by the electrode reaction. An interpolation method was used to define a distribution function, micro(x,y), to describe the microstructure of the material cross-section:
where 1 represents the passivation film in the cathodic region and 0 represents the metal matrix in the anodic region. This micro-function was used to distinguish the passivation film and the metal matrix in the microstructure, so the anodic metal dissolution reaction occurs in the α-phase region and the cathodic reduction reaction occurs on the β-phase surface. Accordingly, the α-phase metal matrix undergoes dissolution, whereas the β-phase passivation film region remains intact. The rate of metal dissolution is governed by the surface migration rate of the α phase:
where il is the corrosion current density, M is the molar mass of the metal and ρ is the metal density. The boundary of the electrolyte domain was set as the inlet boundary, and the boundary of the electrode domain was set as the outlet boundary. The anodic and cathodic current densities were multiplied by micro(x,y) and 1-micro(x,y), respectively, to make the metal dissolution rate ignore the influence of the cathodic current.
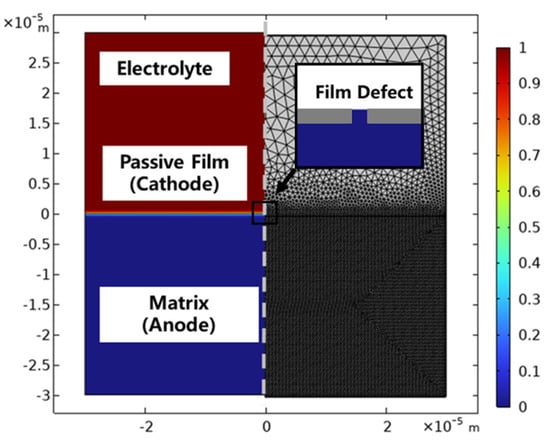
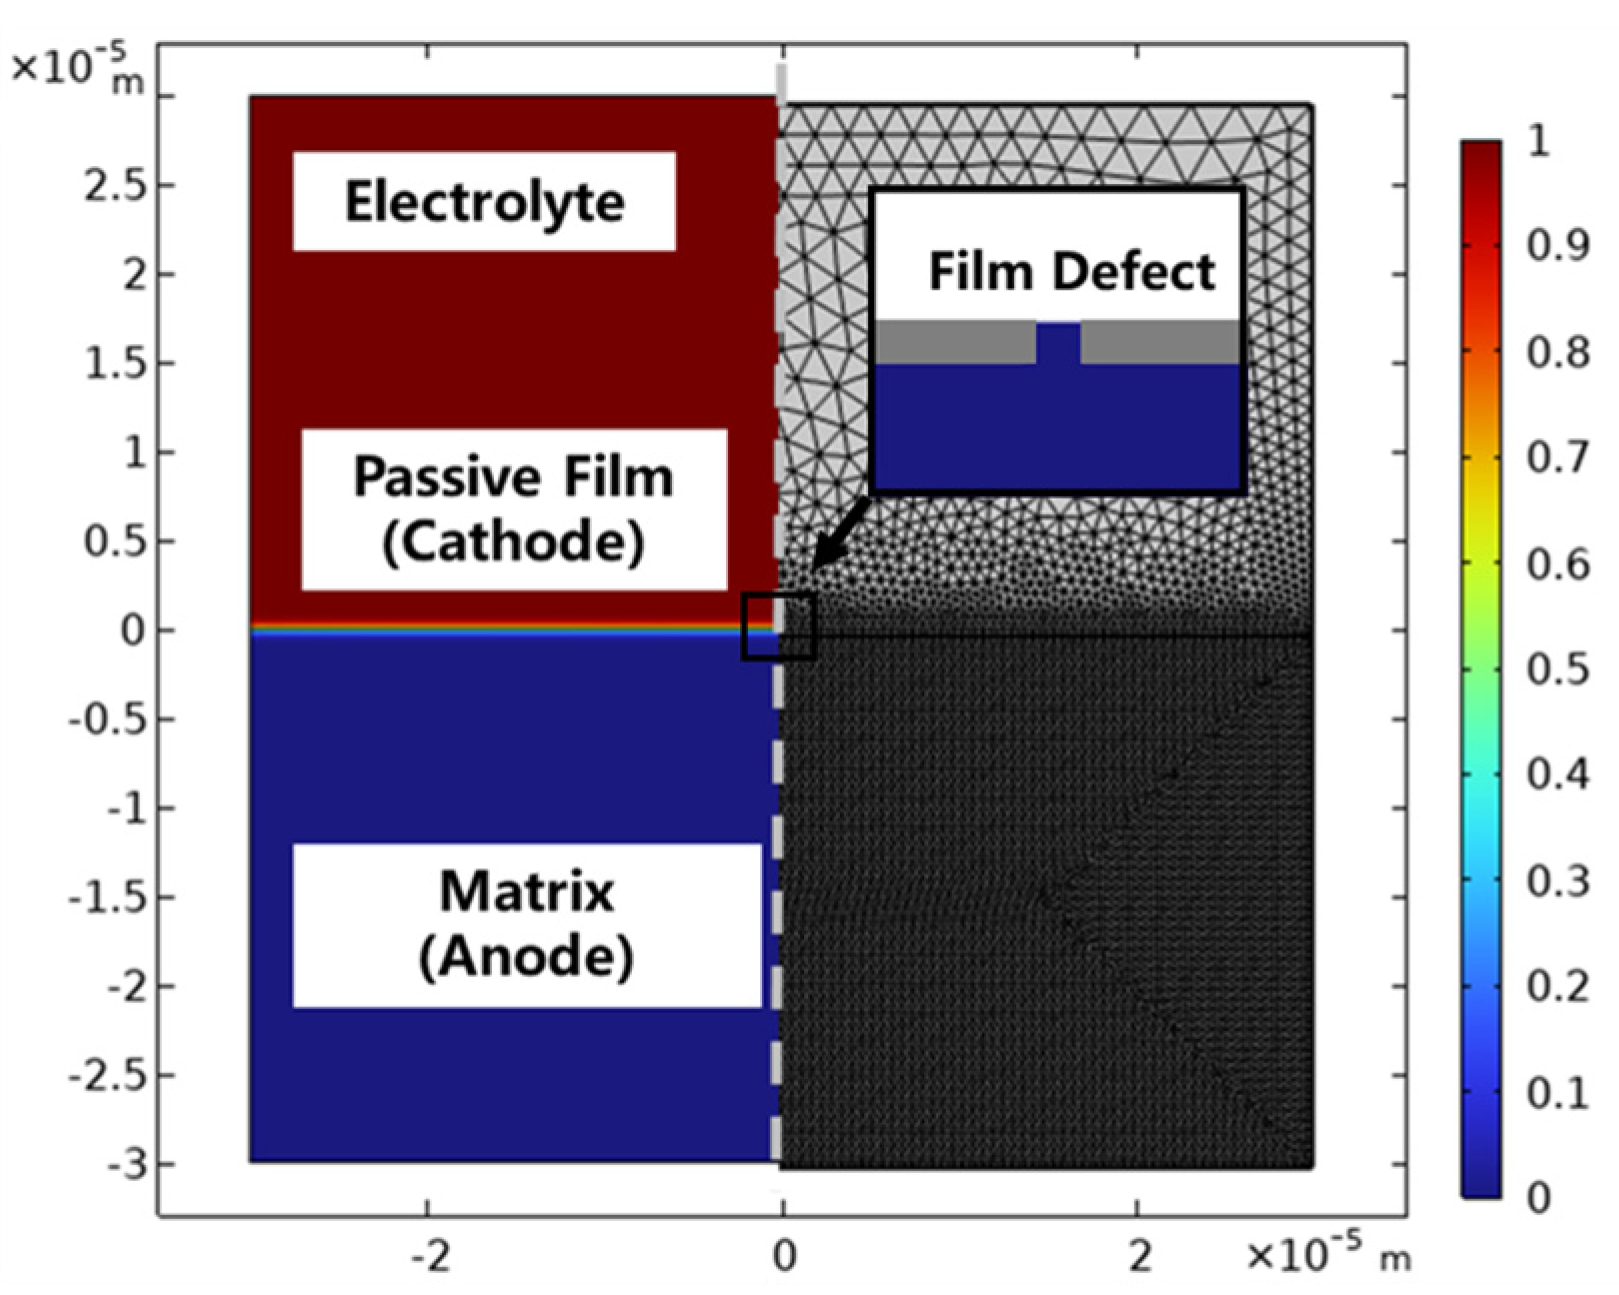
A pitting corrosion model starting from passivation film defects was established. As shown in Figure 4, the model size was 60 × 30 μm, constructed by an interpolation function, including the 316L SS matrix and the passivation film with surface defects. According to the literature, the thickness of the passivation film was 1 μm, and the defect size was 1 μm [40,41]. For the electrolyte solution domain with mild physicochemical variations, a regular meshing scheme was adopted, whose parameters were specified as follows: a maximum element size of 2.7 µm, a minimum element size of 0.12 µm, a maximum element growth rate of 1.15, a curvature factor of 0.3 and a narrow region resolution of 1. In contrast, an ultra-refined meshing strategy was applied to the metal matrix domain where the corrosion interface undergoes dynamic migration, with the mesh parameters set as follows: a maximum element size of 0.4 µm, a minimum element size of 1.2 × 10⁻³ µm, a maximum element growth rate of 1.05, a curvature factor of 0.2 and a narrow region resolution of 1.
Figure 4.
Simulation model of pitting corrosion for 316L stainless steel.
4. Results and Discussion
4.1. Pitting Corrosion Evolution of 316L Stainless Steel in Saturated NaCl Solution at 90 °C
4.1.1. Pitting Corrosion Evolution
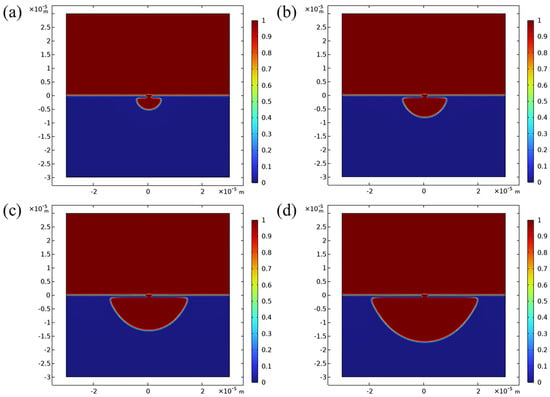
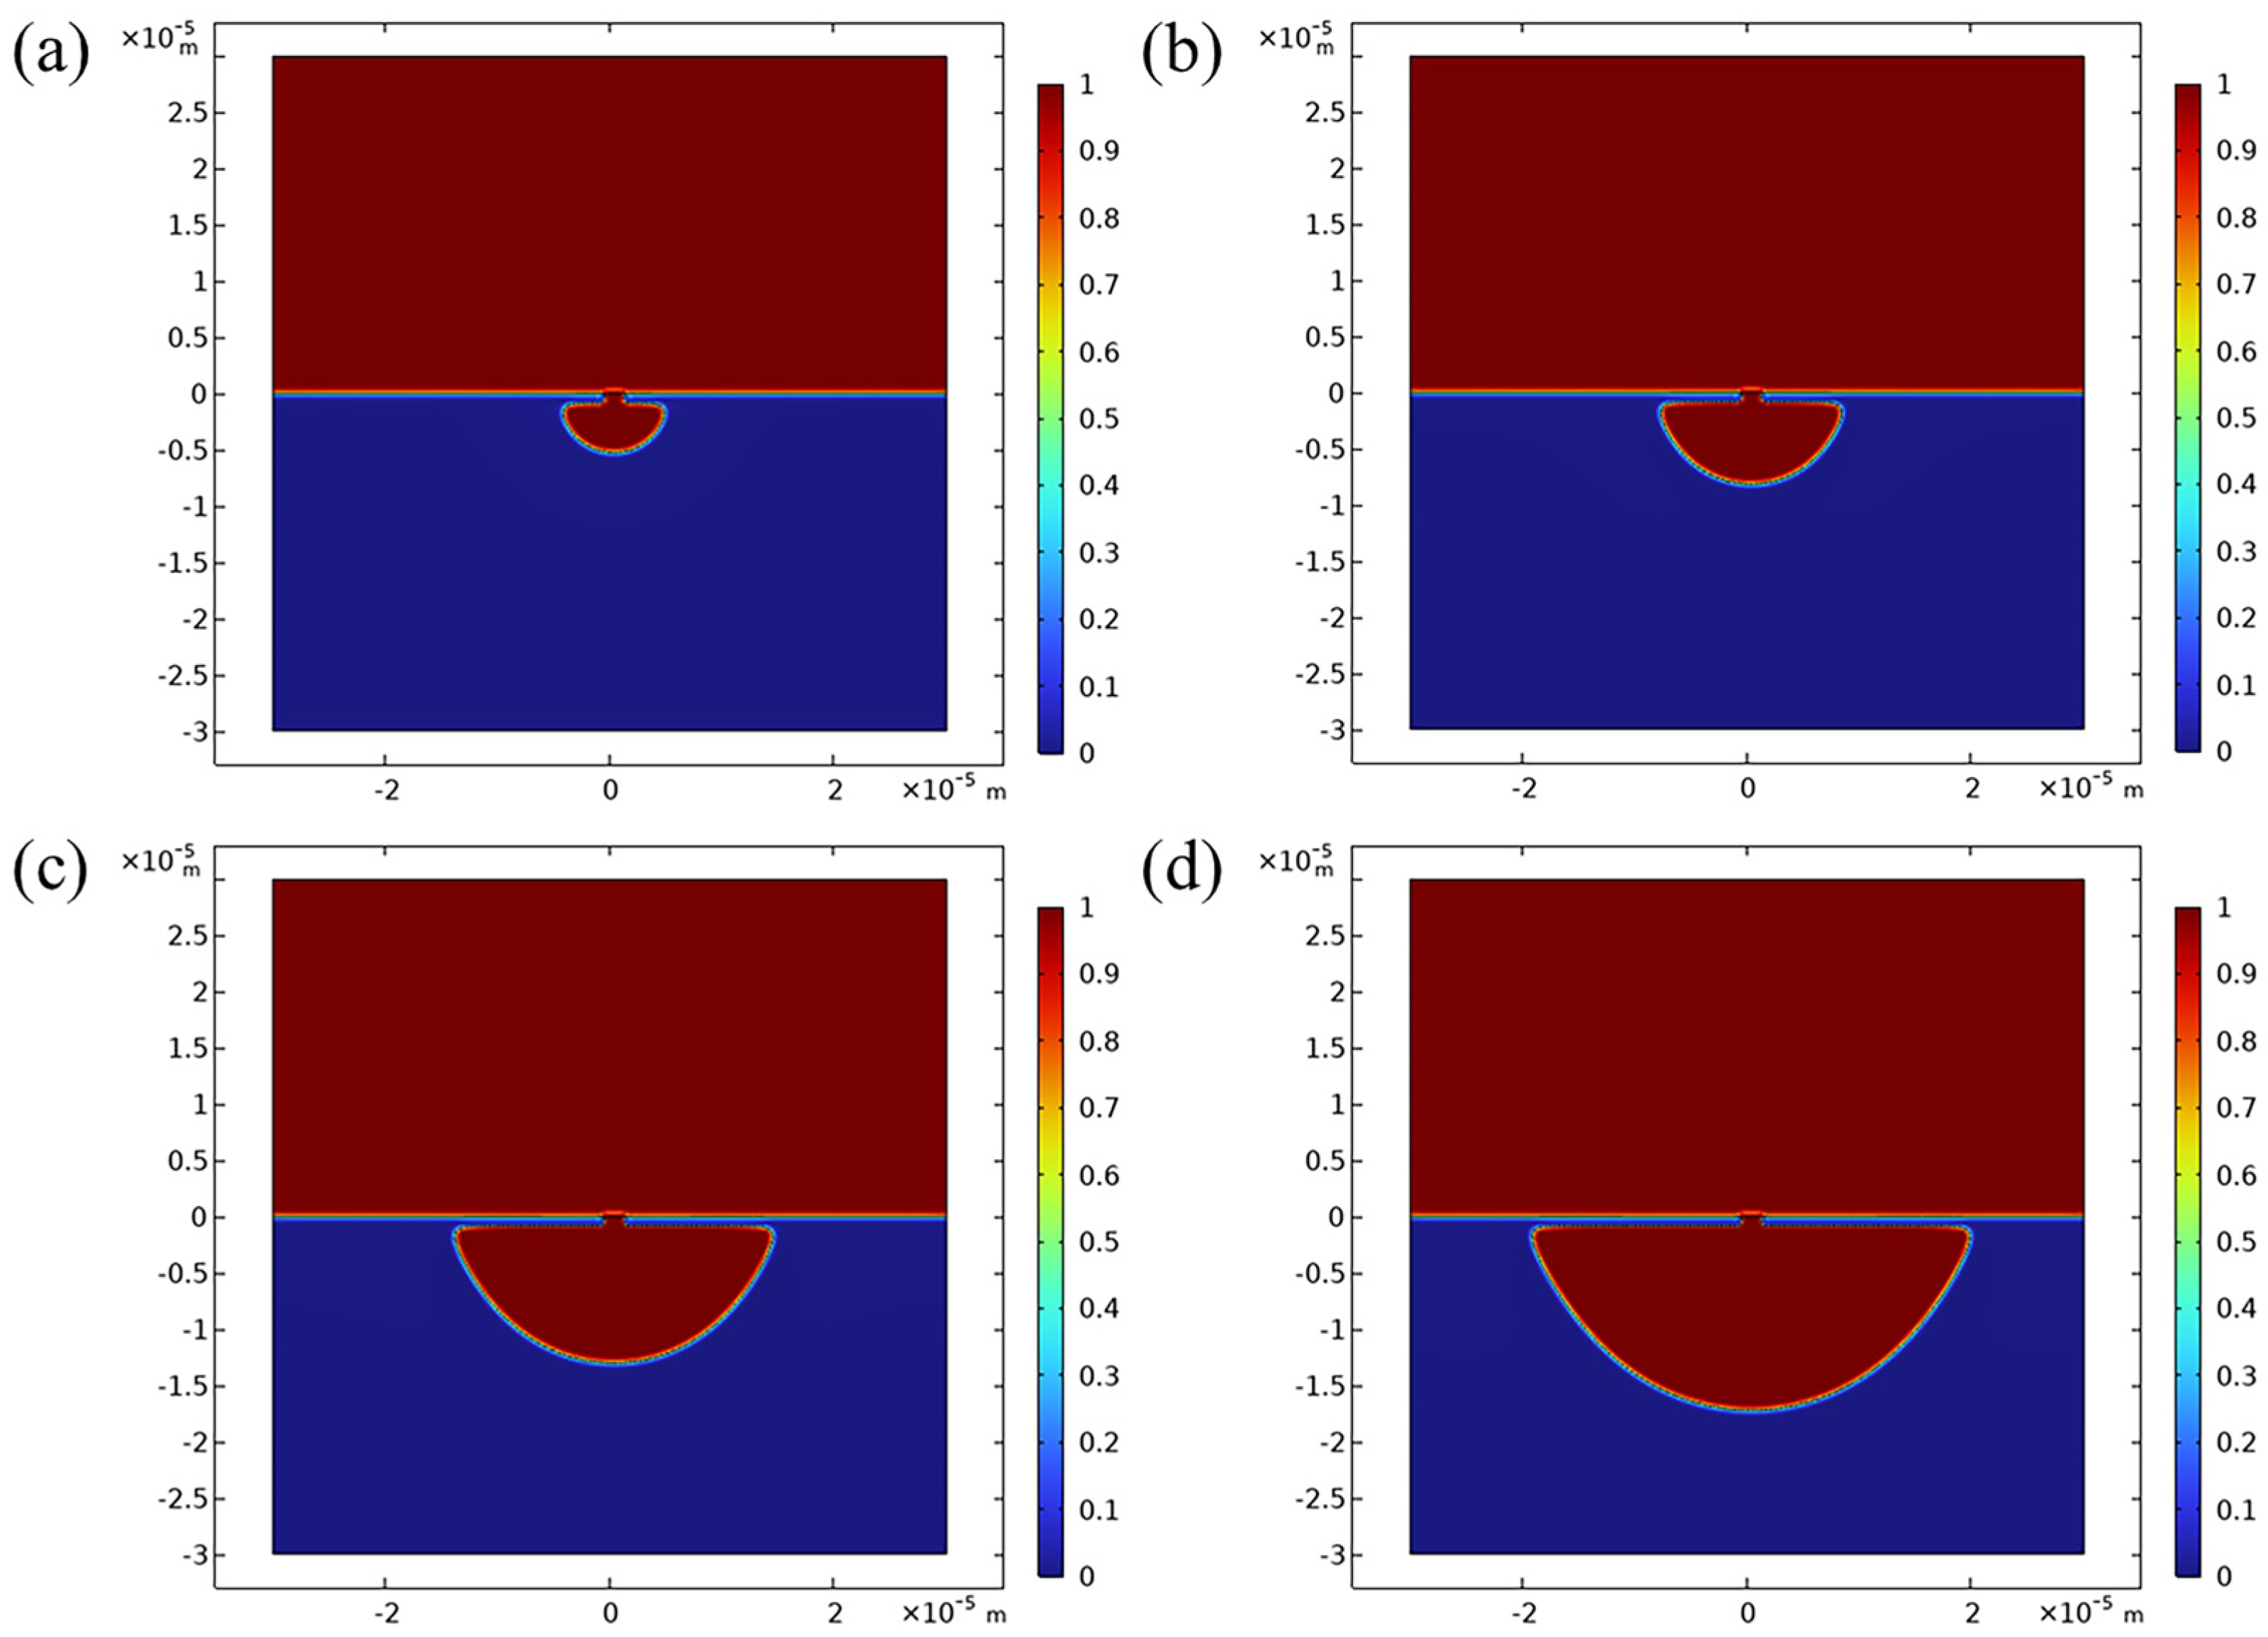
Figure 5 shows the simulated pitting corrosion of 316L SS in saturated NaCl solution at 90 °C. In the initial state, the passivation film defect is the starting point of pitting corrosion at the electrolyte solution–metal interface. The electrolyte solution gradually penetrates into the metal matrix from the defect. The active matrix serves as the reaction anode, and the passivation film serves as the cathode, generating pitting corrosion. As shown in Figure 5a, pitting corrosion expands along the width and depth directions at the defect under the passivation film after 5 days, forming a micro-pitting pit with a semi-elliptical cross-section and a maximum depth of approximately 5.2 µm. As shown in Figure 5b,c, the pit size continues to increase with increasing time. In situ observation of the initiation of pits starting from defects confirms that they grow both horizontally and vertically in the early stage, almost presenting a hemispherical shape [42]. As shown in Figure 5d, the growth rate of pitting corrosion in the depth direction is faster than that in the width direction under the passivation film, indicating that pitting corrosion tends to erode deep into the metal matrix, with a maximum pit depth of 18.7 µm at 30 days. In some studies, residual pit covers were found from pitting in high-Cl—-concentration environments. According to in situ monitoring, when corrosion products flow and leak, this may cause the rupture of the pit cover, leading to further development of pits into other shapes [43].
Figure 5.
Development of pitting corrosion on 316L stainless steel over time: (a) 5 days; (b) 10 days; (c) 20 days; (d) 30 days.
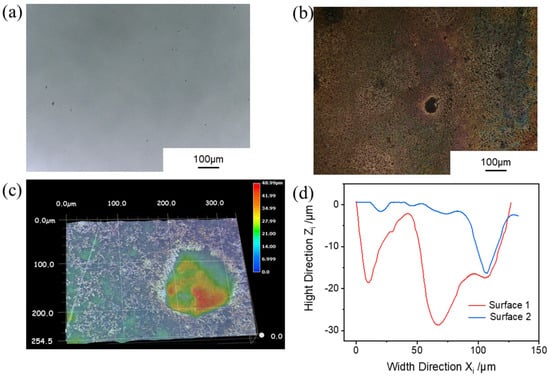
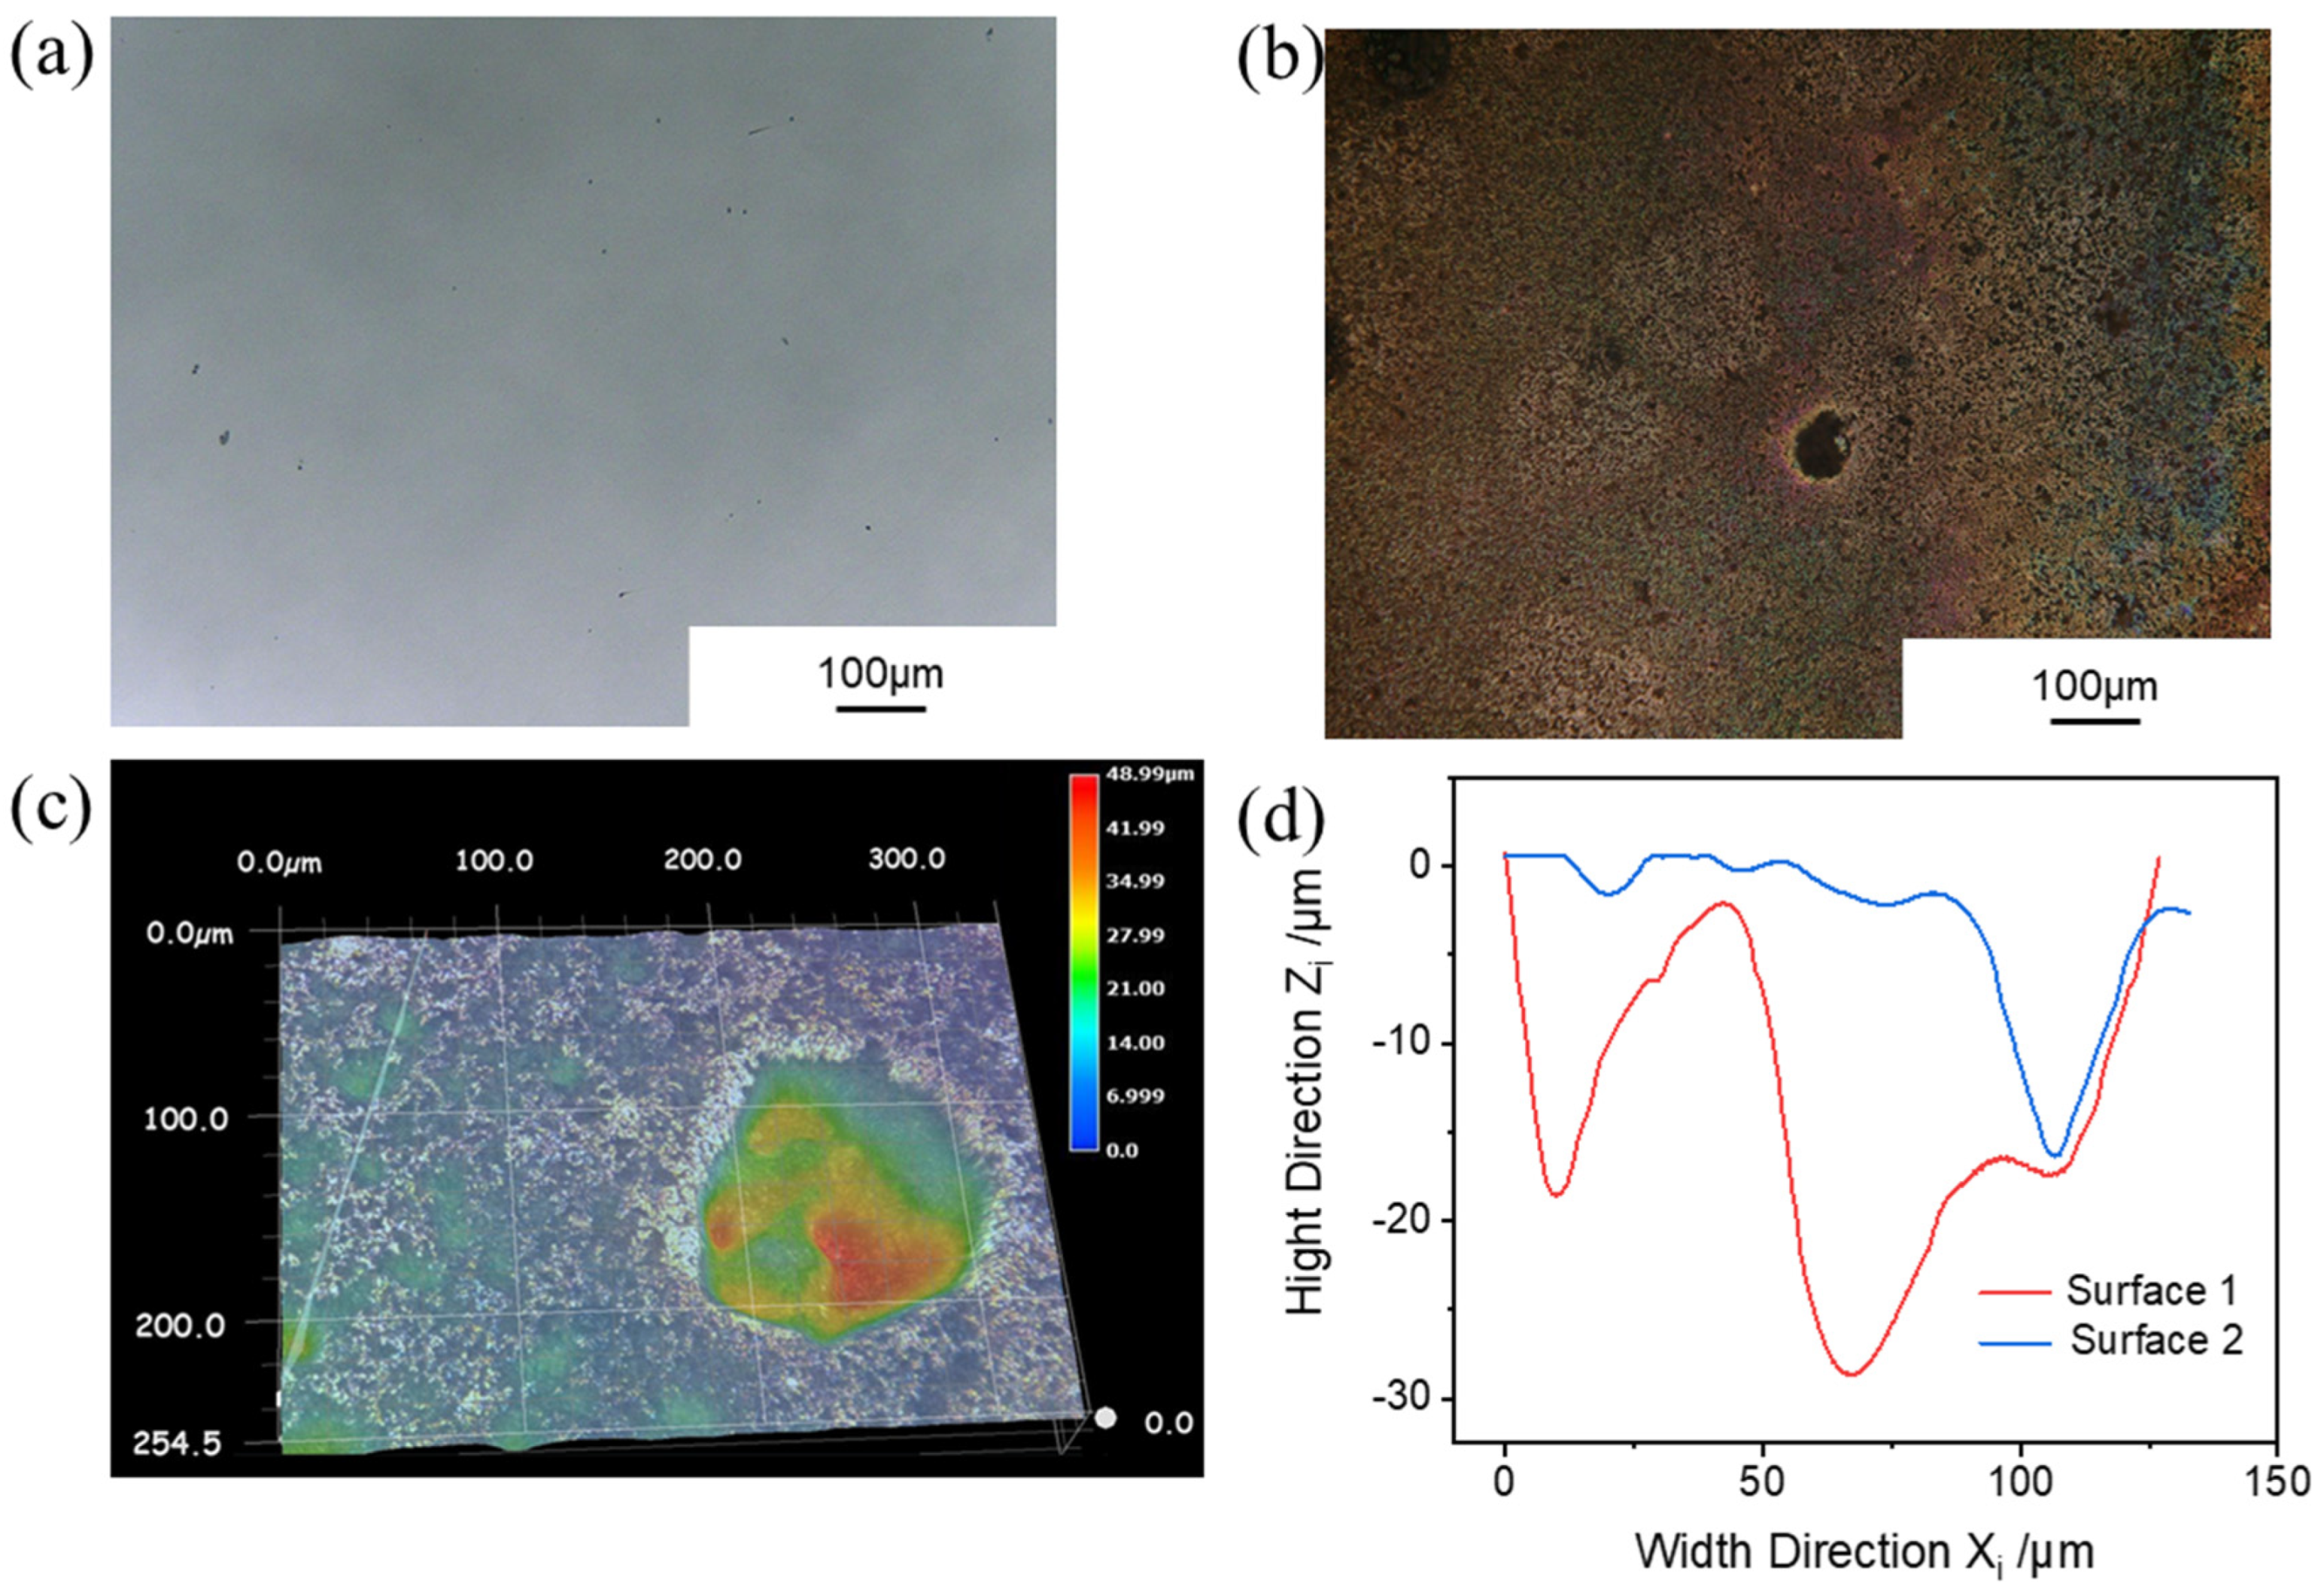
In order to verify the simulation results, the immersion test was also carried out in saturated NaCl solution at 90 °C for 30 days. As shown in Figure 6a,b, the surface of the specimen showed obvious pitting after immersion. As shown in Figure 6c,d, three-dimensional topography was measured for the pitting pits, and the average depth of three typical pitting pits was 21.1 µm, indicating that the simulation results are in good agreement with the experiment results.
Figure 6.
Typical pitting morphology after immersion in saturated NaCl solution at 90 °C for 30 days: (a) initial morphology; (b) surface topography after immersion; (c) three-dimensional topography of pitting; (d) pit depth.
4.1.2. Potential Distribution and Current Density
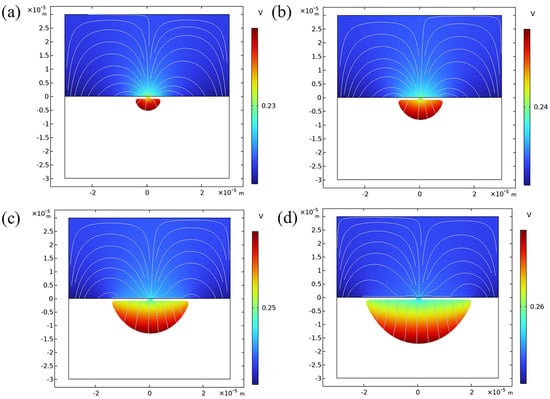
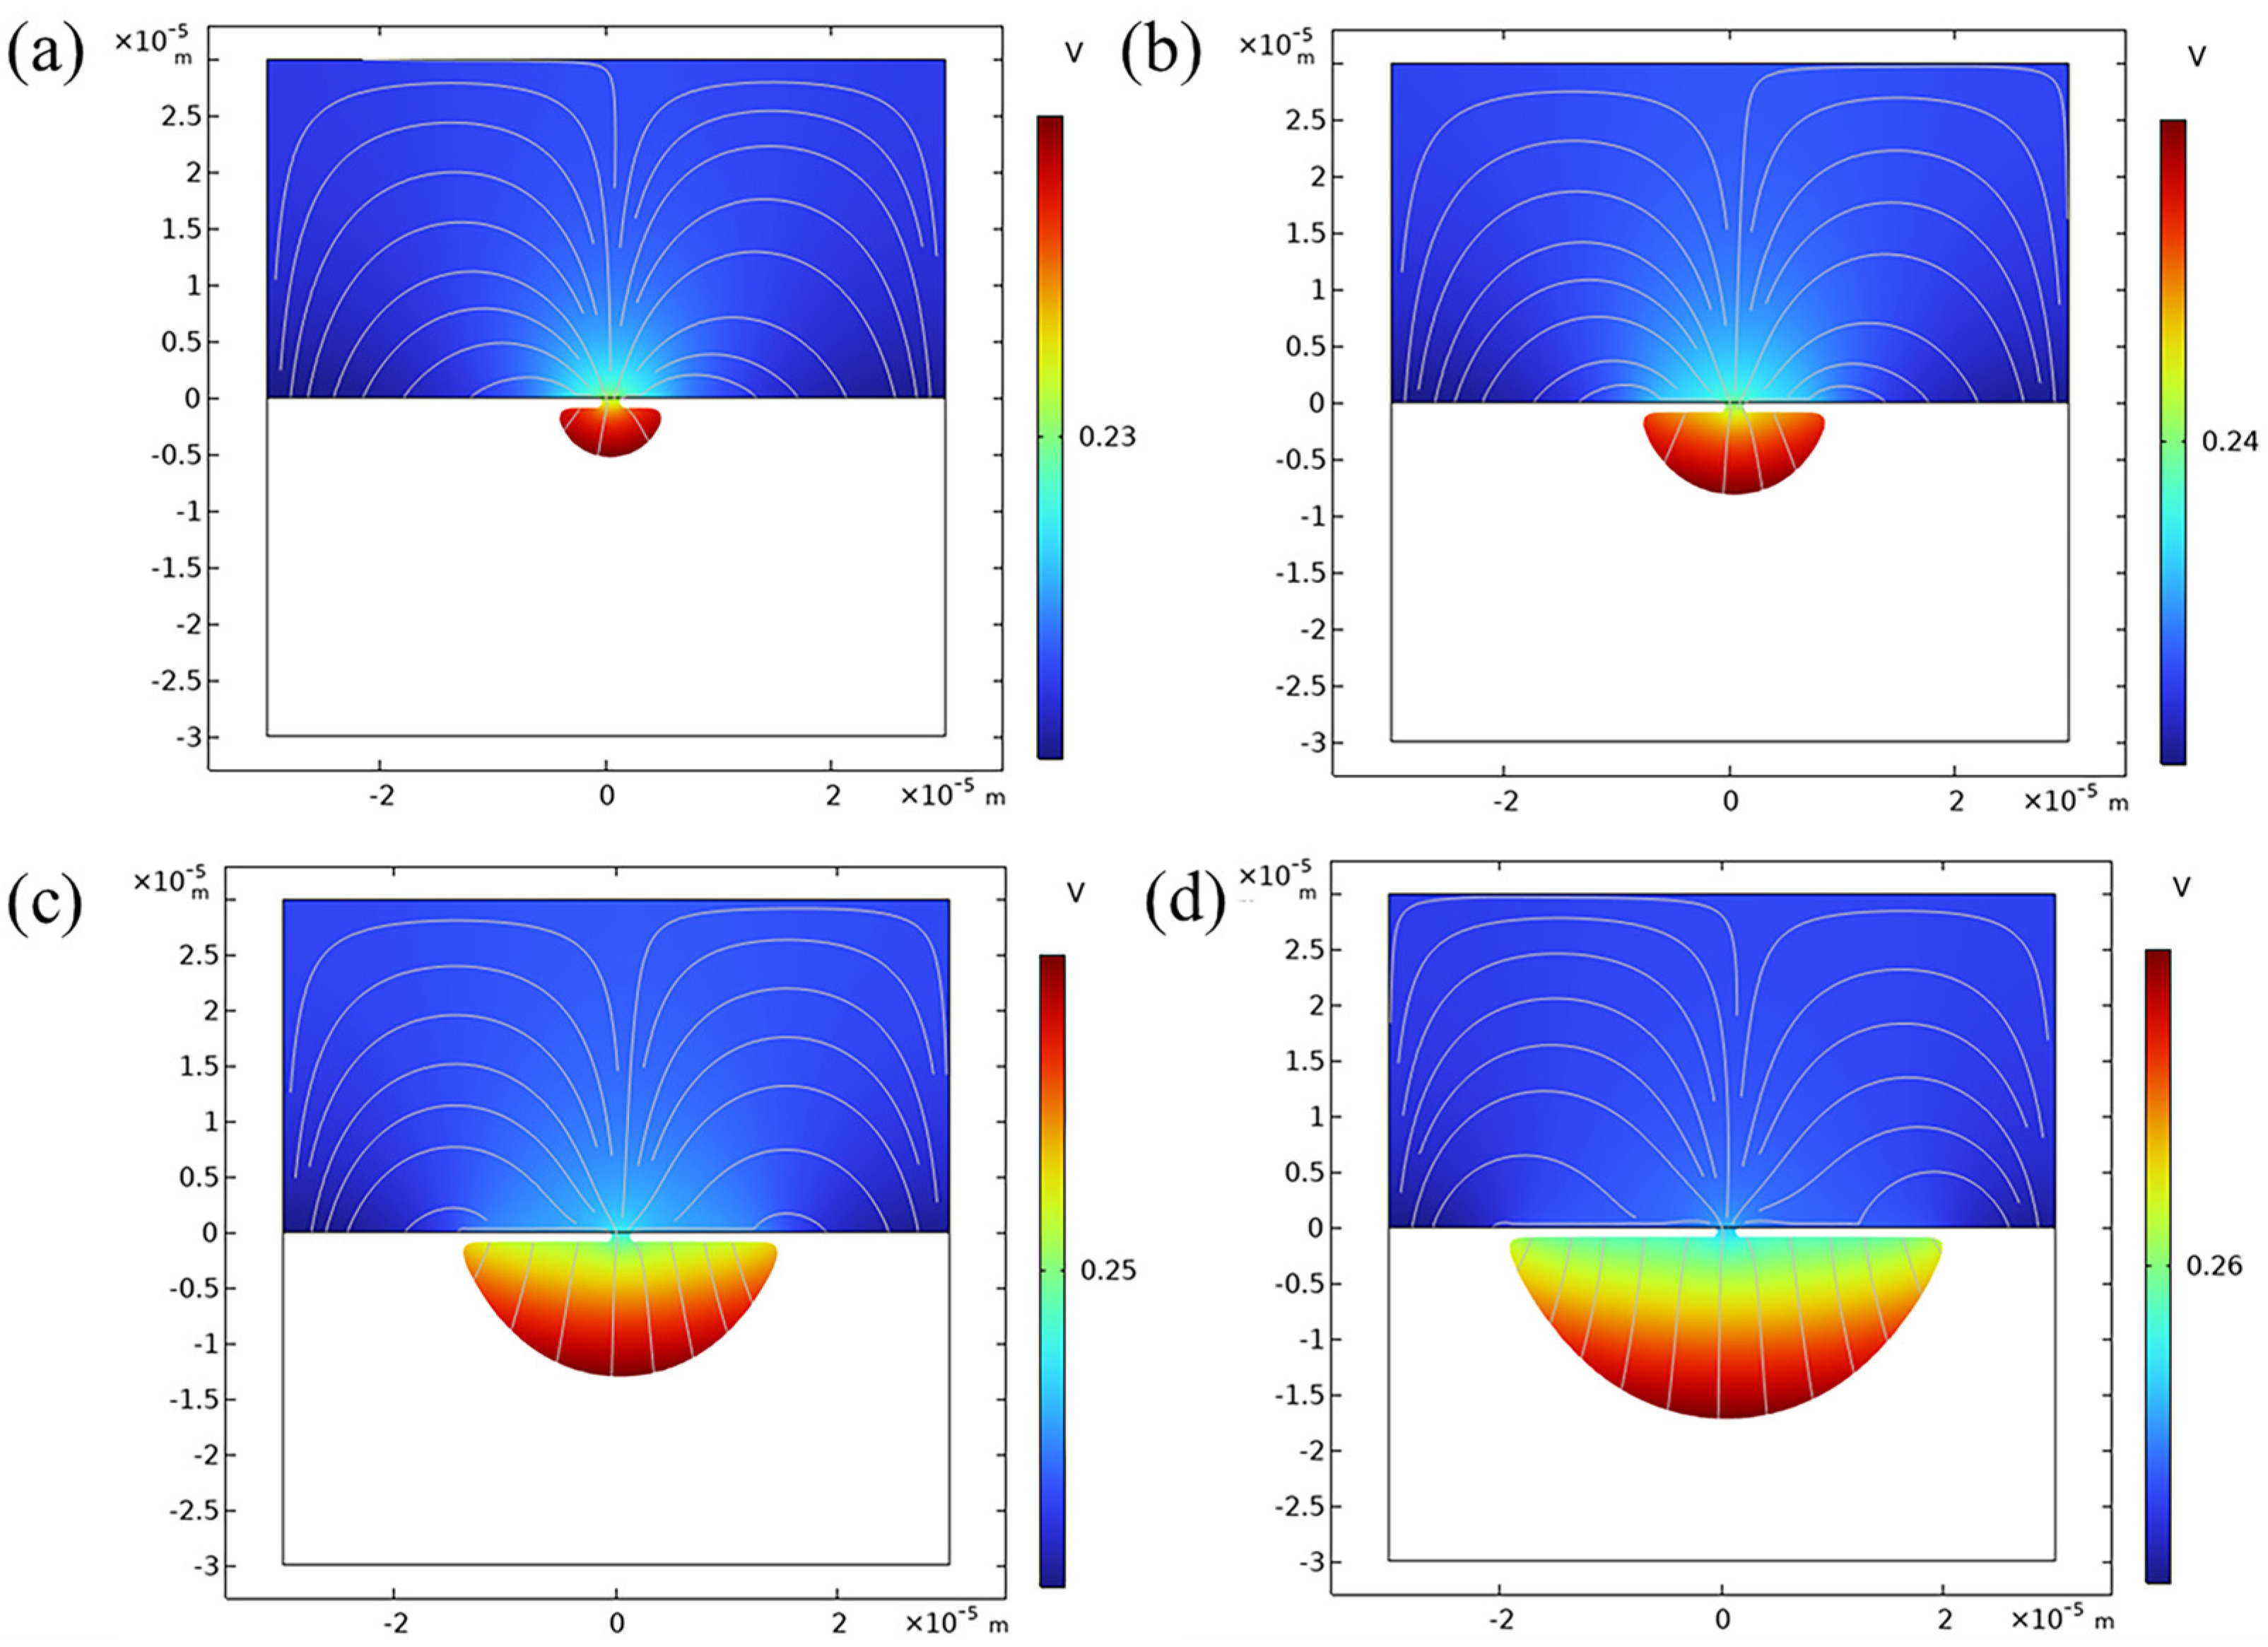
The potential distribution indicates the tendency of active dissolution. As shown in Figure 7a, at the initial stage of corrosion, the potential at the passivation film defect is relatively high in the model. The anodic reaction will preferentially start from the high potential, indicating that the pitting corrosion initiates at the passivation film defect. The potential on the passivation film surface is relatively low, indicating that the cathodic reaction will occur on the passivation film surface. Metastable pitting often occurs at high potentials. Tian et al. used different voltages to excite small-area electrodes, proving that more overlap current transients occur at high potentials, and the probability of metastable pit stabilization is higher [31]. As shown in Figure 7b, after 10 days, the metal matrix is corroded from the passivation film defect to form a semi-elliptical micro-pitting pit, and the electrolyte solution enters the pit. The metal matrix at the inner surface of the pit is the high-potential region, indicating that the anodic reaction will occur at the inner surface of the pit. The corrosion develops uniformly along the inner surface in both horizontal and vertical directions. There is an accumulation of charged particles in the electrolyte solution inside the pit, and the potential is significantly higher than that of the electrolyte solution outside the pit. As shown in Figure 7c,d, with increasing pitting size, the potential at the bottom of the pit is higher than that at the middle section of the pit, indicating that the corrosion rate in the depth direction of pitting corrosion is faster than that in the width direction.
Figure 7.
Potential distribution in the pitting corrosion model of 316L stainless steel over time: (a) 5 days (b); 10 days; (c) 20 days; (d) 30 days.
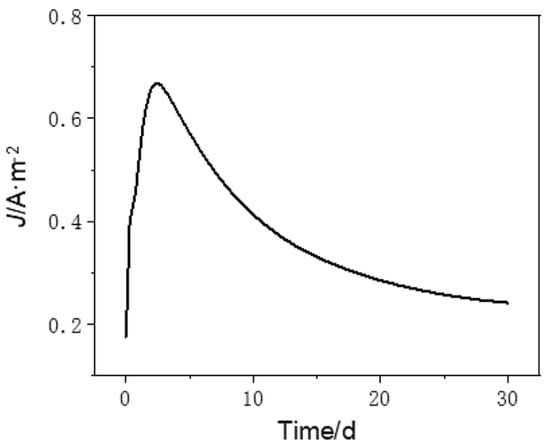
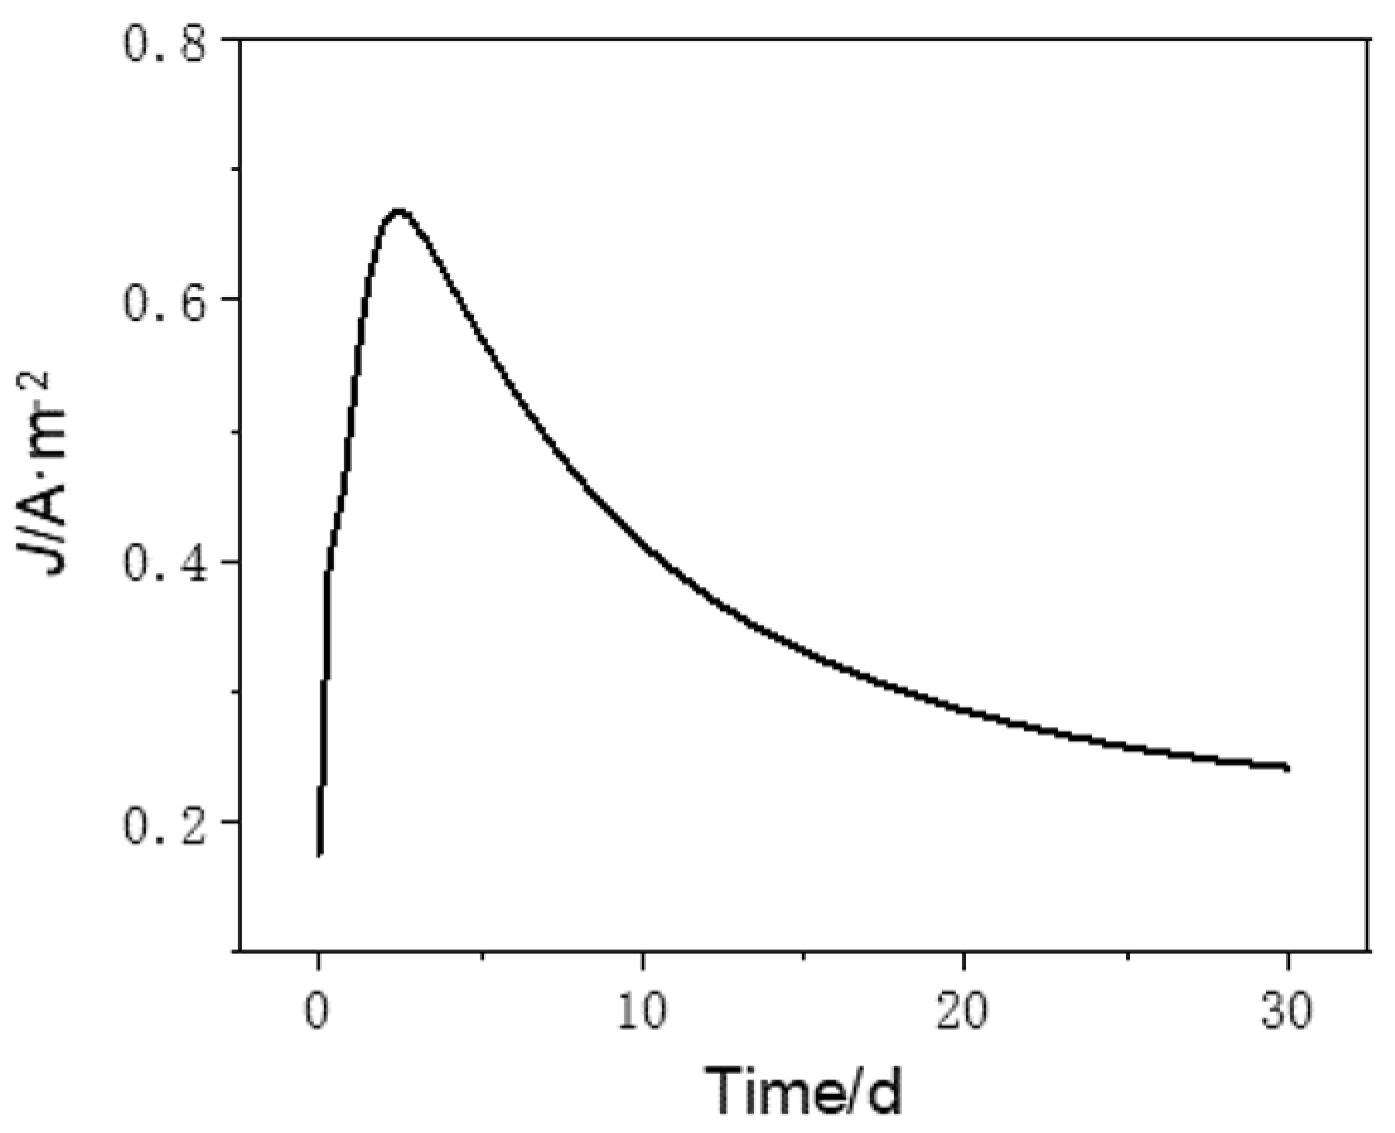
Figure 8 shows the variation in current density at the mouth of the pit with increasing time. At the beginning of corrosion, the corrosion current density increases rapidly. This is because the anodic active sites are highly concentrated in the pitting initiation stage and a micro-anodic region is formed at the small passivation film defect, while a large-area cathodic region is formed in the surrounding intact passivation film region. The anodic current is concentrated in the extremely small exposed region, resulting in a very high current density. In the initial stage of corrosion, the metal dissolution reaction is only controlled by active-state dissolution of the metal, and the overpotential is completely used to drive the charge transfer step without potential-driven mass transfer loss. At this time, the concentration of ions generated by anodic dissolution is extremely low, and there is no concentration gradient in the anodic region to hinder the reaction. With the continuous progress of the reaction, the concentration of metal ions in the pitting pit gradually increases and the limiting diffusion current density continuously decreases. Pit expansion may change from charge transfer control to diffusion control, resulting in a continuous reduction in the corrosion current density [44].
Figure 8.
The variation in pitting current density over time.
4.1.3. Ion Concentration
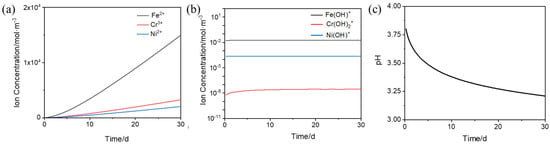
The metal ions during pitting corrosion originate from the continuous active dissolution of the anode stainless steel matrix. For the pitting corrosion of 316L SS in a saturated NaCl solution, the electrochemical reaction occurring at the anode generates Fe2+, Cr3+ and Ni2+ ions. With the progress of the reaction, the metal ions accumulate at the corrosion interface and diffuse out of the pit. Figure 9a shows the total ion flux entering the electrolyte solution without considering hydrolysis and complexation reactions. The stoichiometric ratios of the cations (Fe2+, Cr3+ and Ni2+) in 316L SS were calculated based on congruent dissolution [35].The simulation results show that Fe2+ have the highest concentration in the electrolyte solution, while Ni2+ have the lowest. The metal ions further undergo multi-step hydrolysis and complexation reactions in the electrolyte solution and finally precipitate in the form of Fe(OH)2, Cr(OH)3 and Ni(OH)2. Figure 9b shows the concentration changes in hydroxylated ions at the previous stage of precipitation of each ion over time. Due to the largest hydrolysis equilibrium constant of Cr3+, its hydrolysis degree is the highest. The concentration of Cr(OH)2+ in the electrolyte solution is much lower than that of Fe(OH)+ and Ni(OH)+, and almost all dissolved Cr3+ is consumed. The concentrations of the three hydroxylated ions reflect the priority of metal ion precipitation. If corrosion products are generated, chromium hydroxide is likely to precipitate first, which is consistent with the report that CrO(OH) is the first precipitate calculated based on the trend of pH change [45]. Due to the micro-scale size of the pitting model, the hydrolysis reaction in the pit reaches equilibrium quickly. Since Cr(OH)2+ is a secondary hydrolysis product, its concentration change has a lag, and the overall flux of Cr3+ ions is small, so its equilibrium rate is relatively slow. When each particle in the pit reaches equilibrium, the corrosion products precipitate stably.
Figure 9.
Ion concentration variation in the pitting model of 316L stainless steel: (a) total flux of metal ions; (b) concentrations of hydrolysis products; (c) pH in the pit.
The hydrolysis of metal cations generates H+, resulting in a decrease in pH inside the pitting pit. The autocatalytic effect constituted by local acidification and anodic oxidation reaction is a key factor governing the development of pitting corrosion [46]. Local acidification within the pit further accelerates anodic dissolution, facilitates the formation of stable pitting and drives the pitting corrosion to propagate in the depth direction. Figure 9c illustrates the variation in pH in the pit. As pitting corrosion progresses, the pH continuously decreases. HER occurs at the cathode, consuming H+ and gradually stabilizing the pH. In contrast, when the cathodic hydrogen evolution reaction is not considered, it has been reported that the pH calculated in a nearly saturated NaCl solution is negative [45].
4.2. Pitting Corrosion Evolution of 316L Stainless Steel in Saturated NaCl Solution with Addition of NaClO3 at 90 °C
4.2.1. Pitting Corrosion Evolution
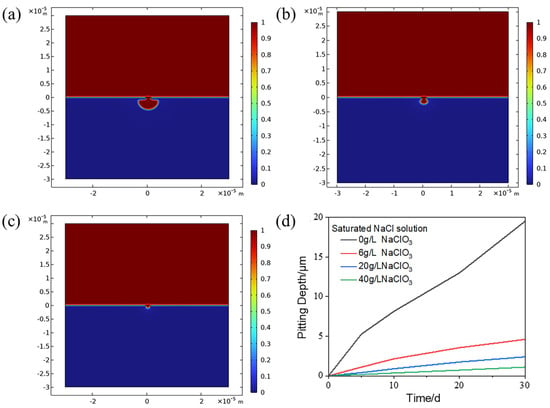
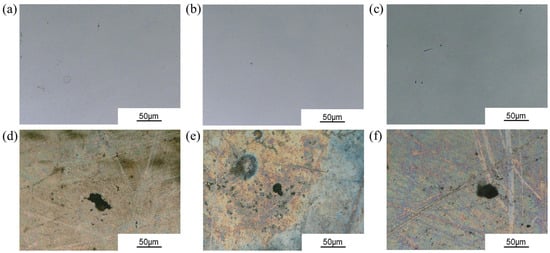
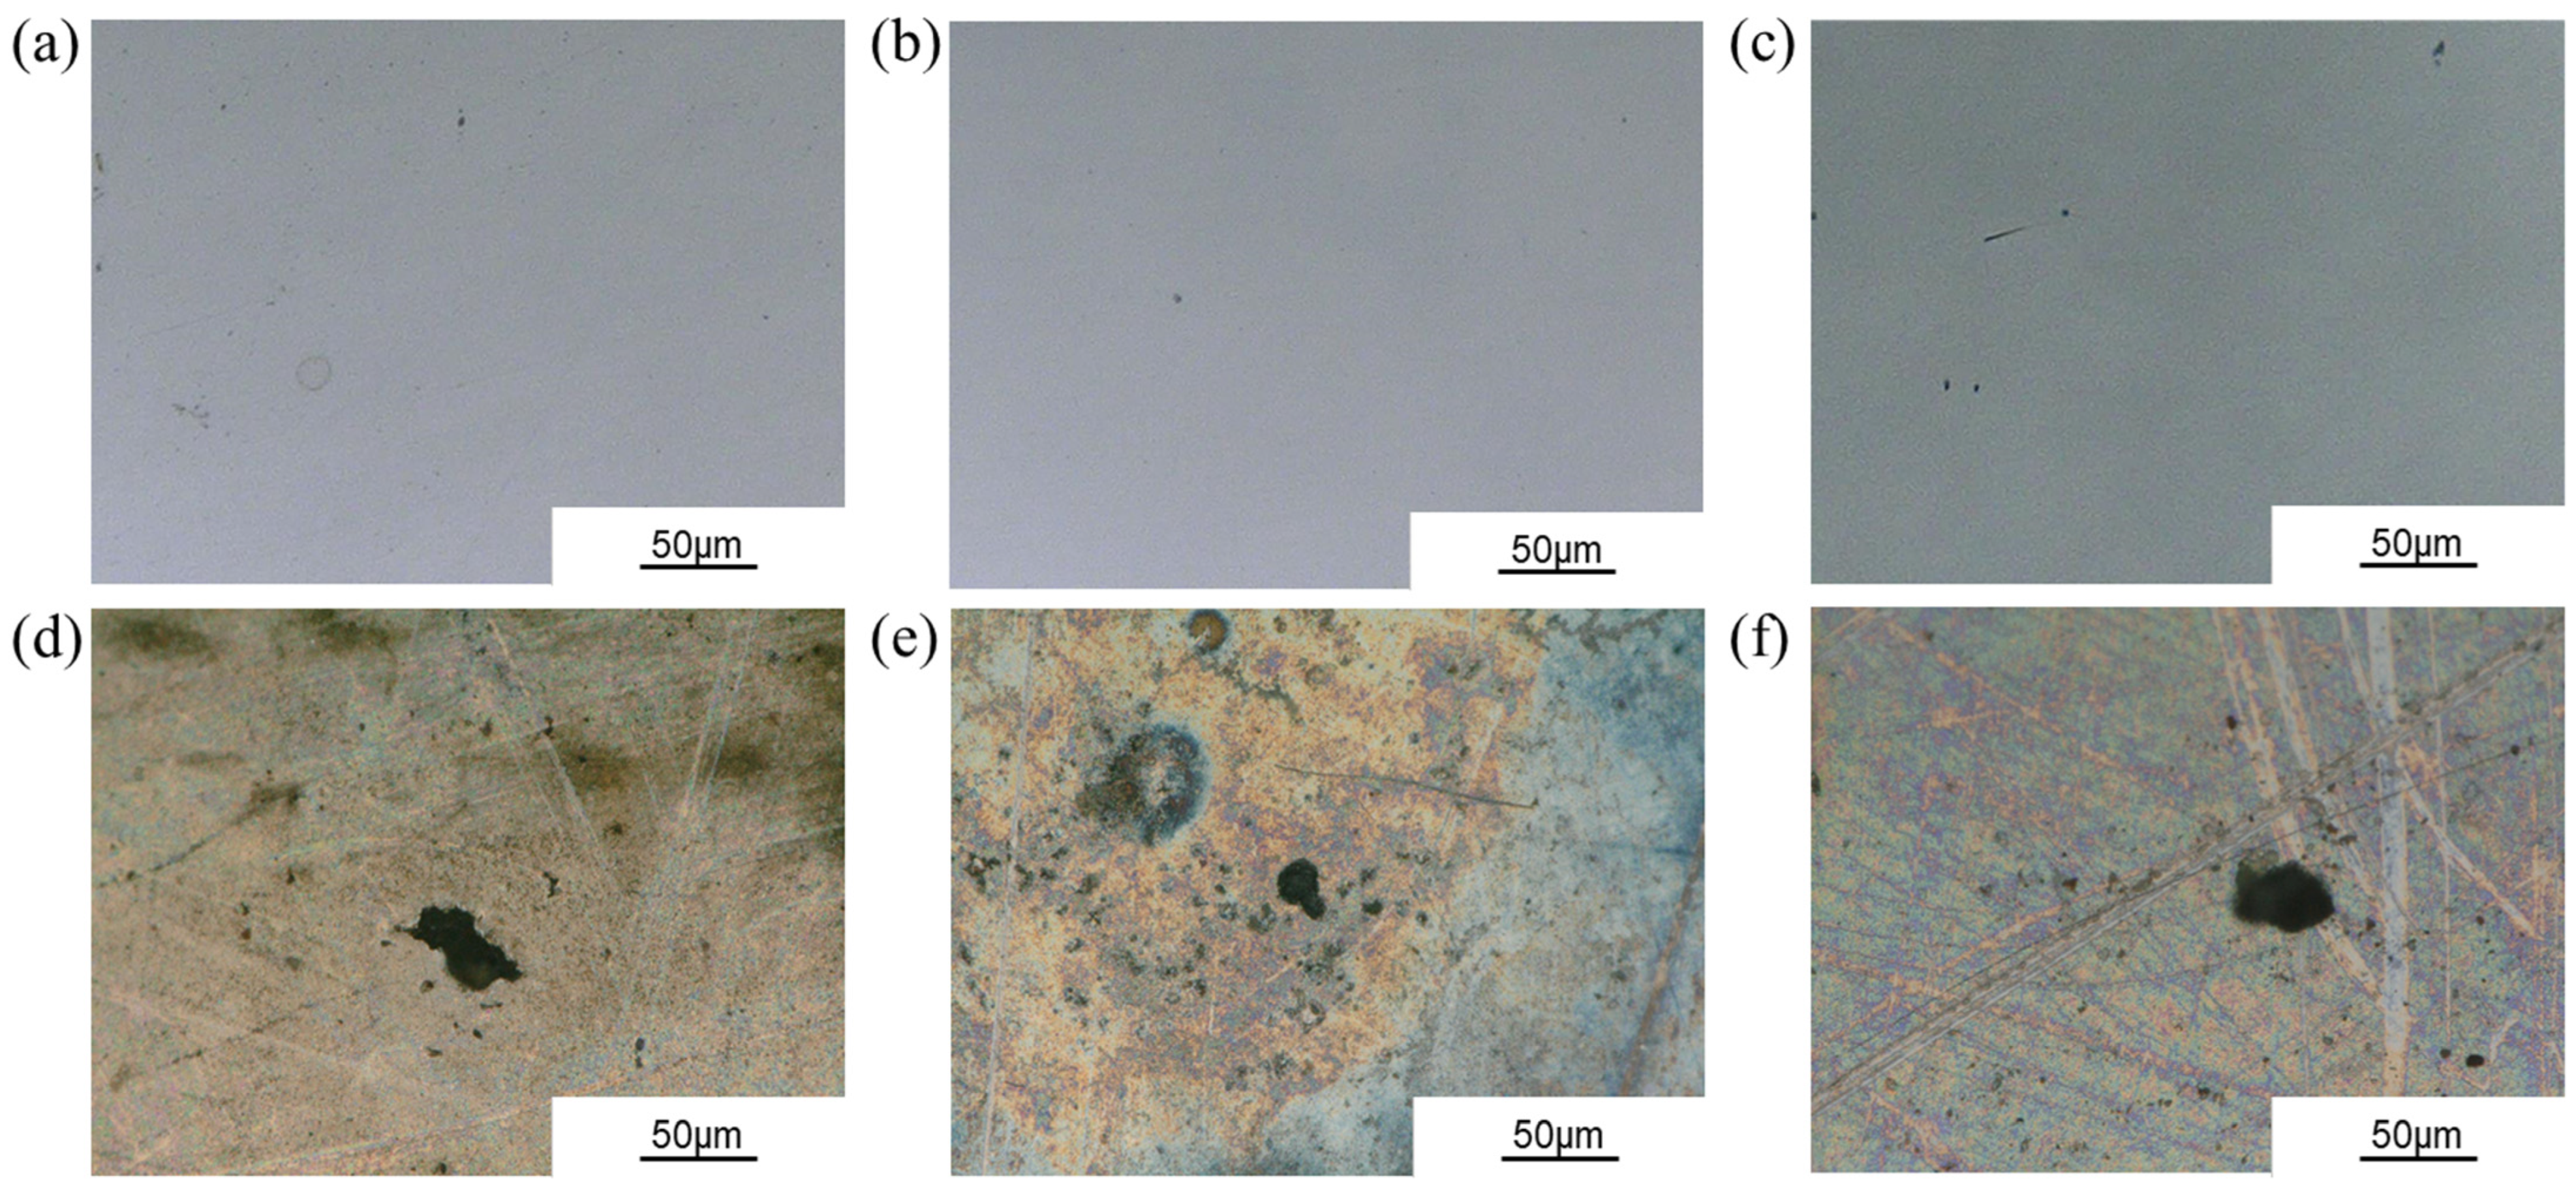
Figure 10a–c show the simulation results of pitting corrosion evolution for 30 days with the addition of 6 g/L, 20 g/L and 40 g/L NaClO3 to the saturated NaCl solution. Figure 10d shows the comparison of the pitting corrosion evolution of 316L SS under different conditions. With the addition of NaClO3, the pit depth after 30 days is significantly reduced. After adding 6 g/L, 20 g/L and 40 g/L NaClO3, the maximum pit depths are 4.6 µm, 2.4 µm and 1.1 µm, respectively, which are lower than those in the saturated NaCl solution. According to the PDM model proposed by Macdonald, aggressive halide anions such as Cl− will penetrate into the metal passivation film and occupy oxygen vacancies, causing the accumulation of cation vacancies on the passivation film surface and forming passivation film defects, thereby inducing pitting corrosion [16]. Studies have shown that PO43−, NO3−, SO42− and CrO42− all inhibit the pitting corrosion of 316L in Cl− environments. According to PDM, this may be related to the competitive adsorption of oxygen-containing ions and Cl− on the surface of the passivation film [47,48]. It was found that the chromium content in the film increases with increasing NaClO3 concentration, which also enhances the self-healing ability and corrosion resistance of the passive film. Moreover, the NaClO3 is not hydrolyzed in the NaCl solution. Thus, the adsorption competition between Cl− and ClO3− occur on the 316L SS passivation film, which reduces the Cl− penetration, increasing the corrosion resistance. As shown in Figure 11a–f, after the addition of NaClO3, the corrosion of 316L SS in immersion tests is very weak. The corrosion evolution of the samples after adding 6 g/L, 20 g/L and 40 g/L NaClO3 is similar; the depth of the pitting pits is about a few micrometers, which is too shallow to measure. Therefore, the addition of NaClO3 has an inhibitory effect on the pitting corrosion of 316L in saturated NaCl solution.
Figure 10.
Thirty-day pitting of 316L stainless steel after adding NaClO3: (a) 6 g/L NaClO3; (b) 20 g/L NaClO3; (c) 40 g/L NaClO3. (d) Comparison of pitting development in different conditions.
Figure 11.
Initial morphology and typical pitting morphology of immersion after adding NaClO3: (a–c) initial morphology; (d–f) after immersion test; (a,d) 6 g/L NaClO3; (d,e) 20 g/L NaClO3; (c,f) 40 g/L NaClO3.
4.2.2. Potential and Current Density
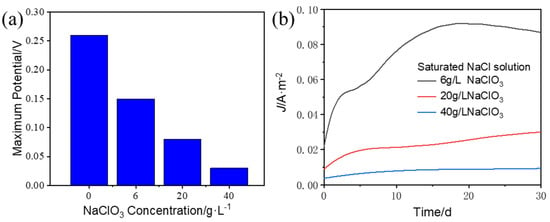
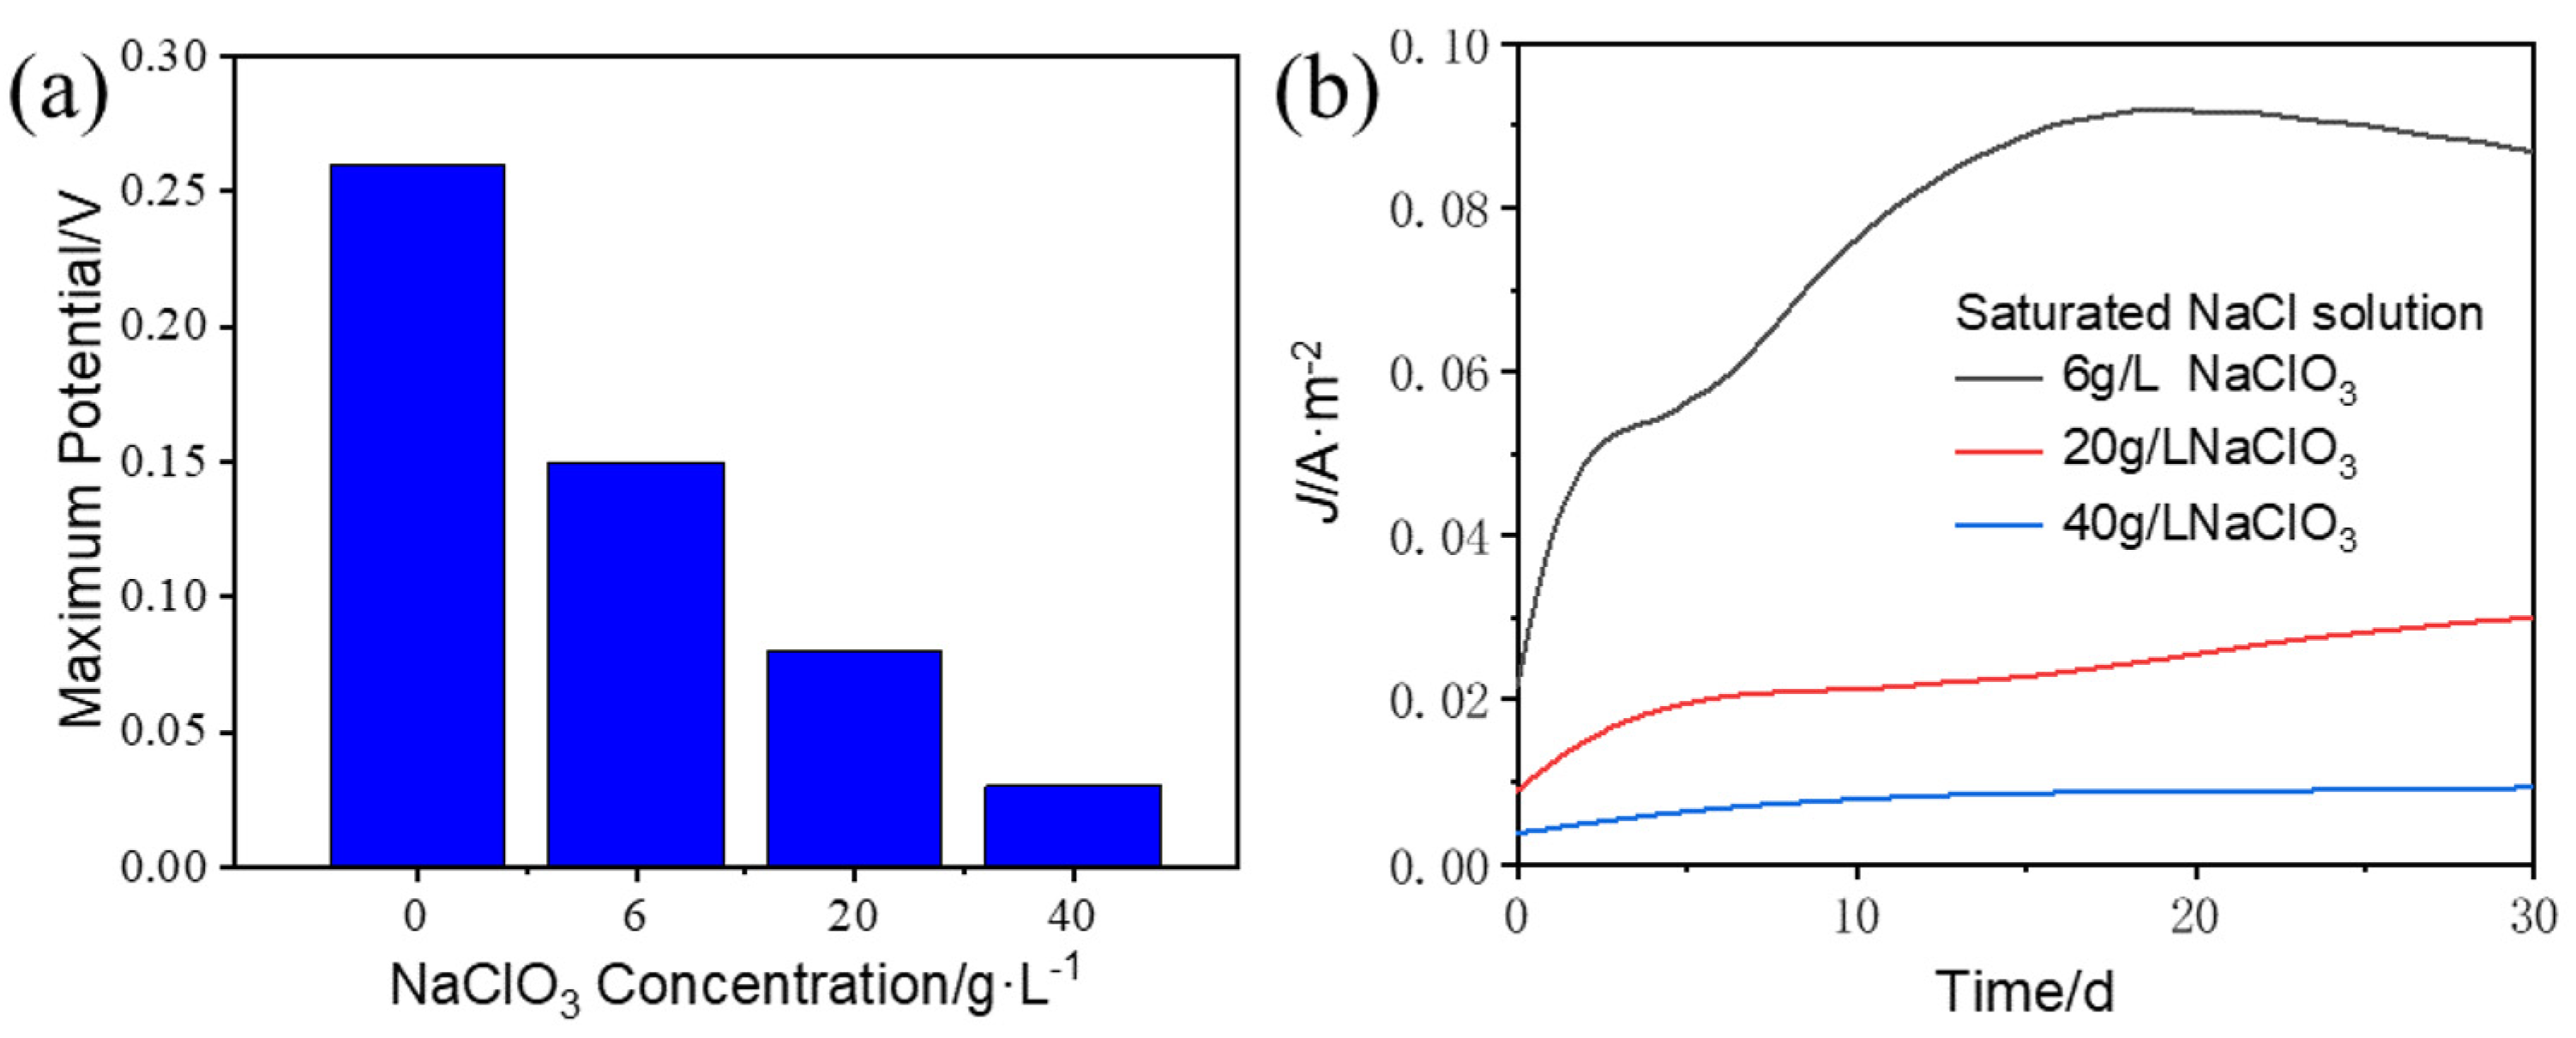
The changes in potential and corrosion current density reflect the inhibition of pitting corrosion by NaClO3. As shown in Figure 12a, after adding 6 g/L, 20 g/L and 40 g/L NaClO3, the maximum potential decreases by 41.5%, 68.6% and 90.6%, respectively. The addition of NaClO3 has a protective effect on the passivation film of 316L SS. As the concentration of NaClO3 increases, the probability of metastable pitting on the passivation film decreases, and the tendency of active dissolution of the anode metal decreases. The corrosion current density is also significantly inhibited after the addition of NaClO3, decreasing from the maximum of 0.67 A/m2 in the saturated NaCl solution to below 0.1 A/m2. After adding 6 g/L, 20 g/L and 40 g/L NaClO3, the maximum density decreases by 86.4%, 95.8% and 98.5%, respectively. The addition of ClO3− enhances the repair ability of the passivation film, and the overall dissolution rate of the metal matrix slows down. After adding 6 g/L NaClO3, the variation trend of the current density is overall similar to that in the saturated NaCl solution. This is because a stable pit is formed in part of the metal matrix, and the pit evolution is similar to that in the saturated NaCl solution. After adding 20 g/L NaClO3 and 40 g/L NaClO3, the degree of pitting corrosion is slighter than after adding 6 g/L NaClO3. The corrosion current density slightly increases due to the penetration of the film in the initial stage of corrosion but is generally at a low level.
Figure 12.
(a) Potential and (b) current density of point corrosion model of 316L stainless steel after adding NaClO3.
4.2.3. Ion Concentration
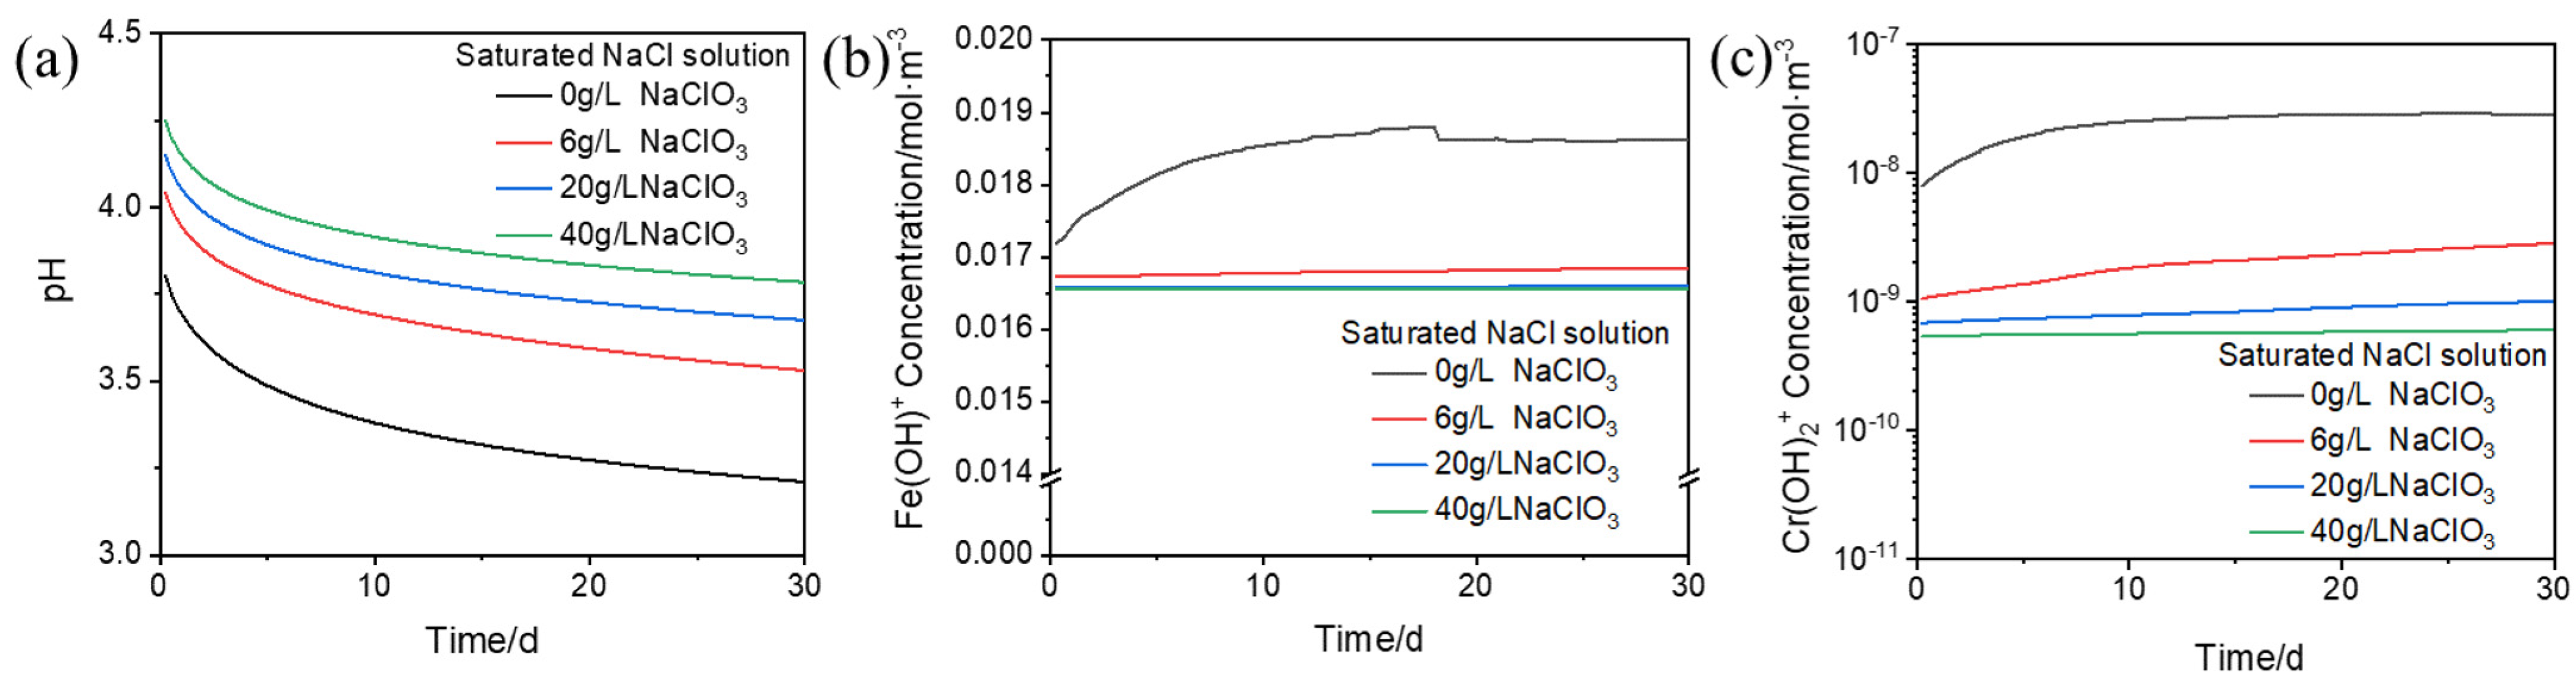
Without considering the reaction between ClO3− ions and metal ions, the degree of acidification inside the pitting pit is alleviated and the concentrations of all hydrolysis intermediates decrease after adding NaClO3 to the saturated NaCl solution. As shown in Figure 13a, due to the slow development of pitting corrosion following the addition of NaClO3, the decrease in pH inside the pit becomes gentle. As shown in Figure 13b,c, in the saturated NaCl solution, due to the fast growth rate of the pit size, the anodic active dissolution rate is faster than the ion hydrolysis rate in the initial stage of the pitting corrosion process, and the concentrations of Fe(OH)+ and Cr(OH)2+ gradually increase. With the development of pitting corrosion, the matrix dissolution and the homogeneous reaction in the solution gradually reach equilibrium, and the ion concentration tends to be stable. After adding NaClO3, the pit size is significantly reduced, the total flux of metal ions entering the electrolyte solution decreases and the concentrations of various metal ion products in the system decrease. The anodic dissolution rate is significantly slowed down, and the reaction in the system is more likely to reach equilibrium, so the concentrations of Fe(OH)+ and Cr(OH)2+ are basically stable. After adding 6 g/L, 20 g/L and 40 g/L NaClO3, the concentration of Cr(OH)2+ decreases by 91.2%, 96.3% and 97.6% at the equilibrium of the hydrolysis reaction, respectively, while the decrease in Fe(OH)+ concentration is relatively small. Since the solubility of Cr(OH)3 is lower than that of Fe(OH)2, when the anodic active dissolution rate is low, the precipitation of Cr(OH)3 is more sufficient, so the concentration of Cr(OH)2+ decreases more significantly compared to Fe(OH)+.
Figure 13.
Variation in ion concentration of 316L stainless steel pitting corrosion model after adding NaClO3: (a) pH in the pit; (b) Fe(OH)+; (c) Cr(OH)2+.
5. Conclusions
In the present work, the pitting corrosion behavior of 316L stainless steel in a chlor-alkali environment at 90 °C was investigated by COMSOL Multiphysics 6.2.290 simulation. The effects of by-product NaClO3 on pitting evolution were analyzed. The following conclusions can be drawn:
- (1)
- The simulated pitting depth of 316L SS in a NaCl environment at 90 °C for 30 days was 18.7 μm, and the average pitting depth of the immersion experiment was approximately 21.1 μm, indicating that the simulated results were in good agreement with the experimental results. The slight error may be due to simplifying the cathodic reaction.
- (2)
- The high potential at the defects of the passivation film induces the initiation of metastable pitting, and the active-state dissolution of the metal generates a high current density, promoting the stable development of metastable pitting. The combination of the hydrolysis of metal ions and the hydrogen evolution reaction (HER) causes local acidification in pits, and the hydroxide of chromium preferentially precipitates.
- (3)
- After adding NaClO3 to the saturated NaCl solution, the anodic potential, corrosion current density and ion concentration during the pitting corrosion process are reduced, and the pitting corrosion of 316L stainless steel is inhibited. The higher the concentration of NaClO3, the more obvious the inhibition effect, which may be related to the competitive adsorption of ClO3− and Cl− on the passive film surface. In the future, the electrode reaction and mass transport model of the multi-ions in the passive film will be considered to enhance the accuracy of simulation results.
Author Contributions
Conceptualization, S.Y. and Z.Z.; methodology, S.Y.; validation, S.Y. and Z.Z.; investigation, S.Y. and Z.Z.; resources, Z.Z. and X.C.; data curation, S.Y. and Z.Z.; writing—original draft preparation, S.Y.; writing—review and editing, Z.Z. and X.C.; supervision, Z.Z. and X.C.; project administration, X.C.; funding acquisition, Z.Z. and X.C. All authors have read and agreed to the published version of the manuscript.
Funding
This research was funded by the National Key Research and Development Program of China (2022YFC3004501) and the National Natural Science Foundation of China (52075368). The authors gratefully acknowledge financial support for this work from the Yongjiang Talent Project of Ningbo—innovation team program.
Data Availability Statement
The raw data supporting the conclusions of this article will be made available by the authors on request.
Conflicts of Interest
The authors declare no conflicts of interest.
References
- Yang, J.; Li, W.H.; Tang, H.T.; Pan, Y.-M.; Wang, D.; Li, Y. CO2-Mediated Organocatalytic Chlorine Evolution under Industrial Conditions. Nature 2023, 617, 519–523. [Google Scholar] [CrossRef] [Scilit] [PubMed]
- Jakab-Nácsa, A.; Stomp, D.; Farkas, L.; Kaptay, G. Large NaCl-Effect on the Decomposition Rate of Chlorate Ions in HCl-Containing Brine Solutions and Its Consequences for the Chlor-Alkali Industry. Period. Polytech. Chem. Eng. 2020, 65, 238–242. [Google Scholar] [CrossRef] [Scilit]
- Lima, P.R.; Mirapalheta, A.; Henrique Dos Santos Andrade, M.; Vilar, E.O.; E Silva Zanta, C.L.D.P.; Tonholo, J. Energy Loss in Electrochemical Diaphragm Process of Chlorine and Alkali Industry—A Collateral Effect of the Undesirable Generation of Chlorate. Energy 2010, 35, 2174–2178. [Google Scholar] [CrossRef] [Scilit]
- Zhou, H.; Zhou, H.; Tang, L.; Hong, X. Photoelectrocatalytic Treatment and Resource Utilization of Industrial Waste Salt for Chlor-Alkali Electrolysis. J. Appl. Electrochem. 2023, 53, 963–975. [Google Scholar] [CrossRef] [Scilit]
- Moussallem, I.; Jörissen, J.; Kunz, U.; Pinnow, S.; Turek, T. Chlor-Alkali Electrolysis with Oxygen Depolarized Cathodes: History, Present Status and Future Prospects. J. Appl. Electrochem. 2008, 38, 1177–1194. [Google Scholar] [CrossRef] [Scilit]
- Chen, L.; Li, H.; Qin, B.; Wang, L.; Zhang, P.; Sun, W.; Wang, H.; Yang, Z.; Liu, G. Failure Analysis of Stress Corrosion Cracking of 316L Stainless Steel Bend Pipe in the Atmospheric Tower. Eng. Fail. Anal. 2025, 174, 109519. [Google Scholar] [CrossRef] [Scilit]
- Sun, Q.; Xie, F.; Zhu, M.; Wang, L.; Dan, W.; Wu, M. Analysis of Stress Corrosion Cracking Failure of 316L Stainless Steel Flow Promoter String in the Aggressive Oilfield Environment. Eng. Fail. Anal. 2025, 167, 109087. [Google Scholar] [CrossRef] [Scilit]
- Xu, X.; Chen, T.; Wang, S.; Su, H. Failure Analysis of 316L Stainless Steel Dechlorination System Tube: A Case Study of Chloride-Induced Stress Corrosion Cracking. J. Fail. Anal. Preven. 2025, 25, 1445–1453. [Google Scholar] [CrossRef] [Scilit]
- Wang, J.; Zhang, Z.; Dai, H.; Fujiwara, H.; Chen, X.; Ameyama, K. Enhanced Corrosion Resistance of CoCrFeMnNi High Entropy Alloy using Heterogeneous Structure Design. Corros. Sci. 2022, 209, 110761. [Google Scholar] [CrossRef] [Scilit]
- Xue, F.; Yu, F.; Li, K. Role of Dissolved Oxygen on the Corrosion Behavior of 316L Stainless Steel. Mater. Des. 2025, 260, 115017. [Google Scholar] [CrossRef] [Scilit]
- Xue, F.; Yu, F.; Jia, F. Corrosion of Stainless Steel in Deaerated NaCl Solutions. Int. J. Chem. Eng. 2025, 2025, 7906572. [Google Scholar] [CrossRef] [Scilit]
- Ni, X.; Wang, L.; Jiang, Z.; Yang, S.; Dai, Q.; Zhao, B. Study on Corrosion Behavior of 316L Stainless Steel with Different Microstructure Circulated in Cooling Water with Different Chloride Ion Concentration. In Proceedings of the 12th International Conference on Advanced Materials and Engineering Materials; Springer: Singapore, 2024; pp. 217–233. [Google Scholar] [CrossRef] [Scilit]
- Stern, F.; Becker, L.; Tenkamp, J.; Boes, J.; Lentz, J.; Weber, S.; Walther, F. Influence of Nitrogen Content on the Corrosion Fatigue Behavior of Additively Manufactured AISI 316L Stainless Steel in Chloride Solution. Int. J. Fatigue 2023, 172, 107666. [Google Scholar] [CrossRef] [Scilit]
- Xu, C.; Zhang, Y.; Cheng, G.; Zhu, W. Pitting Corrosion Behavior of 316L Stainless Steel in the Media of Sulphate-Reducing and Iron-Oxidizing Bacteria. Mater. Charact. 2008, 59, 245–255. [Google Scholar] [CrossRef] [Scilit]
- Macdonald, D.D. The History of the Point Defect Model for the Passive State: A Brief Review of Film Growth Aspects. Electrochim. Acta 2011, 56, 1761–1772. [Google Scholar] [CrossRef] [Scilit]
- Macdonald, D.D.; Lei, X. Theoretica9l Interpretation of Anion Size Effects in Passivity Breakdown. J. Electrochem. Soc. 2016, 163, C738. [Google Scholar] [CrossRef] [Scilit]
- Miao, W.; Gao, Z.; Hu, W. Passivity and Pitting Corrosion of 316L in Simulated Concrete Pore Solutions under Marine Environment. Int. J. Electrochem. Sci. 2018, 13, 771–784. [Google Scholar] [CrossRef] [Scilit]
- Li, K.; Sun, L.; Chen, Z.; Chen, S.; Li, W. Failure Analysis of Anion Synergy on Pitting Behavior of Liner 316L in Sour Water System by Electrochemical Tests. Eng. Fai. Anal. 2022, 133, 105982. [Google Scholar] [CrossRef] [Scilit]
- Zhang, Z.; Zhao, Z.; Li, X.; Wang, L.; Liu, B.; Bai, P. Effect of Heat Treatments on Metastable Pitting of 316L Stainless Steel Fabricated by Selective Laser Melting. J. Mater. Res. Technol. 2022, 21, 1903–1914. [Google Scholar] [CrossRef] [Scilit]
- Meng, G.; Li, Y.; Shao, Y.; Zhang, T.; Wang, Y.; Wang, F. Effect of Cl− on the Properties of the Passive Films Formed on 316L Stainless Steel in Acidic Solution. J. Mater. Sci. Technol. 2014, 30, 253–258. [Google Scholar] [CrossRef] [Scilit]
- Jin, Z.; Ge, H.; Lin, W.; Zong, Y.; Liu, S.; Shi, J. Corrosion Behaviour of 316L Stainless Steel and Anti-Corrosion Materials in a High Acidified Chloride Solution. Appl. Surf. Sci. 2014, 322, 47–56. [Google Scholar] [CrossRef] [Scilit]
- Liu, G.; Shi, J.; Yang, Y.; Gong, Z.; Li, C. Effects of Passivation Behavior on Micro-Electrochemical Machining (ECM) Performance of Stainless Steels with Different Metallographic Phases in NaNO3 and NaClO3 Solutions. Int. J. Adv. Manuf. Technol. 2024, 130, 3867–3876. [Google Scholar] [CrossRef] [Scilit]
- Liu, G.; Tong, H.; Li, Y.; Tan, Q.; Zhu, Y. Passivation Behavior of S316H Steel in Neutral Electrolytes Composed of NaClO3 and NaNO3 and Its Influence on Micro Electrochemical Machining Performance. Mater. Today Commun. 2021, 29, 102762. [Google Scholar] [CrossRef] [Scilit]
- Deshpande, K.B. Numerical Modeling of Micro-Galvanic Corrosion. Electrochim. Acta 2011, 56, 1737–1745. [Google Scholar] [CrossRef] [Scilit]
- Sarkar, S.; Warner, J.E.; Aquino, W. A Numerical Framework for the Modeling of Corrosive Dissolution. Corros. Sci. 2012, 65, 502–511. [Google Scholar] [CrossRef] [Scilit]
- Duddu, R. Numerical Modeling of Corrosion Pit Propagation Using the Combined Extended Finite Element and Level Set Method. Comput. Mech. 2014, 54, 613–627. [Google Scholar] [CrossRef] [Scilit]
- Chadwick, A.F.; Stewart, J.A.; Enrique, R.A.; Du, S.; Thornton, K. Numerical Modeling of Localized Corrosion Using Phase-Field and Smoothed Boundary Methods. J. Electrochem. Soc. 2018, 165, C633. [Google Scholar] [CrossRef] [Scilit]
- Jafarzadeh, S.; Chen, Z.; Zhao, J.; Bobaru, F. Pitting, Lacy Covers, and Pit Merger in Stainless Steel: 3D Peridynamic Models. Corros. Sci. 2019, 150, 17–31. [Google Scholar] [CrossRef] [Scilit]
- Yin, L.; Jin, Y.; Leygraf, C.; Pan, J. A FEM Model for Investigation of Micro-Galvanic Corrosion of Al Alloys and Effects of Deposition of Corrosion Products. Electrochim. Acta 2016, 192, 310–318. [Google Scholar] [CrossRef] [Scilit]
- Wang, Y.; Cheng, G.; Li, Y. Observation of the Pitting Corrosion and Uniform Corrosion for X80 Steel in 3.5 wt.% NaCl Solutions Using in-Situ and 3-D Measuring Microscope. Corros. Sci. 2016, 111, 508–517. [Google Scholar] [CrossRef] [Scilit]
- Tian, W.; Du, N.; Li, S.; Chen, S.; Wu, Q. Metastable Pitting Corrosion of 304 Stainless Steel in 3.5% NaCl Solution. Corros. Sci. 2014, 85, 372–379. [Google Scholar] [CrossRef] [Scilit]
- González-García, Y.; Burstein, G.T.; González, S.; Souto, R.M. Imaging Metastable Pits on Austenitic Stainless Steel in Situ at the Open-Circuit Corrosion Potential. Electrochem. Commun. 2004, 6, 637–642. [Google Scholar] [CrossRef] [Scilit]
- Wang, Y.; Cheng, G.; Wu, W.; Qiao, Q.; Li, Y.; Li, X. Effect of pH and Chloride on the Micro-Mechanism of Pitting Corrosion for High Strength Pipeline Steel in Aerated NaCl Solutions. Appl. Surf. Sci. 2015, 349, 746–756. [Google Scholar] [CrossRef] [Scilit]
- Srinivasan, J.; McGrath, M.J.; Kelly, R.G. A High-Throughput Artificial Pit Technique to Measure Kinetic Parameters for Pitting Stability. J. Electrochem. Soc. 2015, 162, C725. [Google Scholar] [CrossRef] [Scilit]
- Sander, G.; Cruz, V.; Bhat, N.; Birbilis, N. On the In-Situ Characterisation of Metastable Pitting Using 316L Stainless Steel as a Case Study. Corros. Sci. 2020, 177, 109004. [Google Scholar] [CrossRef] [Scilit]
- Sun, W.; Wang, L.; Wu, T.; Liu, G. An Arbitrary Lagrangian–Eulerian Model for Modelling the Time-Dependent Evolution of Crevice Corrosion. Corros. Sci. 2014, 78, 233–243. [Google Scholar] [CrossRef] [Scilit]
- Yaya, K.; Khelfaoui, Y.; Malki, B.; Kerkar, M. Numerical Simulations Study of the Localized Corrosion Resistance of AISI 316L Stainless Steel and Pure Titanium in a Simulated Body Fluid Environment. Corros. Sci. 2011, 53, 3309–3314. [Google Scholar] [CrossRef] [Scilit]
- Heppner, K.L.; Evitts, R.W.; Postlethwaite, J. Prediction of the Crevice Corrosion Incubation Period of Passive Metals at Elevated Temperatures: Part II—Model Verification and Simulation. Can. J. Chem. Eng. 2002, 80, 857–864. [Google Scholar] [CrossRef] [Scilit]
- Klyukin, Y.I.; Lowell, R.P.; Bodnar, R.J. A Revised Empirical Model to Calculate the Dynamic Viscosity of H2O NaCl Fluids at Elevated Temperatures and Pressures (≤1000 °C, ≤500 MPa, 0–100 wt % NaCl). Fluid Phase Equilib. 2017, 433, 193–205. [Google Scholar] [CrossRef] [Scilit]
- Wang, Z.; Di-Franco, F.; Seyeux, A.; Zanna, S.; Maurice, V.; Marcus, P. Passivation-Induced Physicochemical Alterations of the Native Surface Oxide Film on 316L Austenitic Stainless Steel. J. Electrochem. Soc. 2019, 166, C3376–C3388. [Google Scholar] [CrossRef] [Scilit]
- Maurice, V.; Peng, H.; Klein, L.H.; Seyeux, A.; Zanna, S.; Marcus, P. Effects of Molybdenum on the Composition and Nanoscale Morphology of Passivated Austenitic Stainless Steel Surfaces. Faraday Discuss. 2015, 180, 151–170. [Google Scholar] [CrossRef] [Scilit]
- Choudhary, S.; Kelly, R.G.; Birbilis, N. On the Origin of Passive Film Breakdown and Metastable Pitting for Stainless Steel 316L. Corros. Sci. 2024, 230, 111911. [Google Scholar] [CrossRef] [Scilit]
- Wu, K.; Jung, W.-S.; Byeon, J.-W. In-Situ Monitoring of Pitting Corrosion on Vertically Positioned 304 Stainless Steel by Analyzing Acoustic-Emission Energy Parameter. Corros. Sci. 2016, 105, 8–16. [Google Scholar] [CrossRef] [Scilit]
- Duan, Z.; Man, C.; Dong, C.; Cui, Z.; Kong, D.; Wang, L.; Wang, X. Pitting Behavior of SLM 316L Stainless Steel Exposed to Chloride Environments with Different Aggressiveness: Pitting Mechanism Induced by Gas Pores. Corros. Sci. 2020, 167, 108520. [Google Scholar] [CrossRef] [Scilit]
- Srinivasan, J.; Kelly, R.G. Evaluating the Critical Chemistry for Repassivation at the Corroding Surface Using Mass Transport Model-Based Artificial Pit Experiments. J. Electrochem. Soc. 2016, 163, C768–C777. [Google Scholar] [CrossRef] [Scilit]
- Taryba, M.; Cruz, A.; Machackova, N.; Montemor, F.; Prosek, T.; Thierry, D. The Effect of Acidification on Hydrogen Uptake and Corrosion Resistance of Advanced High-Strength Steels. J. Mater. Res. Technol. 2024, 33, 4149–4161. [Google Scholar] [CrossRef] [Scilit]
- Chandra-ambhorn, S.; Wachirasiri, W.; Lothongkum, G. E-pH Diagrams for 316L Stainless Steel in Chloride Solutions Containing SO42− Ions. Anti-Corros. Methods Mater. 2016, 63, 431–436. [Google Scholar] [CrossRef] [Scilit]
- Zhang, X.; Liu, X.; Wu, Y.; Li, X.; Duan, X.; Ren, Y. Inhibition of Corrosion Mechanism of Cl− in 304 Stainless Steel by Different SO42− Concentration at 30 °C. Mater. Chem. Phys. 2025, 343, 130979. [Google Scholar] [CrossRef] [Scilit]

Disclaimer/Publisher’s Note: The statements, opinions and data contained in all publications are solely those of the individual author(s) and contributor(s) and not of MDPI and/or the editor(s). MDPI and/or the editor(s) disclaim responsibility for any injury to people or property resulting from any ideas, methods, instructions or products referred to in the content. |
© 2026 by the authors. Licensee MDPI, Basel, Switzerland. This article is an open access article distributed under the terms and conditions of the Creative Commons Attribution (CC BY) license.