Abstract
Due to its high heat transfer property, microchannel heat sink has been widely applied in thermal management, microelectronic cooling and energy conversion. To develop a microchannel heat sink featuring low pressure drop ΔP and a high heat transfer property, a V-shaped wavy microchannel (VWM) is designed and CFD simulation is carried out. Subsequently, the influences of wave amplitude A, wave length λ and inlet velocity u on the Nusselt number Nuave, the Dean Vortexes and ΔP are studied. Furthermore, based on the performance evaluation criteria (PEC), the optimal parameters of A, λ and u are chosen. Next, the influence of microchannel number N is studied at the same pump power. Eventually, the optimal VWM heat sink is compared with the V-shaped straight microchannel (VSM) heat sink and the rectangular-shaped straight microchannel (RSM) heat sink. The results show that many Dean Vortexes periodically emerge in the V-shaped wavy microchannel, particularly at the wave peak and valley. These Dean Vortexes are capable of thinning the thermal boundary layer, which significantly strengthens heat transfer. As A and u increase while λ decreases, the area, number and severity of the Dean Vortexes increase, and thus both Nuave and ΔP also increase. In the present study, the PEC first increases and then decreases, reaching its maximum value when A = 0.3 mm, λ = 5 m and u = 1.0 m/s. At the same pump power, both the heat transfer area and the total Dean Vortex number increase with the increase in N, leading to a decrease in the thermal resistance R and the maximum temperature Tmax. Compared to the VSM and RSM heat sinks, the optimal VWM heat sink decreases Tmax by 29.93 K and 38.03 K, decreases R by 50.46% and 56.68%, increases have by 156.42% and 155.43% and increases PEC by 137% and 130.78%, respectively.
1. Introduction
With the rising integration of microelectronic devices, the heat flux per unit area is rising. As a result, thermal runaway has become the main reason of failure in microelectronic devices [1]. As they possess the advantages of high heat transfer property, compact structure and high surface area to volume, microchannel heat sinks have become the best cooling method for microelectronic devices [2,3,4]. To further strengthen the heat transfer property, scholars have proposed a V-shaped microchannel heat sink, which can strengthen the fluid perturbation and thin the thermal boundary layer [5].
Khan et al. [6] designed a localized V-shaped straight microchannel (VSM) and compared its Nusselt number Nuave with that of a rectangular-shaped straight microchannel (RSM). The results showed that the VSM has a larger Nuave than the RSM when Reynolds number Re is large, because the V-shaped section strengthens the fluid perturbation. Lei et al. [7,8] designed two types of VSM and compared their heat transfer coefficients with those of the RSM. The results showed that the VSM with curved surfaces has larger heat transfer coefficient than the RSM, and the heat transfer coefficient gradually increases as the curvature increases. Qi et al. [9] experimentally studied a new VSM. The results showed that the thermal resistance R could be decreased by 14–24% and the lowest temperature reached 11.49 °C at Re = 141~650. Chen et al. [10] compared the thermal efficiency of a VSM, trapezoidal straight microchannel (TSM) and RSM. The results showed that at the same heat flow density, the VSM has the lowest temperature and the best thermal efficiency. This is because for the same flow rate, the VSM demands the least amount of pump power. Wang et al. [11] studied the influence of the microchannel number N on the thermal resistance R and the pressure drop ΔP of VSM. The results showed that as N increases, R decreases while ΔP increases. This indicates that for the same pump power, there exists an optimal value of N. Monavari et al. [12] studied the heat transfer coefficients of microchannels with different sections. The results showed that the VSM has a higher heat transfer coefficient than elliptical, hexagonal and circular microchannels. Moreover, as Re increases, the VSM exhibits a more uniform temperature distribution. Filimonov et al. [13] designed a V-shaped microchannel and then studied its internal fluid flow state and heat transfer property. The results showed that the V-shaped section could perturb the fluid flow state, thereby enhancing the heat transfer property.
However, all the above V-shaped microchannels are of a straight path, which cannot significantly strengthen the heat transfer property. In contrast, V-shaped microchannels with a wavy path have rarely been studied. Moreover, Dean Vortexes have also rarely been observed. Hence, to further strengthen the heat transfer property, a novel microchannel with a V-shaped section and a wavy path, namely, the V-shaped wavy microchannel, is proposed. Next, the influences of wave amplitude A, wave length λ and inlet velocity u on the heat transfer property, the Dean Vortexes and the pressure drop ΔP are studied. Subsequently, the influence of microchannel number N is studied at the same pump power. Eventually, the optimal VWM heat sink is compared with the V-shaped straight microchannel (VSM) heat sink and the rectangular-shaped straight microchannel (RSM) heat sink.
2. V-Shaped Wavy Microchannel Heat Sink
The VWM heat sink consists of several microchannels with the same structure, as depicted in Figure 1a. Therefore, only a structure unit containing a VWM and two half-fins is employed as the calculation domain, as depicted in Figure 1b.
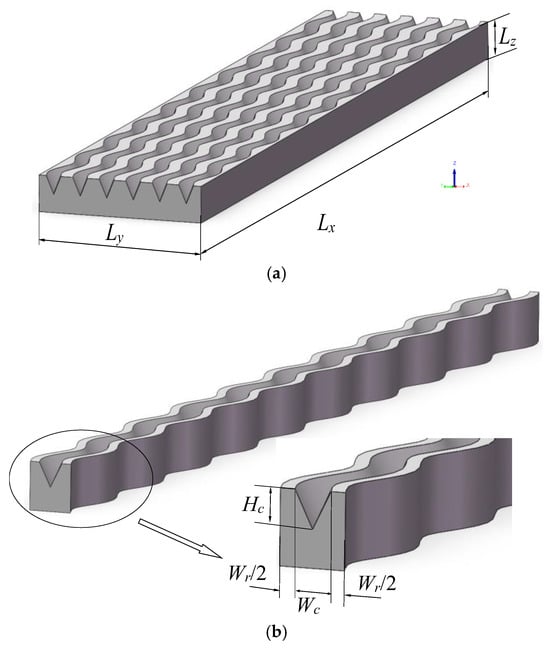
Figure 1.
(a) VWM heat sink and (b) its structure unit.
For the VWM heat sink, Lx, Ly and Lz are the length, width and height, respectively. For the microchannel, Wr, Wc, Hc and N are the microchannel interval, width, depth and number, respectively. These parameters are selected according to the literature [2], as depicted in Table 1.

Table 1.
Geometric dimension.
Figure 2 shows the path diagram of the VWM, and Formula (1) shows the path function.
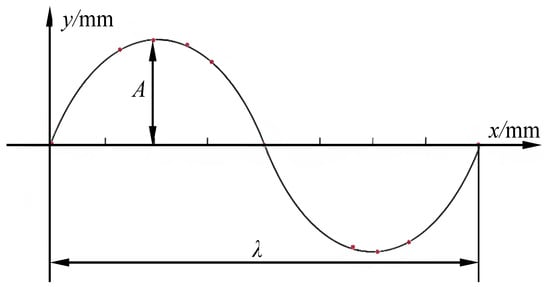
Figure 2.
Path diagram of the VWM.
The path function is
where A and λ represent the wave amplitude and wave length, respectively. x represents the length in the flow direction, and y represents the length in the wave direction. In the present study, A is set at 0 mm (straight path), 0.1 mm, 0.2 mm, 0.3 mm and 0.4 mm, and λ is set to 5 mm, 10 mm, 15 mm, 20 mm and λ→∞ (straight path).
3. Simulation Methods
3.1. Controlling Equations and Boundary Conditions
ANSYS Fluent 19.0 is utilized for simulating the flow and heat transfer of the VWM. The parameters of the cooling liquid and solid substrate are shown in Table 2 [14,15].
Table 2.
Parameters of cooling liquid and solid substrate.
The boundary conditions are as follows: At the inlet, a velocity boundary condition is applied. At the outlet, a pressure boundary condition is applied. At the bottom wall of the solid substrate, a constant heat flux boundary condition is applied. For the remaining walls, an adiabatic boundary condition is applied.
3.2. Mesh Division and Model Validation
As shown in Figure 3, the hexahedral mesh is divided using the Workbench Mesh Module. According to the literature [16], accurately resolving the boundary layer is essential. Therefore, y+ ≈ 1 is taken in the wall region. To verify the mesh independence, three different types of microchannels (A0.1 mm–λ5 mm, A0.3 mm–λ5 mm and A0.3 mm–λ10 mm) are established, and for each type, four different mesh sizes (ultrafine, fine, medium and coarse) are determined by using Richardson’s extrapolation method. Then, Nuave and fave are compared, as depicted in Table 3. The results show that the differences between Nuave and fave with fine grids and those with ultrafine grids are less than 0.5% and 0.25%, respectively, for any type of microchannel. Comprehensively considering both the prediction accuracy and the calculation speed, the fine mesh is employed in the present study.
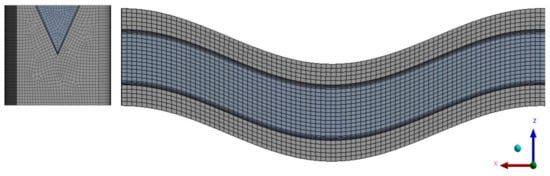
Figure 3.
Local diagram of the meshes.
Table 3.
Nuave, fave and their relative error of three types of microchannels with four different mesh sizes at u = 1.4 m/s.
To ensure the accuracy of this simulation model, the simulation results in the present study are compared with the theoretical result in the literature [17] and the simulation result in the literature [18], as depicted in Figure 4. In both, the simulated Nusselt number Nux decreases as the flow distance L increases. Moreover, the two simulation curves are in good agreement with each other. Furthermore, Nux in the present study reaches a constant value of 3.25, while Nux in the two literature references reaches 3.2 and 3.21, respectively. Both the differences are very small, which verifies the accuracy of the CFD model in the present study.
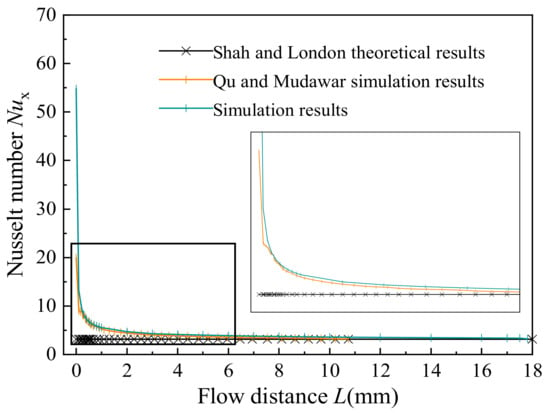
Figure 4.
Verification of this simulation model [17,18].
3.3. Evaluation Variables
(1) The average convective heat transfer coefficient is
where qw is the heat flux density of the heat source surface (namely, the bottom wall of the solid substrate), (W·cm−2), Aheat is the area of the microchannel heat source surface, (m2), Acon is the area of the fluid–solid coupling wall surface, (m2), Tw is the average temperature of the fluid-solid coupling wall, (K), and Tm is the average temperature of the cooling liquid, (K).
(2) The average Nusselt number is
where Dh is the hydraulic diameter.
(3) The thermal resistance is
where Tmax and Tmin are the maximum and minimum temperatures, respectively, (K).
(4) The pressure drop is
where g and hf are the gravitational acceleration and the frictional resistance along the flow path, respectively.
(5) The average friction factor, fave, is
where L is the total microchannel length.
(6) The pump power is
where Ac is the microchannel sectional area (m2).
(7) To achieve the maximum Nuave with the smallest possible ΔP, a performance evaluation criterion (PEC) is employed [19]:
In this equation, the subscripts of w and 0 represent the results for the wavy microchannel and the straight microchannel.
4. Results and Discussion
4.1. Influence of Several Variables
4.1.1. Influence of Wave Amplitude A
The influences of A on the maximum temperature Tmax, average Nusselt number Nuave, thermal resistance R, pressure drop ΔP and pump power Q are studied when λ = 5 mm and u = 1.4 m/s, as depicted in Figure 5 and Figure 6. As many the Dean Vortexes emerge, the wavy microchannel shows a smaller high temperature area and a more uniform temperature than the straight microchannel. When A increases from 0 mm to 0.6 mm, as the water flow turns more sharply, the area, number and severity of the Dean Vortexes increase, which not only promotes fluid mixing but also thins the thermal boundary layer. Consequently, Tmax and the high temperature area gradually decrease. Moreover, Nuave increases while R and Tmax decrease with the increase in A. When A increases from 0 mm to 0.6 mm, Nuave increases from 7.57 to 24.75, R decreases from 2.04 to 0.80 and Tmax decreases from 341.93 K to 314.80 K, respectively. However, the change rates of Nuave, R and Tmax slow down because the thermal boundary layer is impossible to be thinned infinitely. As the number, area and severity of the Dean Vortexes increase and the flow path length increases with the increase in A, the flow resistance also increases, which leads to an increase in ΔP and Q and a decrease in fluid velocity. When A increases from 0 mm to 0.6 mm, ΔP increases from 7522.50 Pa to 29,102.43 Pa and Q increases from 0.0053 W to 0.0201 W, respectively.
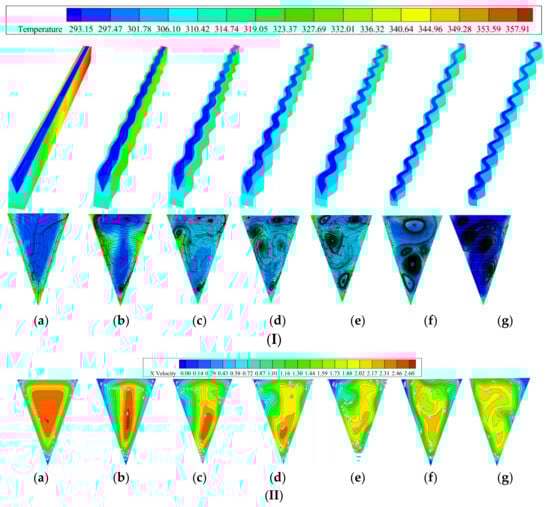
Figure 5.
Contour plots for (I) temperature, streamline and (II) fluid velocity at different A: (a) VSM, (b) VWM-0.1-5, (c) VWM-0.2-5, (d) VWM-0.3-5, (e) VWM-0.4-5, (f) VWM-0.5-5 and (g) VWM-0.6-5.
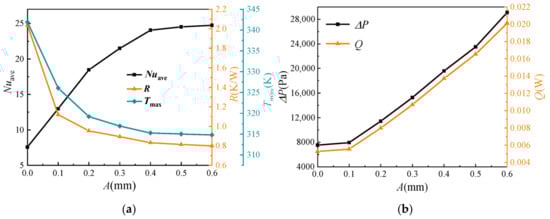
Figure 6.
(a) Nuave, R, Tmax, (b) ΔP and Q at different values of A.
As A increases, both Nuave and ΔP increase. When A < 0.3 mm, the PEC increases with the increase in A, showing that Nuave has a larger increase rate than ΔP, as depicted in Figure 7. When A > 0.3 mm, the PEC decreases with the increase in A, showing that ΔP has a larger increase rate than Nuave. Eventually, PEC achieves its maximum value when A = 0.3 mm.
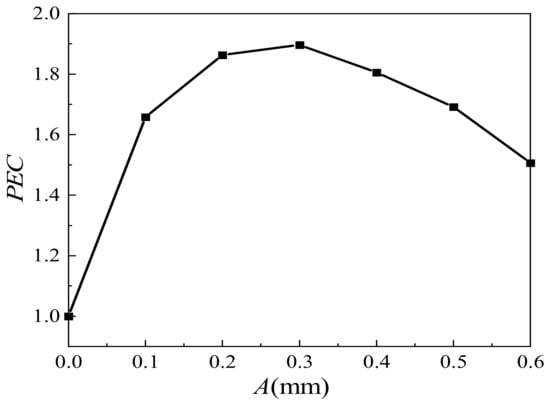
Figure 7.
PEC at different values of A.
4.1.2. Influence of Wave Length λ
The influence of λ on Tmax, Nuave, R, ΔP and Q is studied when A = 0.3 mm and u = 1.4 m/s, as depicted in Figure 8 and Figure 9. When λ increases from 3 mm to ∞, as the water flow turns more slowly, the area, number and severity of the Dean Vortexes decrease, which not only weakens fluid mixing but also thickens the thermal boundary layer. Consequently, Tmax and the high temperature area gradually increase. Moreover, Nuave decreases while R and Tmax increase with the increase in λ. When λ increases from 3 mm to 20 mm, Nuave decreases from 24.37 to 7.99, R increases from 0.81 to 1.91, and Tmax increases from 315.07 K to 340.54 K, respectively. However, as λ increases from 15 mm to 20 mm, the change rates of Nuave, R and Tmax slow down because the thermal boundary layer is impossible to be thickened infinitely. As the number, area and severity of the Dean Vortexes decrease and the flow path length decreases with the increase in λ, the flow resistance also decreases, which leads to a decrease in ΔP and Q and an increase in fluid velocity. When λ increases from 3 mm to 20 mm, ΔP decreases from 27,304.92 Pa to 7944.70 Pa and Q decreases from 0.0187 W to 0.0056 W, respectively.
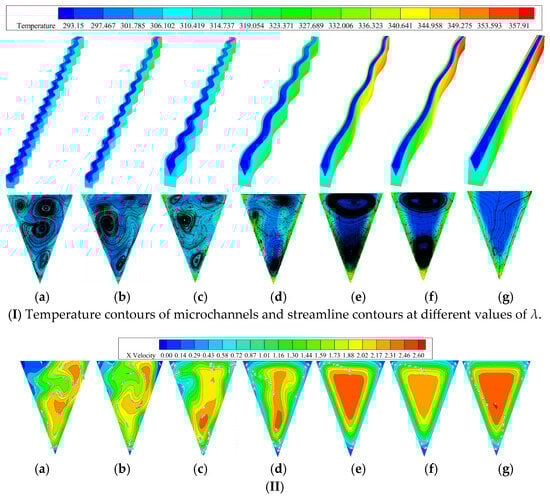
Figure 8.
Contour plots for (I) temperature, streamline and (II) fluid velocity at different values of λ: (a) VWM-0.3-3, (b) VWM-0.3-4, (c) VWM-0.3-5, (d) VWM-0.3-10, (e) VWM-0.3-15, (f) VWM-0.3-20 and (g) VSM.
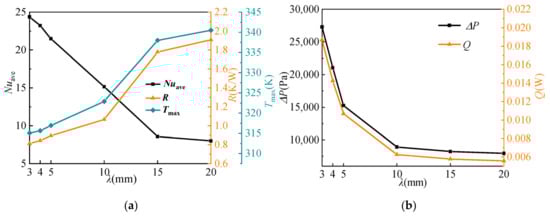
Figure 9.
(a,b) Nuave, R, Tmax, ΔP and Q at different values of λ.
As λ increases, both Nuave and ΔP decrease. When λ < 5 mm, the PEC increases with the increase in λ, showing that Nuave has a larger increase rate than ΔP, as depicted in Figure 10. When λ > 5 mm, the PEC decreases with the increase in λ, showing that ΔP has a larger increase rate than Nuave. Eventually, PEC achieves its maximum value when λ = 5 mm.
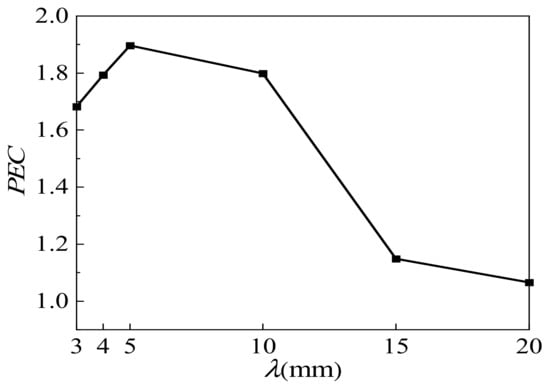
Figure 10.
PEC at different values of λ.
4.1.3. Influence of Inlet Velocity u
The influence of u on Nuave and ΔP is studied when A = 0.3 mm, λ = 5 mm, as depicted in Figure 11 and Figure 12. When u increases from 0.2 m/s to 2.2 m/s (Laminar flow is considered as Reynolds number is no larger than 2196), the area, number and severity of the Dean Vortexes increase, which not only promotes fluid mixing but also thins the thermal boundary layer. Consequently, both Tmax and the high temperature area gradually decrease. Moreover, Nuave increases with the increase in u. However, the change rates of Nuave are slowing down because the thermal boundary layer is impossible to be thinned infinitely. In contrast, the area, number and severity of the Dean Vortexes continuously increase with the increase in u, leading to a rapidly increase in ΔP.
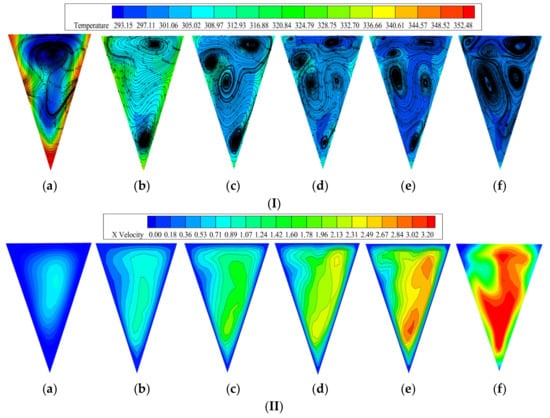
Figure 11.
(I) Streamline contours and (II) fluid velocity contours at wave peak at different values of u (A = 0.3 mm, λ = 5 mm): (a) u = 0.2 m/s, (b) u = 0.6 m/s, (c) u = 1.0 m/s, (d) u = 1.4 m/s, (e) u = 1.8 m/s and (f) u = 2.2 m/s.
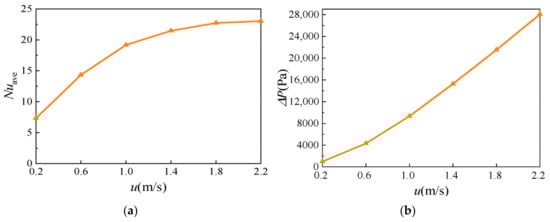
Figure 12.
(a) Nuave and (b) ΔP at different u.
As u increases, both Nuave and ΔP increase. When u < 1.0 m/s, the PEC increases with the increase in u, showing that Nuave has a larger increase rate than ΔP, as depicted in Figure 13. When u > 1.0 m/s, the PEC decreases with the increase in u, showing that ΔP has a larger increase rate than Nuave. Eventually, PEC achieves its maximum value when u = 1.0 m/s.
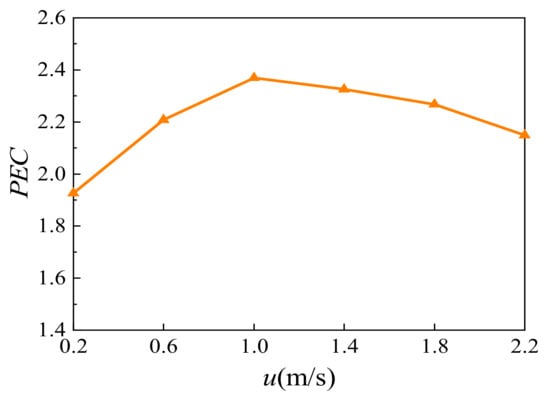
Figure 13.
PEC at different values of u.
4.1.4. Influence of Microchannel Number N
For a VWM heat sink, the microchannel number N also affects the heat transfer property. Therefore, the influence of N on R and Tmax is studied when A = 0.3 mm, λ = 5 mm and Q = 0.163 W, as depicted in Figure 14 and Figure 15. When N increases from 4 to 8, both the heat transfer area and the total number of Dean Vortexes increases. Therefore, both Tmax and the high temperature area gradually decrease with the increase in N. Moreover, both Tmax and R decrease with the increase in N, and they reach their minimum values at N = 8 in the present study.
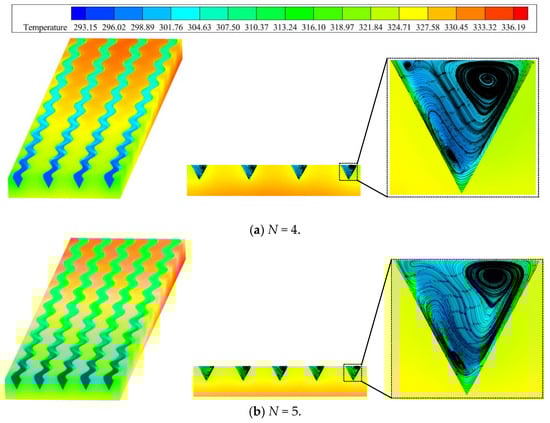
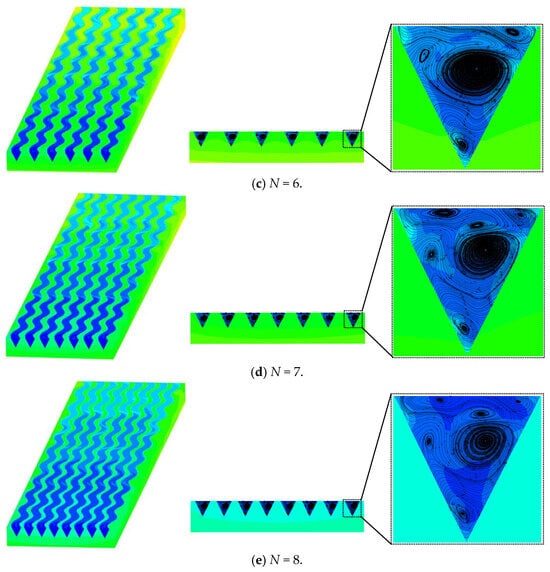
Figure 14.
Temperature contours of VWM heat sink at different values of N and y-z section temperature at the wave peak (x = 21.25 mm): (a) N = 4, (b) N = 5, (c) N = 6, (d) N = 7 and (e) N = 8.
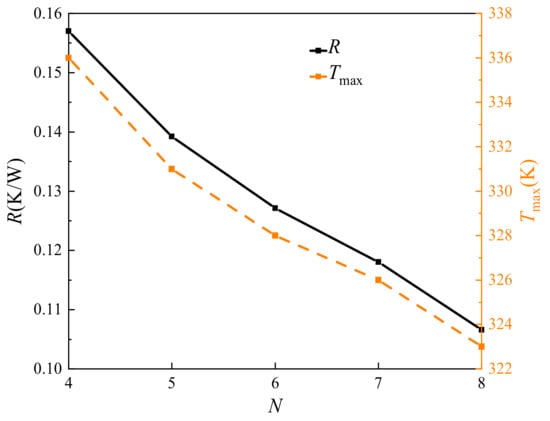
Figure 15.
R and Tmax at different values of N.
4.2. Comparison of Three Kinds of Microchannels
Based on the above optimal VWM heat sink, the conditions (A = 0.3 mm, λ = 5 mm, u = 1.0 m/s and N = 8) are chosen and then compared with a V-shaped straight microchannel (VSM) heat sink and a rectangular-shaped straight microchannel (RSM) heat sink at Hc = 1 mm, N = 8 and Q = 0.163 W.
4.2.1. Comparison of Development of Dean Vortexes
The fluid streamline contours in a period of wave are observed, as depicted in Figure 16. In the RSM, the fluid streamline is almost exactly the same and no Dean Vortexes emerge. In the VSM, the fluid streamline changes slightly and only a few Dean Vortexes emerge at the microchannel bottom. In the VWM, the Dean Vortexes change periodically. When the microchannel curvature achieves its maximum value (at the wave peak and wave valley), the area, number and severity of the Dean Vortexes also reach their maximum values. As the microchannel curvature decreases, the Dean Vortexes gradually disappear. As a result, the VWM has a much thinner thermal boundary layer than the VSM and RSM.
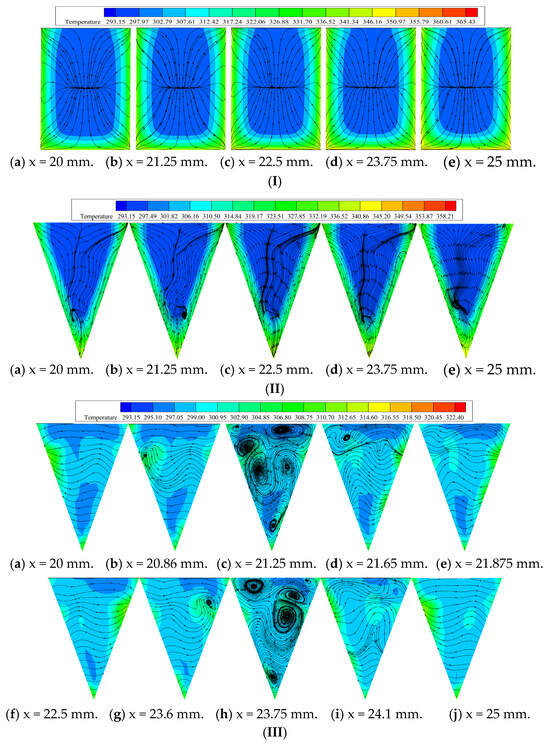
Figure 16.
Fluid streamline contours (I) in the RSM, (II) in the VSM and (III) in a period of wave in the optimal VWM.
4.2.2. Comparison of Heat Transfer Property
As shown in Figure 17, the optimal VWM heat sink possesses the most uniform temperature distribution and the smallest maximum temperature compared to the VSM and RSM heat sinks. Although possessing a smaller heat transfer area, the VSM heat sink possesses a larger have, a smaller R and a larger ΔP than the RSM heat sink, as depicted in Table 4. This is because the V-shaped section has a thinner thermal boundary layer than the rectangular-shaped section due to a few Dean Vortexes emerging at the microchannel bottom. Furthermore, the optimal VWM heat sink has a larger have, a smaller R, a smaller temperature rise and a larger ΔP than the VSM heat sink, showing that the wavy path has a thinner thermal boundary layer than the straight path due to many Dean Vortexes emerging periodically. Therefore, the optimal VWM heat sink has a temperature rise of a mere 29.39 k, which is much smaller than that of the VSM and RSM heat sinks.
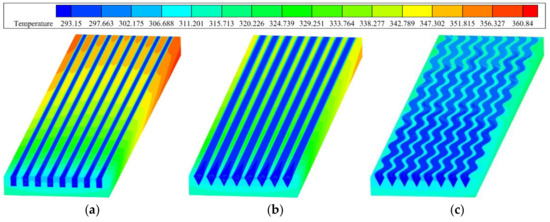
Figure 17.
Temperature contours of (a) RSM heat sink, (b) VSM heat sink and (c) VWM heat sink.
Table 4.
Comparison of different microchannel heat sinks.
Furthermore, compared to those of the VSM heat sink, the have of the VWM heat sink is significantly increased by 156.42%, while its heat transfer area is merely slightly increased by 2.23%, which demonstrate that the Dean Vortexes have a larger influence on the heat transfer property than the heat transfer area. Ultimately, the optimal VWM heat sink has a much larger PEC than the VSM and RSM heat sinks.
5. Conclusions
(1) Many Dean Vortexes periodically emerge in the V-shaped wavy microchannel, particularly at the wave peak and valley. These Dean Vortexes are capable of thinning the thermal boundary layer, thereby significantly enhancing heat transfer.
(2) When A and u increase while λ decreases, the area, number and severity of the Dean Vortexes increase, and thus both Nuave and ΔP also increase. In the present study, PEC first increases and then decreases, reaching its maximum value when A = 0.3 mm, λ = 5 m and u = 1.0 m/s.
(3) At the same pump power, both the heat transfer area and the total Dean Vortex number increase with the increase in N, leading to a decrease in the thermal resistance R and the maximum temperature Tmax. In the present study, both the thermal resistance R and Tmax reach their minimum values when N = 8.
(4) Compared to the VSM and RSM heat sinks, the optimal VWM heat sink decreases Tmax by 29.93 K and 38.03 K, decreases R by 50.46% and 56.68%, increases have by 156.42% and 155.43% and increases PEC by 137% and 130.78%, respectively.
Author Contributions
Conceptualization, S.M.; methodology, M.C.; software, L.Y.; validation, T.L.; formal analysis, S.M.; investigation, M.C.; resources, L.Y.; data curation, T.L.; writing—original draft preparation, S.M.; writing—review and editing, M.C.; visualization, L.Y.; supervision, T.L.; project administration, S.M.; funding acquisition, S.M. All authors have read and agreed to the published version of the manuscript.
Funding
This research was funded by the Key Scientific and Technological Project of Henan Province (252102230050).
Data Availability Statement
The original contributions presented in the present study are included in the article. Further inquiries can be directed to the corresponding author.
Conflicts of Interest
The authors declare no conflicts of interest.
References
- Saeed, M.; Kim, M.H. Heat transfer enhancement using nanofluids (Al2O3-H2O) in mini-channel heatsinks. Int. J. Heat Mass Transf. 2017, 120, 671–682. [Google Scholar] [CrossRef]
- He, Z.; Ding, S.; Cui, B.; Shentu, H.; Yu, J.; Wang, X.; Liu, X. Finite Element Analysis of Heat Transfer and the Dean Vortexes of Rectangular Wavy Microchannel. Heat Transf. Res. 2024, 55, 19–38. [Google Scholar] [CrossRef]
- Islami, B.; Dastvareh, S.; Gharraei, R. An investigation on the hydrodynamic and heat transfer of nanofluid flow, with non-Newtonian base fluid, in micromixers. Int. J. Heat Mass Transf. 2014, 78, 917–929. [Google Scholar] [CrossRef]
- Pourhammati, S.; Hossainpour, S. Improving the hydrothermal characteristics of wavy microchannel heat sink by modification of wave length and wave wave amplitude. Int. Commun. Heat Mass Transf. 2021, 130, 105805. [Google Scholar] [CrossRef]
- Ahmed, H.E.; Ahmed, M.I. Optimal thermal design of triangular, trapezoidal and rectangular-shaped grooved microchannel heat sinks. Int. Commun. Heat Mass Transf. 2015, 66, 47–57. [Google Scholar] [CrossRef]
- Khan, A.A.; Kim, K.Y. Evaluation of Various Channel Shapes of a Microchannel heat sink. Int. J. Air-Cond. Refrig. 2016, 24, 1650018. [Google Scholar] [CrossRef]
- Lei, Y.; Chen, Z.Q. Numerical Study of Condensation Heat Transfer in Curved Triangle Microchannels. Procedia Eng. 2017, 205, 64–70. [Google Scholar] [CrossRef]
- Lei, Y.; Chen, Z. Numerical Study of Condensation Heat Transfer in Curved Square and Triangle Microchannels. Heat Transf. Eng. 2019, 41, 768–778. [Google Scholar] [CrossRef]
- Qi, Z.; Zheng, Y.; Wei, J.; Yu, X.; Jia, X.; Liu, J.; Chen, L.; Miao, J.; Li, C. Surface treatment of an applied novel all-diamond microchannel heat sink for heat transfer property enhancement. Appl. Therm. Eng. 2020, 177, 13594311. [Google Scholar] [CrossRef]
- Chen, Y.; Zhang, C.; Shi, M.; Wu, J. Three-dimensional numerical simulation of heat and fluid flow in noncircular microchannel heat sinks. Int. Commun. Heat Mass Transf. 2009, 36, 917–920. [Google Scholar] [CrossRef]
- Wang, H.; Chen, Z.; Gao, J. Influence of geometric parameters on flow and heat transfer property of micro-channel heat sinks. Appl. Therm. Eng. 2016, 107, 870–879. [Google Scholar] [CrossRef]
- Monavari, A.; Jamaati, J.; Bahiraei, M. Thermohydraulic performance of a nanofluid in a microchannel heat sink: Use of different microchannels for change in process severity. J. Taiwan Inst. Chem. Eng. 2021, 125, 1–14. [Google Scholar] [CrossRef]
- Filimonov, R.; Sorvari, J. Numerical study on the influence of section orientation on fluid flow and heat transfer in a periodic serpentine triangular microchannel. Appl. Therm. Eng. 2017, 125, 366–376. [Google Scholar] [CrossRef]
- Ma, H.; Duan, Z.; Ning, X.; Su, L. Numerical investigation on heat transfer behavior of thermally developing flow inside rectangular-shaped microchannels. Case Stud. Therm. Eng. 2021, 24, 100856. [Google Scholar] [CrossRef]
- Xu, S.; Wang, W.; Fang, K.; Wong, C.N. Heat transfer property of a fractal silicon microchannel heat sink subjected to pulsation flow. Int. J. Heat Mass Transf. 2015, 81, 33–40. [Google Scholar] [CrossRef]
- Ikhlaq, M.; Al-Abdeli, Y.M.; Khiadani, M. Nozzle exit conditions and the heat transfer in non-swirling and weakly swirling turbulent impinging jets. Heat Mass Transf. 2020, 56, 269–290. [Google Scholar] [CrossRef]
- Shah, R.K.; London, A.L. Laminar Flow Forced Convection in Ducts; Academic Press: Cambridge, MA, USA, 1978; pp. 196–246. [Google Scholar]
- Qu, W.L.; Mudawar, I. Analysis of three-dimensional heat transfer in microchannel heat sinks. Int. J. Heat Mass Transf. 2002, 45, 3973–3985. [Google Scholar] [CrossRef]
- Hu, Z.; Feng, Z.; Huang, K. Numerical analysis of overall performance of heat sink in sinusoidal bottom microchannel. Chem. Eng. 2020, 48, 29–33. [Google Scholar]


Disclaimer/Publisher’s Note: The statements, opinions and data contained in all publications are solely those of the individual author(s) and contributor(s) and not of MDPI and/or the editor(s). MDPI and/or the editor(s) disclaim responsibility for any injury to people or property resulting from any ideas, methods, instructions or products referred to in the content. |
© 2025 by the authors. Licensee MDPI, Basel, Switzerland. This article is an open access article distributed under the terms and conditions of the Creative Commons Attribution (CC BY) license (https://creativecommons.org/licenses/by/4.0/).