Article

Trust, Emotion, and Skepticism in AI-Enabled Academic Marketing: Psychometric Validation and Cross-Validated Machine Learning Evidence from Higher Education

MIT College of Management, MIT Art, Design & Technology University, Loni Kalbhor, Pune 412201, India
*
Author to whom correspondence should be addressed.
Informatics 2026, 13(6), 97; https://doi.org/10.3390/informatics13060097
Submission received: 10 May 2026 / Revised: 14 June 2026 / Accepted: 15 June 2026 / Published: 20 June 2026

Abstract

Higher-education institutions increasingly use AI-enabled chatbots, personalised communication, recommendation systems, and predictive information services in academic marketing. Adoption of these systems depends not only on technical availability, but also on institutional trust, emotional engagement, and skepticism regarding the reliability, transparency, and autonomy implications of AI. This study examines the Trust-Tech Nexus framework using stakeholder survey data collected at MIT Art, Design and Technology University, Pune, India (N = 300). The analysis combines psychometric validation, WLSMV confirmatory factor analysis for ordered indicators, and cross-validated predictive modelling. Four three-item constructs were measured with five-point Likert indicators, as follows: AI Adoption, Institutional Trust, Emotional Engagement, and AI Skepticism. Reliability and convergent validity were acceptable, and the WLSMV CFA showed strong practical fit (CFI = 0.991, TLI = 0.988, RMSEA = 0.040, SRMR = 0.039). Discriminant validity was supported by HTMT and Fornell–Larcker evidence, while Harman’s single-factor result was treated only as an initial diagnostic. Construct-only ridge regression produced positive out-of-sample predictive evidence (CV R-squared = 0.352; RMSE = 0.642; MAE = 0.501). Exploratory classification results were moderate and are interpreted only as supplementary segmentation evidence because the binary targets were derived from the AI Adoption composite. The study supports a validated four-construct measurement structure and moderate predictive association in one institutional context, while avoiding causal claims.

1. Introduction

AI-enabled information systems are now part of how universities communicate with prospective students, current students, alumni, staff, and external stakeholders. Institutional interactions may be made more responsive through the use of chatbots, personalised information services, recommendation engines, predictive engagement systems, and AI-assisted communication tools. However, the extent to which these technologies are adopted by stakeholders is a function of those stakeholders’ interpretation of institutional credibility, emotional relevance, and perceived risk of algorithmic mediation. Thus, the adoption of AI in higher education is a social-informatics inquiry rather than a technical inquiry; the same technology may be accepted, resisted, or used cautiously based on trust, emotion, transparency, and perceived autonomy.
The Technology Acceptance Model explains adoption through perceived usefulness and ease of use [1,2,3], while relationship-marketing and organizational-trust research helps explain why stakeholders are more willing to use institutionally mediated services when they perceive the provider as credible and trustworthy [4,5,6,7]. In AI-enabled academic marketing, these perspectives matter because algorithmic systems may be opaque, probabilistic, and personally consequential. Recent reviews of AI in higher education emphasize not only support and personalisation, but also recurring concerns about transparency, trustworthiness, reliability, ethics, and responsible deployment [8,9,10,11,12,13,14,15,16,17,18,19,20,21,22,23,24]. Recent evidence also continues to connect AI acceptance in education with TAM/SEM traditions and trust-oriented adoption mechanisms [14,25,26].
This article develops and tests a Trust-Tech Nexus perspective in which AI Adoption is examined in relation to Institutional Trust, Emotional Engagement, and AI Skepticism. The contribution is not the invention of entirely new constructs, but their context-specific integration for AI-enabled academic marketing in higher education, the transparent 12-item operationalization, and the combination of ordered-indicator CFA with out-of-sample predictive validation. The study addresses three research questions, as follows: RQ1, does the proposed four-construct measurement structure meet accepted reliability and validity standards? RQ2, how are Institutional Trust, Emotional Engagement, and AI Skepticism associated with AI Adoption? RQ3, do these constructs provide meaningful cross-validated predictive evidence for AI Adoption? The machine learning component is used as a predictive and exploratory supplement, not as causal evidence [27,28,29,30,31,32]. Practically, the findings are intended to inform how universities design and govern AI-enabled academic communication including AI chatbots, personalised communication, recommendation systems, and predictive information services so that adoption is reinforced by institutional trust and emotional engagement while skepticism is addressed through transparency rather than treated as mere resistance. Within Informatics, the study is positioned at the intersection of AI-enabled information systems, institutional trust, human– technology interaction, and the social conditions that shape stakeholder adoption in higher education.
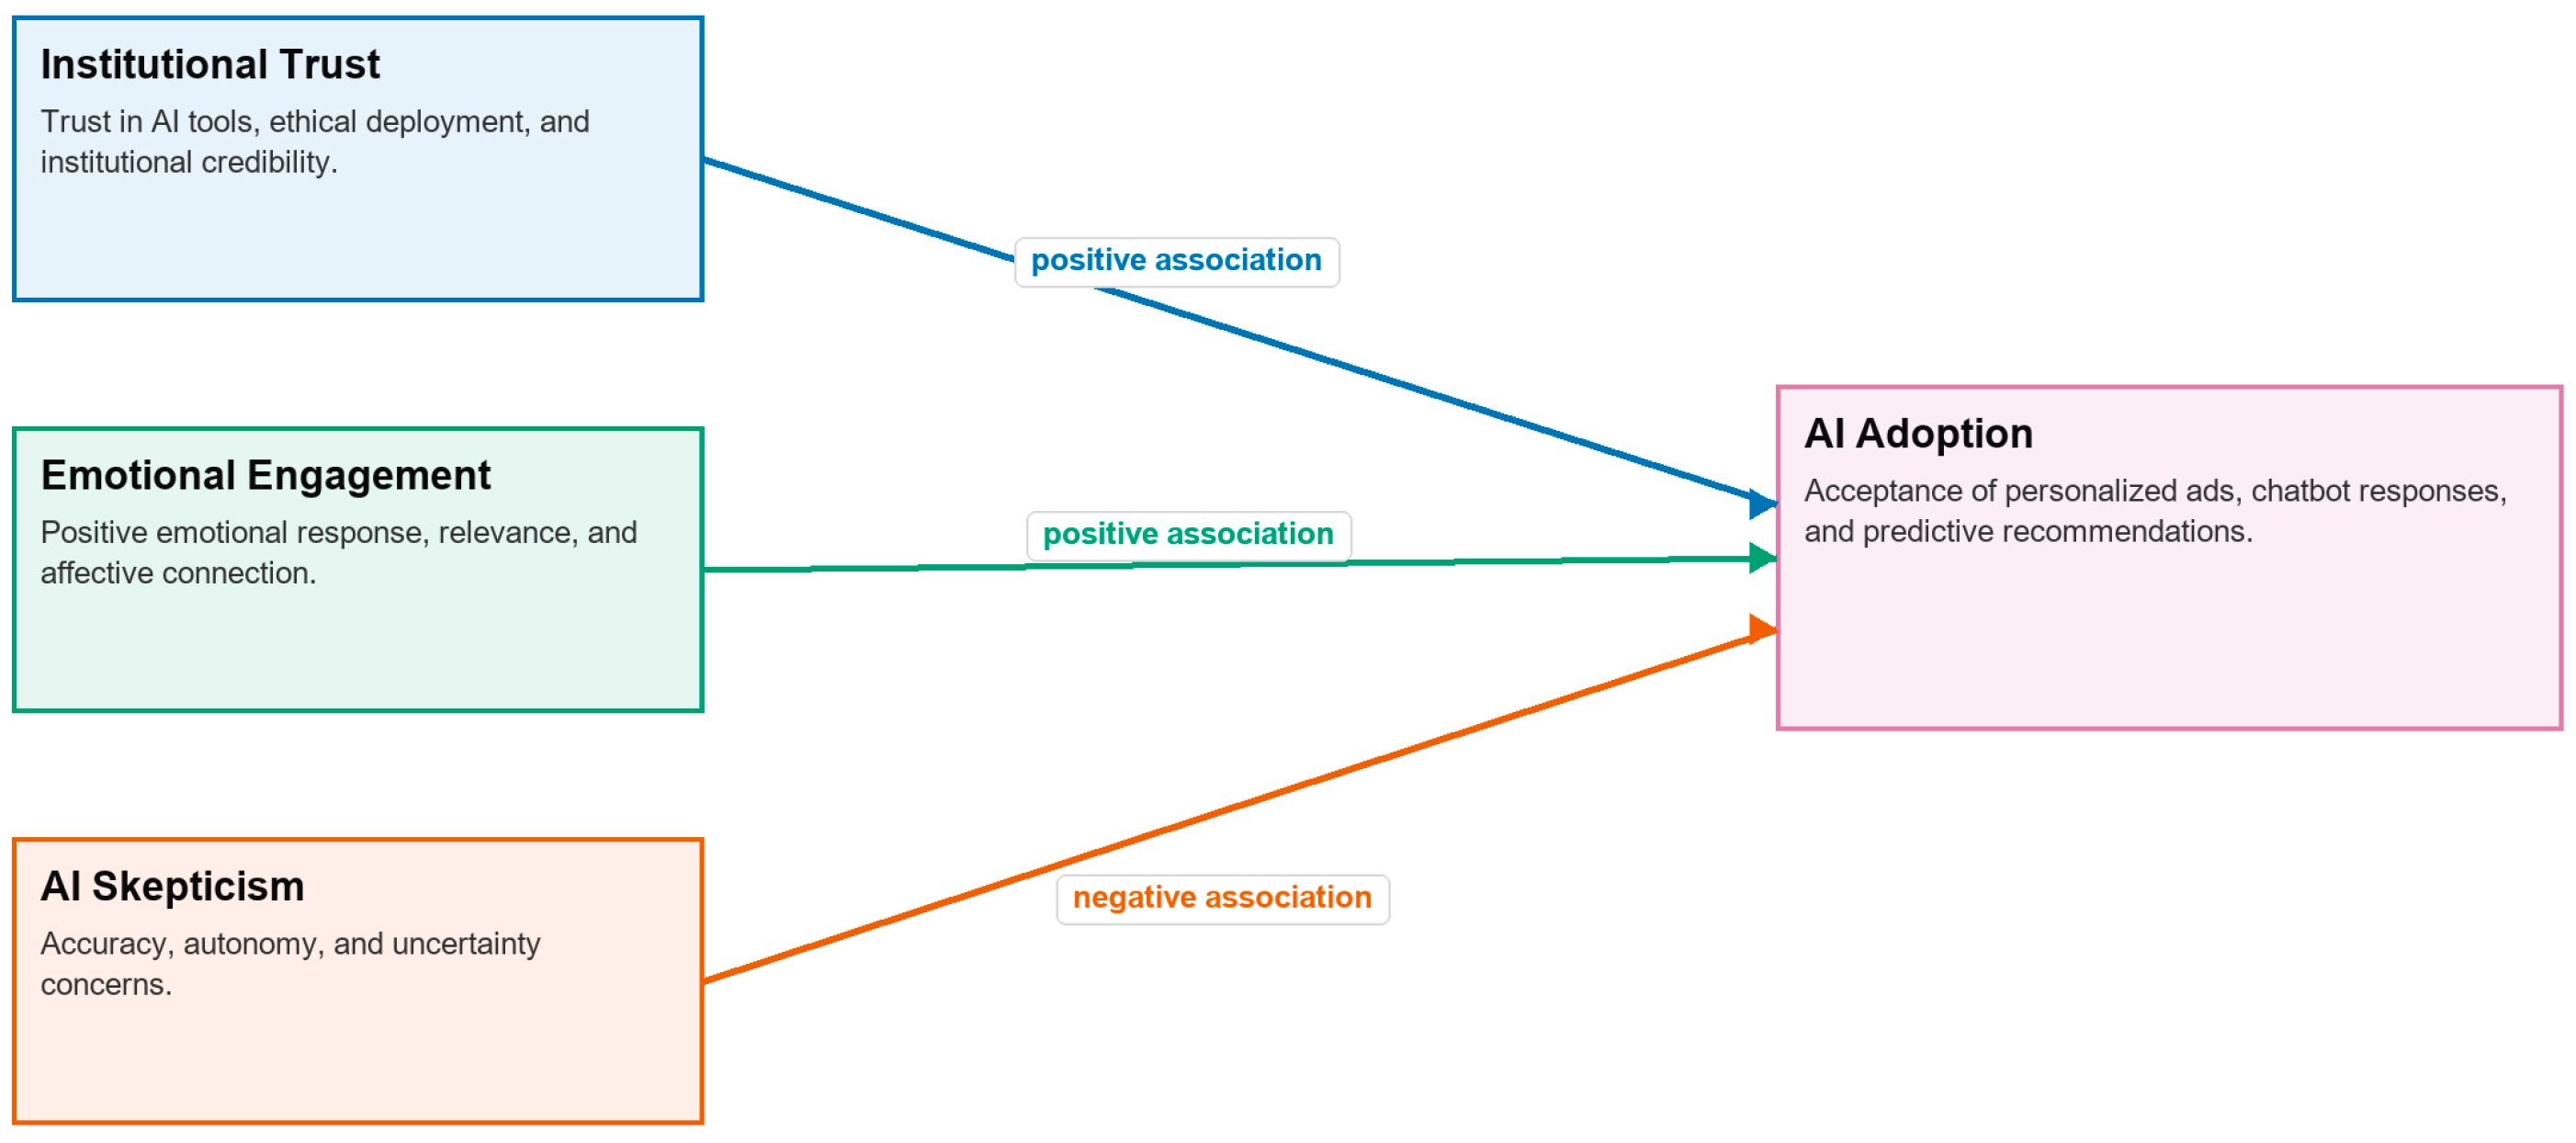
Figure 1 presents the Trust-Tech Nexus conceptual framework used to organize the theoretical relationships among Institutional Trust, Emotional Engagement, AI Skepticism, and AI Adoption.
The framework positions AI Adoption as a stakeholder response shaped by Institutional Trust, Emotional Engagement, and AI Skepticism within an institutionally mediated academic communication and decision-support environment. Institutional Trust and Emotional Engagement are specified as positive correlates because greater perceived institutional credibility and stronger affective engagement are expected to increase stakeholder willingness to use AI-enabled academic communication tools. By contrast, AI Skepticism is specified as a negative correlate because concerns about opacity, inaccuracy, and reduced autonomy are expected to reduce willingness to rely on AI-supported institutional interactions. The model is conceptually bounded to the higher-education context and is not proposed as a universal framework for all forms of AI adoption.

2. Theoretical Background

2.1. AI Adoption and Institutional Trust

The Technology Acceptance Model and its extensions remain central to explaining technology acceptance [1,2,3]. In AI-enabled academic marketing, however, the perceived usefulness of personalised advertisements, chatbots, and predictive recommendations cannot be separated from the institutional setting in which these services are delivered. Stakeholders evaluate not only whether the tool is useful, but also whether the institution deploying it is credible, responsible, and transparent. Research across digital service settings shows that trust reduces uncertainty and can increase willingness to use institutionally mediated systems [4,5,6,7].

2.2. Emotion and AI Skepticism

Emotion also shapes judgments and decision-making, especially when information is uncertain or personally consequential [33,34]. In academic marketing, emotionally engaging AI communication may make institutional messages feel more relevant, responsive, and personally meaningful. At the same time, technology-readiness and resistance perspectives explain why users may resist tools that appear intrusive, inaccurate, or autonomy reducing [35,36]. In the present study, AI Skepticism is used as a practical construct that captures accuracy concerns, autonomy concerns, and uncertainty concerns. The framework therefore expects Institutional Trust and Emotional Engagement to be positively associated with AI Adoption, whereas AI Skepticism is expected to be negatively associated with adoption.

2.3. Positioning Within AI-in-Education Research

Recent AI-in-education research has documented both the opportunities and the governance challenges associated with AI-enabled communication, recommendation, and support systems [8,9,10,11,12,13,14,15,16,17,18,19,20,21,22,23,24,37,38]. What remains underdeveloped is a bounded account of AI adoption in academic marketing, where institutional reputation, stakeholder aspirations, AI-assisted services, and decision confidence converge. In this paper, academic marketing is defined as the AI-supported communication and service layer through which a higher-education institution informs, guides, and engages prospective and current stakeholders about academic opportunities, choices, and institutional offerings. Concretely, academic marketing in this sense covers AI-powered programme recommendations, chatbot-based admissions guidance, personalised course information, and predictive student communication. It is therefore distinct from broader learning analytics, general student-support services, and routine administrative or institutional communication, which respectively centre on instructional performance, student welfare, and operational messaging rather than on the decision-oriented, institutionally mediated engagement through which stakeholders evaluate academic opportunities and offerings.
The distinctiveness of the Trust-Tech Nexus framework lies in three linked contributions. First, it brings together institutional trust, emotional engagement, and skepticism within a single higher-education academic-marketing context rather than treating them as isolated explanatory variables. Second, it operationalizes these constructs through a transparent 12-item instrument that is explicitly mapped to both measurement and predictive analyses. Third, it separates measurement validation, predictive validation, and causal interpretation, thereby positioning the machine learning component as an out-of-sample robustness exercise rather than as a claim of algorithmic novelty.
The theoretical rationale for integrating these constructs is that AI-enabled academic marketing is not experienced by stakeholders as a purely functional information system. Rather, it is encountered as an institutionally mediated decision-support environment in which perceived credibility, emotional resonance, and concerns about opacity, inaccuracy, or reduced autonomy jointly shape willingness to engage with AI-supported communication. The Trust-Tech Nexus framework therefore treats Institutional Trust, Emotional Engagement, and AI Skepticism as complementary dimensions of stakeholder evaluation rather than as isolated predictors. Accordingly, the framework is conceptually bounded, as follows: it is not proposed as a universal model of all AI adoption, but as a higher-education-specific account of how stakeholders evaluate AI-mediated academic communication and service interactions.

3. Materials and Methods

3.1. Research Design and Dataset

This study used a cross-sectional survey design to examine stakeholder responses to AI-enabled academic communication and service interactions in a higher-education setting. Data were collected between 1 January 2024 and 31 December 2024 at MIT Art, Design and Technology University, Pune, India. The dataset consists of respondent-level survey data and contains 300 valid completed responses with no missing values for the 12 Likert-scale indicators used in the core analysis. Each indicator was measured on a five-point scale ranging from 1 = Strongly Disagree to 5 = Strongly Agree. The design supports psychometric validation and predictive modelling, but it does not support causal inference.
Purposive sampling was used because the target population consisted of stakeholders with awareness of, or exposure to, AI-enabled academic communication tools and services, including chatbots, personalised advertisements, recommendation systems, and AI-supported institutional information services. Inclusion was therefore based on stakeholder relevance to the institution’s academic communication environment rather than random selection from a broader population. Because the survey link was distributed through institutional communication channels and the number of unique invited participants was not archived in a verifiable way, a precise response rate could not be calculated.
The final dataset combined UG students, PG students, faculty, administrative staff, and other institutionally relevant respondents into one pooled stakeholder population. This approach was adopted because the principal aim of the study was institution-level construct validation and predictive testing within a shared AI-supported academic communication environment, rather than subgroup comparison. Although respondents may not all have interacted with an identical interface, they were recruited from the same institutional AI-supported communication environment. The focus of the analysis was therefore on whether the proposed Trust-Tech Nexus constructs and their relationships were empirically defensible across the institutional communication ecosystem as a whole. At the same time, these stakeholder groups may differ in their experiences of, expectations of, and reliance on AI-enabled academic marketing. Accordingly, the pooled analysis should not be interpreted as implying subgroup equivalence, and subgroup-specific analyses remain an important direction for future research.
Initial data screening confirmed 300 usable cases, zero duplicated respondent identifiers, complete responses for all Q1–Q12 items, and valid five-point Likert ranges for every measurement indicator. Demographic variables were retained for sample description and supplementary control models, whereas the primary predictive models used only the construct-level predictors in order to preserve interpretive clarity and avoid unnecessary dimensionality. Sample adequacy was evaluated with reference to both the measurement model and the predictive analysis. For WLSMV CFA, N = 300 is adequate for a four-factor model with 12 ordered indicators. The predictive models were intentionally low-dimensional and evaluated using deterministic 10-fold cross-validation to reduce overfitting and provide an out-of-sample assessment of predictive utility. Because the study was designed as an exploratory institution-level validation exercise, the pooled analysis is used to characterize the shared higher-education communication environment rather than to imply that every subgroup experienced AI-enabled services in the same way. The respondent profile and study context utilized in the empirical analyses are presented in Table 1.
Table 1 shows that the study reflects a single-institution higher-education stakeholder sample drawn from MIT Art, Design and Technology University, Pune, India. The respondent pool includes students, faculty, administrative staff, and other institutionally relevant respondents, and should therefore be interpreted as institution-level exploratory evidence rather than as a representative sample of a broader population.
Table 2 reports descriptive statistics for the principal internal stakeholder groups, as follows: students, faculty, and administrative staff. Groupwise descriptive comparisons did not indicate differences of a magnitude that would invalidate pooled institution-level exploratory analysis; therefore, the variables were modelled for the sample as a whole. One-way ANOVA results likewise did not indicate statistically notable between-group mean differences for AI Adoption (F = 0.041, p = 0.959), Institutional Trust (F = 0.678, p = 0.509), Emotional Engagement (F = 0.038, p = 0.963), or AI Skepticism (F = 0.179, p = 0.836).

3.2. Measures and Construct Scoring

The 12-item instrument was developed as a theory-driven, context-specific measure for AI-enabled academic marketing in higher education. Item wording was informed by prior literature on AI adoption, institutional trust, affective judgment, and technology resistance, and then adapted to reflect the communication and decision-support context of higher-education institutions. The questionnaire was reviewed during instrument preparation for wording clarity, contextual fit, and interpretive consistency before final administration. Negatively framed skepticism items were handled consistently during composite-score construction so that higher values reflected higher AI Skepticism throughout the analysis.
At the same time, the study does not assume that all item-to-construct mappings are conceptually perfect. Some AI Skepticism items may also reflect autonomy-related concern or decision anxiety, while the Institutional Trust construct includes both trust in institutional credibility and trust in AI-supported institutional deployment. Accordingly, the instrument is interpreted as an internally coherent applied measure for the present study rather than as a definitive final taxonomy of AI-related stakeholder attitudes. Because the instrument was validated in a single institutional context and uses only three indicators per construct, it should be regarded as a context-specific applied measure rather than a final general-purpose scale for AI adoption in higher education; broader generalization would require replication and further psychometric development across institutions. The questionnaire measured four constructs using three indicators each. AI Adoption was measured through items on personalised advertisements, chatbot responses, and predictive recommendations. Institutional Trust combined trust in AI tools, trust in ethical institutional deployment, and trust in institutional credibility. Emotional Engagement captured positive emotional response and affective connection. AI Skepticism captured concerns about accuracy, reduced autonomy, and uncertainty. Composite scores were computed as the arithmetic mean of the three appropriate items for each construct.
Table 3 presents the exact wording of all 12 Trust-Tech Nexus indicators so that the measurement instrument remains transparent and reproducible.
Table 3 defines the latent constructs transparently before CFA and predictive results are interpreted, improving reproducibility and reducing ambiguity about what each construct measures.
Table 4 provides an overview of how each construct maps to its observed indicators and how those constructs were used in the predictive models.
Table 4 also clarifies the modelling logic, as follows: the target construct is separated from the predictor constructs, which reduces ambiguity about feature construction and leakage risk.
Figure 2 summarizes the end-to-end analysis pipeline from raw Excel data through psychometric validation, CFA, and cross-validated predictive evaluation.
Figure 2 shows prediction as the final stage of a broader validation workflow that begins with data screening, construct scoring, reliability checks, and measurement validation.
The HTMT matrix, the Fornell–Larcker matrix, and the lavaan output were examined directly during the measurement validation stage.

3.3. Psychometric and CFA Procedure

Reliability was assessed using Cronbach’s alpha. Convergent validity was assessed using composite reliability, average variance extracted, and standardized factor loadings. Discriminant validity was assessed with Fornell–Larcker comparisons and HTMT ratios [39,40]. Common method bias was screened with Harman’s single-factor diagnostic [41]. Because the indicators are ordered Likert items, CFA was estimated in lavaan using WLSMV and ordered indicators [42,43]. WLSMV was preferred because five-point Likert responses are ordered as categorical rather than continuous variables; estimators that assume continuous, normally distributed indicators can distort factor loadings and fit statistics for such data, whereas WLSMV draws on polychoric correlations and is robust to non-normality, making it appropriate for ordinal-indicator CFA. Model fit was evaluated using CFI, TLI, RMSEA, and SRMR, following established SEM guidance [44].
Statistical analyses were conducted using R version 4.4.2 with the lavaan package version 0.6-19 for WLSMV confirmatory factor analysis. Machine-learning analyses were conducted using Python version 3.12.4 with scikit-learn version 1.5.1. Microsoft Excel 2021 was used for data organization. No chemicals, reagents, laboratory devices, instruments, commercial cell lines, or commercial biological samples/materials were used in this study.
Because the study relied on self-reported questionnaire data, procedural steps were taken to reduce avoidable ambiguity in measurement. The instrument used consistent response anchors, clearly structured item wording, and construct-level organization, and it was reviewed during instrument preparation for wording clarity, contextual fit, and interpretive consistency before final administration. Participants were informed that responses would be used only for academic research purposes and would be treated confidentially, which was intended to reduce evaluation apprehension and socially desirable responding. However, the design did not include temporal separation of predictors and outcomes, a marker variable, or a common latent factor sensitivity model. Accordingly, common method variance cannot be ruled out and must be considered when interpreting the observed associations.

3.4. Machine Learning Procedure and Leakage Controls

The machine learning analysis recalculated all composite scores directly from Q1–Q12. The primary regression target was AI Adoption Score, computed as the mean of Q1–Q3. The primary predictors were Institutional Trust, Emotional Engagement, and AI Skepticism. To prevent target leakage, Q1–Q3 were never included as predictors when predicting AI Adoption. Model evaluation used deterministic 10-fold cross-validation. Regression performance was assessed using R-squared, RMSE, and MAE. Baseline performance was calculated using mean prediction for regression (RMSE = 0.797; MAE = 0.633) and majority-class prediction for classification (median target accuracy baseline = 0.617; AI Adoption ≥ 3.5 target baseline = 0.727). Machine learning was used as a complementary out-of-sample validation strategy rather than as a substitute for regression or SEM-based interpretation. Given the small number of construct-level predictors, the purpose of this step was not algorithmic novelty but to assess whether the validated constructs retained predictive utility under leakage-controlled cross-validation. The predictive component was therefore designed as a robustness-oriented extension of the psychometric and CFA analysis rather than as a stand-alone machine learning contribution.

4. Results

4.1. Descriptive Statistics

Table 5 reports the descriptive statistics for the four composite construct scores used in the main analysis.
Table 5 suggests that the constructs have enough empirical variability to allow for their use for association and predictive analysis; however, they are all bounded by the use of a five-point scale. The correlations suggest that AI Adoption had positive correlations with both Institutional Trust and Emotional Engagement but did not have strong correlations with AI Skepticism; this supports the anticipated directional associations and remains consistent with the discriminant validity evidence.
The relatively modest simple association between AI Skepticism and AI Adoption may indicate that skepticism does not always translate into outright rejection in this context. While higher-education stakeholders may have reservations about the potential accuracy, opacity, or autonomy implications of AI in academic communication tools that are enabled by AI, usage of such tools is pragmatically beneficial. Utility and skepticism may go hand-in-hand when these tools are used for accessing information and assisting the decision-making process. Such qualitative patterns of skepticism and utility as AI is used instrumentally will likely be relevant for the adoption of AI in Indian higher education as well; users may be pragmatically evaluating the benefits of AI, while concurrently being concerned about issues related to reliability, transparency, and control.

4.2. Reliability, Validity, and CFA

Table 6 presents the construct-level reliability and convergent-validity evidence.
Table 6 shows that predictive modelling was applied only after the constructs demonstrated acceptable internal reliability and convergent validity. All reliability estimates exceeded the conventional 0.70 threshold. The four-factor WLSMV CFA also showed strong practical model fit. Although the scaled chi-square statistic was significant, practical fit indices formed the main basis of interpretation because chi-square is sensitive to sample size.
Table 7 reports the CFA fit indices, Table 8 reports the full standardized WLSMV factor loadings with standard errors and significance levels, and Table 9 reports the latent factor correlations together with the Fornell–Larcker discriminant-validity summary. The full standardized loading output, the HTMT matrix, the ordinal thresholds for the ordered indicators, and the exact lavaan model specification were examined directly during measurement validation.
Table 7, Table 8 and Table 9 together show that the four-factor measurement structure is empirically defensible for ordered Likert indicators and sufficiently documented for independent scrutiny rather than relying only on summary claims.
Table 10 presents the HTMT matrix as an additional discriminant-validity diagnostic. All off-diagonal HTMT values remained below the conservative 0.85 threshold, supporting the distinctiveness of the four construct domains.
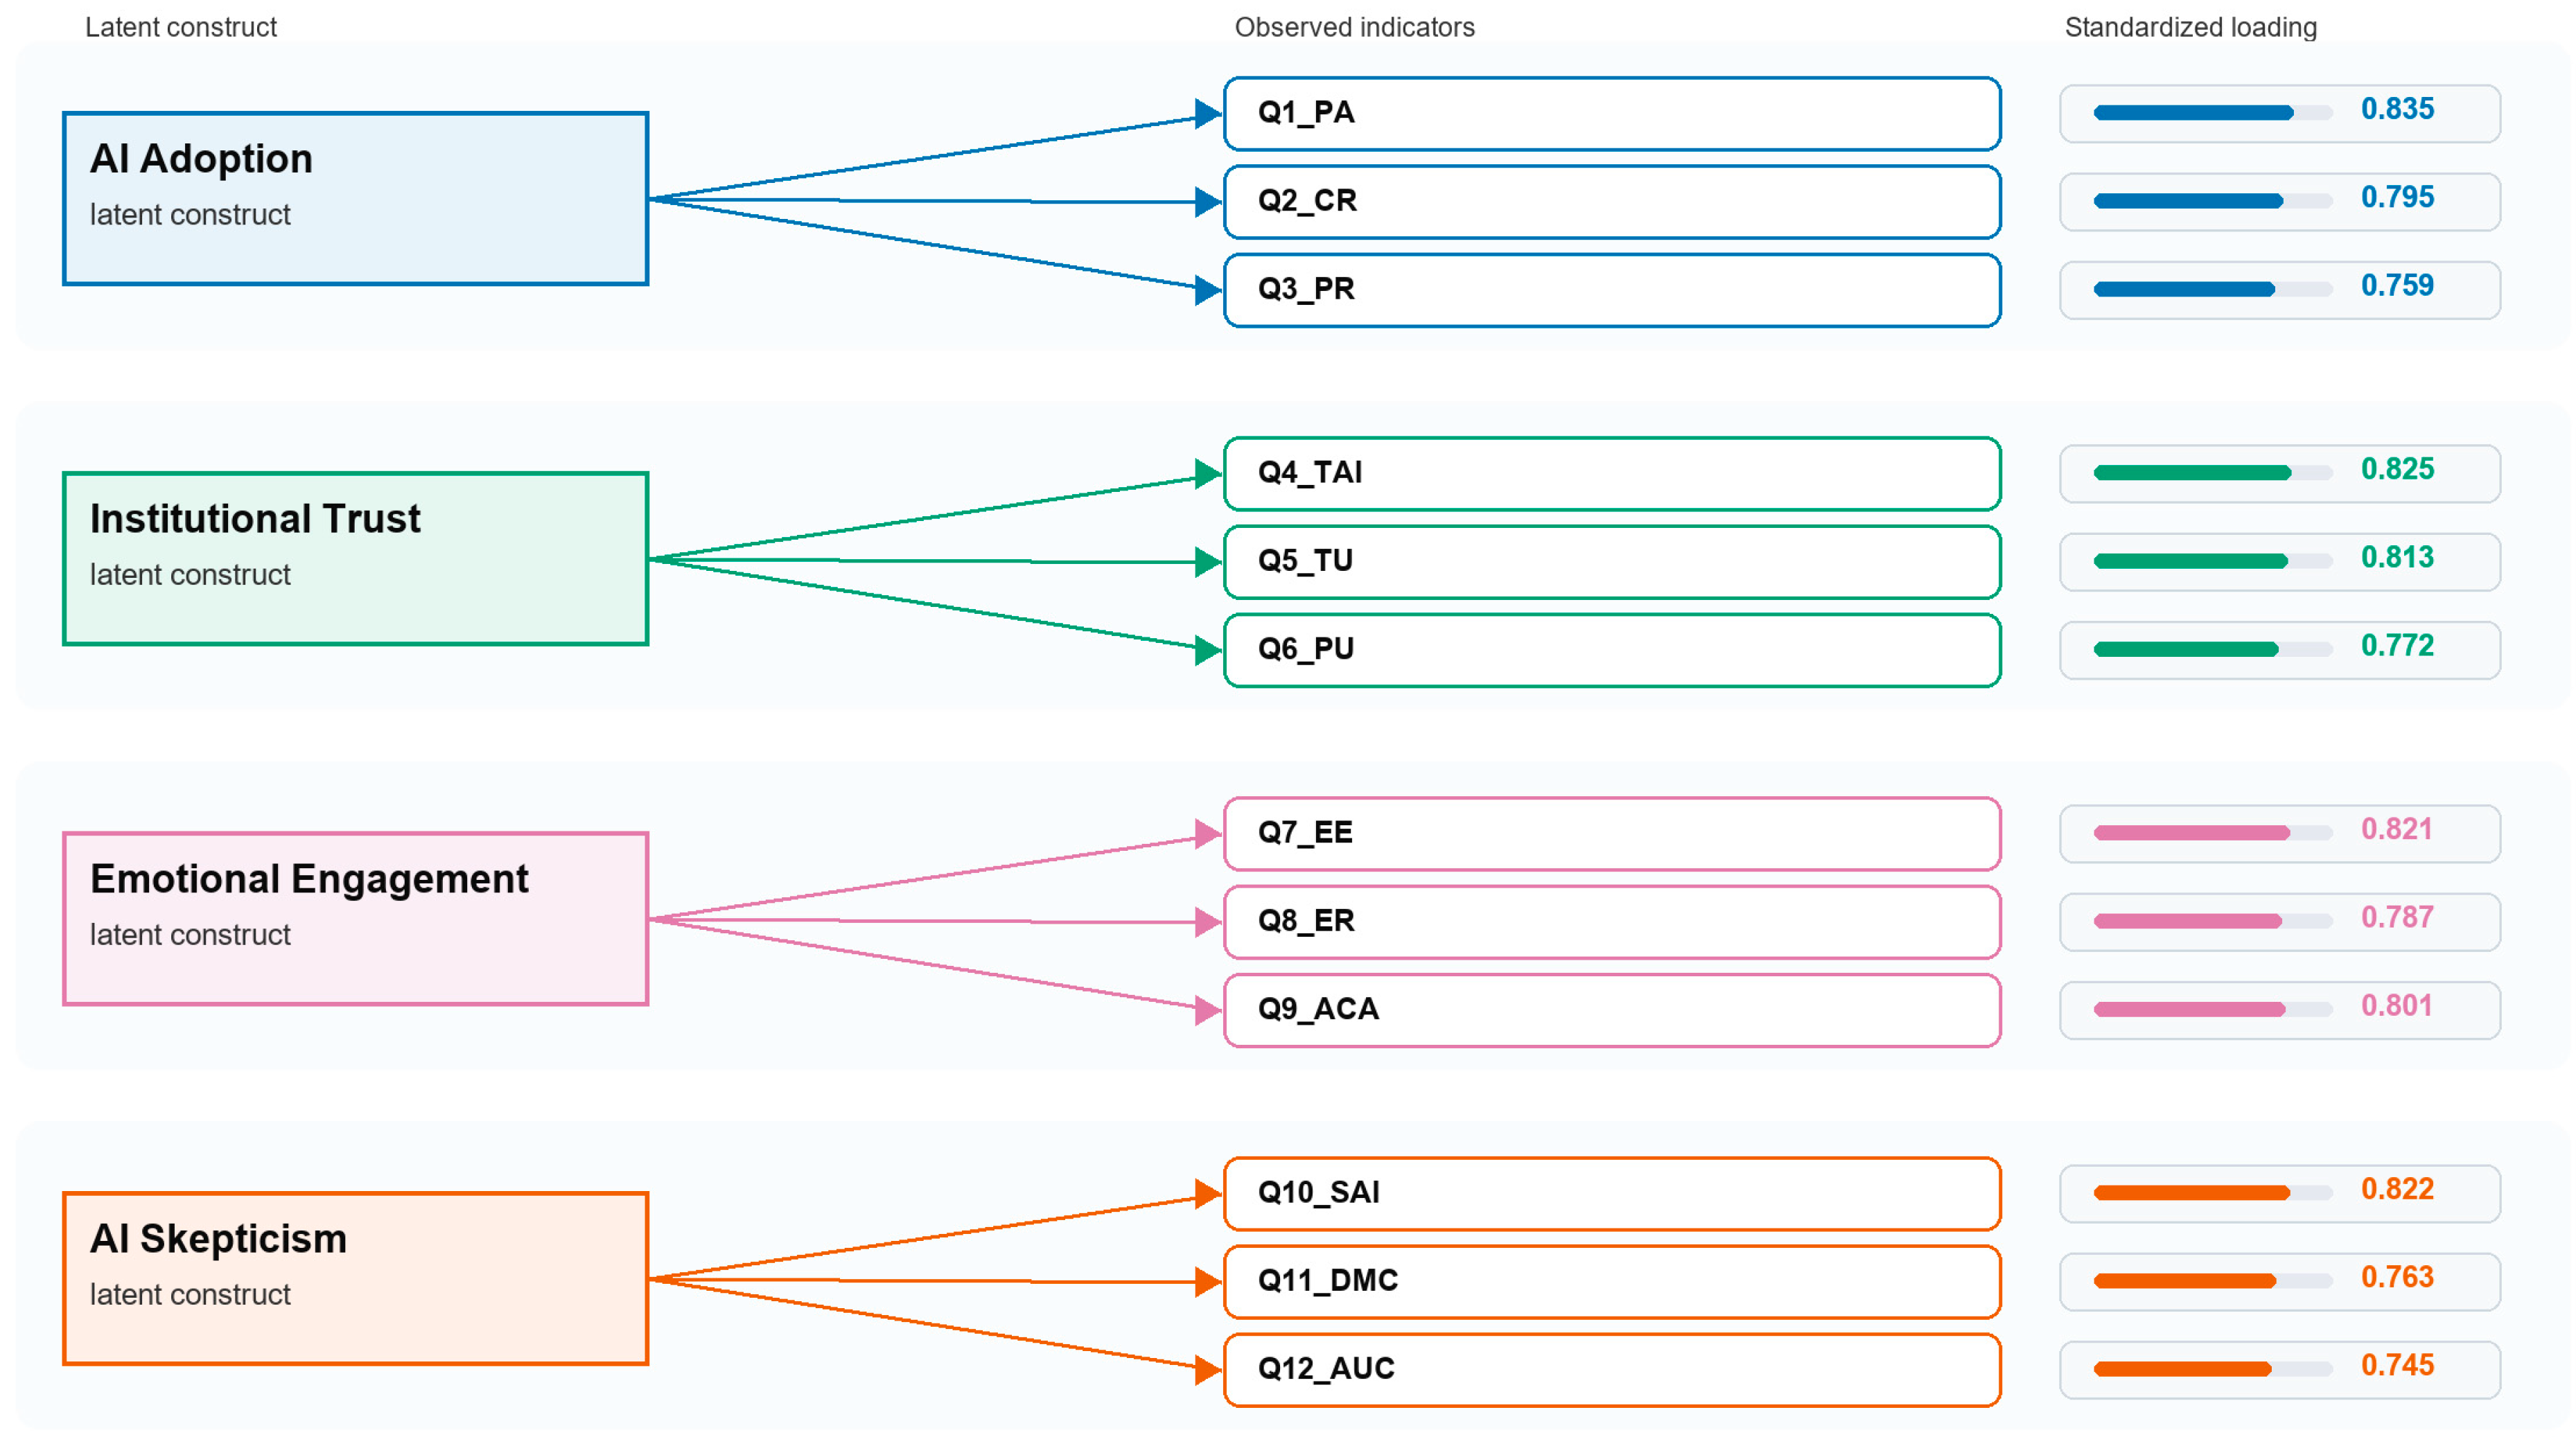
Figure 3 illustrates that each indicator contributes meaningfully to its intended latent construct, strengthening the bridge between item wording and construct-level interpretation.

4.3. Discriminant Validity and Common Method Bias

Discriminant validity was supported by HTMT values below the conservative 0.85 threshold and by Fornell–Larcker comparisons. Harman’s single-factor diagnostic was treated only as an initial screening result rather than as a definitive test of common method variance. Although the first unrotated factor did not account for a dominant share of total variance, the predictor constructs and the AI Adoption outcome were collected from the same respondents using the same questionnaire at the same point in time. As a result, common method variance remains a meaningful limitation, and the observed associations may be somewhat inflated by shared method effects even though the measurement and validity diagnostics were otherwise acceptable [41]. Future research could address common method variance more directly through temporal separation of predictor and outcome measurement, the inclusion of objective behavioural usage data, the use of marker variables, and triangulation with multi-source institutional records, rather than relying solely on concurrent self-reports from the same respondents.

4.4. Cross-Validated Machine Learning Results

Cross-validated predictive performance against relevant classification and regression baselines is displayed in Table 11. Predictive evidence for the study is primarily provided by the regression results, as they directly match the construct-level development for the study as well as retain the continuous nature of the AI Adoption results. By contrast, classification results are supplementary because the binary targets were derived from the AI Adoption composite and therefore function only as exploratory segmentation checks rather than as independent theoretical outcomes. In particular, they are recoded from the self-reported AI Adoption composite rather than measured as independent behavioural outcomes such as actual system-usage logs. The machine learning results should therefore be interpreted as moderate out-of-sample predictive evidence rather than as a claim of advanced algorithmic performance.
Regression results provide the primary predictive evidence, whereas classification remains supplementary because the binary targets were derived from the AI Adoption composite.
Table 11 indicates that Institutional Trust, Emotional Engagement, and AI Skepticism contain out-of-sample predictive information about AI Adoption, but that this evidence is best interpreted as moderate predictive association in one institutional context rather than as broad validation of AI adoption behaviour.
Permutation-based importance results follow the same directional pattern, with Emotional Engagement contributing the largest increase in prediction error when perturbed, followed by AI Skepticism and Institutional Trust.
Construct-only regression models provided meaningful out-of-sample predictive evidence for AI Adoption. Ridge regression produced cross-validated RMSE = 0.642 and MAE = 0.501 in the verified rerun, improving on the mean-prediction baseline RMSE of 0.797. In the standardized ridge summary, Emotional Engagement showed the strongest positive predictive contribution (beta = 0.288), Institutional Trust showed a smaller positive contribution (beta = 0.146), and AI Skepticism showed a negative contribution (beta = −0.172). The machine learning component is therefore useful as an out-of-sample robustness check, but its novelty is modest because the model relies on only three validated construct-level predictors. Classification results showed only moderate segmentation performance and are treated as supplementary robustness evidence rather than as a central contribution.
Table 12 summarizes the standardized predictive contribution pattern of the three construct-level predictors. Emotional Engagement showed the strongest positive predictive contribution to AI Adoption, Institutional Trust showed a smaller positive contribution, and AI Skepticism showed a negative contribution. This pattern was also consistent with the permutation-based importance results. These values are interpreted as moderate predictive associations under cross-validation rather than as causal effects.
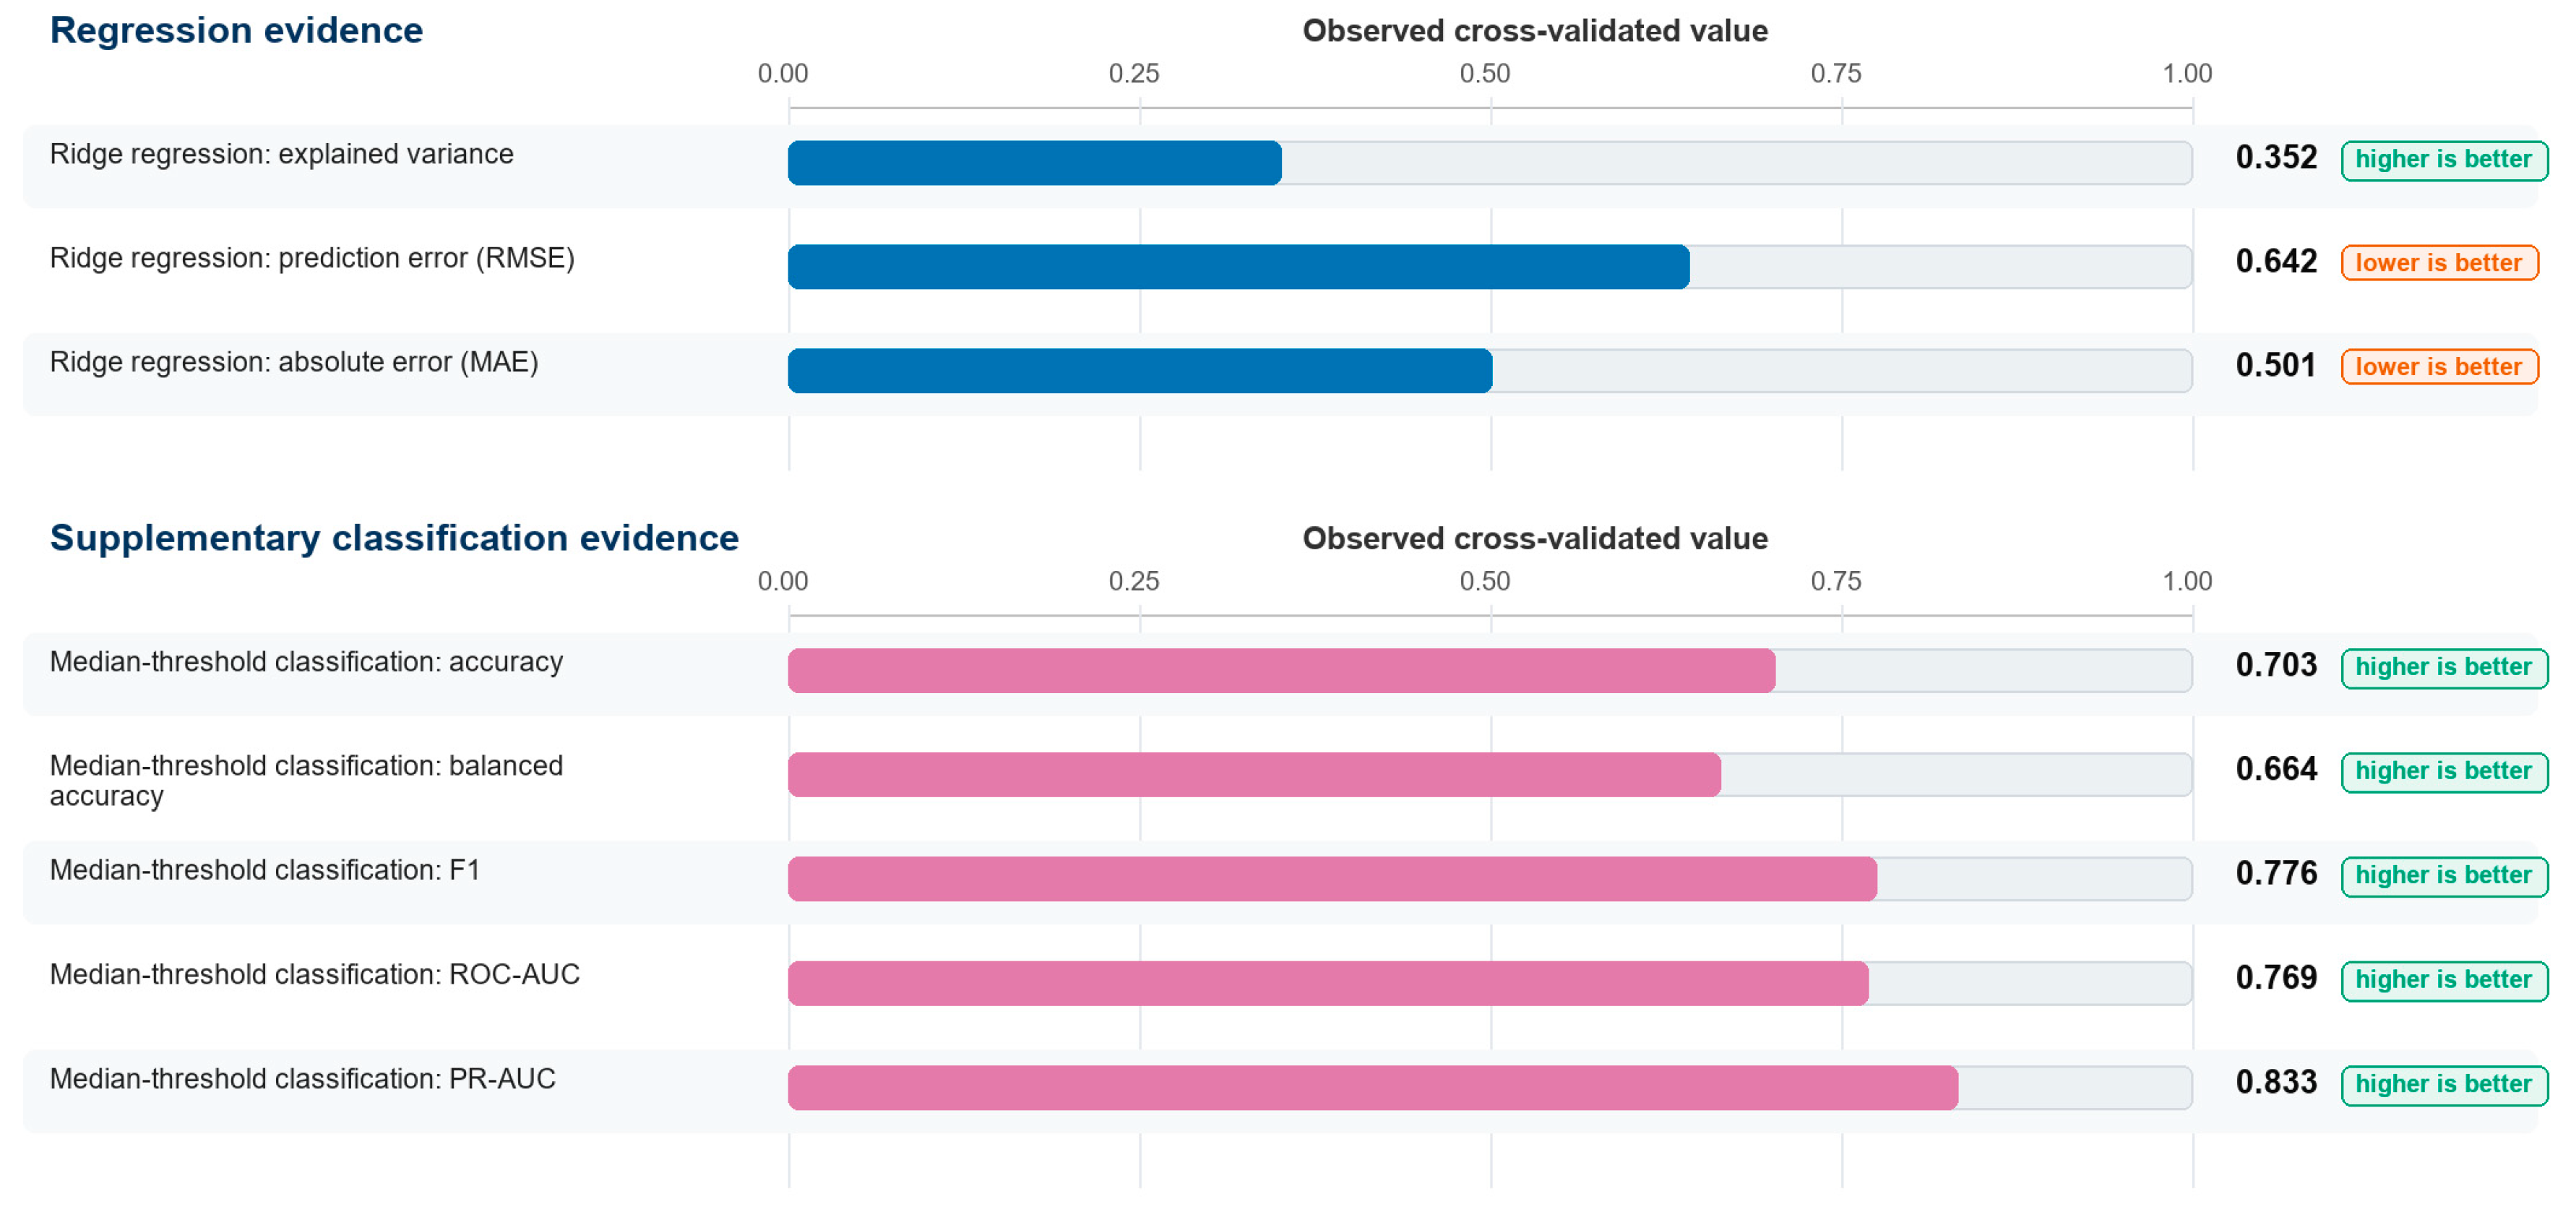
Figure 4 provides a compact visual summary of the cross-validated machine learning performance metrics.
Classification is supplementary exploratory evidence. Figure 4 shows that predictive performance is most informative when interpreted against explicit baselines and leakage controls rather than as evidence of causal effects.

5. Discussion

The results support the psychometric adequacy of the Trust-Tech Nexus constructs in this dataset. Reliability, convergent validity, WLSMV CFA fit, discriminant validity, and common-method screening all met accepted thresholds. This matters because predictive modelling should not be applied to poorly defined constructs. Establishing measurement adequacy first strengthens the interpretation of the subsequent predictive results.
Institutional Trust was positively associated with AI Adoption, supporting the view that stakeholders evaluate AI-enabled marketing partly through the credibility and governance of the institution deploying the tools. This interpretation is consistent with recent higher-education evidence showing that trust remains a differentiating factor across students, teachers, and researchers using generative AI tools, and that adoption among students and lecturers is shaped by whether AI is perceived as dependable and institutionally supported [14,45,46]. Emotional Engagement was a strong positive predictor, reinforcing the idea that adoption is shaped by perceived relevance and affective connection as well as by instrumental judgments. Recent work on AI-mediated persuasion and digital marketing likewise suggests that trust transfer, mediated credibility, and emotionally resonant AI communication can strengthen user responsiveness to AI-supported interactions [47,48]. AI Skepticism was negatively associated with adoption, consistent with technology-resistance perspectives [35,36], but the modest simple correlation suggests that caution may coexist with pragmatic use when stakeholders still perceive AI tools as useful for information access and decision support; this interpretation also aligns with recent comparative and dual-perspective higher-education studies [45,46]. The machine learning component serves as a cross-validated robustness check rather than as a replacement for theory-driven modelling. In the present study, the predictive analysis complements the psychometric and CFA results by showing that the validated constructs retain moderate out-of-sample association with AI Adoption. The exploratory classification findings may be useful for segmentation logic, but they remain secondary because both binary targets were derived from the same AI Adoption composite. Because these associations were estimated at the pooled institution level, they characterise the stakeholder population as a whole and should not be read as implying that students, faculty, and administrative staff experience AI-enabled academic marketing in the same way; subgroup-specific analysis therefore remains an important direction for future research.

5.1. Theoretical Contributions

From a theoretical perspective, the study advances the literature by integrating institutional trust, emotional engagement, and skepticism within a bounded AI-supported academic-marketing framework rather than presenting a generic adoption model. From a methodological perspective, it combines ordered-indicator CFA with leakage-controlled cross-validated prediction while clearly separating measurement validity, predictive evidence, and causal interpretation.

5.2. Practical Implications

These findings indicate that AI-supported academic marketing in higher education should be treated as a trust-building and decision-support service rather than as an efficiency tool alone. Transparent communication about the role of AI, clear explanation of how recommendations are generated, user control over AI-enabled interactions, and a clear escalation path from automated support to a human adviser may help reduce skepticism while preserving critical awareness of AI use. This emphasis on trust-building and transparent governance is also consistent with recent research on AI adoption in digital-marketing and consumer-technology settings, where credibility cues, cybersecurity awareness, and trust-transfer mechanisms shape willingness to engage with AI-enabled systems [47,48,49]. Universities should tell stakeholders when they are interacting with AI-enabled systems, clarify the goals and limits of AI-assisted recommendations, provide fallback options for human interaction, and monitor stakeholder skepticism as a potential indicator of governance concerns rather than treating it simply as resistance.

6. Reproducibility and Analytical Safeguards

Each stage of the analysis followed a conservative validation sequence, as follows: first measurement validity, then construct scoring, and only then predictive modelling. Q1–Q3 were excluded from the predictor set when estimating AI Adoption in order to prevent target leakage. Classification remained exploratory rather than central to the study’s theoretical argument. The single-institution cross-sectional design was treated as a boundary on generalisation rather than as an opportunity for causal inference. The findings therefore establish measurement adequacy, associative structure, and cross-validated predictive evidence, but they do not establish temporal order or causal mechanisms.

7. Limitations and Future Research

This study has several limitations. First, it examines data from a single higher-education institution in India, so the findings require validation across multiple institutions, stakeholder populations, and geographic settings. Second, the design is cross-sectional, which prevents conclusions about temporal ordering or causal mechanisms. Third, although groupwise composite differences were limited in the present sample, the pooled design still combines stakeholder groups that may have different experiences of AI-enabled academic marketing; subgroup-specific analyses and formal invariance testing therefore remain important directions for future research. Fourth, the classification targets were derived from the AI Adoption composite and should be regarded as exploratory rather than definitive. Future studies should validate the Trust-Tech Nexus framework using separate samples, longitudinal designs, and objective behavioural measures where possible. In particular, future work should test the framework across multiple universities, compare public and private institutions, incorporate actual AI usage logs alongside self-reported measures, and examine whether institutional trust and AI skepticism operate differently among students, faculty, and administrative staff.

8. Conclusions

The present study examined the Trust-Tech Nexus model of AI Adoption in academic marketing using psychometric validation, WLSMV CFA, and cross-validated predictive modelling. The four-construct measurement structure demonstrated acceptable reliability, convergent validity, discriminant validity, and strong practical CFA fit for the ordered Likert indicators. Within this validated framework, AI Adoption was positively associated with Emotional Engagement and Institutional Trust and negatively associated with AI Skepticism. The results further indicate that these constructs retain moderate out-of-sample association with AI Adoption within one institutional setting. Overall, the study provides a defensible measurement framework for examining AI adoption in academic marketing while keeping interpretation appropriately bounded to associative and predictive evidence rather than broad causal claims. Future research should extend this framework across multiple institutions, stakeholder groups, and longitudinal settings to assess wider generalisability and temporal robustness.

Author Contributions

Conceptualization, P.D. and G.W.; methodology, P.D.; validation, P.D., G.W. and R.K.; formal analysis, P.D.; investigation, P.D.; resources, G.W. and R.K.; data curation, P.D.; writing—original draft preparation, P.D.; writing—review and editing, G.W. and R.K.; visualization, P.D.; supervision, G.W. and R.K.; project administration, P.D. All authors have read and agreed to the published version of the manuscript.

Funding

This research received no external funding.

Institutional Review Board Statement

The study was conducted in accordance with the Declaration of Helsinki and was reviewed and approved by the Research Ethics Committee (REC) of MIT Art, Design & Technology University, Pune, India (approval number: MITADTU/REC/007/2023; date of approval: 1 December 2023).

Informed Consent Statement

Informed consent was obtained from all participants involved in the study. Survey participation used anonymised respondent coding, and the dataset used for analysis did not contain personally identifying information.

Data Availability Statement

The dataset and analysis materials are available from the authors on reasonable request, subject to institutional ethics and privacy requirements.

Acknowledgments

The authors acknowledge MIT Art, Design & Technology University, Pune, for institutional support during the study. During preparation of this manuscript, AI-assisted editorial support was used for language refinement and structural checking only; the authors reviewed and edited the output and take full responsibility for the content of the publication.

Conflicts of Interest

The authors declare no conflicts of interest.

References

  1. Davis, F.D. Perceived usefulness, perceived ease of use, and user acceptance of information technology. MIS Q. 1989, 13, 319–340. [Google Scholar] [CrossRef] [Scilit] [PubMed]
  2. Venkatesh, V.; Morris, M.G.; Davis, G.B.; Davis, F.D. User acceptance of information technology: Toward a unified view. MIS Q. 2003, 27, 425–478. [Google Scholar] [CrossRef] [Scilit]
  3. Venkatesh, V.; Thong, J.Y.L.; Xu, X. Consumer acceptance and use of information technology: Extending the unified theory of acceptance and use of technology. MIS Q. 2012, 36, 157–178. [Google Scholar] [CrossRef] [Scilit]
  4. Morgan, R.M.; Hunt, S.D. The commitment-trust theory of relationship marketing. J. Mark. 1994, 58, 20–38. [Google Scholar] [CrossRef] [Scilit]
  5. Mayer, R.C.; Davis, J.H.; Schoorman, F.D. An integrative model of organizational trust. Acad. Manag. Rev. 1995, 20, 709–734. [Google Scholar] [CrossRef] [Scilit]
  6. Pavlou, P.A. Consumer acceptance of electronic commerce: Integrating trust and risk with the Technology Acceptance Model. Int. J. Electron. Commer. 2003, 7, 101–134. [Google Scholar] [CrossRef] [Scilit]
  7. Gefen, D.; Karahanna, E.; Straub, D.W. Trust and TAM in online shopping: An integrated model. MIS Q. 2003, 27, 51–90. [Google Scholar] [CrossRef] [Scilit]
  8. Zawacki-Richter, O.; Marín, V.I.; Bond, M.; Gouverneur, F. Systematic review of research on artificial intelligence applications in higher education: Where are the educators? Int. J. Educ. Technol. High. Educ. 2019, 16, 39. [Google Scholar] [CrossRef] [Scilit]
  9. Popenici, S.A.D.; Kerr, S. Exploring the impact of artificial intelligence on teaching and learning in higher education. Res. Pract. Technol. Enhanc. Learn. 2017, 12, 22. [Google Scholar] [CrossRef] [Scilit] [PubMed]
  10. Khosravi, H.; Shum, S.B.; Chen, G.; Conati, C.; Tsai, Y.-S.; Kay, J.; Knight, S.; Martinez-Maldonado, R.; Sadiq, S.; Gašević, D. Explainable artificial intelligence in education. Comput. Educ. Artif. Intell. 2022, 3, 100074. [Google Scholar] [CrossRef] [Scilit]
  11. Ouyang, F.; Jiao, P. Artificial intelligence in education: The three paradigms. Comput. Educ. Artif. Intell. 2021, 2, 100020. [Google Scholar] [CrossRef] [Scilit]
  12. Kasneci, E.; Sessler, K.; Küchemann, S.; Bannert, M.; Dementieva, D.; Fischer, F.; Gasser, U.; Groh, G.; Günnemann, S.; Hüllermeier, E.; et al. ChatGPT for good? On opportunities and challenges of large language models for education. Learn. Individ. Differ. 2023, 103, 102274. [Google Scholar] [CrossRef] [Scilit]
  13. Labadze, L.; Grigolia, M.; Machaidze, L. Role of AI chatbots in education: Systematic literature review. Int. J. Educ. Technol. High. Educ. 2023, 20, 56. [Google Scholar] [CrossRef] [Scilit]
  14. Shahzad, M.F.; Xu, S.; Javed, I. ChatGPT awareness, acceptance, and adoption in higher education: The role of trust as a cornerstone. Int. J. Educ. Technol. High Educ. 2024, 21, 46. [Google Scholar] [CrossRef] [Scilit]
  15. Castillo-Martínez, I.M.; Flores-Bueno, D.; Gómez-Puente, S.M.; Vite-León, V.O. AI in higher education: A systematic literature review. Front. Educ. 2024, 9, 1391485. [Google Scholar] [CrossRef] [Scilit]
  16. McGrath, C.; Farazouli, A.; Cerratto-Pargman, T. Generative AI chatbots in higher education: A review of an emerging research area. High Educ. 2025, 89, 1533–1549. [Google Scholar] [CrossRef] [Scilit]
  17. Jensen, L.X.; Buhl, A.; Sharma, A.; Bearman, M. Generative AI and higher education: A review of claims from the first months of ChatGPT. High. Educ. 2025, 89, 1145–1161. [Google Scholar] [CrossRef] [Scilit]
  18. Mustafa, M.Y.; Tlili, A.; Lampropoulos, G. A systematic review of literature reviews on artificial intelligence in education (AIED): A roadmap to a future research agenda. Smart Learn. Environ. 2024, 11, 59. [Google Scholar] [CrossRef] [Scilit]
  19. Lambebo, E.A.; Chen, H.L. Chatbots in higher education: A systematic review. Interact. Learn. Environ. 2024, 33, 2781–2807. [Google Scholar] [CrossRef] [Scilit]
  20. Almasri, F. Exploring the impact of artificial intelligence in teaching and learning of science: A systematic review of empirical research. Res. Sci. Educ. 2024, 54, 977–997. [Google Scholar] [CrossRef] [Scilit]
  21. Farrow, R. The possibilities and limits of explicable artificial intelligence (XAI) in education: A socio-technical perspective. Learn. Media Technol. 2023, 48, 266–279. [Google Scholar] [CrossRef] [Scilit]
  22. Zhu, H.; Sun, Y.; Yang, J. Towards responsible artificial intelligence in education: A systematic review on identifying and mitigating ethical risks. Humanit. Soc. Sci. Commun. 2025, 12, 1111. [Google Scholar] [CrossRef] [Scilit]
  23. Qian, Y. Pedagogical applications of generative AI in higher education: A systematic review of the field. TechTrends 2025, 69, 1105–1120. [Google Scholar] [CrossRef] [Scilit]
  24. Ma, M.; Ng, D.T.K.; Liu, Z.; Wong, G.K.W. Fostering responsible AI literacy: A systematic review of K-12 AI ethics education. Comput. Educ. Artif. Intell. 2025, 8, 100422. [Google Scholar] [CrossRef] [Scilit]
  25. Sova, R.; Tudor, C.; Tartavulea, C.V.; Dieaconescu, R.I. Artificial intelligence tool adoption in higher education: A structural equation modeling approach to understanding impact factors among economics students. Electronics 2024, 13, 3632. [Google Scholar] [CrossRef] [Scilit]
  26. Xue, L.; Mahat, J.; Ghazali, N. Technology Acceptance Model in artificial intelligence in education: A meta-analysis. SAGE Open 2026, 16, 21582440251409441. [Google Scholar] [CrossRef] [Scilit]
  27. Breiman, L. Random forests. Mach. Learn. 2001, 45, 5–32. [Google Scholar] [CrossRef] [Scilit]
  28. Friedman, J.H. Greedy function approximation: A gradient boosting machine. Ann. Stat. 2001, 29, 1189–1232. [Google Scholar] [CrossRef] [Scilit]
  29. Cortes, C.; Vapnik, V. Support-vector networks. Mach. Learn. 1995, 20, 273–297. [Google Scholar] [CrossRef] [Scilit]
  30. Tibshirani, R. Regression shrinkage and selection via the lasso. J. R. Stat. Soc. Ser. B Stat. Methodol. 1996, 58, 267–288. [Google Scholar] [CrossRef] [Scilit]
  31. Shmueli, G. To explain or to predict? Stat. Sci. 2010, 25, 289–310. [Google Scholar] [CrossRef] [Scilit]
  32. ForouzeshNejad, A.A.; Arabikhan, F.; Gegov, A.; Jafari, R.; Ichtev, A. Data-Driven Predictive Modelling of Agile Projects Using Explainable Artificial Intelligence. Electronics 2025, 14, 2609. [Google Scholar] [CrossRef] [Scilit]
  33. Schwarz, N.; Clore, G.L. Mood, misattribution, and judgments of well-being: Informative and directive functions of affective states. J. Pers. Soc. Psychol. 1983, 45, 513–523. [Google Scholar] [CrossRef]
  34. Lerner, J.S.; Li, Y.; Valdesolo, P.; Kassam, K.S. Emotion and decision making. Annu. Rev. Psychol. 2015, 66, 799–823. [Google Scholar] [CrossRef] [Scilit] [PubMed]
  35. Mick, D.G.; Fournier, S. Paradoxes of technology: Consumer cognizance, emotions, and coping strategies. J. Consum. Res. 1998, 25, 123–143. [Google Scholar] [CrossRef] [Scilit]
  36. Parasuraman, A. Technology Readiness Index (TRI): A multiple-item scale to measure readiness to embrace new technologies. J. Serv. Res. 2000, 2, 307–320. [Google Scholar] [CrossRef] [Scilit]
  37. Glikson, E.; Woolley, A.W. Human trust in artificial intelligence: Review of empirical research. Acad. Manag. Ann. 2020, 14, 627–660. [Google Scholar] [CrossRef] [Scilit]
  38. Kizilcec, R.F. How much information? Effects of transparency on trust in an algorithmic interface. In Proceedings of the 2016 CHI Conference on Human Factors in Computing Systems, San Jose, CA, USA, 7–12 May 2016; ACM: New York, NY, USA, 2016; pp. 2390–2395. [Google Scholar] [CrossRef] [Scilit]
  39. Fornell, C.; Larcker, D.F. Evaluating structural equation models with unobservable variables and measurement error. J. Mark. Res. 1981, 18, 39–50. [Google Scholar] [CrossRef] [Scilit]
  40. Henseler, J.; Ringle, C.M.; Sarstedt, M. A new criterion for assessing discriminant validity in variance-based structural equation modeling. J. Acad. Mark. Sci. 2015, 43, 115–135. [Google Scholar] [CrossRef] [Scilit]
  41. Podsakoff, P.M.; MacKenzie, S.B.; Lee, J.Y.; Podsakoff, N.P. Common method biases in behavioral research: A critical review of the literature and recommended remedies. J. Appl. Psychol. 2003, 88, 879–903. [Google Scholar] [CrossRef] [Scilit] [PubMed]
  42. Flora, D.B.; Curran, P.J. An empirical evaluation of alternative methods of estimation for confirmatory factor analysis with ordinal data. Psychol. Methods 2004, 9, 466–491. [Google Scholar] [CrossRef] [Scilit] [PubMed]
  43. Rosseel, Y. lavaan: An R package for structural equation modeling. J. Stat. Softw. 2012, 48, 1–36. [Google Scholar] [CrossRef] [Scilit]
  44. Hu, L.; Bentler, P.M. Cutoff criteria for fit indexes in covariance structure analysis: Conventional criteria versus new alternatives. Struct. Equ. Model. 1999, 6, 1–55. [Google Scholar] [CrossRef] [Scilit]
  45. Đerić, E.; Frank, D.; Milković, M. Trust in generative AI tools: A comparative study of higher education students, teachers, and researchers. Information 2025, 16, 622. [Google Scholar] [CrossRef] [Scilit]
  46. Bamasoud, D.M.; Mohammad, R.; Bilal, S. Adopting generative AI in higher education: A dual-perspective study of students and lecturers in Saudi universities. Big Data Cogn. Comput. 2025, 9, 264. [Google Scholar] [CrossRef] [Scilit]
  47. Aljumah, A.I.; Nuseir, M.; El Refae, G. Employee behavior in sustainable digital marketing: The role of AI technologies in the UAE. Adm. Sci. 2025, 15, 491. [Google Scholar] [CrossRef] [Scilit]
  48. Keng, C.-J.; Bao, H.-P.; Lin, C.-H. The persuasive power of AI avatars through trust transfer and the elaboration likelihood model. J. Theor. Appl. Electron. Commer. Res. 2025, 20, 342. [Google Scholar] [CrossRef] [Scilit]
  49. Alshammari, M.M.; Al-Mamary, Y.H. Building trust and cybersecurity awareness in Saudi Arabia: Key drivers of AI-powered smart home device adoption. Systems 2025, 13, 863. [Google Scholar] [CrossRef] [Scilit]
Figure 1. Trust-Tech Nexus conceptual framework for AI-enabled academic marketing in higher education.
Informatics 13 00097 g001
Figure 2. End-to-end analysis pipeline from raw Excel data to cross-validated machine learning models.
Informatics 13 00097 g002
Figure 3. WLSMV CFA measurement model with standardized factor loadings.
Informatics 13 00097 g003
Figure 4. Cross-validated predictive-performance summary.
Informatics 13 00097 g004
Table 1. Respondent profile summary (N = 300).
VariableMost Frequent Categories
RoleUG Student: 114; PG Student: 55; Faculty: 52; Administrative Staff: 32; Other/Not specified: 47
GenderMale: 168; Female: 127; Prefer not to say: 5
AI experienceModerate: 119; Extensive: 91; Limited: 64; Other/Not specified: 26
InstitutionMIT Art, Design and Technology University, Pune, India
Table 2. Descriptive statistics for construct composites by stakeholder group.
ConstructStudents MeanStudents SDFaculty MeanFaculty SDAdministrative Staff MeanAdministrative Staff SD
AI Adoption3.0710.7993.0450.7563.0940.710
Institutional Trust3.2050.7753.1670.8073.0310.818
Emotional Engagement2.9700.7913.0000.8032.9580.722
AI Skepticism2.7380.8292.7760.7132.6670.859
Table 3. Trust-Tech Nexus measurement instrument and item wording.
ConstructCodeVariableExact Item Wording
AI AdoptionQ1_PAPersonalised AdsAI-personalised advertisements help me make better academic programme decisions.
AI AdoptionQ2_CRChatbot ResponsesAI chatbot responses are useful in assisting my academic marketing interactions.
AI AdoptionQ3_PRPredictive RecommendationsAI predictive recommendations meaningfully improve my academic decision-making confidence.
Institutional TrustQ4_TAITrust in AI ToolsI trust the AI tools deployed by MIT ADT University for academic marketing purposes.
Institutional TrustQ5_TUTrust in UniversityI trust MIT ADT University to deploy AI technologies in an ethical and responsible manner.
Institutional TrustQ6_PUPerception of UniversityMIT ADT University has a positive and credible reputation in its approach to AI technologies.
Emotional EngagementQ7_EEEmotional EngagementAI-driven marketing interactions at MIT ADT engage me emotionally in a positive way.
Emotional EngagementQ8_EREmotional ResponseI experience a positive emotional response when engaging with AI-mediated academic content from MIT ADT.
Emotional EngagementQ9_ACAAffective Connection to AII feel a meaningful affective connection when interacting with AI-powered marketing tools at MIT ADT.
AI SkepticismQ10_SAISkepticism Toward AII am skeptical about the accuracy and reliability of AI claims in academic marketing at MIT ADT.
AI SkepticismQ11_DMCDecision-Making ConfidenceAI systems reduce my confidence in making independent and informed academic decisions.
AI SkepticismQ12_AUCAI Uncertainty ConcernI have significant concerns about the uncertainty and unpredictability of AI in higher education at MIT ADT.
(All items used a five-point Likert scale from 1 = Strongly Disagree to 5 = Strongly Agree).
Table 4. Construct-feature alignment.
ConstructObserved ItemsRole in Models
AI AdoptionQ1_PA, Q2_CR, Q3_PRPrimary regression target; source of exploratory binary targets
Institutional TrustQ4_TAI, Q5_TU, Q6_PUPredictor
Emotional EngagementQ7_EE, Q8_ER, Q9_ACAPredictor
AI SkepticismQ10_SAI, Q11_DMC, Q12_AUCPredictor
Table 5. Descriptive statistics for construct composites.
ConstructMeanSDMinMax
AI Adoption3.0600.7991.0005.000
Institutional Trust3.1710.7871.0005.000
Emotional Engagement2.9790.7871.0005.000
AI Skepticism2.7430.8001.0004.667
Table 6. Reliability and convergent-validity summary.
ConstructAlphaCRAVEMin CITC
AI Adoption0.8010.8830.7160.632
Institutional Trust0.8060.8860.7210.651
Emotional Engagement0.8000.8830.7150.615
AI Skepticism0.7810.8730.6960.609
Table 7. Confirmatory factor analysis fit and validity diagnostics.
DiagnosticObserved ValueRecommended Threshold
/Interpretation
Conclusion
Scaled chi-square70.977Lower values preferred; sensitive to NAcceptable with strong practical fit
df48Model degrees of freedomIdentified model
p-value0.017May be significant with N = 300Interpreted with practical fit indices
CFI0.991>0.95Excellent fit
TLI0.988>0.95Excellent fit
RMSEA0.040<0.06Good fit
SRMR0.039<0.08Good fit
Table 8. Standardized WLSMV CFA loadings for the Trust-Tech Nexus measurement model.
ConstructItemStandardized LoadingSEz-Valuep-Value
AI AdoptionQ1_PA0.8350.2097.267<0.001
AI AdoptionQ2_CR0.7950.1578.353<0.001
AI AdoptionQ3_PR0.7590.1299.034<0.001
Institutional TrustQ4_TAI0.8250.1967.465<0.001
Institutional TrustQ5_TU0.8130.1867.523<0.001
Institutional TrustQ6_PU0.7720.148.689<0.001
Emotional EngagementQ7_EE0.8210.1917.534<0.001
Emotional EngagementQ8_ER0.7870.1627.86<0.001
Emotional EngagementQ9_ACA0.8010.1648.143<0.001
AI SkepticismQ10_SAI0.8220.2166.691<0.001
AI SkepticismQ11_DMC0.7630.1617.361<0.001
AI SkepticismQ12_AUC0.7450.1537.313<0.001
Note: All standardized factor loadings were statistically significant at p < 0.001.
Table 9. Latent factor correlations and Fornell–Larcker discriminant-validity summary.
ConstructAI AdoptionInstitutional TrustEmotional EngagementAI Skepticism
AI Adoption0.7970.5350.663−0.562
Institutional Trust0.5350.8040.544−0.500
Emotional Engagement0.6630.5440.803−0.522
AI Skepticism−0.562−0.500−0.5220.777
Note: Diagonal values are the square roots of AVE. Discriminant validity is supported when each diagonal value exceeds the corresponding inter-construct correlations. HTMT results were also examined as an additional discriminant-validity diagnostic.
Table 10. HTMT discriminant-validity matrix.
ConstructAI AdoptionInstitutional TrustEmotional EngagementAI Skepticism
AI Adoption-0.5280.6620.551
Institutional Trust0.528-0.5390.490
Emotional Engagement0.6620.539-0.519
AI Skepticism0.5510.4900.519-
Table 11. Cross-validated predictive performance.
Analysis TypeModel/TargetMetricObserved ValueBaseline/ComparatorInterpretation
RegressionRidge regressionCV R-squared0.3520 = mean baselinePositive out-of-sample signal
RegressionRidge regressionCV RMSE0.642Mean baseline RMSE = 0.797Better than baseline
RegressionRidge regressionCV MAE0.501Mean baseline MAE = 0.633Better than baseline
ClassificationMedian adoption targetAccuracy0.703Majority baseline = 0.617Moderate improvement
ClassificationMedian adoption targetBalanced accuracy0.6640.500 random baselineModerate discrimination
ClassificationMedian adoption targetF10.776Positive-class prevalence comparatorUseful segmentation signal
ClassificationMedian adoption targetROC-AUC0.7690.500 random baselineAcceptable discrimination
ClassificationMedian adoption targetPR-AUC0.833Positive prevalence = 0.617Useful segmentation signal
Table 12. Standardized predictive contributions and interpretation summary.
PredictorStandardized Ridge CoefficientDirectionRelative Importance Summary
Emotional Engagement0.288PositiveStrongest predictive contribution
Institutional Trust0.146PositiveSmaller positive contribution
AI Skepticism−0.172NegativeNegative predictive contribution
Note: Coefficients are based on the standardized ridge regression summary from the construct-only predictive model. Values are interpreted as moderate predictive associations under cross-validation rather than as causal effects.
Disclaimer/Publisher’s Note: The statements, opinions and data contained in all publications are solely those of the individual author(s) and contributor(s) and not of MDPI and/or the editor(s). MDPI and/or the editor(s) disclaim responsibility for any injury to people or property resulting from any ideas, methods, instructions or products referred to in the content.