


Abstract
Background: Childhood asthma (CA) is a heterogeneous inflammatory airway disease in which immune dysregulation and epithelial microenvironment remodeling play central roles. However, ligand–receptor-associated genes that mediate cell–cell communication in CA remain unclear. This study aimed to identify ligand–receptor-associated candidate molecular correlates and explore their potential biological associations with CA. Methods: Single-cell RNA sequencing (scRNA-seq) data were analyzed to annotate cell types and infer intercellular communication, from which ligand–receptor-associated genes were identified. Integrated bioinformatics and machine-learning approaches were then applied to screen and validate ligand–receptor-related candidate molecular correlates. Functional enrichment analysis, immune microenvironment assessment, and drug/compound prediction combined with molecular docking were conducted to explore the biological significance of these candidate molecular correlates. Finally, cell types were prioritized based on the expression patterns of the candidate molecular correlates, followed by exploratory pseudotime trajectory analysis of the prioritized cell type. Results: Eleven major cell types and 67 ligand–receptor-related genes were identified. Subsequently, C3, HLA-DMB, HLA-DPB1, and HLA-DQA1 were selected as robust candidate molecular correlates. These genes were primarily enriched in immune-related pathways, including antigen processing and presentation, cytokine–cytokine receptor interactions, and NK cell-mediated cytotoxicity. After multiple-testing correction, activated B-cell and type 2 T-helper-cell signatures showed lower relative enrichment in CA and were positively associated with the four candidate molecular correlates. Moreover, exploratory molecular docking suggested theoretical structural compatibility for selected compound–protein pairs. The scRNA-seq analysis further prioritized dendritic cells for exploratory analysis; along the inferred pseudotime trajectory, C3 expression progressively decreased, whereas MHC class II genes increased. Conclusions: This exploratory integrative analysis characterized inferred communication patterns in CA samples, identified four candidate molecular correlates, and generated hypotheses regarding their immune-related associations and prioritized cellular context, providing a basis for future validation.
1. Introduction
Childhood asthma (CA) is a heterogeneous chronic inflammatory airway disease characterized by recurrent wheeze, dyspnea, chest tightness, cough, variable airflow limitation, and bronchial hyperresponsiveness. Because it arises during a critical period of lung growth and immune maturation, CA may exert long-term adverse effects on respiratory health extending into adulthood [1,2]. Globally, CA remains among the most common chronic diseases in children, with substantial geographic variation and an increasing projected burden through 2050 [3,4,5]. Although guideline-based therapy centered on inhaled corticosteroids and, in selected severe cases, biologics targeting type 2 inflammation has improved disease control, a subset of children still experience persistent symptoms and recurrent exacerbations, highlighting substantial heterogeneity in disease mechanisms and treatment response [6,7]. Therefore, there is an urgent need to identify biomarkers that better capture airway microenvironmental alterations and support precision diagnosis and targeted management of CA [8,9,10].
Against this background of unmet clinical need, elucidating dysregulated cell–cell communication within the airway microenvironment is particularly important in childhood asthma. The asthmatic airway microenvironment represents a highly dynamic ecosystem composed of epithelial, mesenchymal, and immune cell populations that engage in extensive intercellular crosstalk [11]. Within this microenvironment, ligand–receptor (L-R) interactions serve as the molecular cornerstone mediating cell–cell communication (CCC) [12] and are critically involved in immune-cell recruitment, inflammatory amplification, antigen presentation, and tissue remodeling [13,14].
Traditional bulk transcriptomic technologies are insufficient to dissect the highly heterogeneous cell subsets and their intercellular interactions within tissues. Recent exponential advances in single-cell RNA sequencing (scRNA-seq) technologies have delivered revolutionary tools to decode the airway microenvironment at single-cell resolution. By dissecting ligand and receptor expression profiles across distinct cell types at single-cell resolution, scRNA-seq enables inference of potential intercellular interaction networks, and represents a core technical approach for reconstructing cell communication atlases between immune cells and structural cells in complex tissues such as the airway [15,16]. For example, scRNA-seq studies based on the Human Lung Cell Atlas and airway samples from patients with asthma have not only successfully identified pathogenic effector type 2 helper (Th2) cell subsets driving airway remodeling and metaplastic epithelial cell states expressing specific mucus components, but also revealed a significant enhancement of the communication network between airway structural cells and immune cells during asthma exacerbations [17]. However, despite substantial progress achieved by scRNA-seq in adult severe asthma and preclinical basic research, systematic analyses of ligand–receptor communication networks specifically focused on childhood asthma (CA) remain scarce. The unique immune system developmental trajectories and airway microenvironment remodeling patterns during childhood indicate that the cell communication network of CA may harbor distinct biological features [18]. Existing studies leveraging scRNA-seq have uncovered multiple novel cell subsets and potential signaling axes in asthma. For instance, in patients with severe eosinophilic asthma, one study reported that treatment with anti-T2 inflammatory biologics significantly remodeled the transcriptional profiles of circulating immune cells including monocytes, T/NK cells and B cells, and modulated key signaling pathways such as NF-κB, offering novel insights into the regulatory mechanisms of T2 inflammation and biomarkers for treatment response [19]. Furthermore, a study comparing single-cell characteristics between house dust mite (HDM)-sensitized and non-sensitized CA patients revealed differences in immune cell composition and molecular signatures between the two groups, and identified cell–cell interaction pathways that potentially drive the divergence of disease phenotypes [20]. Therefore, systematic reconstruction of ligand–receptor signaling axes in the CA airway microenvironment using scRNA-seq not only fills the critical research gap in this field, but also provides a solid foundation for identifying key communication hubs driving CA pathological progression and novel therapeutic intervention targets.
In transcriptomic studies investigating complex heterogeneous diseases, scRNA-seq and bulk RNA-seq each possess distinct, irreplaceable technical strengths as well as inherent technical limitations. The strength of scRNA-seq lies in its unparalleled resolution, which enables accurate delineation of the composition and proportional abundance of cell populations within tissues, identification of rare cell subsets, and inference of complex intercellular communication trajectories. However, constrained by high costs and stringent sample processing requirements, scRNA-seq studies are often limited by small sample sizes, making it difficult to generate population-representative data with robust statistical power, and posing inherent challenges for long-term clinical prognosis follow-up [21,22]. Conversely, bulk RNA-seq has been widely deployed in large-scale clinical cohort studies, enabling generation of global gene expression data across hundreds to thousands of patient samples. It not only possesses exceptional statistical robustness to reliably capture core transcriptomic alterations under disease states, but is also routinely integrated with comprehensive patient clinical phenotypes, disease severity stratification and longitudinal follow-up data, thus conferring extremely high clinical translational value [23,24]. Consequently, deep integration of the high-resolution microscopic perspective provided by scRNA-seq and the large-sample macroscopic statistical power of bulk RNA-seq has become an effective practical paradigm for target prediction in current precision medicine. Leveraging this multi-dimensional integration strategy, candidate cell communication molecules identified at the single-cell level can be projected onto large-sample cohorts for rigorous cross-validation and dimensionality reduction-based screening, effectively overcoming the limitations of individual technologies and substantially improving both the biological plausibility of the identified biomarkers and their clinical diagnostic utility.
In this study, we conducted an exploratory integration of publicly available scRNA-seq and bulk transcriptomic datasets to characterize ligand–receptor-associated expression and communication patterns and to generate hypotheses regarding their potential associations with CA. Specifically, we first characterized the compositional features of airway epithelial and immune cells at single-cell resolution, and infer the underlying intercellular communication networks. Subsequently, we integrate differential expression results from bulk RNA-seq to screen for candidate cell communication-associated molecules, followed by further candidate molecular correlate identification using a panel of machine learning-based bioinformatics approaches. Meanwhile, we adopt a multi-dimensional analytical pipeline including functional enrichment analysis, immune infiltration assessment, upstream regulatory network construction, potential drug-compound prediction and molecular docking to evaluate the immunological associations of these communication-related molecules and their potential therapeutic intervention value. Collectively, this study extends the characterization of CA-related immunopathology from the perspective of cell–molecular interactions, provides additional insights into communication-associated molecular features linked to disease heterogeneity, and offers a basis for further evaluation of their relevance to patient stratification, diagnostic assessment in CA.
2. Materials and Methods
2.1. Data Acquisition
In this study, childhood asthma (CA)-associated datasets, namely GSE254127 (platform: GPL24676), GSE65204 (platform: GPL14550), and GSE152004 (platform: GPL11154), were obtained from the Gene Expression Omnibus (GEO) database (https://www.ncbi.nlm.nih.gov/geo/, accessed on 20 August 2025). The single-cell RNA sequencing (scRNA-seq) dataset GSE254127 comprised two samples of airway mucosal tissue from CA patients. The GSE65204 dataset, utilized as the training set, included 36 nasal epithelial tissue samples from CA patients and 33 control nasal epithelial tissue samples. Meanwhile, the GSE152004 dataset, serving as the validation set, contained 441 nasal airway epithelial tissue samples from CA patients and 254 control nasal airway epithelial tissue samples. Notably, the scRNA-seq dataset was derived from airway mucosal tissue, whereas both bulk transcriptomic cohorts were derived from nasal epithelial samples and were generated using different transcriptomic platforms. Therefore, cross-tissue and cross-platform consistency of the ligand–receptor-associated gene set was assessed before its integration with the bulk transcriptomic datasets. The baseline features of the two bulk transcriptomic cohorts are summarized in Table S1. These datasets were subsequently integrated according to the predefined analytical workflow, with tissue source and platform differences considered in the interpretation of cross-dataset findings.
2.2. Processing of scRNA-Seq Data
The GSE254127 dataset was initially subjected to standardized quality control (QC) processing using the “Seurat” package (v 5.1.0) [25] to select high-quality cells and genes. Specifically, cells were filtered out if they had fewer than 200 or more than 4000 detected genes (nFeature_RNA), a total RNA count per cell (nCount_RNA) exceeding 20,000, or a mitochondrial gene expression proportion (percent.mt) greater than 30%. Additionally, genes detected in fewer than three cells were excluded. The “LogNormalize” and “NormalizeData” functions were employed to normalize the data. To reduce the influence of technical noise and emphasize biological variations, the Seurat package (v 5.0.1) was utilized, specifically its “FindVariableFeatures” function, to identify the top 2000 highly variable genes (HVGs) through the variance-stabilizing transformation (vst) approach. Subsequently, the “LabelPoints” function was applied to mark the 10 most variable genes. Subsequently, the “ScaleData” function was applied to scale the data, followed by dimensionality reduction in the HVGs using principal component analysis (PCA). The optimal number of principal components (PCs) was then determined using the “Jackstraw” and “ElbowPlot” functions. Next, cell clustering was performed on the selected principal components using the “FindNeighbors” and “FindClusters” functions, with the clustering resolution set to 0.5. Afterward, the “RunTSNE” function was employed to generate a t-distributed Stochastic Neighborhood Embedding (t-SNE) visualization plot for observing the clustering patterns among cell populations. Potential sample-associated effects were assessed by visualizing cells according to sample identity in t-SNE and PCA space. Local sample mixing was additionally evaluated using a 30-nearest-neighbor-based mixing score and the local inverse Simpson’s index (LISI). Based on the marker genes from the CellMarker 2.0 database (https://bio-bigdata.hrbmu.edu.cn/CellMarker/#/home, accessed on 6 September 2025), cell types were annotated for the different clusters. To provide quantitative support for the cell-type annotations, positive marker genes for each annotated cell type were further identified using the Seurat “FindAllMarkers” function with the Wilcoxon test (only.pos = TRUE, min.pct = 0.25, and logfc.threshold = 0.25), and both nominal and BH-adjusted p values were recorded.
2.3. Cell Communication Analysis and Identification of Ligand–Receptor Pairs for Associated Genes
To characterize inferred intercellular communication patterns, the “CellChat” package (v 1.6.1) [26] was applied to the processed scRNA-seq object containing the two CA samples using the official CellChatDB.human ligand–receptor database. After creation of the CellChat object, overexpressed genes and interactions were identified, followed by estimation of communication probabilities using “computeCommunProb”. Statistical significance was assessed using the default permutation procedure (nboot = 100), and significant ligand–receptor interactions were retained using “subsetCommunication” with a threshold of p ≤ 0.05. Cell clusters containing fewer than 10 cells were excluded from communication inference (min.cells = 10). Pathway-level communication probabilities were subsequently calculated, and the corresponding ligand- and receptor-associated genes were extracted for downstream analyses. To assess the transferability of the CellChat-derived ligand–receptor-associated gene set across tissue sources and transcriptomic platforms, cross-tissue consistency analyses were performed before integration with the bulk transcriptomic datasets. Gene detectability was evaluated by calculating the proportion of cells with detectable expression in the scRNA-seq dataset and the proportion of samples with non-zero expression in each bulk cohort. A weighted pseudo-bulk profile was generated from the scRNA-seq data and compared with each bulk cohort using Spearman correlation. Potential tissue-composition effects were assessed using representative epithelial and immune markers. Sensitivity analyses based on commonly detected genes, detection-rate stratification, and leave-one-gene-out analysis were further performed to evaluate the robustness of cross-tissue consistency.
2.4. Analysis of Differential Gene Expression
Differential expression analysis between CA and control samples was performed on the GSE65204 dataset utilizing the “limma” package (v 3.56.2) [27]. Both nominal p values and Benjamini–Hochberg (BH)-adjusted p values were calculated. For exploratory candidate discovery, differentially expressed genes (DEGs) were initially defined using |log2 fold change (FC)| > 0.5 and nominal p < 0.05, while BH-adjusted P (adj.P) values were additionally reported to account for multiple testing. Given the exploratory nature and modest sample size of the discovery cohort, the nominal threshold was retained for subsequent candidate screening to avoid excluding potentially relevant genes with moderate expression differences. The volcano plot depicting nominal DEGs was generated using the “ggplot2” package (v 3.5.2) (https://CRAN.R-project.org/package=ggplot2, accessed on 8 November 2026). The top 10 most significantly up-regulated and down-regulated genes, ranked in descending order based on log2FC values, were labeled. Furthermore, a heatmap visualizing the expression patterns of these 20 DEGs across different samples was generated using the “ComplexHeatmap” package (v 2.16.0) [28].
2.5. Identification and Related Functional Analysis of Candidate Genes
The “ggvenn” package (v 0.1.10) [29] was employed to analyze the overlap between DEGs and genes related to ligands and receptors. This exploratory intersection analysis was used to identify genes showing both differential expression at the predefined discovery threshold and involvement in ligand–receptor-associated communication, which were designated as candidate genes for subsequent analyses. Thereafter, Gene Ontology (GO) enrichment analysis of the candidate genes was performed using the “clusterProfiler” package (v 4.15.0.003) [30], applying a significance threshold of adj.P < 0.05. The results highlighted their roles in specific molecular functions (MFs), cellular components (CCs), and biological processes (BPs). Additionally, Kyoto Encyclopedia of Genes and Genomes (KEGG) enrichment analysis (adj.P < 0.05) was conducted with the same package to identify key signal transduction pathways linked to these genes. Furthermore, to explore potential protein-level interactions among the candidate genes, protein–protein interaction (PPI) data were extracted from the Search Tool for the Retrieval of Interacting Genes/Proteins (STRING) database (https://www.string-db.org, accessed on 5 September 2025) , using an interaction score threshold > 0.40. Subsequently, the PPI network was visualized using “Cytoscape” software (v 3.10.3) [31].
2.6. Identification of Candidate Molecular Correlates Through Machine Learning and Expression Validation
Based on the GSE65204 dataset, five machine learning algorithm models—least absolute shrinkage and selection operator (LASSO) regression, Support Vector Machine (SVM), Random Forest (RF), Generalized Linear Model (GLM), and Extreme Gradient Boosting (XGBoost)—were constructed using the “caret” package (v 6.0.94) [32] and “xgboost” package (v 2.1.1.1) (https://CRAN.R-project.org/package=xgboost, accessed on 8 November 2026) to perform feature gene selection and evaluate model performance for candidate genes. First, LASSO regression (with alpha set to 1) was employed to conduct five-fold cross-validation over an extensive grid of lambda parameters, using area under the curve (AUC) as the performance evaluation metric, from which the optimal penalty parameter λ was selected. For LASSO, feature selection was performed within the training subset of each cross-validation fold to avoid using information from the corresponding held-out fold during feature selection. To evaluate the stability of feature selection across cross-validation folds, we recorded the features selected by LASSO in the training subset of each fold, calculated the selection frequency of each candidate feature across all five folds, and summarized the union and intersection of selected features across folds. Subsequently, an SVM model with a radial basis kernel (svmRadial) was constructed, and grid search was performed to tune the penalty parameter C and the kernel width sigma, aiming to select the model with the best performance. The RF model was configured with 500 trees, and the mtry parameter was tuned to evaluate the importance of each feature. The GLM was implemented as a standard logistic regression using a binomial distribution family with a specified logit link function. No regularization or penalty terms were introduced into this model, so there were no regularization hyperparameters that required additional tuning. Five-fold cross-validation was applied to the GLM model, yet no additional hyperparameter grid search was performed as no tunable hyperparameters were configured for this model. The XGBoost model was trained using fixed hyperparameters: max_depth = 2, eta = 0.3, and nround = 25. Significant variables were extracted by feature importance ranking. For comparative assessment of model discrimination, five-fold cross-validation was applied to all five models, and out-of-fold predicted probabilities under the selected model settings were used to calculate cross-validated AUCs. The corresponding 95% confidence intervals were estimated using 200 bootstrap resamples. To further evaluate model performance, an interpreter was constructed using the “DALEX” package (v 2.4.3) [33], enabling a comparative analysis of the five models using multidimensional metrics such as residual distribution, reverse cumulative distribution curves, and variable importance rankings. According to the prespecified residual-based model-selection framework, the model showing the most favorable residual fitting profile was retained for subsequent feature ranking, and feature genes were extracted according to their feature importance. For the selected optimal classification model, the Youden index was adopted to identify the optimal classification cutoff value. Using this optimal cutoff, we further calculated a panel of diagnostic performance metrics, including sensitivity, specificity, positive predictive value (PPV), negative predictive value (NPV), and overall accuracy, to comprehensively characterize the classification efficacy of the model. To confirm the differential expression of the feature genes in CA, the Wilcoxon test was applied to compare gene expression levels between the CA and control groups within the GSE65204 and GSE152004 datasets. The rank-biserial correlation coefficient (cor) was calculated as a non-parametric effect size measure to quantify the magnitude and direction of expression differences between the two groups. The independent GSE152004 cohort was used for external replication of the differential expression patterns of feature genes, to verify the consistency of expression trends across independent populations. Genes exhibiting consistent expression trends and statistically significant differences (p < 0.05) across both datasets were defined as final candidate molecular correlates for CA.
2.7. Bootstrap Sensitivity Analysis
To assess the robustness of the differential expression patterns of the candidate molecular correlates, a bootstrap resampling analysis was conducted with 100 iterations. In each iteration, 80% of the samples from the GSE65204 dataset were randomly selected with replacement, and the log2FC of each candidate molecular correlate between the CA and control groups was recalculated. For each candidate molecular correlate, three metrics were derived from the bootstrap distribution: the median bootstrap log2FC, the 95% bootstrap confidence interval, and the proportion of iterations with consistent downregulation direction.
2.8. Establishment and Evaluation of the Nomogram
After the final candidate molecular correlates were determined, a multivariable logistic regression model was fitted in the GSE65204 training cohort using the “rms” package (v 6.8.1) (https://CRAN.R-project.org/package=rms, accessed on 8 November 2026), and the resulting model was visualized as a nomogram. Regression coefficients, odds ratios (ORs), 95% confidence intervals (CIs), and p values were reported to characterize the model transparently. The “regplot” package (v 1.1) (https://CRAN.R-project.org/package=regplot, accessed on 8 November 2026) was employed to assess the nomogram’s predictive accuracy by generating a calibration curve. Model calibration was evaluated using the Hosmer–Lemeshow (HL) goodness-of-fit test (p > 0.05), which measured the concordance between predicted probabilities and actual observed results. The pROC package (v 1.18.5) [34] was applied to generate a receiver operating characteristic (ROC) curve and calculate the AUC, with its 95% CI estimated using 200 bootstrap resamples, to evaluate the model’s discriminative ability (an AUC > 0.7 was considered indicative of acceptable discriminative performance). Decision-curve analysis (DCA) was additionally performed to evaluate net benefit across threshold probabilities. The same candidate molecular correlate set was further evaluated in the GSE152004 cohort using a logistic regression framework, with model performance assessed by a nomogram, bootstrap calibration (B = 1000), the Hosmer–Lemeshow test, ROC analysis with 95% CI, and DCA.
2.9. Chromosomal and Subcellular Localization, Correlation Analysis, and Functional Similarity Assessment of Candidate Molecular Correlates
A further systematic characterization of the features of candidate molecular correlates was conducted from multiple perspectives, including genomic spatial distribution, subcellular localization, and functional relevance. First, the “RCircos” package (v 1.2.2) [35] was utilized to map the locations of candidate molecular correlates on human chromosomes, facilitating an understanding of the gene structural basis at the chromosomal level. Subsequently, the subcellular localization of candidate molecular correlates was predicted based on the RNALocate database (http://rnalocate.org/, accessed on 6 September 2025), obtaining distribution information across various subcellular compartments, including the nucleus, cytoplasm, and endoplasmic reticulum. Additionally, the “psych” package (v 3.56.2) (https://CRAN.R-project.org/package=psych, accessed on 8 November 2026) was employed to conduct Spearman correlation analysis across all samples in the GSE65204 dataset, calculating pairwise correlations among candidate molecular correlates (|cor| > 0.3, p < 0.05), thereby revealing the co-variation relationships between genes at the expression level. The “GOSemSim” package (v 2.34.0) [36] was employed to calculate the semantic similarity of candidate molecular correlates across the three principal GO functional categories—BPs, CCs, and MFs. Thereafter, the average similarity score was computed to assess whether candidate molecular correlates exhibited functional consistency or complementarity.
2.10. Gene-Gene Interaction (GGI) Network Construction and Enrichment Analysis
To further explore the biological functions of candidate molecular correlates within the context of GGI networks and signaling pathways, the Gene Multiple Association Network Integration Algorithm (GeneMANIA) online tool (http://genemania.org/, accessed on 5 September 2025) was initially utilized, with “Homo sapiens” specified as the species to clarify the potential interaction patterns and functional association modules between the candidate molecular correlates and their functionally related genes. Then, gene set enrichment analysis (GSEA) was utilized to investigate the biological functions and signaling pathways associated with candidate molecular correlates during the onset and progression of CA. Specifically, the reference gene set selected for analysis was “c2.cp.kegg.v7.5.1.symbols.gmt” sourced from the Molecular Signatures Database (MSigDB) (https://www.gsea-msigdb.org/, accessed on 5 September 2025). Following this, Spearman correlation coefficients were calculated for each candidate molecular correlate against all other genes across all samples in the GSE65204 dataset, employing the “psych” package (v 3.56.2). Subsequently, genes were ranked in descending order based on their correlation coefficients with the candidate molecular correlates, resulting in a ranked gene list for each candidate molecular correlate. Subsequently, GSEA was performed on each candidate molecular correlate using the “clusterProfiler” package (v 4.15.0.003). Significance was determined based on the criteria of |normalized enrichment score (NES)| exceeding 1, false discovery rate (FDR) below 0.25, and p < 0.05. To thoroughly investigate the enrichment differences between different groups, the gene set variation analysis (GSVA) method was further applied. Using the Hallmark gene sets, KEGG subsets (c2.all.v7.2.symbols.gmt), and GO datasets (c5.go.v7.2.symbols.gmt) from the MSigDB as reference gene sets, enrichment analysis was conducted on the CA and control groups. Particularly, the ssGSEA algorithm within the “GSVA” package (v 1.53.28) [37] was utilized to compute GSVA scores for each gene set across all samples, thereby evaluating the activity of each sample in relevant pathways. Building on this, differential analysis of GSVA scores between the CA and control groups was performed using the “limma” package (v 3.56.2), with differentially enriched pathways identified based on thresholds of |t| > 2 and adj.P < 0.05.
2.11. Analysis of Immune Cell Infiltration
The ssGSEA algorithm implemented in the “GSVA” package (v 1.53.28) was used to calculate enrichment scores for 28 immune cell-associated transcriptional signatures [38]. These scores were interpreted as the relative enrichment of immune cell-associated transcriptional programs rather than the absolute abundance or proportion of the corresponding immune cells. The Wilcoxon rank-sum test was used to compare ssGSEA scores between the CA and control groups, and p values across the 28 comparisons were adjusted using the Benjamini–Hochberg (BH) method, with adj.P < 0.05 considered significant. Rank-biserial correlation coefficients were calculated as non-parametric effect-size measures. Moreover, the “psych” package (v 3.56.2) was employed to conduct Spearman correlation analysis among significantly different immune signatures and between the candidate molecular correlates and these signatures, with BH correction applied to the corresponding p values (|cor| > 0.3, adj.P < 0.05).
2.12. Prediction of miRNA–mRNA–TF Associations
Potential miRNA and transcription factor (TF) associations with the candidate molecular correlates were predicted, and a miRNA–mRNA–TF association network was constructed. Specifically, based on the candidate molecular correlates, the “multiMiR” package (v1.22.0) [39] was utilized to query the mirDB database for predicting targeted miRNAs associated with each candidate molecular correlate. Subsequently, to obtain information on transcription factors (TFs) regulating the candidate molecular correlates, the candidate molecular correlates were input into the NetworkAnalyst online platform (https://www.networkanalyst.ca, accessed on 6 September 2025). The species “Homo sapiens” was selected, and predictions were made based on its integrated TF-target gene interaction database.
Thereafter, the predicted results were visualized using “Cytoscape” software (v 3.10.3), leading to the construction of a miRNA–mRNA–TF network.
2.13. Drug/Compound Prediction, Molecular Docking, and Constructing Candidate Compound-mRNA-KEGG Pathway
To explore putative interactions between the candidate molecular correlates and drugs/compounds, the Drug-Gene Interaction Database (DGIdb) (https://www.dgidb.org/, accessed on 8 November 2026) was utilized to retrieve drug/compound interaction information corresponding to the candidate molecular correlates. The drugs were ranked based on their interaction scores, and those with higher scores were selected as candidate compounds for each candidate molecular correlate. A two-step evaluation strategy was applied to the candidate compounds: first, preliminary candidate compounds for all four candidate molecular correlates were retrieved and retained to present the full drug-screening landscape; second, representative compounds meeting the predefined screening criteria were retained for exploratory molecular docking analysis. The exclusion criteria for docking validation included: (1) antibacterial agents with only antimicrobial indications and no established pharmacological rationale for asthma therapy; (2) compounds withdrawn from the market in multiple countries due to severe adverse effects such as hepatotoxicity, with extremely low clinical translation potential. For reference comparison, compstatin was additionally docked with the homologous complement protein C4B; this comparison was not considered a formal negative control for target specificity. Subsequently, an interaction network of “candidate molecular correlates–drugs/compounds” was constructed using “Cytoscape” software (v 3.10.3) to preliminarily elucidate the regulatory relationships between potential drugs/compounds and candidate molecular correlates. Subsequently, to further evaluate the binding mode and affinity between candidate compounds and candidate molecular correlate-encoding proteins at the structural level, molecular docking analysis was conducted. First, the 3D structures of candidate molecular correlate-encoding proteins were downloaded from the Protein Data Bank (PDB) (https://www.rcsb.org/, accessed on 5 September 2025). Water and solvent molecules were removed from the structures using “PyMOL” software (v 3.1.3) [40]. The protein structures were then preprocessed with “AutoDock” software (v 1.5.7) (https://autodock-vina.readthedocs.io/en/latest/index.html, accessed on 8 November 2026) and saved in PDBQT format. Meanwhile, the 2D structures (in SDF format) of candidate compounds were downloaded from the PubChem database (https://pubchem.ncbi.nlm.nih.gov/, accessed on 5 September 2025). These 2D structures were converted into 3D structures in mol2 format using “Open Babel” software (v 3.1.1) (https://openbabel.org/index.html, accessed on 8 November 2026). Subsequently, the ligand molecules were hydrogenated and further processed using “AutoDock” software (v 1.5.7), and then saved in PDBQT format. Subsequently, molecular docking was performed on the processed protein receptors and ligand molecules using “AutoDock Vina” software (v 1.5.7) (https://autodock-vina.readthedocs.io/en/latest/index.html, accessed on 8 November 2026). The docking grid was centered on the active pocket or known ligand-binding region of each receptor and sized to encompass the binding pocket and ligand. AutoDock Vina was run with exhaustiveness = 8, num_modes = 9, and seed = 123. A single docking run was performed for each receptor–ligand pair, and the best-scoring pose among the generated modes was retained. Docking scores were reported in kcal/mol, with more negative values indicating more favorable predicted interactions. Finally, pathways encompassing these candidate molecular correlates from KEGG enrichment analysis were integrated, and a “candidate compound-candidate molecular correlate-biological function” relationship network was constructed using “Cytoscape” software (v 3.10.3). This network visually illustrated the connections between potential compounds, their target genes, and associated signaling pathways, providing evidence to elucidate their possible mechanisms of action.
2.14. Prioritization of Cell Types for Subsequent Analysis
A systematic analysis was carried out on the expression patterns of candidate molecular correlates in each annotated cell type, based on the scRNA-seq dataset GSE254127, aiming to further clarify their distribution characteristics across different cell types and prioritize cell populations for subsequent exploratory analyses. Initially, the expression matrix of candidate molecular correlates across various annotated cell types was extracted. Subsequently, t-SNE was employed to reduce the dimensionality of single cells for visualization, with the expression levels of candidate molecular correlates superimposed to illustrate their spatial distribution patterns among different annotated cell types. Additionally, the Wilcoxon test was applied to evaluate differences in candidate molecular correlate expression between each annotated cell type and the other cell types in the GSE254127 dataset. Cell types exhibiting high expression of multiple candidate molecular correlates and significant expression differences (p < 0.05) compared with other cell types were prioritized for subsequent exploratory analyses.
2.15. Exploratory Pseudo-Temporal Trajectory Analysis, TF Activity Prediction, and Biological Function Analysis
To investigate changes in candidate molecular correlate expression along the inferred cellular trajectory, the prioritized cell type was first subjected to secondary dimensionality reduction and clustering within the GSE254127 dataset, employing the same method as described in Section 2.2. Subsequently, pseudo-temporal trajectory analysis was conducted based on this. Using the “monocle” package (v 1.3.7) [41], prioritized cell types were embedded into a pseudotime space to construct a single-cell developmental trajectory featuring a root node and multiple branches. The expression patterns of candidate molecular correlates were then projected onto this trajectory to characterize their changes along the inferred pseudotime ordering. To further characterize predicted transcription factor activity patterns and identify candidate TFs in the prioritized cell type, the “pySCENIC” package (v 0.12.1) [42] was employed. Using all annotated cell types as the background and the genome motif database hg38 as the reference, the GRNBoost2 algorithm was first applied to infer the co-expression networks between transcription factors and their target genes. Thereafter, the AUCell algorithm was used to calculate the regulon activity scores (Regulon AUC) in each annotated cell type. To further evaluate the principal biological functions of prioritized cell types, the “clusterProfiler” package (v 4.15.0.003) was applied to perform GO and KEGG enrichment analyses on the marker genes of these prioritized cell types (adj.P < 0.05). Additionally, the ssGSEA algorithm from the “GSVA” package (v 1.53.28) was utilized to score pathway enrichment for each annotated cell type. Subsequently, the Wilcoxon test was employed to compare differences in pathway activities between prioritized cell types and other annotated cell types, with pathways showing p < 0.05 being selected.
2.16. Statistical Analysis
Statistical analyses were conducted using R software (v 4.3.3), with the Wilcoxon test employed to assess the statistical significance of differences between groups. A p value of less than 0.05 was considered statistically significant.
3. Results
3.1. Cell-Type Annotation and Inferred Intercellular Signaling Patterns in CA Airway Samples
After QC of the GSE254127 dataset, 20,317 high-quality cells were obtained (compared to 27,715 cells before screening) (Figure S1A,B). The number of genes remained consistent at 36,601, which was identical to that before screening. Subsequently, 2000 HVGs were identified (Figure S1C). Next, the top 20 PCs (p < 0.05) were selected for downstream analysis (Figure S1D,E). Based on the t-SNE dimensionality reduction results, 18 cell clusters were identified and subsequently annotated into 11 major cell types using marker genes: squamous cells, club cells, secretory cells, basal cells, ciliated cells, goblet cells, dendritic cells, B cells, T cells, mast cells, and ionocytes (Figure S1F–H, Table 1). Differential marker analysis further provided quantitative support for the annotated cell types, with the complete marker statistics (Table S2). The cell counts for each annotated cell type were as follows: 5823 squamous cells, 3215 club cells, 2768 basal cells, 2142 ciliated cells, 1876 secretory cells, 1024 goblet cells, 987 dendritic cells, 892 B cells, 765 T cells, 523 mast cells, and 302 ionocytes. Sample-colored t-SNE and PCA visualizations showed partial overlap between the two samples in the low-dimensional representations (Figure S2A,B). The mean sample-mixing scores were 0.154 and 0.314 for Sample 1 and Sample 2, respectively, with corresponding mean LISI values of 1.259 and 1.512, indicating that some sample-associated heterogeneity remained despite overlap between the two samples. All 11 cell clusters had cell numbers above the min. cell threshold of 10, so all clusters were included in the subsequent CellChat communication analysis, and no clusters were excluded due to insufficient cell count.
Table 1.
Annotated cell types and representative marker genes.
CellChat analysis was subsequently used to characterize inferred communication patterns among the annotated cell types. Squamous cells showed relatively high numbers and weights of inferred interactions with multiple epithelial and immune cell types (Figure S3A,B). At the ligand–receptor level, MIF-related signaling was broadly inferred across multiple cell types (Figure S3C), with MIF − (CD74 + CXCR4) and MIF − (CD74 + CD44) showing relatively high communication probabilities across several cell-type pairs. Because the scRNA-seq dataset contained only CA samples, these patterns were interpreted as prevalent communication features within the analyzed samples rather than CA-specific signaling alterations. Significant ligand–receptor interactions were retained according to permutation p < 0.05, and their communication probabilities and permutation p values are provided in Table S3. In total, 67 ligand–receptor-associated genes (Table S3) were extracted from these significant interactions and used as the candidate gene pool for subsequent exploratory screening in the bulk transcriptomic datasets.
3.2. Cross-Tissue Consistency and Identification of Communication-Associated DEGs
Before integrating the CellChat-derived ligand–receptor-associated genes with the bulk transcriptomic datasets, their cross-tissue and cross-platform consistency was assessed. Most genes were detectable in the nasal epithelial bulk cohorts, supporting their technical availability for downstream integration (Figure S4A). Comparison of the scRNA-seq pseudo-bulk expression profile with the bulk datasets showed strong positive correlations in overall ligand–receptor-associated gene expression, with Spearman correlation coefficients of 0.705 for GSE65204 (p = 4.56 × 10⁻⁹) and 0.817 for GSE152004 (p < 0.001) (Figure S4B,C). Sensitivity analyses showed that the cross-tissue correlations remained stable after sequential leave-one-gene-out analysis (cor = 0.690–0.736 for GSE65204 and 0.807–0.846 for GSE152004), while stratified analyses showed stronger concordance among genes with higher single-cell detection rates (Table S4). Comparison of representative epithelial and immune markers further indicated differences in tissue composition across datasets, with the bulk nasal epithelial profiles reflecting mixed epithelial and immune transcriptional signals (Figure S4D). These results supported the use of the ligand–receptor-associated gene set for subsequent bulk transcriptomic screening while indicating that tissue-composition differences should be considered when interpreting cross-tissue associations.
In the GSE65204 dataset, exploratory differential expression analysis between the CA group and the control group identified 193 DEGs at the predefined discovery threshold of nominal p < 0.05 and |log2FC| > 0.5, including 89 upregulated and 104 downregulated genes (Figure 1A,B). After BH correction, 43 of these genes remained significant at adj.P < 0.05 and |log2FC| > 0.5 (Table S5). For subsequent exploratory candidate screening, the nominally significant DEG set was retained according to the predefined discovery strategy. Subsequently, an exploratory intersection analysis was performed between the nominally significant DEGs and the ligand–receptor gene set obtained from the cell communication analysis (Figure 1C). A total of 11 candidate genes were identified, including CD55, HLA-DMB, CD74, HLA-DPB1, HLA-DRB1, LAMB3, C3, HLA-DQA1, HLA-DPA1, AREG, and PTPRC. The 11 candidate genes demonstrated significant enrichment (adj.P < 0.05) across 404 GO terms, encompassing 355 BPs, 17 MFs, and 32 CCs, as well as 25 KEGG signaling pathways (Figure 1D,E, Table S6). After redundancy reduction via semantic similarity clustering and manual curation, representative non-redundant terms were selected to summarize the functional profiles. The most representative immune-related BPs included antigen processing and presentation of exogenous peptide antigen via MHC class II, immunoglobulin-mediated immune response. Key enriched CCs included the MHC class II protein complex and clathrin-coated endocytic vesicle membrane. For MFs, peptide antigen binding and MHC class II protein complex binding were the most prominent terms. KEGG enrichment analysis further identified core non-redundant pathways closely linked to asthma pathogenesis and immune activation, including asthma, antigen processing and presentation, hematopoietic cell lineage, and Staphylococcus aureus infection. These results suggested that the candidate genes were primarily involved in immune regulation, antigen processing, and inflammation-related processes, potentially playing a crucial role in the onset and progression of CA. Further analysis of the protein-level interaction relationships among the candidate genes revealed that two proteins (LAMB3 and AREG) were isolated, whereas the remaining nine candidate genes demonstrated protein–protein interactions (PPI) (Figure 1F).
Figure 1.
Differentially expressed genes, functional enrichment, and protein–protein interaction (PPI) analysis between CA and control groups. (A) Volcano plot of differentially expressed genes (DEGs) between the CA and control groups. (B) Heatmap illustrating the expression patterns of representative DEGs. (C) Venn diagram showing the intersection between DEGs and ligand–receptor gene sets. (D) Gene Ontology (GO) enrichment analysis of the 11 candidate genes. (E) Kyoto Encyclopedia of Genes and Genomes (KEGG) pathway enrichment analysis of the 11 candidate genes. (F) PPI network of the 11 candidate genes.
3.3. Machine-Learning-Based Candidate Molecular Correlate Identification with Expression Validation and Model Evaluation
Based on the GSE65204 dataset, predictive models for candidate genes were constructed and evaluated using five machine learning algorithms: LASSO, SVM, RF, GLM, and XGBoost. The reverse cumulative distribution curves demonstrated that the RF model exhibited the lowest absolute residual distribution and the smallest fitting error (Figure 2A). The residual boxplot further confirmed that the RF model had the lowest root mean square error (RMSE) (Figure 2B), indicating a favorable residual-based fitting profile for RF. The five-fold cross-validation showed AUCs of 0.779 (95% CI: 0.675–0.876) for LASSO, 0.773 (0.665–0.868) for SVM, 0.772 (0.679–0.883) for GLM, 0.717 (0.599–0.839) for RF, and 0.706 (0.591–0.828) for XGBoost (Figure S5A). According to the prespecified residual-based selection criterion, RF was retained for subsequent feature-gene ranking. The optimal classification cutoff value of the RF model was determined using the Youden index, which yielded a cutoff of 0.4560. At this optimal cutoff, the RF model achieved a sensitivity of 0.7222, a specificity of 0.6667, a PPV of 0.7027, a NPV of 0.6875, and an overall accuracy of 0.6957 (Table S7). According to the pre-specified model selection criterion, the RF model was determined as the optimal predictive model for subsequent feature gene screening. For the LASSO model, we further evaluated the stability of feature selection across cross-validation folds. Among the 11 candidate genes, 7 features were selected in at least one of the five cross-validation folds, while only 1 feature was retained consistently across all five folds (Table S8). Based on the RF model, five feature genes—C3, CD55, HLA-DMB, HLA-DPB1, and HLA-DQA1—were identified (Figure 2C). The Wilcoxon test p values and rank-biserial correlation coefficients for each gene in the two independent datasets were detailed as follows. In the training set GSE65204, all five genes showed significant expression differences between the pediatric asthma group and the control group: CD55 (p < 0.0001, cor = 0.5800), HLA-DMB (p < 0.0001, cor = −0.5328), C3 (p < 0.001, cor = −0.4301), HLA-DPB1 (p < 0.0001, cor = −0.5194), and HLA-DQA1 (p < 0.001, cor = −0.3956). In the validation set GSE152004, the values were as follows: CD55 (p < 0.01, cor = −0.1482), HLA-DMB (p < 0.0001, cor = −0.2291), C3 (p < 0.0001, cor = −0.1724), HLA-DPB1 (p < 0.0001, cor = −0.1843), and HLA-DQA1 (p < 0.0001, cor = −0.1657) (Figure 2D,E). CD55 showed opposite expression directions between GSE65204 and GSE152004 and was therefore excluded from subsequent model construction. In contrast, C3, HLA-DMB, HLA-DPB1, and HLA-DQA1 showed consistent expression directions across both datasets and were retained as candidate molecular correlates for subsequent analyses.
Figure 2.
Candidate molecular correlate identification and the construction and assessment of nomograms. (A) Reverse cumulative distribution curves of |residual| across five machine-learning models. (B) Boxplots of residual error for each machine-learning model. (C) Feature importance of candidate genes in five machine-learning models. (D) Expression of the five feature genes in the training dataset (GSE65204). (E) Expression validation of feature genes in the external dataset (GSE152004). (F) Nomogram constructed from the four candidate molecular correlates (C3, HLA-DMB, HLA-DPB1, HLA-DQA1). (G) Calibration curve of the nomogram model. (H) ROC curve of the nomogram. (I) DCA curve of the nomogram.
A multivariable logistic regression model based on the four candidate molecular correlates was constructed in GSE65204 and visualized as a nomogram (Figure 2F); the corresponding regression coefficients, ORs, 95% CIs, and p values are provided in Table S9. The calibration analysis showed no significant lack of fit (Hosmer–Lemeshow p = 0.288), with the calibration curves remaining close to the ideal reference line (Figure 2G). The model achieved an AUC of 0.779 with a bootstrap 95% CI of 0.685–0.876 (Figure 2H), indicating moderate discrimination in the training cohort. DCA further showed a positive net benefit over the reference strategies across an approximate threshold probability range of 0.11–0.80 (Figure 2I). Next, a corresponding nomogram was constructed in the GSE152004 cohort (Figure S5B), and bootstrap calibration showed good agreement between predicted and observed probabilities, with a Hosmer–Lemeshow test of p = 0.925 (Figure S5C). The ROC analysis yielded an AUC of 0.596 (95% CI: 0.553–0.639), indicating limited discriminative performance in this external cohort (Figure S5D). DCA showed a modest net benefit mainly within an approximate threshold probability range of 0.41–0.63 (Figure S5E). These findings indicate that, although the model showed satisfactory calibration, its discrimination and range of net clinical benefit were more limited in GSE152004, supporting a cautious interpretation of its generalizability.
3.4. Stability Verification via Bootstrap Sensitivity Analysis
Bootstrap resampling with 100 iterations was performed to verify the stability of the observed downregulation of the four candidate molecular correlates. The results demonstrated that all four candidate molecular correlates (HLA-DMB, C3, HLA-DPB1, and HLA-DQA1) maintained a downregulation trend in 100% of the bootstrap iterations, yielding a direction consistency of 100%, which indicated high reproducibility of the differential expression pattern (Figure S6A). Specifically, the bootstrap median log2FC was −0.6660 (95% CI: −0.9965 to −0.3353) for HLA-DMB, −0.7601 (95% CI: −1.2050 to −0.3194) for C3, −0.7465 (95% CI: −1.1440 to −0.3966) for HLA-DPB1, and −0.9031 (95% CI: −1.5270 to −0.3040) for HLA-DQA1 (Figure S6B, Table S10). Notably, the 95% bootstrap confidence intervals of all four candidate molecular correlates did not cross zero, further confirming the robustness of the downregulation results.
3.5. Integrated Localization, Correlation, and Pathway Analyses of the Four CA Candidate Molecular Correlates
Further chromosomal and subcellular localization analyses were conducted on four candidate molecular correlates (C3, HLA-DMB, HLA-DPB1, and HLA-DQA1). C3 was located on chromosome 19, while HLA-DMB, HLA-DPB1, and HLA-DQA1 genes were all positioned on chromosome 6 (Figure 3A). Subcellular localization results revealed that C3 mRNA was predominantly distributed in the nucleus, HLA-DMB and HLA-DPB1 were enriched in the cytoplasm, and HLA-DQA1 was mainly located in the endoplasmic reticulum (Figure 3B). There was a strong positive correlation in expression among the four candidate molecular correlates (cor > 0.5, p < 0.05) (Figure 3C). Additionally, except for C3, the other candidate molecular correlates exhibited high functional similarity (Figure 3D). Further GGI network analysis demonstrated significant correlations between C3, HLA-DMB, HLA-DPB1, HLA-DQA1, and 20 functionally similar genes (Figure 3E). Notably, HLA-DMB, HLA-DPB1, HLA-DQA1, along with several functionally similar genes (e.g., HLA-DQB1 and CD74), were associated with multiple immune response-related pathways, such as antigen processing and presentation of peptide antigens via MHC class II, and antigen processing and presentation of exogenous antigens. In GSEA, it was found that C3, HLA-DMB, HLA-DPB1, and HLA-DQA1 were jointly enriched in multiple typical immune-related pathways, including primary immunodeficiency, cytokine–cytokine receptor interaction, natural killer cell–mediated cytotoxicity, chemokine signaling pathway, T cell receptor signaling pathway, and leishmania infection, which were strongly immunologically characterized (Figure 3F–J). These pathways were generally involved in key immune processes such as antigen presentation, cytokine receptor interaction, and immune cell recruitment and activation. These results suggested that C3 and the MHC class II-related genes HLA-DMB, HLA-DPB1, and HLA-DQA1 were associated with transcriptomic patterns involving innate and adaptive immune responses in CA, thereby further supporting their biological significance as candidate molecular correlates of CA. GSVA revealed significant pathway differences between the CA group and the control group (Figure 3J). Among the pathways upregulated in the CA group, those most relevant to disease characteristics included neuropeptide hormone activity and regulation of fibroblast growth factor receptor signaling pathway, both of which were closely associated with asthma-related processes such as airway smooth muscle response, inflammatory mediator release, and mucosal remodeling. Conversely, among the pathways downregulated in the CA group, DNA strand elongation involved in DNA replication and purine nucleoside monophosphate biosynthetic process were predominantly included, indicating an overall decline in cellular proliferation and nucleotide metabolic activity in CA tissues.
Figure 3.
Genomic distribution, subcellular localization, functional correlation, and immune pathway enrichment analysis of the four CA candidate molecular correlates. (A) Chromosomal localization of the four candidate molecular correlates. (B) Subcellular localization of the four candidate molecular correlate transcripts. (C) Correlation matrix of candidate molecular correlate gene expression. (D) Functional similarity analysis among the four candidate molecular correlates. (E) Gene–gene interaction (GGI) network constructed via GeneMANIA. (F) Gene set enrichment analysis (GSEA) plot for C3. (G) GSEA plot for HLA-DMB. (H) GSEA plot for HLA-DPB1. (I) GSEA plot for HLA-DQA1. (J) Differentially enriched pathways between CA and control groups based on gene set variation analysis (GSVA).
3.6. Immune Signature Molecular Correlates in CA
Immune signature enrichment analysis revealed variation in the relative ssGSEA enrichment scores of 28 immune cell-associated transcriptional signatures between the CA and control groups (Figure 4A). After BH correction for multiple testing, only the activated B-cell and type 2 T-helper-cell signatures remained significantly different, and both showed lower relative enrichment in the CA group (activated B cell: adj.P = 0.0172; type 2 T helper cell: adj.P = 0.00824) (Figure 4B). The enrichment scores of these two signatures were moderately positively correlated (cor = 0.497, adj.P = 1.38 × 10⁻⁵) (Figure 4C). Furthermore, all four candidate molecular correlates showed positive associations with both immune signatures, and all eight correlations remained significant after BH correction (Figure 4D). HLA-DMB showed the strongest correlations with the activated B-cell and type 2 T-helper-cell signatures (cor = 0.722 and 0.650, respectively), followed by HLA-DPB1 (cor = 0.681 and 0.614, respectively), whereas C3 and HLA-DQA1 showed moderate positive correlations (cor = 0.432–0.501). This suggested that changes in the expression of these candidate molecular correlates might be closely related to the level of immune cell signature enrichment in CA, rather than direct changes in immune-cell abundance.
3.7. Predicted miRNA/TF Associations and Drug/Compound–Target Interactions of Four Candidate Molecular Correlates
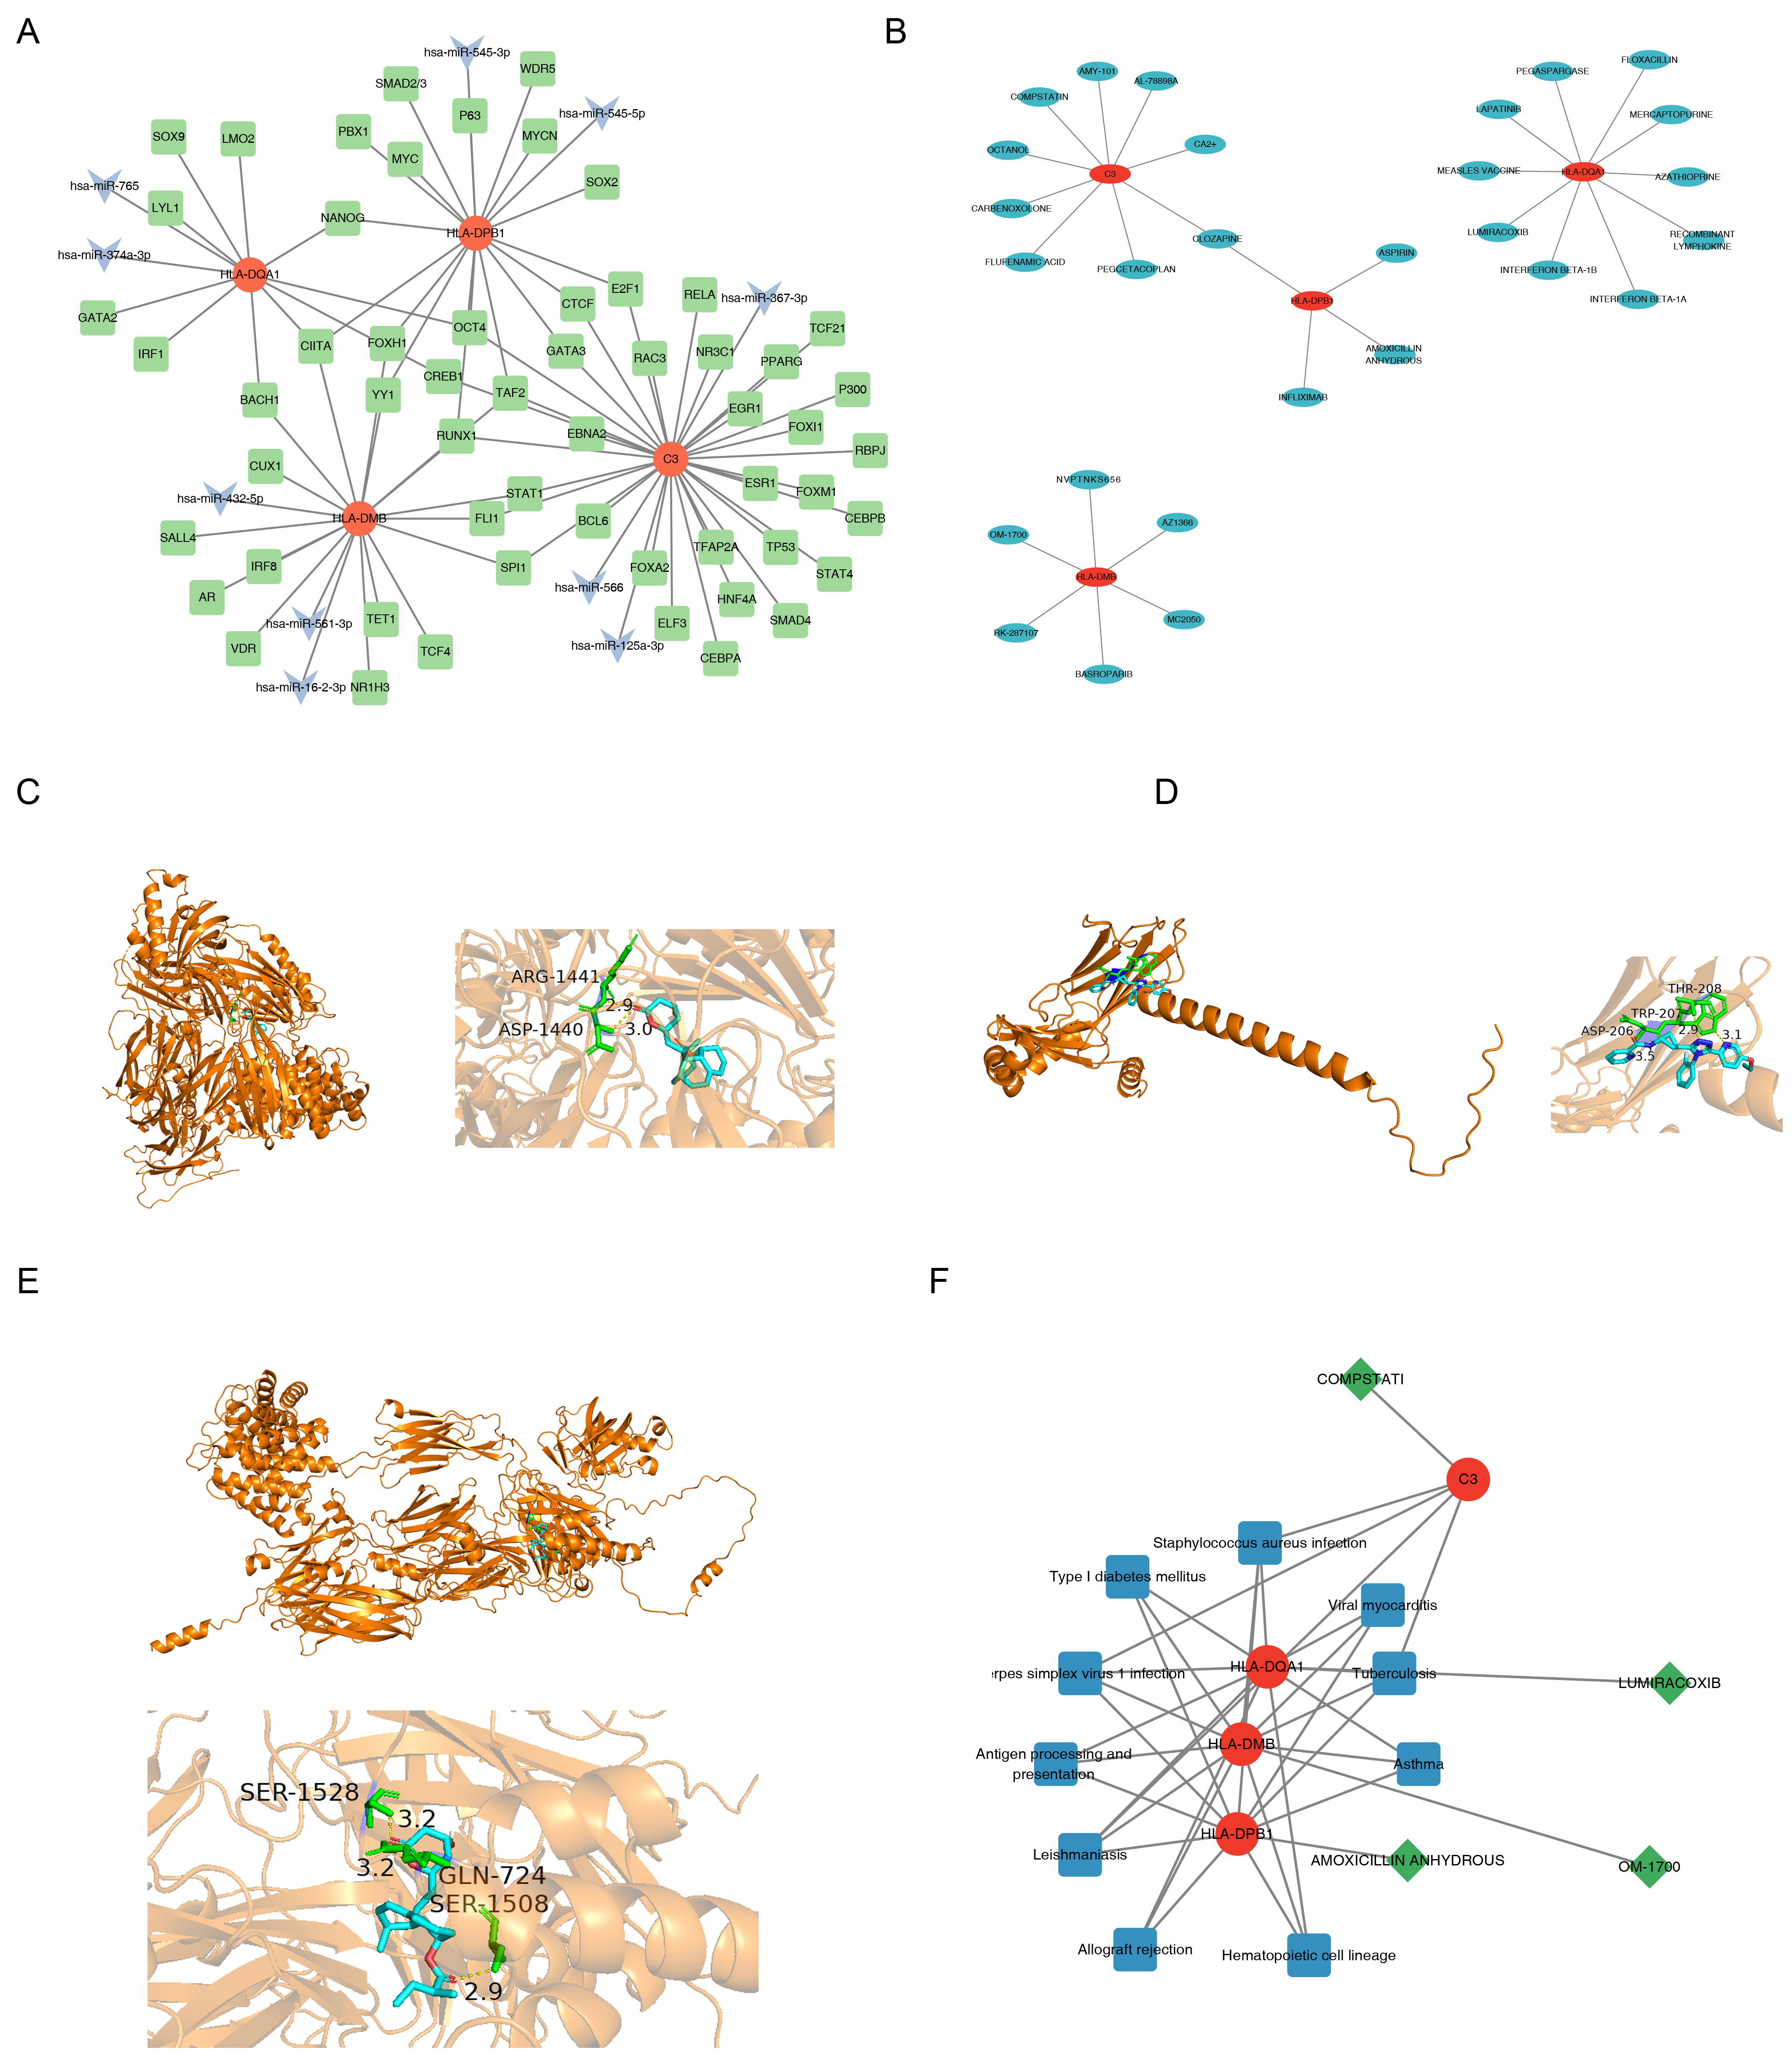
In the predicted miRNA–mRNA–TF network, the four candidate molecular correlates (C3, HLA-DMB, HLA-DPB1, and HLA-DQA1) were linked to multiple predicted miRNA and TF associations (Figure 5A). Notably, CIITA was associated with all three HLA genes. As a recognized master regulator and transcriptional coactivator of MHC class II gene expression, CIITA was identified as a common upstream regulator of the three candidate molecular correlates, HLA-DMB, HLA-DPB1, and HLA-DQA1 [43]. This predicted association was consistent with the established role of CIITA in MHC class II gene expression but did not establish a conserved regulatory axis in the analyzed CA samples. In addition, C3 was predicted to be targeted by 32 TFs and 3 miRNAs, including hsa-miR-125a-3p which has been previously linked to allergic airway inflammation, supporting the potential involvement of C3 in the immune-inflammatory network of CA. The three HLA candidate molecular correlates were also linked to multiple predicted TFs and two miRNAs each, forming a predicted association network related to antigen presentation. Based on DGIdb predictions, it was found that C3, HLA-DMB, HLA-DPB1, and HLA-DQA1 targeted nine, six, four, and 10 compounds respectively (Figure 5B). According to the predefined screening criteria for subsequent docking analysis, amoxicillin (an antibacterial agent) and lumiracoxib (a withdrawn compound with hepatotoxicity risk) were excluded from the molecular docking assay. Compstatin (associated with C3) and OM-1700 (associated with HLA-DMB) were selected as representative compounds for subsequent exploratory molecular docking analysis. The compounds with the highest interaction scores for each were compstatin, OM-1700, amoxicillin anhydrous, and lumiracoxib, respectively (Table S11). To further explore the theoretical structural compatibility of the selected compound–candidate molecular correlate pairs, molecular docking analysis was performed for compstatin–C3 and OM-1700–HLA-DMB. The Vina docking scores were −9.4 kcal/mol for C3–compstatin and −9.9 kcal/mol for HLA-DMB–OM-1700 (Table 2). For reference comparison, C4B–compstatin yielded a docking score of −10.6 kcal/mol, which was more favorable than that of C3–compstatin. This result indicated that the current docking analysis could not establish target specificity of compstatin for C3, particularly given the structural homology between C3 and C4B. The corresponding docking images are displayed in Figure 5C–E. These docking scores reflect theoretical structural compatibility only and should not be interpreted as evidence of target specificity, functional inhibition, or therapeutic efficacy. Moreover, the interaction between C3 and compstatin was linked to immune-related pathways such as Staphylococcus aureus infection (Figure 5F), whereas HLA-DMB–OM-1700 was associated with pathways including asthma and antigen processing and presentation. These compound–gene–pathway relationships were interpreted descriptively and require experimental validation.
Table 2.
Docking outcomes of candidate molecular correlates with candidate compounds.
Figure 4.
Relative immune signature enrichment and associations with candidate molecular correlates in CA. (A) Heatmap of ssGSEA enrichment scores for 28 immune cell-associated transcriptional signatures in CA and control samples. (B) Relative enrichment of immune signatures remaining significant after BH correction. (C) Spearman correlation between the FDR-significant immune signatures. ** p < 0.01; *** p < 0.001. (D) Spearman correlations between the four candidate molecular correlates and FDR-significant immune signatures.
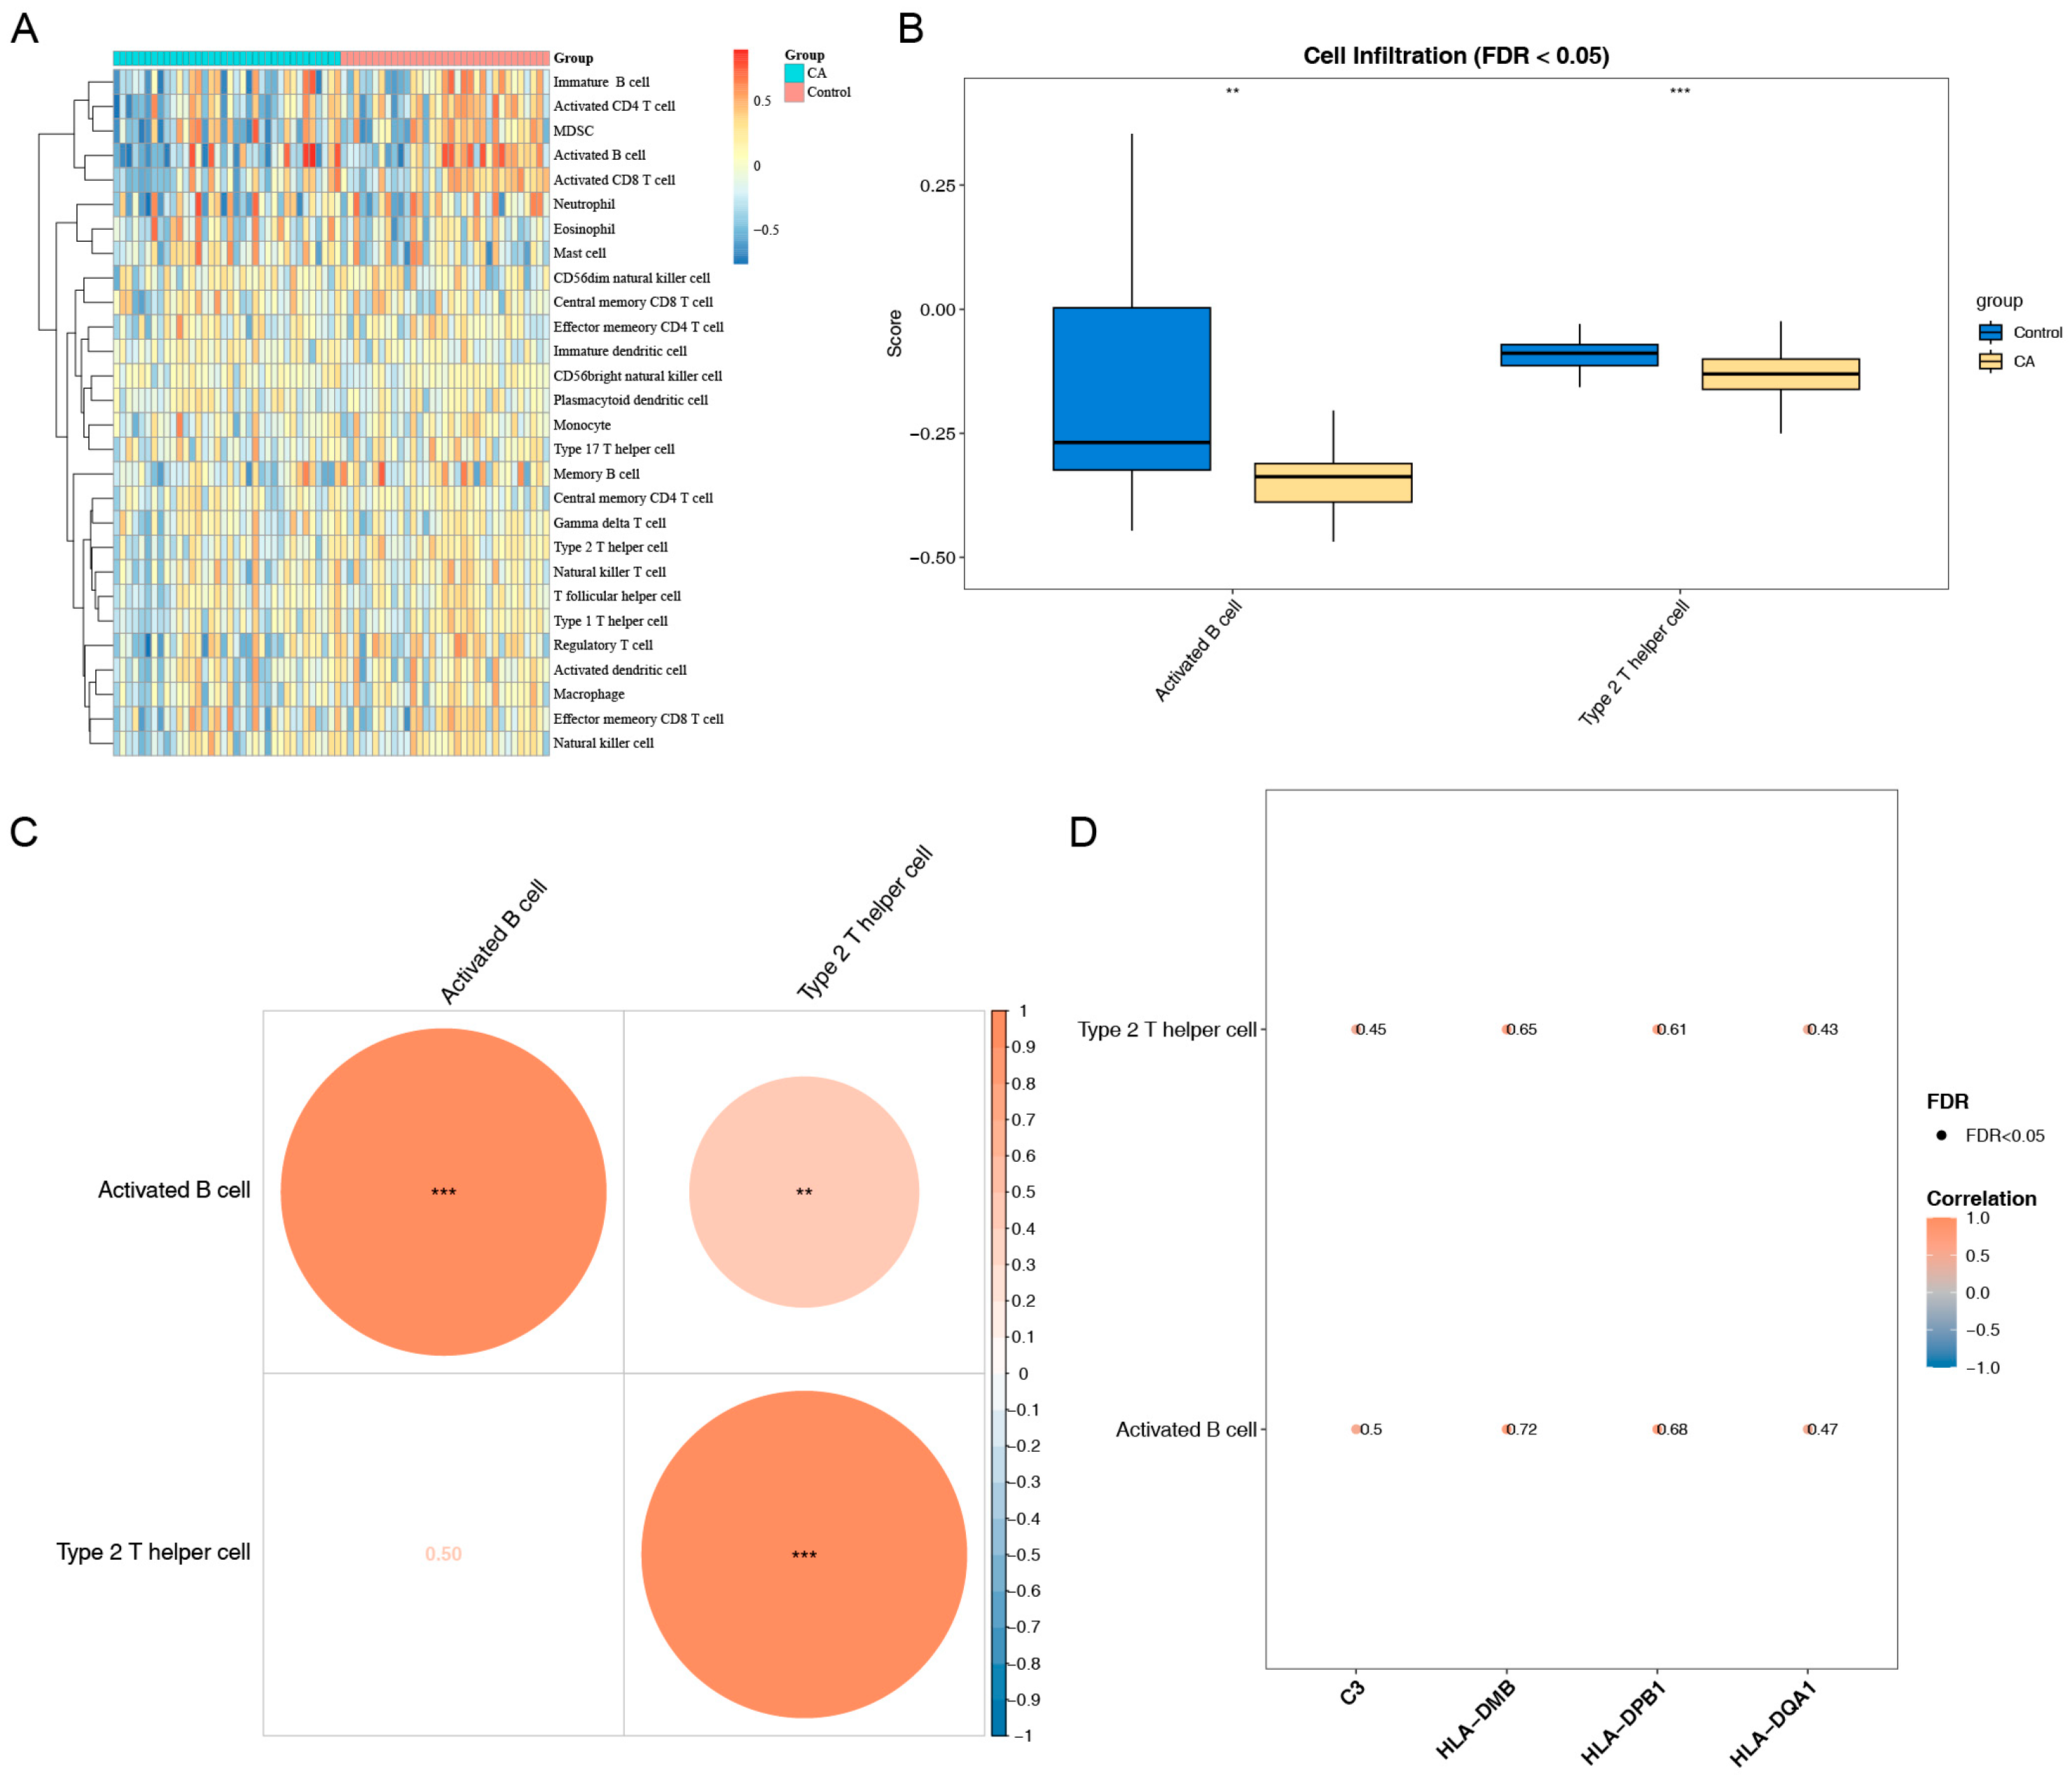
Figure 5.
Integrated miRNA–mRNA–TF network, drug/compound–target interactions, molecular docking, and pathway associations of the four CA candidate molecular correlates. (A) Predicted miRNA–mRNA–TF association network of the four candidate molecular correlates. (B) Predicted drug/compound–target interaction network for the four candidate molecular correlates. (C) Molecular docking model of C3 with compstatin. (D) Molecular docking model of HLA-DMB with OM-1700. (E) Molecular docking model of C4B with compstatin. (F) KEGG pathway associations of candidate molecular correlate–compound pairs.
3.8. Exploratory scRNA-Seq Characterization of Prioritized Dendritic Cells, Pseudotime Patterns, and Immune-Related Pathway Enrichment
To preliminarily explore the cellular context of the identified candidate molecular correlates, we performed descriptive expression mapping and trajectory analysis using the GSE254127 dataset. Given the very limited sample size and absence of control samples in the single-cell cohort, these analyses are strictly exploratory and intended only to generate cellular-level hypotheses for future validation. Expression distribution analysis showed that HLA-DMB, HLA-DPB1 and HLA-DQA1 were highly expressed in dendritic cells and B cells (Figure S7A). Furthermore, each candidate molecular correlate showed significant differences in expression between dendritic cells and most other annotated cell types (p < 0.001) (Figure S7B). Consequently, dendritic cells were prioritized for subsequent exploratory analyses because several candidate molecular correlates showed prominent expression in this cell type. Further secondary dimensionality reduction and pseudotime analysis of dendritic cells revealed that they were re-clustered into three subclusters, displaying a continuous developmental pathway extending from the root to multiple branches along the pseudotime trajectory, which was divided into six states (Figure S7C). Pseudotime expression dynamics revealed that the expression of C3 gradually decreased along pseudodevelopmental time, while the expression of HLA-DMB, HLA-DPB1, and HLA-DQA1 progressively increased (Figure S7D). These opposing expression trends were observed along the inferred dendritic-cell pseudotime trajectory but should not be interpreted as direct evidence of actual differentiation or activation transitions. Additionally, predicted TF activity patterns in dendritic cells showed elevated activities of STAT5A(+), PPARG(+), NR1H3(+), among others (Figure S7E). These predicted TF activity patterns provide candidate transcriptional associations for further investigation. It was further discovered that the marker genes of dendritic cells were predominantly enriched in immune-related pathways, including antigen processing and presentation, secretory granule lumen, and MHC class II protein complex binding (Figure S7F). KEGG analysis revealed that these marker genes were mainly enriched in key immune pathways such as phagosome and antigen processing and presentation (Figure S7G). These enrichment results were consistent with antigen-presentation, phagocytic, and immune-related functions of dendritic cells but did not establish a pivotal or CA-specific role. Compared to other annotated cells, dendritic cells exhibited significantly higher enrichment scores in multiple immune and signal transduction-related pathways, such as the JAK-STAT signaling pathway and leukocyte transendothelial migration (Figure S7H). These descriptive findings suggest that prioritized dendritic cells may provide a cellular context in which C3 and MHC-II-related genes are co-expressed, generating a hypothesis that warrants further evaluation in larger single-cell cohorts with matched healthy controls.
4. Discussion
In this study, we integrated scRNA-seq and bulk transcriptomic datasets to explore inferred intercellular communication patterns in airway samples from children with asthma. We first identified 67 ligand–receptor communication-associated genes from the available scRNA-seq samples without assuming that these patterns were CA-specific. By applying a multi-dimensional machine learning pipeline and conducting rigorous feature selection in an independent validation cohort, we successfully identified and validated four candidate core CA candidate molecular correlates including complement component C3, major histocompatibility complex class II (MHC-II)-related genes HLA-DMB, HLA-DPB1 and HLA-DQA1. These candidate molecular correlates were consistently downregulated in CA and were associated with altered relative enrichment of activated B-cell and type 2 T-helper-cell transcriptional signatures. Single-cell analyses further prioritized dendritic cells for exploratory characterization of candidate molecular correlate expression and antigen-presentation-related patterns. Collectively, these findings provide exploratory evidence of immune-related molecular associations in CA and generate hypotheses for future validation.
Because the scRNA-seq and bulk transcriptomic datasets were derived from airway mucosal and nasal epithelial samples, respectively, tissue and platform heterogeneity should be considered when interpreting the integrated findings. The cross-tissue analysis showed that the overall expression patterns of ligand–receptor-associated genes were positively correlated between the scRNA-seq pseudo-bulk profile and both nasal epithelial cohorts, supporting their use as an exploratory candidate set across datasets. However, this consistency was more evident for genes with higher detection rates, whereas lower-detection genes showed weaker cross-tissue concordance. In addition, differences in epithelial and immune marker expression indicated that the bulk nasal epithelial profiles contained mixed signals from multiple cell populations. Therefore, the integrated results should not be interpreted as direct equivalence between airway mucosal and nasal epithelial cellular environments.
In this study, the four core multi-omics-validated candidate molecular correlates (complement component C3, HLA-DMB, HLA-DPB1 and HLA-DQA1) reflect profound dysregulation at the interface between innate and adaptive immunity in the CA airway microenvironment. Their coordinated downregulation under the pathological context of CA provides critical insights into the chronic dyshomeostasis of the airway microenvironment. C3 serves as the central non-redundant effector of the complement cascade, whose cleavage products, including the anaphylatoxin C3a and opsonin C3b, exert well-characterized pro-inflammatory effects in bridging innate and adaptive immunity, driving eosinophil recruitment, amplifying Th2 allergic responses, and promoting airway hyperresponsiveness (AHR) [44]. Complement signaling has been well documented to drive eosinophil recruitment, amplify type 2 helper (Th2) immune responses, and promote AHR and airway tissue remodeling in asthma, with the C3a-C3aR axis identified as the most critical regulatory node mediating these pathological effects [45]. Accumulating epidemiological and mechanistic evidence further indicates that circulating and local tissue levels of C3 and its activation fragments are robustly associated with CA disease activity, risk of acute exacerbations, and small airway functional impairment [46,47]. In the present transcriptomic analysis, C3 was significantly downregulated. However, because mRNA abundance does not directly measure complement activation, this finding should be interpreted cautiously. It may reflect compensatory negative feedback, altered cellular composition, or functional exhaustion after persistent complement activation, rather than direct evidence of reduced complement activity. This more conservative interpretation raises the hypothesis that C3-related transcriptomic changes may be associated with epithelial–immune crosstalk in CA.
Importantly, the relationship between C3 transcript abundance and functional complement activity in the airway is not necessarily linear. C3 expression is subject to post-transcriptional regulation, and C3 mRNA levels can be uncoupled from C3 protein synthesis and secretion [48,49]. Furthermore, airway epithelial cells and macrophages are capable of local C3 synthesis, and local complement activation can occur independently of systemic or tissue-level C3 transcription [44]. Notably, GZMK+ CD8+ memory T cells, which are enriched in recurrent airway inflammatory diseases, can directly cleave C3 and other complement components to generate C3a, thereby amplifying complement activation independently of C3 transcription [50]. Therefore, reduced tissue-level C3 mRNA may also result from altered cellular composition, compensatory negative feedback, or functional exhaustion following persistent complement activation, rather than a genuine decline in complement activity. This interpretation is consistent with reports of enhanced complement activation in asthma and supports a model in which dysregulated C3-mediated epithelial–immune crosstalk contributes to the imbalance between inflammation persistence and epithelial repair in CA. Accordingly, C3 mRNA downregulation should be regarded as a marker of complement homeostasis dysregulation, rather than of reduced complement function. In the future, C3 protein, C3a/C3b fragments, and functional complement activity should be directly measured to evaluate the proposed associations among C3, MHC-II-related genes, and dendritic cells.
HLA-DMB, HLA-DPB1 and HLA-DQA1 are functionally connected components of the MHC-II antigen processing and presentation machinery. HLA-DMB participates in HLA-DM-mediated peptide editing and high-affinity antigen loading, whereas HLA-DPB1 and HLA-DQA1 encode structural chains of HLA-DP and HLA-DQ heterodimers that present exogenous antigens to CD4+ T cells [6,51,52,53]. In fact, HLA-DMB, HLA-DPB1 and HLA-DQA1 are all functionally non-redundant core genes that constitute the MHC-II antigen processing and presentation machinery. HLA-DMB catalyzes peptide exchange to enable high-affinity antigen loading. HLA-DPB1 and HLA-DQA1 directly participate in the assembly of MHC-II heterodimers that display exogenous antigens, and dictate the antigen recognition specificity and polarization trajectory of CD4+ T cells [14,54]. Genetic studies have implicated the HLA region in asthma susceptibility and immune endotypes, supporting the biological relevance of antigen-presentation pathways in CA [55]. In the current study, reduced expression of HLA-DMB, HLA-DPB1, and HLA-DQA1 may reflect differences in antigen-presentation-related transcriptional patterns. The functional consequences of these transcriptomic observations for allergen recognition, immune tolerance, and Th2/Th17-related responses require experimental validation [56,57,58].
GSEA based on the four candidate molecular correlates further identified immune-related pathways associated with their expression patterns in CA. Among the enriched pathways, TCR signaling and chemokine signaling are most directly aligned with the identified C3/MHC-II candidate molecular correlate axis, because they connect antigen presentation to T-cell activation and inflammatory-cell recruitment [59]. Meanwhile, GSVA revealed upregulation of neuropeptide hormone activity and regulation of FGFR signaling in the CA group, suggesting the involvement of neuro-immune-structural cell crosstalk and airway remodeling [44]. In contrast, the downregulation of DNA replication strand elongation and purine nucleotide biosynthesis may reflect impaired epithelial renewal or abnormal repair under chronic inflammatory stress [60,61]. Taken together, these pathway differences indicate that CA is not merely characterized by a simple increase in inflammation, but by integrated remodeling involving antigen presentation, immune-cell recruitment, neuro-structural cell communication, and epithelial repair imbalance. This focused pathway interpretation reinforces the biological plausibility of C3 and MHC-II-related molecules as candidate candidate molecular correlates of CA.
Remodeling of airway immune programs is an important feature of CA. After multiple-testing correction, the present study identified that activated B-cell and type 2 T-helper-cell signatures showed lower relative enrichment in CA and were positively associated with the four candidate molecular correlates, particularly HLA-DMB and HLA-DPB1. These findings should be interpreted as transcriptional associations rather than direct changes in immune-cell abundance. Previous studies have reported altered B-cell subsets in pediatric asthma and coordinated B-cell/Tph2/Tfh2 responses in allergic childhood asthma [62,63], while Th2 cells are well established as central mediators of type 2 inflammation in asthma [64]. Recent single-cell and genetic evidence further links MHC-II antigen-presentation programs in B cells and dendritic cells to T-cell activation in asthma [65]. Thus, the observed associations may reflect coordinated antigen-presentation and type 2 immune programs, but should be regarded as hypothesis-generating rather than evidence for a defined C3/MHC-II–dendritic-cell regulatory axis.
In this study, molecular docking was employed to evaluate only the theoretical in silico binding potential between candidate compounds and the identified core candidate molecular correlates. Molecular docking was used only to explore the theoretical structural compatibility of selected compound–protein pairs. The Vina scores were −9.4 kcal/mol for C3–compstatin, −9.9 kcal/mol for HLA-DMB–OM-1700, and −10.6 kcal/mol for the C4B–compstatin reference comparison. Notably, the more favorable score for C4B–compstatin than for C3–compstatin indicates that these calculations cannot establish target specificity. In addition, the docking analysis lacked independent replicate runs and rigorously matched positive and negative controls. The predicted interactions of OM-1700, HLA-DMB, C3-compstatin and C4B-compstatin should be interpreted more cautiously, because these docking results have not been validated by biochemical binding assays, cell-based functional assays, animal experiments, or clinical studies in CA. Therefore, the present docking analysis should be regarded as hypothesis-generating structural evidence for target-compound interaction screening, rather than as direct support for drug repurposing or clinical use in childhood asthma.
Single-cell expression mapping and pseudotime analysis provided descriptive observations of candidate molecular correlate expression in prioritized dendritic cells and along an inferred pseudotime trajectory. However, given the small sample size of the single-cell dataset and the absence of a control group, these cell-level findings remain exploratory and hypothesis-generating in nature and cannot support generalizable conclusions. Further validation in larger single-cell cohorts with well-designed controls is therefore required. As professional APCs bridging innate defense and adaptive immunity, DCs play a central role in allergen capture, antigen presentation and Th2/Th17 polarization in asthma [58,66]. Along the pseudotime trajectory constructed in this study, expression of the complement-related candidate molecular correlate C3 decreased progressively, while expression of HLA-DMB, HLA-DPB1 and HLA-DQA1 continuously increased. This reciprocal expression pattern was observed along the inferred pseudotime trajectory, compatible with DC transition from an early inflammatory state toward a more antigen-presenting phenotype, although functional validation is still required [11,67,68]. The developmental window of childhood immune maturation may influence dendritic-cell states and antigen-presentation-related processes [66,69]; however, pediatric specificity cannot be established from the current dataset. The SCENIC analysis identified predicted TF activity patterns involving STAT5A, PPARG, and NR1H3 in dendritic cells, which are connected to cytokine signaling, type 2 inflammation, lipid metabolism and antigen-presentation regulation [70,71,72]. Consistently, DC marker genes were enriched in MHC class II protein complex binding, antigen processing and presentation, phagosome, JAK-STAT signaling and leukocyte transendothelial migration pathways [68,73,74]. Collectively, these results support the prioritization of dendritic cells for further investigation and generate a hypothesis regarding associations among C3, MHC-II-related genes, and antigen-presentation-related programs.
Nevertheless, this study has certain limitations. First, the primary differential expression screening used nominal p values, not all of the final candidate molecular correlates remained significant after FDR correction; therefore, the four final candidate molecular correlates should be understood as computationally prioritized candidate candidate molecular correlates with hypothesis-generating capacity. Second, the single-cell RNA-seq dataset included only two CA patients and no healthy controls, and no additional dedicated doublet/ambient-RNA correction or per-sample CellChat reproducibility analysis was performed, which limits the generalizability of the single-cell-derived observations and precludes inference of CA-specific cellular or regulatory mechanisms. Third, although the nomogram was evaluated in the independent GSE152004 cohort, its discriminative performance in the validation cohort was relatively limited. Therefore, the predictive performance and generalizability of the nomogram should be interpreted cautiously and require further validation and refinement in larger, independent, and multicenter clinical cohorts. Fourth, a subset of the transcriptomic datasets utilized in this study were sourced from publicly accessible repositories. Furthermore, a proportion of the proposed mechanistic hypotheses were derived from computational inferences, with no orthogonal experimental validation performed in the current study. Finally, the molecular docking analysis lacked independent replicate runs and rigorously matched positive and negative controls, and the functional effects of the computationally predicted compound–protein interactions remain to be experimentally verified. To address the aforementioned limitations, future studies will reassess and validate the robustness of the candidate candidate molecular correlates in larger-scale, multicenter, prospective childhood asthma cohorts using pre-specified statistical analysis plans and FDR/multiple-testing correction. Meanwhile, the single-cell RNA sequencing cohorts will be expanded to include age-matched healthy controls and a larger number of childhood asthma patients, so as to validate single-cell-derived observations such as cell-type annotation, ligand–receptor communication, and pseudotime trajectories. In addition, the four-gene diagnostic nomogram will be subjected to external validation in independent clinical cohorts to systematically evaluate its generalization ability and diagnostic efficacy. For findings derived from public databases, cross-validation will be performed by integrating independent clinical samples with methods such as qPCR, immunohistochemistry, and flow cytometry. Regarding the mechanistic hypotheses, in vitro cell experiments and in vivo animal models will be employed to test the proposed associations among C3, MHC-II-related genes, and dendritic cells in antigen presentation, T-cell activation, complement activity, and airway epithelial remodeling. Finally, biochemical binding assays, cellular functional assays, animal models, and safety evaluations will be conducted for the computationally predicted small-molecule–target interactions, so as to clarify their functional phenotypic effects in the pathogenesis of childhood asthma and their potential therapeutic translational value.
5. Conclusions
In this study, integration of bulk and single-cell transcriptomic datasets identified differential expression and immunological associations of four ligand–receptor-related candidate molecular correlates in CA, including C3, HLA-DMB, HLA-DPB1, and HLA-DQA1. Dendritic cells were prioritized for subsequent single-cell analyses based on the expression patterns of these candidate molecular correlates, and the observed pseudotime and transcription factor activity patterns further characterized their cellular context. The four genes were consistently downregulated and showed associations with the relative enrichment of activated B-cell and type 2 T-helper-cell signatures, suggesting potential links between these molecular features and immune-related transcriptional changes in CA. Overall, these findings provide additional molecular insights into the immune heterogeneity of CA and support further evaluation of their relevance to disease stratification and diagnostic assessment; however, the mechanistic and clinical implications require further validation.
Supplementary Materials
The following supporting information can be downloaded at: https://www.mdpi.com/article/10.3390/biomedicines14112669/s1, Figure S1. Quality control of the GSE254127 dataset. (A) Violin plots show the distribution of gene counts (nFeature_RNA), total RNA counts (nCount_RNA), and mitochondrial gene percentage (percent.mt) before quality control. (B) Cell quality after screening. Violin plot showing the distribution of the nFeature_RNA, nCount_RNA, and percent.mt after quality control. (C) Identification of 2000 highly variable genes across the dataset. (D) Jackstraw plot identifying significant principal components (PCs). (E) Elbow plot determining the number of principal components to retain. (F) t-SNE plot of cell clusters based on the top 20 PCs. (G) Marker gene expression in identified cell types. (H) t-SNE plot showing cell type annotation. Figure S2. Assessment of sample distribution in the scRNA-seq dataset. (A) t-SNE visualization of cells colored by sample identity. (B) PCA visualization of cells colored by sample identity. Figure S3. Cell communication analysis. (A) Cell–cell communication network based on number of interactions. (B) Cell–cell communication network strength. (C) Ligand–receptor interactions and communication probabilities. Figure S4. Cross-tissue and cross-platform consistency assessment of ligand–receptor-associated genes. (A) Comparison of ligand–receptor-associated gene detectability between the airway mucosal scRNA-seq dataset and the GSE65204 nasal epithelial bulk dataset. (B) Spearman correlation of ligand–receptor-associated gene expression between the scRNA-seq pseudo-bulk profile and GSE65204. (C) Spearman correlation of ligand–receptor-associated gene expression between the scRNA-seq pseudo-bulk profile and GSE152004. (D) Comparison of representative epithelial and immune marker expression across the scRNA-seq pseudo-bulk profile and the two nasal epithelial bulk datasets. Figure S5. Cross-validation performance of the machine Learning and external-cohort evaluation of the nomogram. (A) Five-fold cross-validated AUCs with bootstrap 95% CIs for LASSO, SVM, RF, GLM, and XGBoost. (B) Nomogram constructed in GSE152004. (C) Bootstrap calibration curve of the nomogram. (D) ROC curve of the nomogram. (E) DCA curve of the nomogram. Figure S6. Distribution of bootstrap log2FC values for the four identified candidate molecular correlates. (A) Boxplot of bootstrap log2FC distributions across 100 resampling iterations, with 100% direction consistency labeled for each candidate molecular correlate. (B) Density plots of bootstrap log2FC values for each of the four candidate molecular correlates. Figure S7. Single-cell localization, dendritic-cell pseudotime patterns, predicted transcription factor activity, and pathway enrichment analysis. (A) t-SNE maps showing the spatial distribution of candidate molecular correlate expression across cell types. (B) Differential expression of candidate molecular correlates across 11 annotated cell types. **** p < 0.0001; ns, not significant. (C) Pseudotime trajectory of dendritic cells after reclustering. (D) Pseudotime expression dynamics of the four candidate molecular correlates. (E) SCENIC regulon heatmap showing transcription factor activity across cell types. (F) GO functional enrichment of dendritic-cell marker genes. (G) KEGG pathway enrichment of dendritic-cell marker genes. (H) GSVA pathway enrichment heatmap across 11 cell types. Table S1. Sample information of the two bulk transcriptome cohorts. Table S2. Complete differential marker genes for the annotated cell types. Table S3. Significant ligand–receptor interactions inferred by CellChat and ligand–receptor-related genes. Table S4. Sensitivity analyses of cross-tissue expression consistency for ligand–receptor-associated genes. Table S5. List of differentially expressed genes before and after Benjamini–Hochberg correction. Table S6. Functional enrichment results of the 11 ligand–receptor–related candidate genes. Table S7. Diagnostic performance parameters of the random forest model at the optimal cutoff determined by the Youden index. Table S8. Feature selection stability of the LASSO model across five-fold cross-validation. Table S9. Multivariable logistic regression coefficients, odds ratios, 95% confidence intervals, and p values for the candidate molecular correlate-based model in the GSE65204 training cohort. Table S10. Bootstrap resampling (100 iterations) for the stability of downregulation of the four candidate molecular correlates. Table S11. Predicted compound–candidate molecular correlate interactions based on DGIdb analysis.
Author Contributions
J.L. (Jizu Ling) finished conception of the design of this research and drafting the manuscript. C.L. and J.L. (Juanwei Li) helped finish the acquisition of data. X.Y. conducted the analysis and interpretation of data. W.Y. and L.W. finished the statistical analysis. Y.Z. helped finish the revision of manuscript for important intellectual content. All authors have read and agreed to the published version of the manuscript.
Funding
This study was sponsored and supported by Joint Research Fund-General Program of the Gansu Provincial Science and Technology Department (25JRRA1255), the First Hospital of Lanzhou University Intramural Fund-Youth Fund Program (ldyyyn2025-209), and the Research Program of the Provincial University Interdisciplinary Center for Artificial Intelligence in Traditional Chinese Medicine (Traditional Chinese Medicine Rehabilitation Research Direction), Gansu University of Chinese Medicine (ZYYRGZNXKJCZX-3-2026-3).
Institutional Review Board Statement
Not applicable.
Informed Consent Statement
Not applicable.
Data Availability Statement
The datasets analyzed in this study are publicly available in the Gene Expression Omnibus (GEO) under accession numbers GSE254127, GSE65204, and GSE152004. The original data presented in this study are available in Figshare at https://doi.org/10.6084/m9.figshare.34937740 accessed on 8 November 2026.
Conflicts of Interest
The authors declare no conflict of interest.
Abbreviations
| Abbreviation | Full term |
| CA | Childhood asthma |
| scRNA-seq | Single-cell RNA sequencing |
| RNA-seq | RNA sequencing |
| DEGs | Differentially expressed genes |
| HVGs | Highly variable genes |
| PCs | Principal components |
| GO | Gene Ontology |
| KEGG | Kyoto Encyclopedia of Genes and Genomes |
| PPI | Protein–protein interaction |
| ROC | Receiver operating characteristic |
| AUC | Area under the curve |
| GSEA | Gene set enrichment analysis |
| GSVA | Gene set variation analysis |
| ssGSEA | Single-sample gene set enrichment analysis |
| GGI | Gene–gene interaction |
| TF | Transcription factor |
| miRNA | MicroRNA |
| DCs | Dendritic cells |
| MHC-II | Major histocompatibility complex class II |
| GEO | Gene Expression Omnibus |
| QC | Quality Control |
| PCA | Principal Component Analysis |
| t-SNE | t-distributed Stochastic Neighborhood Embedding |
| FC | Fold Change |
| CCs | Cellular Components |
| MFs | Molecular Functions |
| BPs | Biological Processes |
| STRING | Search Tool for the Retrieval of Interacting Genes/Proteins |
| LASSO | Least Absolute Shrinkage and Selection Operator |
| SVM | Support Vector Machine |
| RF | Random Forest |
| GLM | Generalized Linear Mode |
| XGBoost | Extreme Gradient Boosting |
| PPV | Positive Predictive Value |
| NPV | Negative Predictive Value |
| cor | Correlation Coefficient |
| GeneMANIA | Gene Multiple Association Network Integration Algorithm |
| FDR | False Discovery Rate |
References
- Laubhahn, K.; Phelan, K.J.; Jackson, D.J.; Altman, M.C.; Schaub, B. What Have Mechanistic Studies Taught Us About Childhood Asthma? J. Allergy Clin. Immunol. Pract. 2023, 11, 684–692. [Google Scholar] [CrossRef] [Scilit] [PubMed]
- Pijnenburg, M.W.; Frey, U.; De Jongste, J.C.; Saglani, S. Childhood asthma: Pathogenesis and phenotypes. Eur. Respir. J. 2022, 59, 2100731. [Google Scholar] [CrossRef] [Scilit] [PubMed]
- Asher, M.I.; Rutter, C.E.; Bissell, K.; Chiang, C.-Y.; El Sony, A.; Ellwood, E.; Ellwood, P.; García-Marcos, L.; Marks, G.B.; Morales, E.; et al. Worldwide trends in the burden of asthma symptoms in school-aged children: Global Asthma Network Phase I cross-sectional study. Lancet 2021, 398, 1569–1580, Erratum in Lancet 2021, 398, 1686. [Google Scholar] [CrossRef] [Scilit] [PubMed]
- Gill, I.; Shah, A.; Lee, E.K.; Sommer, R.; Ross, K.; Bole, A.; Freedman, D. Community Interventions for Childhood Asthma ED Visits and Hospitalizations: A Systematic Review. Pediatrics 2022, 150, e2021054825. [Google Scholar] [CrossRef] [Scilit] [PubMed]
- Kim, T.H.; Kim, H.; Oh, J.; Kim, S.; Miligkos, M.; Yon, D.K.; Papadopoulos, N.G. Global burden of asthma among children and adolescents with projections to 2050: A comprehensive review and forecasted modeling study. Clin. Exp. Pediatr. 2025, 68, 329–343. [Google Scholar] [CrossRef] [Scilit] [PubMed]
- Bacharier, L.B.; Jackson, D.J. Biologics in the treatment of asthma in children and adolescents. J. Allergy Clin. Immunol. 2023, 151, 581–589. [Google Scholar] [CrossRef] [Scilit] [PubMed]
- Shipp, C.L.; Gergen, P.J.; Gern, J.E.; Matsui, E.C.; Guilbert, T.W. Asthma Management in Children. J. Allergy Clin. Immunol. Pract. 2023, 11, 9–18. [Google Scholar] [CrossRef] [Scilit] [PubMed]
- Mahmood, L.; Keskin, S.; Jefferson, A.A. Precision care in the treatment of pediatric asthma. Curr. Opin. Pediatr. 2024, 36, 304–309. [Google Scholar] [CrossRef] [Scilit] [PubMed]
- Lavere, P.F.; Phillips, K.M.; Hanania, N.A.; Adrish, M. Established and Emerging Asthma Biomarkers with a Focus on Biologic Trials: A Narrative Review. J. Pers. Med. 2025, 15, 370. [Google Scholar] [CrossRef] [Scilit] [PubMed]
- di Palmo, E.; Cantarelli, E.; Catelli, A.; Ricci, G.; Gallucci, M.; Miniaci, A.; Pession, A. The Predictive Role of Biomarkers and Genetics in Childhood Asthma Exacerbations. Int. J. Mol. Sci. 2021, 22, 4651. [Google Scholar] [CrossRef] [Scilit] [PubMed]
- Yu, X.; Li, L.; Cai, B.; Zhang, W.; Liu, Q.; Li, N.; Shi, X.; Yu, L.; Chen, R.; Qiu, C. Single-cell analysis reveals alterations in cellular composition and cell-cell communication associated with airway inflammation and remodeling in asthma. Respir. Res. 2024, 25, 76. [Google Scholar] [CrossRef] [Scilit] [PubMed]
- Xie, Z.; Li, X.; Mora, A. A Comparison of Cell-Cell Interaction Prediction Tools Based on scRNA-seq Data. Biomolecules 2023, 13, 1211. [Google Scholar] [CrossRef] [Scilit] [PubMed]
- Ma, F.; Zhang, S.; Song, L.; Wang, B.; Wei, L.; Zhang, F. Applications and analytical tools of cell communication based on ligand-receptor interactions at single cell level. Cell Biosci. 2021, 11, 121. [Google Scholar] [CrossRef] [Scilit] [PubMed]
- Xu, J.; Cao, S.; Xu, Y.; Chen, H.; Nian, S.; Li, L.; Liu, Q.; Xu, W.; Ye, Y.; Yuan, Q. The role of DC subgroups in the pathogenesis of asthma. Front. Immunol. 2024, 15, 1481989. [Google Scholar] [CrossRef] [Scilit] [PubMed]
- Saito, H.; Tamari, M.; Motomura, K.; Ikutani, M.; Nakae, S.; Matsumoto, K.; Morita, H. Omics in allergy and asthma. J. Allergy Clin. Immunol. 2024, 154, 1378–1390. [Google Scholar] [CrossRef] [Scilit] [PubMed]
- Tang, W.; Li, M.; Teng, F.; Cui, J.; Dong, J.; Wang, W. Single-cell RNA-sequencing in asthma research. Front. Immunol. 2022, 13, 988573. [Google Scholar] [CrossRef] [Scilit] [PubMed]
- Vieira Braga, F.A.; Kar, G.; Berg, M.; Carpaij, O.A.; Polanski, K.; Simon, L.M.; Brouwer, S.; Gomes, T.; Hesse, L.; Jiang, J.; et al. A cellular census of human lungs identifies novel cell states in health and in asthma. Nat. Med. 2019, 25, 1153–1163. [Google Scholar] [CrossRef] [Scilit] [PubMed]
- Zhu, D.; Li, G.; Yuan, L.; Zeng, Z.; Dong, N.; Wang, C.; Chen, M.; Xie, L.; Ding, G.; Shen, L.; et al. Single-cell RNA sequencing unraveled immune-related expression heterogeneity and lymphoid cell development dysregulation in childhood asthma. Front. Immunol. 2025, 16, 1606650. [Google Scholar] [CrossRef] [Scilit] [PubMed]
- Park, K.; Lee, J.H.; Shin, E.; Jang, H.Y.; Song, W.-J.; Kwon, H.-S.; Cho, Y.S.; Lee, J.E.; Adcock, I.; Chung, K.F.; et al. Single-cell RNA sequencing reveals transcriptional changes in circulating immune cells from patients with severe asthma induced by biologics. Exp. Mol. Med. 2024, 56, 2755–2762. [Google Scholar] [CrossRef] [Scilit] [PubMed]
- Zou, L.; Chen, K.; Hong, X.; Ye, B. Single-cell RNA sequencing reveals immunological link between house dust mite allergy and childhood asthma. Sci. Rep. 2025, 15, 16812. [Google Scholar] [CrossRef] [Scilit] [PubMed]
- Jovic, D.; Liang, X.; Zeng, H.; Lin, L.; Xu, F.; Luo, Y. Single-cell RNA sequencing technologies and applications: A brief overview. Clin. Transl. Med. 2022, 12, e694. [Google Scholar] [CrossRef] [Scilit] [PubMed]
- Kim, M.C.; Gate, R.; Lee, D.S.; Tolopko, A.; Lu, A.; Gordon, E.; Shifrut, E.; Garcia-Nieto, P.E.; Marson, A.; Ntranos, V.; et al. Method of moments framework for differential expression analysis of single-cell RNA sequencing data. Cell 2024, 187, 6393–6410.e16. [Google Scholar] [CrossRef] [Scilit] [PubMed]
- Kuksin, M.; Morel, D.; Aglave, M.; Danlos, F.-X.; Marabelle, A.; Zinovyev, A.; Gautheret, D.; Verlingue, L. Applications of single-cell and bulk RNA sequencing in onco-immunology. Eur. J. Cancer 2021, 149, 193–210. [Google Scholar] [CrossRef] [Scilit] [PubMed]
- Thind, A.S.; Monga, I.; Thakur, P.K.; Kumari, P.; Dindhoria, K.; Krzak, M.; Ranson, M.; Ashford, B. Demystifying emerging bulk RNA-Seq applications: The application and utility of bioinformatic methodology. Brief. Bioinform. 2021, 22. [Google Scholar] [CrossRef] [Scilit] [PubMed]
- Hao, Y.; Stuart, T.; Kowalski, M.H.; Choudhary, S.; Hoffman, P.; Hartman, A.; Srivastava, A.; Molla, G.; Madad, S.; Fernandez-Granda, C.; et al. Dictionary learning for integrative, multimodal and scalable single-cell analysis. Nat. Biotechnol. 2024, 42, 293–304. [Google Scholar] [CrossRef] [Scilit] [PubMed]
- Jin, S.; Guerrero-Juarez, C.F.; Zhang, L.; Chang, I.; Ramos, R.; Kuan, C.-H.; Myung, P.; Plikus, M.V.; Nie, Q. Inference and analysis of cell-cell communication using CellChat. Nat. Commun. 2021, 12, 1088. [Google Scholar] [CrossRef] [Scilit] [PubMed]
- Ritchie, M.E.; Phipson, B.; Wu, D.; Hu, Y.; Law, C.W.; Shi, W.; Smyth, G.K. limma powers differential expression analyses for RNA-sequencing and microarray studies. Nucleic Acids Res. 2015, 43, e47. [Google Scholar] [CrossRef] [Scilit] [PubMed]
- Gu, Z.; Eils, R.; Schlesner, M. Complex heatmaps reveal patterns and correlations in multidimensional genomic data. Bioinformatics 2016, 32, 2847–2849. [Google Scholar] [CrossRef] [Scilit] [PubMed]
- Gao, C.H.; Yu, G.; Cai, P. ggVennDiagram: An Intuitive, Easy-to-Use, and Highly Customizable R Package to Generate Venn Diagram. Front. Genet. 2021, 12, 706907. [Google Scholar] [CrossRef] [Scilit] [PubMed]
- Wu, T.; Hu, E.; Xu, S.; Chen, M.; Guo, P.; Dai, Z.; Feng, T.; Zhou, L.; Tang, W.; Zhan, L.; et al. clusterProfiler 4.0: A universal enrichment tool for interpreting omics data. Innovation 2021, 2, 100141. [Google Scholar] [CrossRef] [Scilit] [PubMed]
- Shannon, P.; Markiel, A.; Ozier, O.; Baliga, N.S.; Wang, J.T.; Ramage, D.; Amin, N.; Schwikowski, B.; Ideker, T. Cytoscape: A software environment for integrated models of biomolecular interaction networks. Genome Res. 2003, 13, 2498–2504. [Google Scholar] [CrossRef] [Scilit] [PubMed]
- Kuhn, M. Building predictive models in R using the caret package. J. Stat. Softw. 2008, 28, 1–26. [Google Scholar] [CrossRef] [Scilit]
- Guan, C.; Ma, F.; Chang, S.; Zhang, J. Interpretable machine learning models for predicting venous thromboembolism in the intensive care unit: An analysis based on data from 207 centers. Crit. Care 2023, 27, 406. [Google Scholar] [CrossRef] [Scilit] [PubMed]
- Robin, X.; Turck, N.; Hainard, A.; Tiberti, N.; Lisacek, F.; Sanchez, J.-C.; Müller, M. pROC: An open-source package for R and S+ to analyze and compare ROC curves. BMC Bioinform. 2011, 12, 77. [Google Scholar] [CrossRef] [Scilit] [PubMed]
- Zhang, H.; Meltzer, P.; Davis, S. RCircos: An R package for Circos 2D track plots. BMC Bioinform. 2013, 14, 244. [Google Scholar] [CrossRef] [Scilit] [PubMed]
- Yu, G. Gene Ontology Semantic Similarity Analysis Using GOSemSim. Methods Mol. Biol. 2020, 2117, 207–215. [Google Scholar] [CrossRef] [Scilit] [PubMed]
- Hanzelmann, S.; Castelo, R.; Guinney, J. GSVA: Gene set variation analysis for microarray and RNA-seq data. BMC Bioinform. 2013, 14, 7. [Google Scholar] [CrossRef] [Scilit] [PubMed]
- Zeng, D.; Ye, Z.; Shen, R.; Yu, G.; Wu, J.; Xiong, Y.; Zhou, R.; Qiu, W.; Huang, N.; Sun, L.; et al. IOBR: Multi-Omics Immuno-Oncology Biological Research to Decode Tumor Microenvironment and Signatures. Front. Immunol. 2021, 12, 687975. [Google Scholar] [CrossRef] [Scilit] [PubMed]
- Ru, Y.; Kechris, K.J.; Tabakoff, B.; Hoffman, P.; Radcliffe, R.A.; Bowler, R.; Mahaffey, S.; Rossi, S.; Calin, G.A.; Bemis, L.; et al. The multiMiR R package and database: Integration of microRNA-target interactions along with their disease and drug associations. Nucleic Acids Res. 2014, 42, e133. [Google Scholar] [CrossRef] [Scilit] [PubMed]
- Seeliger, D.; de Groot, B.L. Ligand docking and binding site analysis with PyMOL and Autodock/Vina. J. Comput. Aided Mol. Des. 2010, 24, 417–422. [Google Scholar] [CrossRef] [Scilit] [PubMed]
- Trapnell, C.; Cacchiarelli, D.; Grimsby, J.; Pokharel, P.; Li, S.; Morse, M.; Lennon, N.J.; Livak, K.J.; Mikkelsen, T.S.; Rinn, J.L. The dynamics and regulators of cell fate decisions are revealed by pseudotemporal ordering of single cells. Nat. Biotechnol. 2014, 32, 381–386. [Google Scholar] [CrossRef] [Scilit] [PubMed]
- Kumar, N.; Mishra, B.; Athar, M.; Mukhtar, S. Inference of Gene Regulatory Network from Single-Cell Transcriptomic Data Using pySCENIC. Methods Mol. Biol. 2021, 2328, 171–182, Erratum in Methods Mol. Biol. 2021, 2328, C1. [Google Scholar] [CrossRef] [Scilit] [PubMed]
- Krawczyk, M.; Seguin-Estévez, Q.; Leimgruber, E.; Sperisen, P.; Schmid, C.; Bucher, P.; Reith, W. Identification of CIITA regulated genetic module dedicated for antigen presentation. PLoS Genet. 2008, 4, e1000058. [Google Scholar] [CrossRef] [Scilit] [PubMed]
- Kulkarni, H.S.; Liszewski, M.K.; Brody, S.L.; Atkinson, J.P. The complement system in the airway epithelium: An overlooked host defense mechanism and therapeutic target? J. Allergy Clin. Immunol. 2018, 141, 1582–1586.e1. [Google Scholar] [CrossRef] [Scilit] [PubMed]
- Tornyi, I.; Horvath, I. Role of Complement Components in Asthma: A Systematic Review. J. Clin. Med. 2024, 13, 3044. [Google Scholar] [CrossRef] [Scilit] [PubMed]
- Vedel-Krogh, S.; Rasmussen, K.L.; Nordestgaard, B.G.; Nielsen, S.F. Complement C3 and allergic asthma: A cohort study of the general population. Eur. Respir. J. 2021, 57, 2000645. [Google Scholar] [CrossRef] [Scilit] [PubMed]
- Kokelj, S.; Östling, J.; Fromell, K.; Ekdahl, K.N.; Nilsson, B.; Olsson, H.K.; Olin, A. The association between complement C3 and small airway impairment in asthma. Eur. Respir. J. 2022, 60, 1604. [Google Scholar] [CrossRef] [Scilit]
- Goldman, M.B.; Knovich, M.A.; Goldman, J.N. Immunologic control of C3 gene expression in tissue macrophages. J. Immunol. 1991, 147, 4248–4255. [Google Scholar] [CrossRef] [Scilit]
- Lappin, D.F.; Birnie, G.D.; Whaley, K. Interferon-mediated transcriptional and post-transcriptional modulation of complement gene expression in human monocytes. Eur. J. Biochem. 1990, 194, 177–184. [Google Scholar] [CrossRef] [Scilit] [PubMed]
- Lan, F.; Li, J.; Miao, W.; Sun, F.; Duan, S.; Song, Y.; Yao, J.; Wang, X.; Wang, C.; Liu, X.; et al. GZMK-expressing CD8+ T cells promote recurrent airway inflammatory diseases. Nature 2025, 638, 490–498, Erratum in Nature 2025, 638, E45. [Google Scholar] [CrossRef] [Scilit] [PubMed]
- Alvaro-Benito, M.; Wieczorek, M.; Sticht, J.; Kipar, C.; Freund, C. HLA-DMA polymorphisms differentially affect MHC class II peptide loading. J. Immunol. 2015, 194, 803–816. [Google Scholar] [CrossRef] [Scilit] [PubMed]
- Wosen, J.E.; Mukhopadhyay, D.; Macaubas, C.; Mellins, E.D. Epithelial MHC Class II Expression and Its Role in Antigen Presentation in the Gastrointestinal and Respiratory Tracts. Front. Immunol. 2018, 9, 2144. [Google Scholar] [CrossRef] [Scilit] [PubMed]
- Yin, Y.; Soe, N.N.; Valenzuela, N.M.; Reed, E.F.; Zhang, Q. HLA-DPB1 genotype variants predict DP molecule cell surface expression and DP donor specific antibody binding capacity. Front. Immunol. 2023, 14, 1328533. [Google Scholar] [CrossRef] [Scilit] [PubMed]
- Ranjbar, M.; Whetstone, C.E.; Omer, H.; Power, L.; Cusack, R.P.; Gauvreau, G.M. The Genetic Factors of the Airway Epithelium Associated with the Pathology of Asthma. Genes 2022, 13, 1870. [Google Scholar] [CrossRef] [Scilit] [PubMed]
- Waage, J.; Standl, M.; Curtin, J.A.; Jessen, L.E.; Thorsen, J.; Tian, C.; Schoettler, N.; Flores, C.; Abdellaoui, A.; Ahluwalia, T.S.; et al. Genome-wide association and HLA fine-mapping studies identify risk loci and genetic pathways underlying allergic rhinitis. Nat. Genet. 2018, 50, 1072–1080, Erratum in Nat. Genet. 2018, 50, 1343. [Google Scholar] [CrossRef] [Scilit] [PubMed]
- Chambers, E.S.; Nanzer, A.M.; Pfeffer, P.E.; Richards, D.F.; Martineau, A.R.; Griffiths, C.J.; Corrigan, C.J.; Hawrylowicz, C.M. Dendritic cell phenotype in severe asthma reflects clinical responsiveness to glucocorticoids. Clin. Exp. Allergy 2018, 48, 13–22. [Google Scholar] [CrossRef] [Scilit] [PubMed]
- Handunnetthi, L.; Ramagopalan, S.V.; Ebers, G.C.; Knight, J.C. Regulation of major histocompatibility complex class II gene expression, genetic variation and disease. Genes Immun. 2010, 11, 99–112. [Google Scholar] [CrossRef] [Scilit] [PubMed]
- Morianos, I.; Semitekolou, M. Dendritic Cells: Critical Regulators of Allergic Asthma. Int. J. Mol. Sci. 2020, 21, 7930. [Google Scholar] [CrossRef] [Scilit] [PubMed]
- Hosseini, B.; Berthon, B.S.; Starkey, M.R.; Collison, A.; McLoughlin, R.F.; Williams, E.J.; Nichol, K.; Wark, P.A.; Jensen, M.E.; Sena, C.R.D.S.; et al. Children With Asthma Have Impaired Innate Immunity and Increased Numbers of Type 2 Innate Lymphoid Cells Compared With Healthy Controls. Front. Immunol. 2021, 12, 664668. [Google Scholar] [CrossRef] [Scilit] [PubMed]
- Calven, J.; Ax, E.; Radinger, M. The Airway Epithelium-A Central Player in Asthma Pathogenesis. Int. J. Mol. Sci. 2020, 21, 8907. [Google Scholar] [CrossRef] [Scilit] [PubMed]
- Raby, K.L.; Michaeloudes, C.; Tonkin, J.; Chung, K.F.; Bhavsar, P.K. Mechanisms of airway epithelial injury and abnormal repair in asthma and COPD. Front. Immunol. 2023, 14, 1201658. [Google Scholar] [CrossRef] [Scilit] [PubMed]
- Sheehan, W.J.; Maghzian, N.; Rastogi, D.; Bollard, C.M.; Lin, A.A. Decreased regulatory B cells in pediatric patients with asthma. Ann. Allergy Asthma Immunol. 2023, 131, 120–121. [Google Scholar] [CrossRef] [Scilit] [PubMed]
- Zhu, Y.; Jiang, Q.; Lei, C.; Yu, Q.; Qiu, L. The response of CD27+CD38+ plasmablasts, CD24hiCD38hi transitional B cells, CXCR5-ICOS+PD-1+ Tph, Tph2 and Tfh2 subtypes to allergens in children with allergic asthma. BMC Pediatr. 2024, 24, 154. [Google Scholar] [CrossRef] [Scilit] [PubMed]
- Harker, J.A.; Lloyd, C.M. T helper 2 cells in asthma. J. Exp. Med. 2023, 220, e20221094. [Google Scholar] [CrossRef] [Scilit] [PubMed]
- Qian, G.; Xu, Q.; Zhu, X.; Tao, Y.; Ding, X.; Zhu, H.; Zhang, S.; Zhan, Q.; Xu, S.; Song, Y.; et al. Genetic and cross-species single-cell analyses prioritize CD83 in antigen-presenting cells as a candidate therapeutic target in asthma. Front. Immunol. 2026, 17, 1859076. [Google Scholar] [CrossRef] [Scilit] [PubMed]
- Coenen, I.; Jones, A.C.; White, A.A.; Takashima, M.; Lee, W.R.; Wong, M.D.; Vilcins, D.; Kadolsky, U.; Cheema, A.S.; Saxena, A.; et al. Reduced Type-I Interferon by Plasmacytoid Dendritic Cells and Asthma in School-Aged Children. Allergy 2026, 81, 109–120. [Google Scholar] [CrossRef] [Scilit] [PubMed]
- Rodriguez-Gonzalez, D.; Guillen-Sanchez, G.; Del Pozo, V.; Cañas, J.A. Single-Cell Analysis: A Method for In-Depth Phenotyping of Cells Involved in Asthma. Int. J. Mol. Sci. 2024, 25, 12633. [Google Scholar] [CrossRef] [Scilit] [PubMed]
- Xiang, J.; Liu, B.; Li, Y.; Ren, Y.; Li, Y.; Zhou, M.; Yu, J.; Luo, Z.; Liu, E.; Fu, Z.; et al. TFEB regulates dendritic cell antigen presentation to modulate immune balance in asthma. Respir. Res. 2024, 25, 182. [Google Scholar] [CrossRef] [Scilit] [PubMed]
- Medeleanu, M.V.; Qian, Y.C.; Moraes, T.J.; Subbarao, P. Early-immune development in asthma: A review of the literature. Cell Immunol. 2023, 393–394, 104770. [Google Scholar] [CrossRef] [Scilit] [PubMed]
- Able, A.A.; Burrell, J.A.; Stephens, J.M. STAT5-Interacting Proteins: A Synopsis of Proteins that Regulate STAT5 Activity. Biology 2017, 6, 20. [Google Scholar] [CrossRef] [Scilit] [PubMed]
- Glaria, E.; Letelier, N.A.; Valledor, A.F. Integrating the roles of liver X receptors in inflammation and infection: Mechanisms and outcomes. Curr. Opin. Pharmacol. 2020, 53, 55–65. [Google Scholar] [CrossRef] [Scilit] [PubMed]
- Stark, J.M.; Coquet, J.M.; Tibbitt, C.A. The Role of PPAR-gamma in Allergic Disease. Curr. Allergy Asthma Rep. 2021, 21, 45. [Google Scholar] [CrossRef] [Scilit] [PubMed]
- Liu, T.T.; Zhang, Z.; Deng, J.; Shi, C.-Y.; Zheng, S.; Jia, L.-X.; Du, J.; Piao, C. CXCL16 knockout inhibit asthma airway inflammation by suppressing H2-DM molecular mediated antigen presentation. Cell Death Discov. 2025, 11, 90. [Google Scholar] [CrossRef] [Scilit] [PubMed]
- Wu, W.; Ding, F.; Li, Y.; Fu, Z. CXCL14 increase dendritic cell antigen presentation and promote asthma immune response. Pediatr. Discov. 2025, 3, e2514. [Google Scholar] [CrossRef] [Scilit] [PubMed]
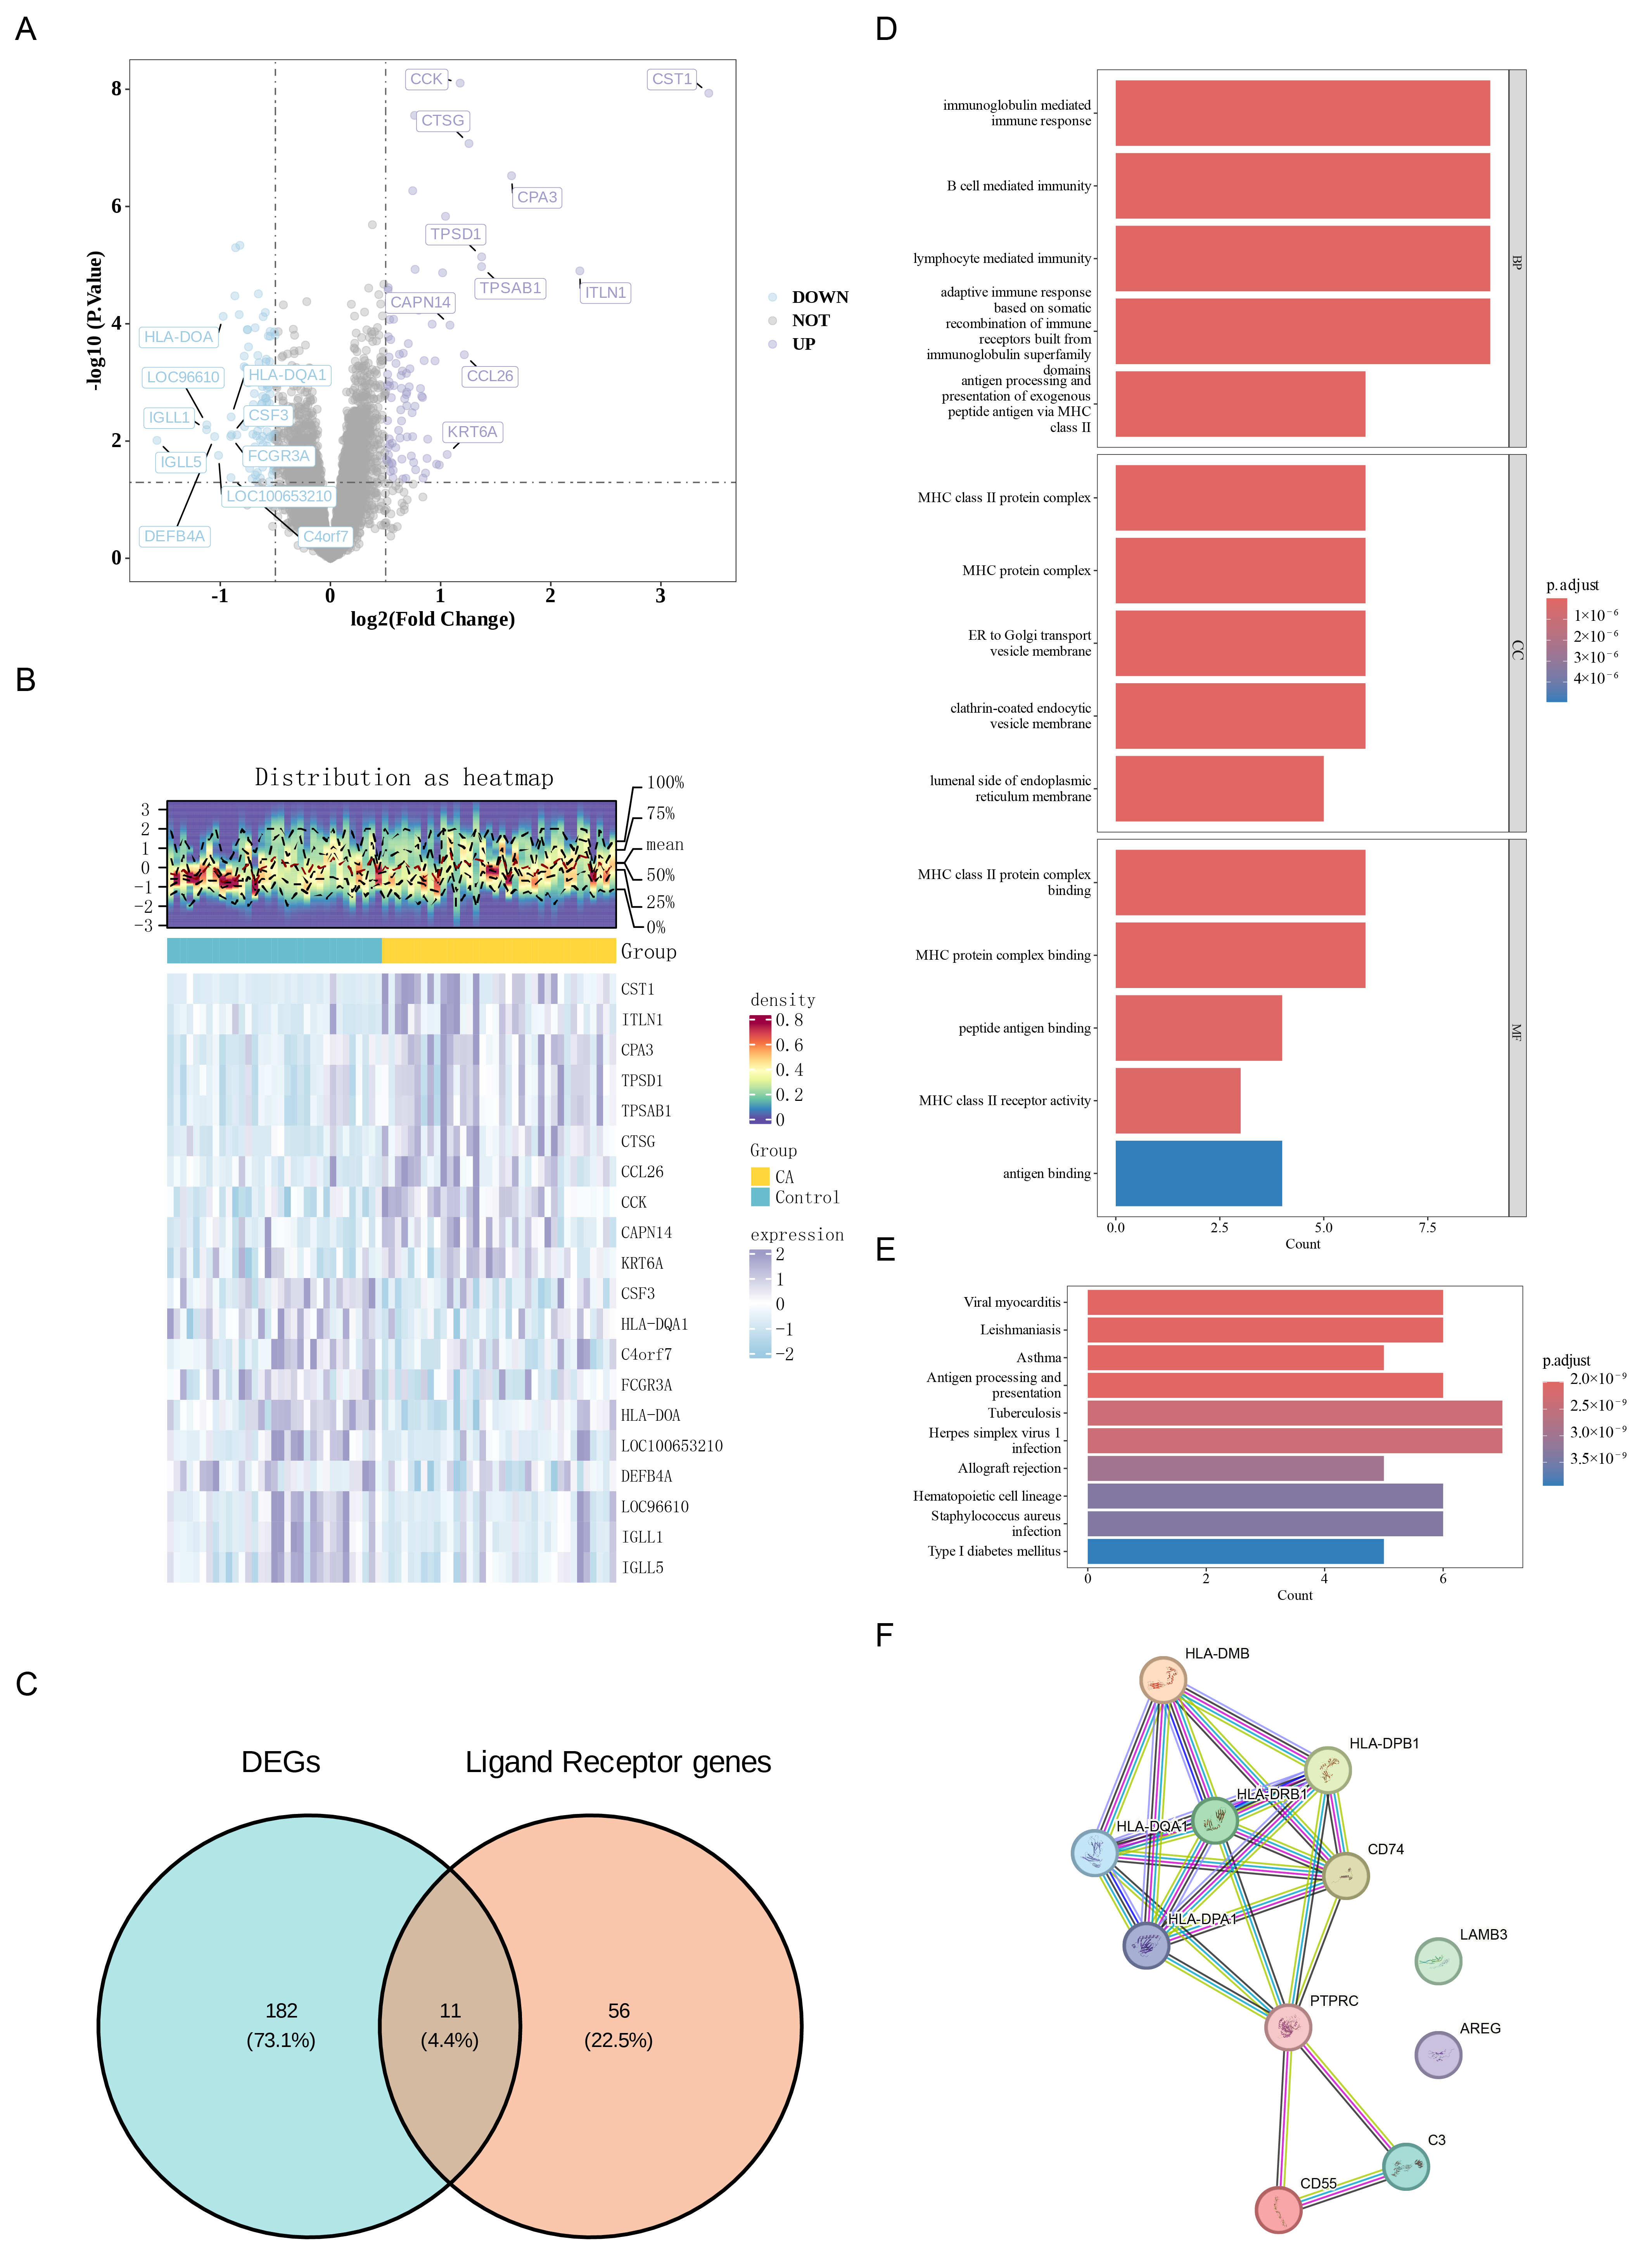
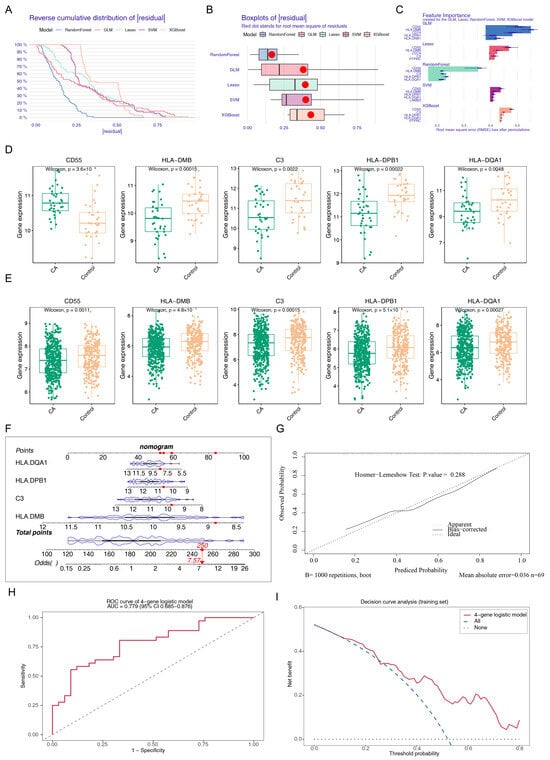
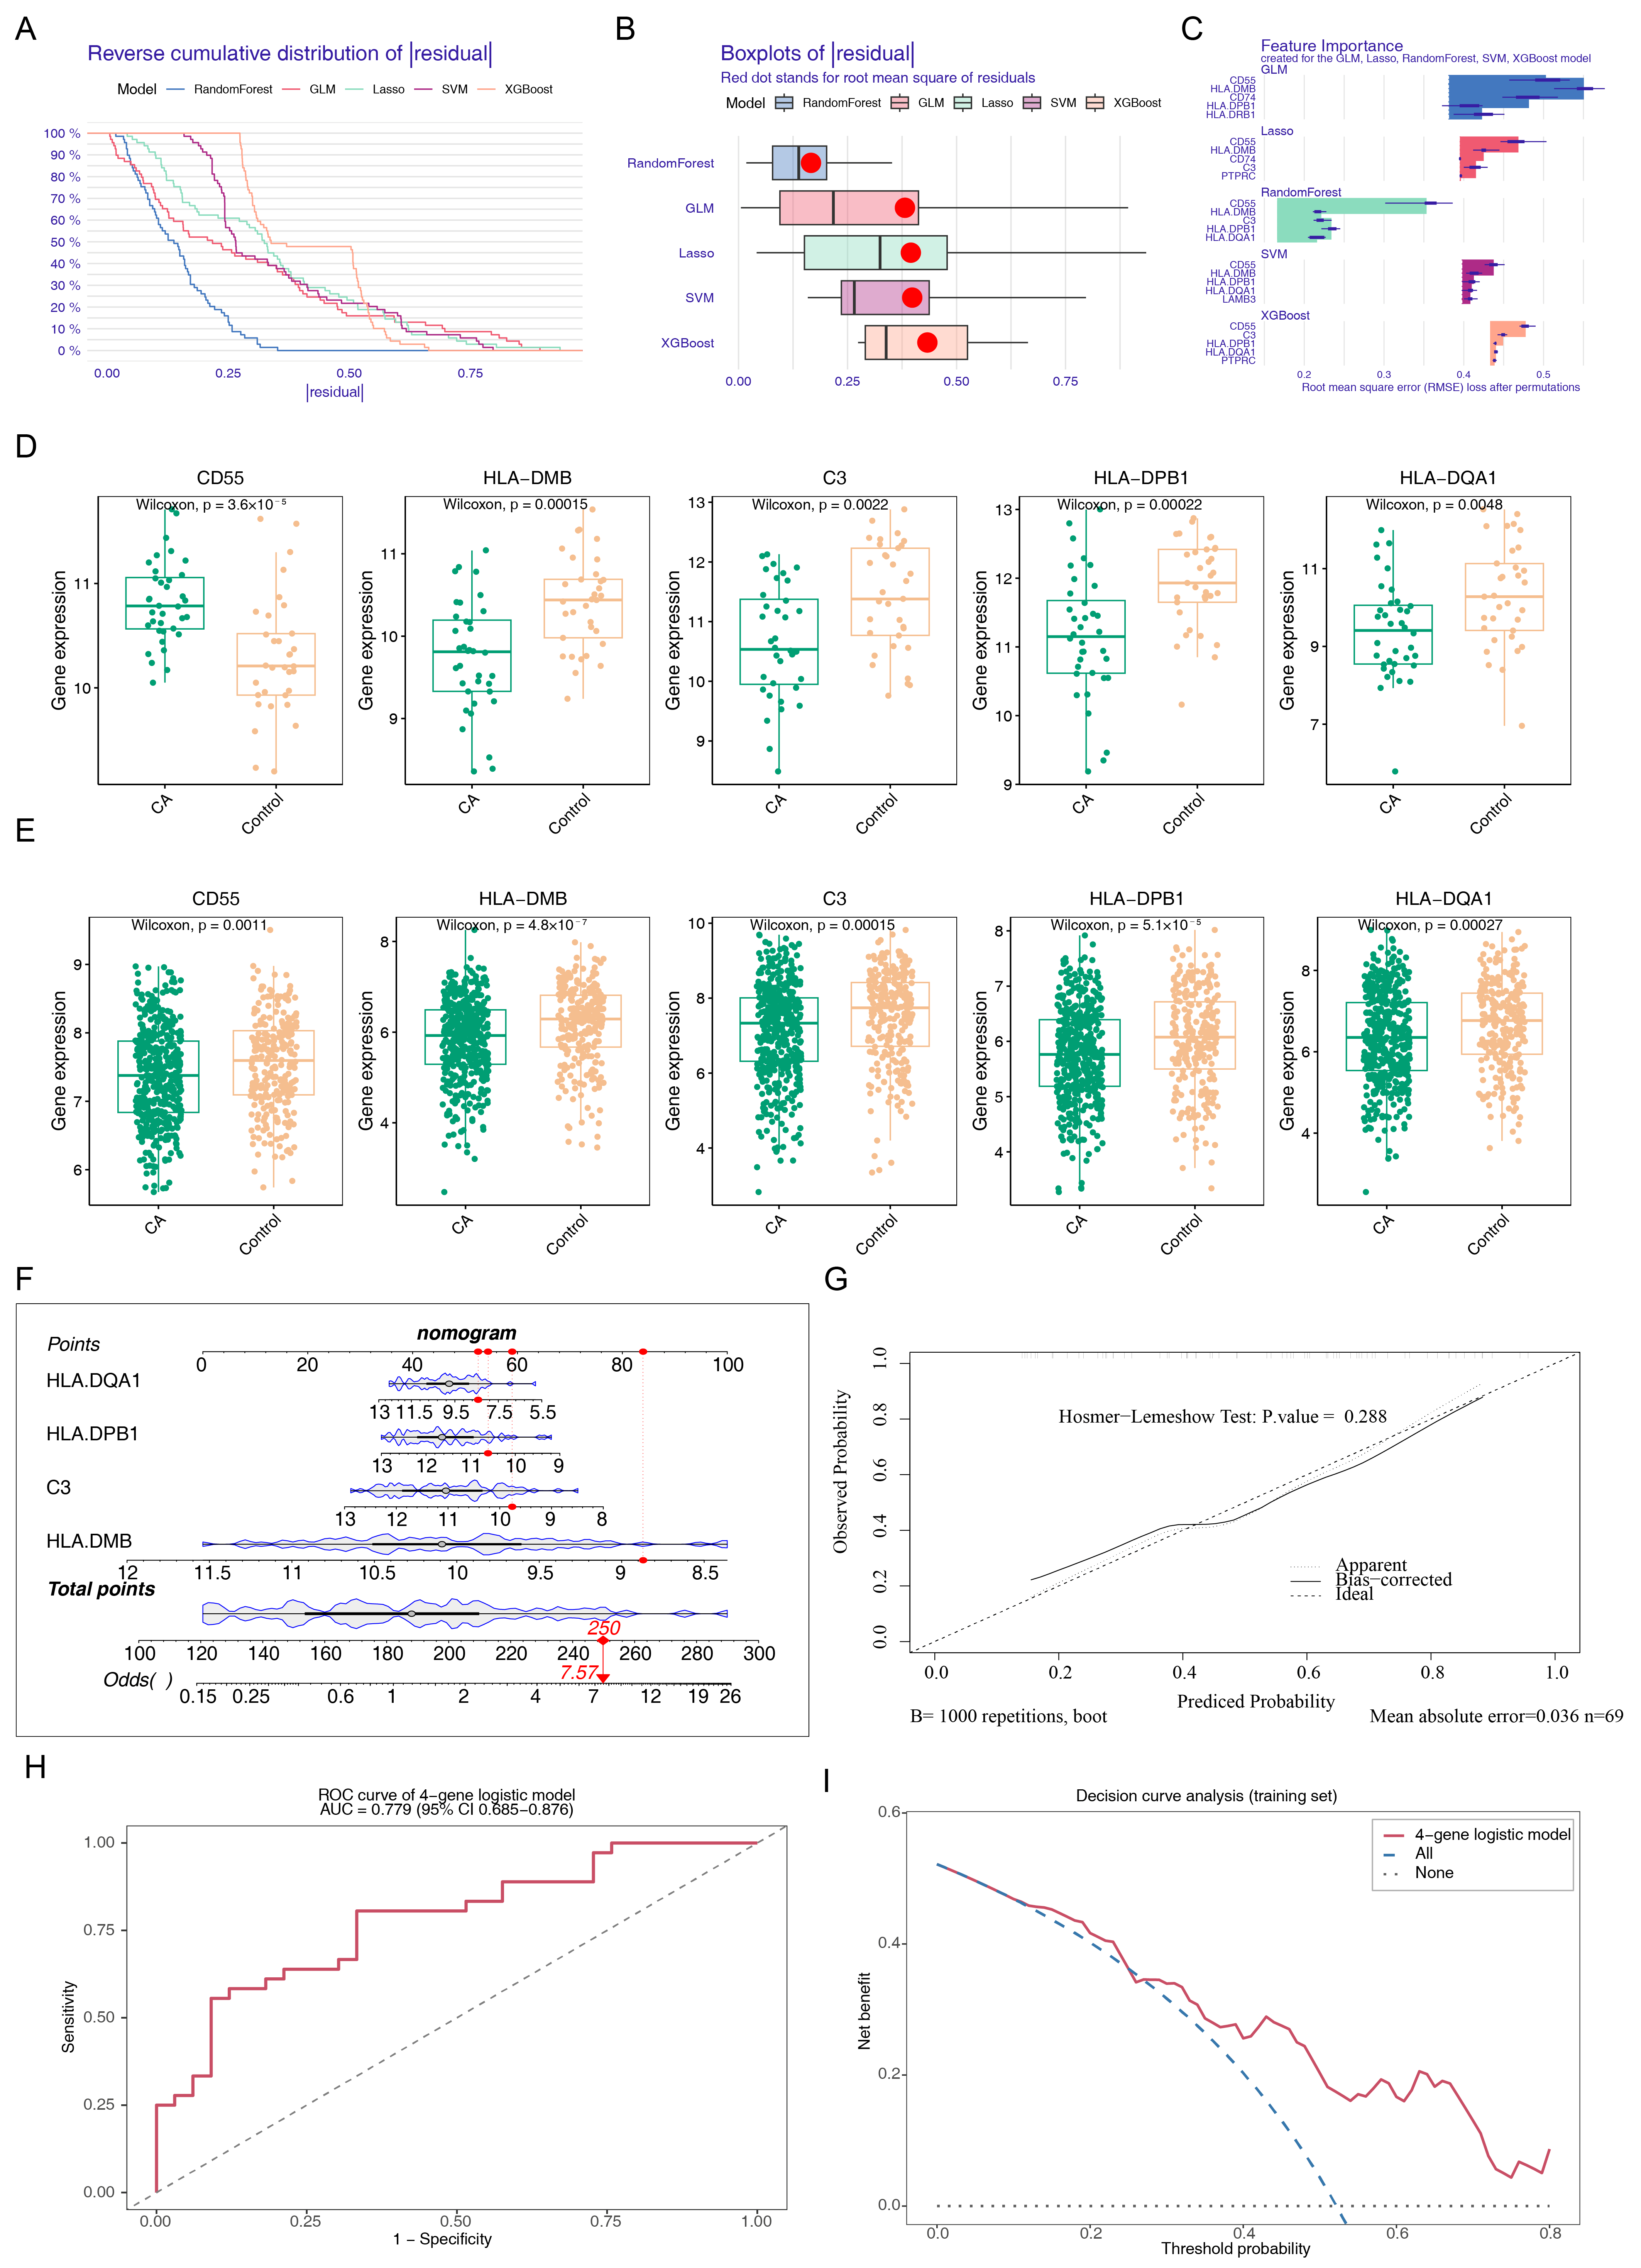
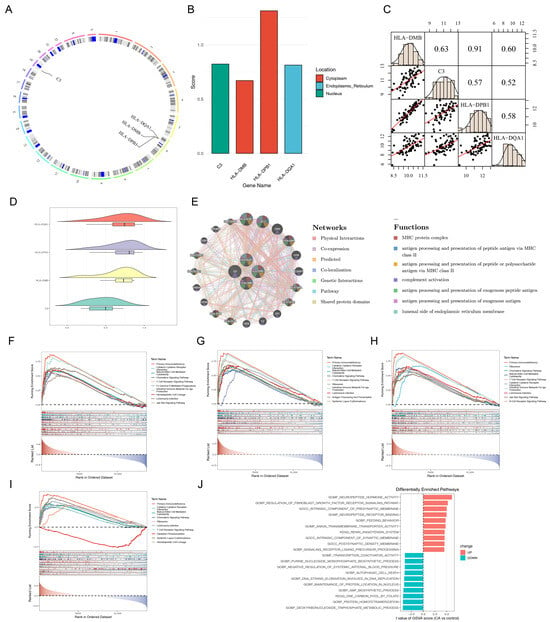
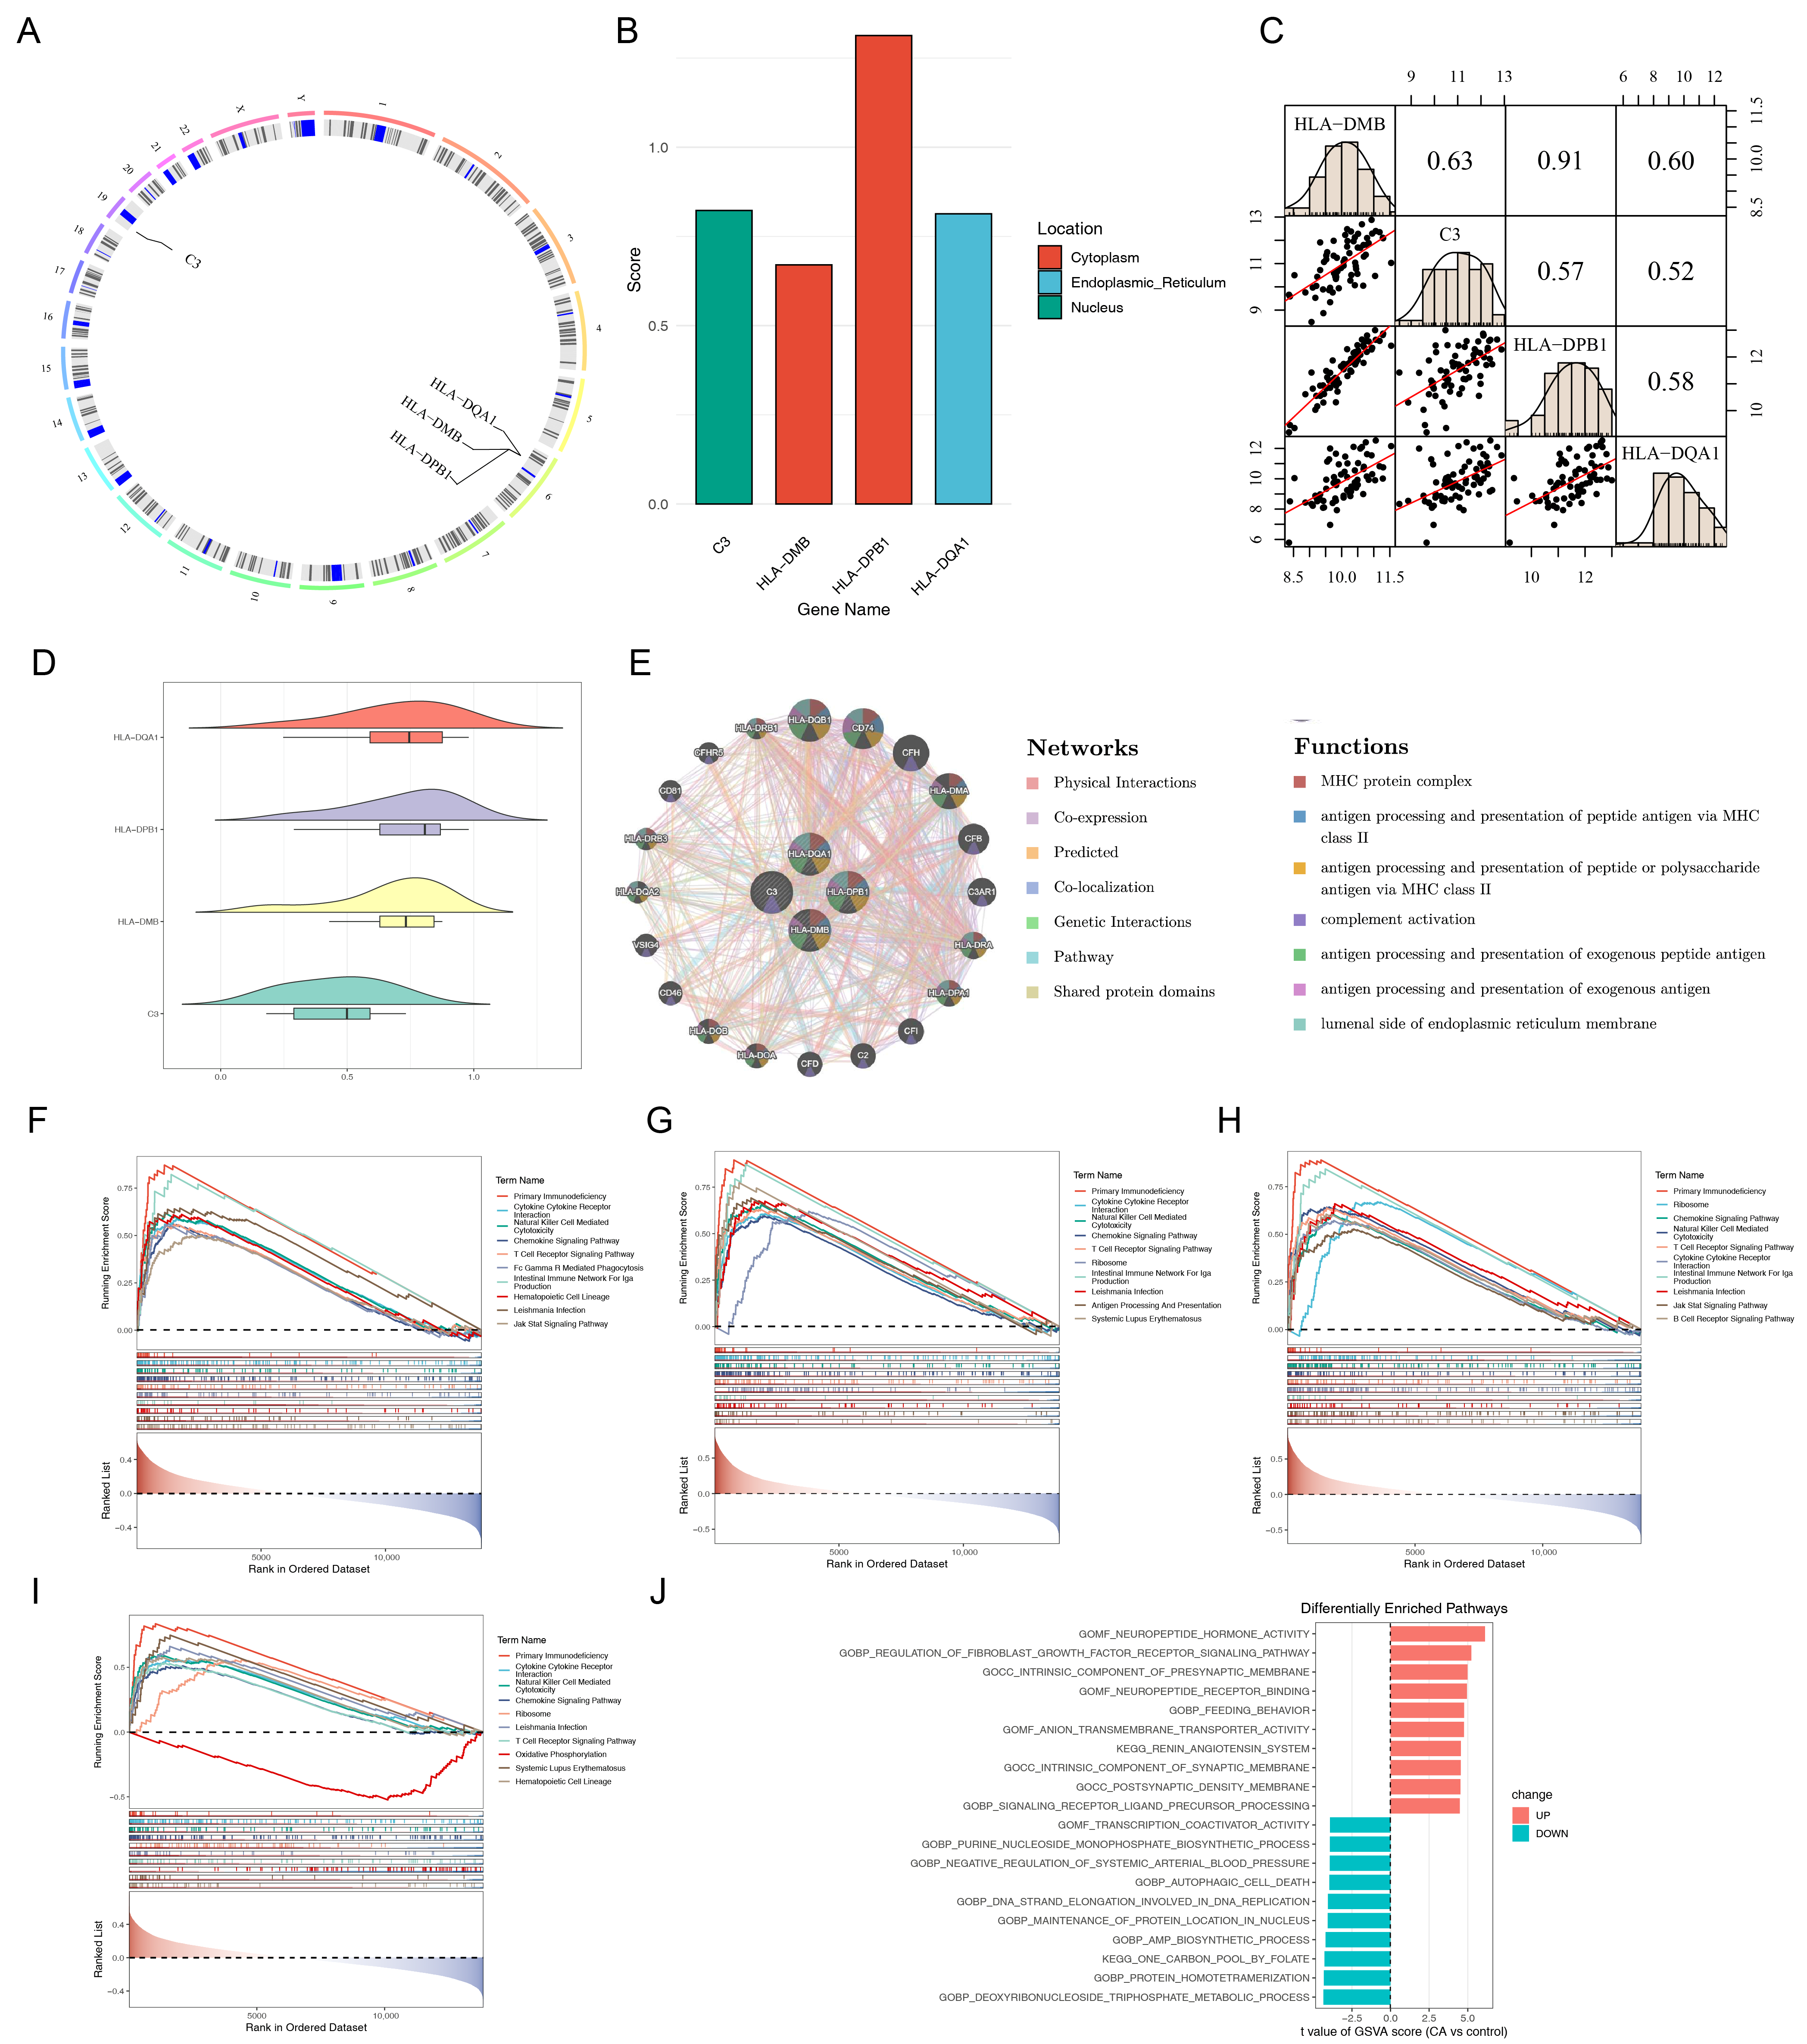

Disclaimer/Publisher’s Note: The statements, opinions and data contained in all publications are solely those of the individual author(s) and contributor(s) and not of MDPI and/or the editor(s). MDPI and/or the editor(s) disclaim responsibility for any injury to people or property resulting from any ideas, methods, instructions or products referred to in the content. |
© 2026 by the authors. Licensee MDPI, Basel, Switzerland. This article is an open access article distributed under the terms and conditions of the Creative Commons Attribution (CC BY) license.