


Abstract
Background/Objectives: C-reactive protein (CRP) and D-dimer are routinely measured in sepsis, but it is uncertain whether their repeated values covary within the same hospital episode independently of differences between episodes. We therefore evaluated the same-assessment association between CRP and D-dimer across ordered clinical assessments in adults with clinically recorded sepsis. Methods: This secondary exploratory single-center repeated-measures analysis used 100 admission episodes assessed at M0, M2, and M3; exact elapsed times for M2/M3 and exact phlebotomy timestamps were unavailable. The primary model included 190 CRP–D-dimer pairs from 88 episodes, with 64 episodes contributing at least two pairs. Log-CRP was decomposed into episode-centered and episode-mean components in a random-intercept model adjusted for assessment. Procalcitonin (PCT) was a prespecified gated secondary marker. Results: The within-episode CRP coefficient was β = 0.1731 (95% CI 0.0259–0.3204; p = 0.0212), corresponding to 12.7% higher D-dimer per CRP doubling. The PCT coefficient was β = 0.0979 (95% CI 0.0037–0.1921; p = 0.0415). Point estimates remained positive across prespecified sensitivities, but confidence intervals crossed zero in fixed-effects, robust GEE, and complete-case analyses; only 49/100 episodes contributed an M3 CRP–D-dimer pair. Conclusions: In this small, incomplete secondary dataset, the findings provide limited, model-dependent evidence of positive same-assessment CRP–D-dimer covariation. They do not establish a definitive association, temporal coupling, causality, SIC/DIC, treatment response, prognosis, or clinical thresholds.
1. Introduction
The Sepsis-3 consensus definitions provide a standardized clinical framework for sepsis [1], but the present dataset relied on clinician-recorded sepsis labels and did not permit independent Sepsis-3 adjudication. C-reactive protein (CRP) and procalcitonin (PCT) are routinely measured inflammatory biomarkers in sepsis, whereas D-dimer reflects fibrin formation and degradation but is nonspecific for any single coagulation syndrome. Inflammation and coagulation are biologically linked in sepsis [2,3], and broader mechanistic models include endothelial, platelet, and immunothrombotic pathways [4,5]. However, none of those mechanisms were measured in the present dataset. Likewise, D-dimer alone cannot establish sepsis-induced coagulopathy (SIC) or disseminated intravascular coagulation (DIC), which require additional clinical and laboratory information [6,7,8,9].
Prior studies have evaluated CRP, PCT, and D-dimer mainly for baseline prognostication, serial marker trajectories, severity stratification, or outcome-associated phenotypes [10,11,12,13,14,15,16,17,18,19,20,21,22,23]. These studies establish that inflammatory and hemostatic markers may vary during sepsis, but they address different estimands from the one considered here. Our literature assessment was focused and non-systematic; accordingly, we do not claim that no previous study has ever used a similar model. Rather, we did not identify an exact analog that separated same-assessment CRP–D-dimer associations into within-episode and between-episode components in routine repeated clinical data. The intended novelty is therefore primarily methodological, not a claim of a newly discovered biological pathway.
The distinction matters because conventional repeated-measures regression can combine two signals: episodes with generally higher CRP may also have generally higher D-dimer, while deviations of CRP above or below an episode’s own average may or may not be accompanied by deviations in D-dimer within that episode [24]. The latter is the target of the present analysis. Because M2 and M3 did not have source-verified elapsed times and exact blood-draw timestamps were unavailable, the study does not estimate standardized kinetics, lead–lag relationships, or temporal coupling. “Same-assessment” therefore means only that the biomarkers were recorded within the same ordered clinical assessment, not that they were sampled simultaneously or that one changed before the other.
CRP was designated as the primary inflammatory exposure and PCT as a gated secondary exposure in the frozen analysis hierarchy. The SAP did not document a mechanistic claim that CRP was biologically more important than PCT, and we do not reconstruct such a rationale retrospectively. The hierarchy is therefore presented as a prespecified pragmatic analytic choice; CRP also had slightly more complete exact-value pairing with D-dimer, whereas PCT had fewer valid pairs and included lower-limit entries.
The primary objective was to estimate the same-assessment within-episode association between CRP and D-dimer across three ordered assessments in adults with clinically recorded sepsis, while separating within-episode from between-episode CRP variation and adjusting for common assessment-point effects. A positive direction was hypothesized on the basis of the established general relationship between inflammation and coagulation, but the formal primary test was two-sided. The analogous PCT–D-dimer association was prespecified as a gated secondary endpoint. No temporal ordering, causal effect, or clinical decision threshold was assumed.
From a clinical-practice perspective, the present analysis is intended to clarify what routinely collected inflammatory and fibrin-turnover measurements can and cannot be inferred to show when they are obtained at the same recorded assessment during a sepsis admission. If confirmed, a within-episode CRP–D-dimer association would imply that these two commonly ordered tests carry partially concordant information about the same clinical state, which could inform how clinicians interpret a rising D-dimer in the context of a concurrently rising or falling CRP. However, the present dataset cannot support any diagnostic cutoff, prognostic rule, treatment trigger, or SIC/DIC adjudication, and the analysis was not designed to test whether measuring one marker should prompt measurement of the other. The practical implication is therefore hypothesis-generating only: it motivates prospective, assay-standardized, synchronously sampled studies before any bedside decision rule is considered. Clinicians should continue to interpret CRP and D-dimer within the full clinical and coagulation context rather than as interchangeable or mutually confirmatory markers.
2. Materials and Methods
2.1. Study Design, Setting, and Reporting
This study was a secondary exploratory single-center repeated-measures observational analysis of an existing institutional adult cohort from Infectious Diseases Department 1 (Clinic I) of the Dr. Victor Babeș Clinical Hospital of Infectious Diseases and Pneumophthisiology, Timișoara, Romania. The primary source workbook comprised 100 hospital admission episodes with measurements recorded at three ordered assessment points and covered admissions between 9 December 2024 and 22 December 2025, a period within the database window (1 January 2020–31 December 2025) covered by the data-access authorization described in Section 2.9. The present analysis was developed as a distinct secondary question focused on CRP/PCT–D-dimer within- and between-episode associations. The same adult-source cohort was also used in related analyses by the authors that address different primary questions; these are disclosed to the Academic Editor. The source extract was pseudonymized; direct contact data were not used in the analysis. Reporting was developed in accordance with the Strengthening the Reporting of Observational Studies in Epidemiology (STROBE) statement [25].
2.2. Analysis Population and Unit of Analysis
The unit of analysis was the hospital admission episode. All 100 episodes in the internally coherent three-assessment adult dataset were retained for source-cohort description and data-availability assessment. A separate adult dataset containing 30 source rows was not pooled because it lacked a third assessment and cross-dataset laboratory harmonization could not be established with sufficient confidence. No assumed conversion factors were applied. For the primary CRP–D-dimer model, an episode contributed an observation at a recorded assessment only when CRP and D-dimer were both present, unambiguously numeric, and strictly positive at that same assessment. An episode required at least one valid same-assessment pair to enter the primary mixed model; no episode was excluded on the basis of biomarker magnitude or observed outcome. This yielded 88 modeled episodes. The 64 episodes with at least two valid pairs formed a prespecified repeated-data sensitivity subset rather than the primary inclusion criterion. All 100 infection-source entries in the audited source workbook contained a source-recorded “Sepsis” label. Baseline SOFA was unpopulated in all 100 rows, component-level SOFA data were unavailable, and independent retrospective Sepsis-3 adjudication was therefore impossible. The manuscript consequently uses the descriptive term “clinically recorded sepsis” for the analyzed cohort while explicitly avoiding the stronger claim that all episodes fulfilled Sepsis-3 criteria.
Definitive person-level linkage was unavailable in the analytical extract. Three pairs of episodes shared the same combination of initials, age, and sex and could represent repeated admissions by the same individual; the primary analysis retained these episodes, while a prespecified sensitivity analysis excluded all six records belonging to non-unique initials–age–sex combinations. During source audit, the same source record number (Nr FO 20168) was found on two clinically distinct rows with different initials, ages, and admission dates. To prevent erroneous merging, clustering was based on a row-level internal episode identifier rather than on Nr FO.
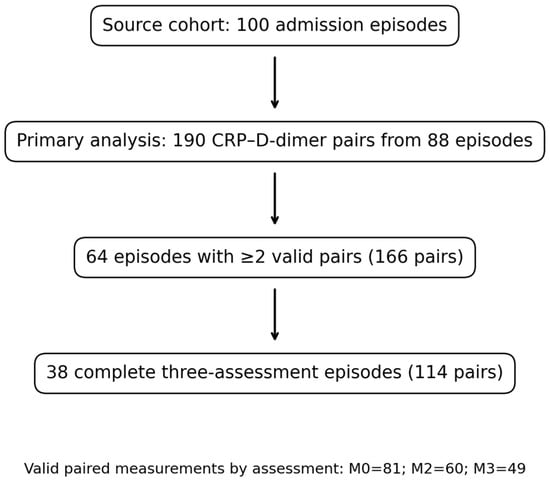
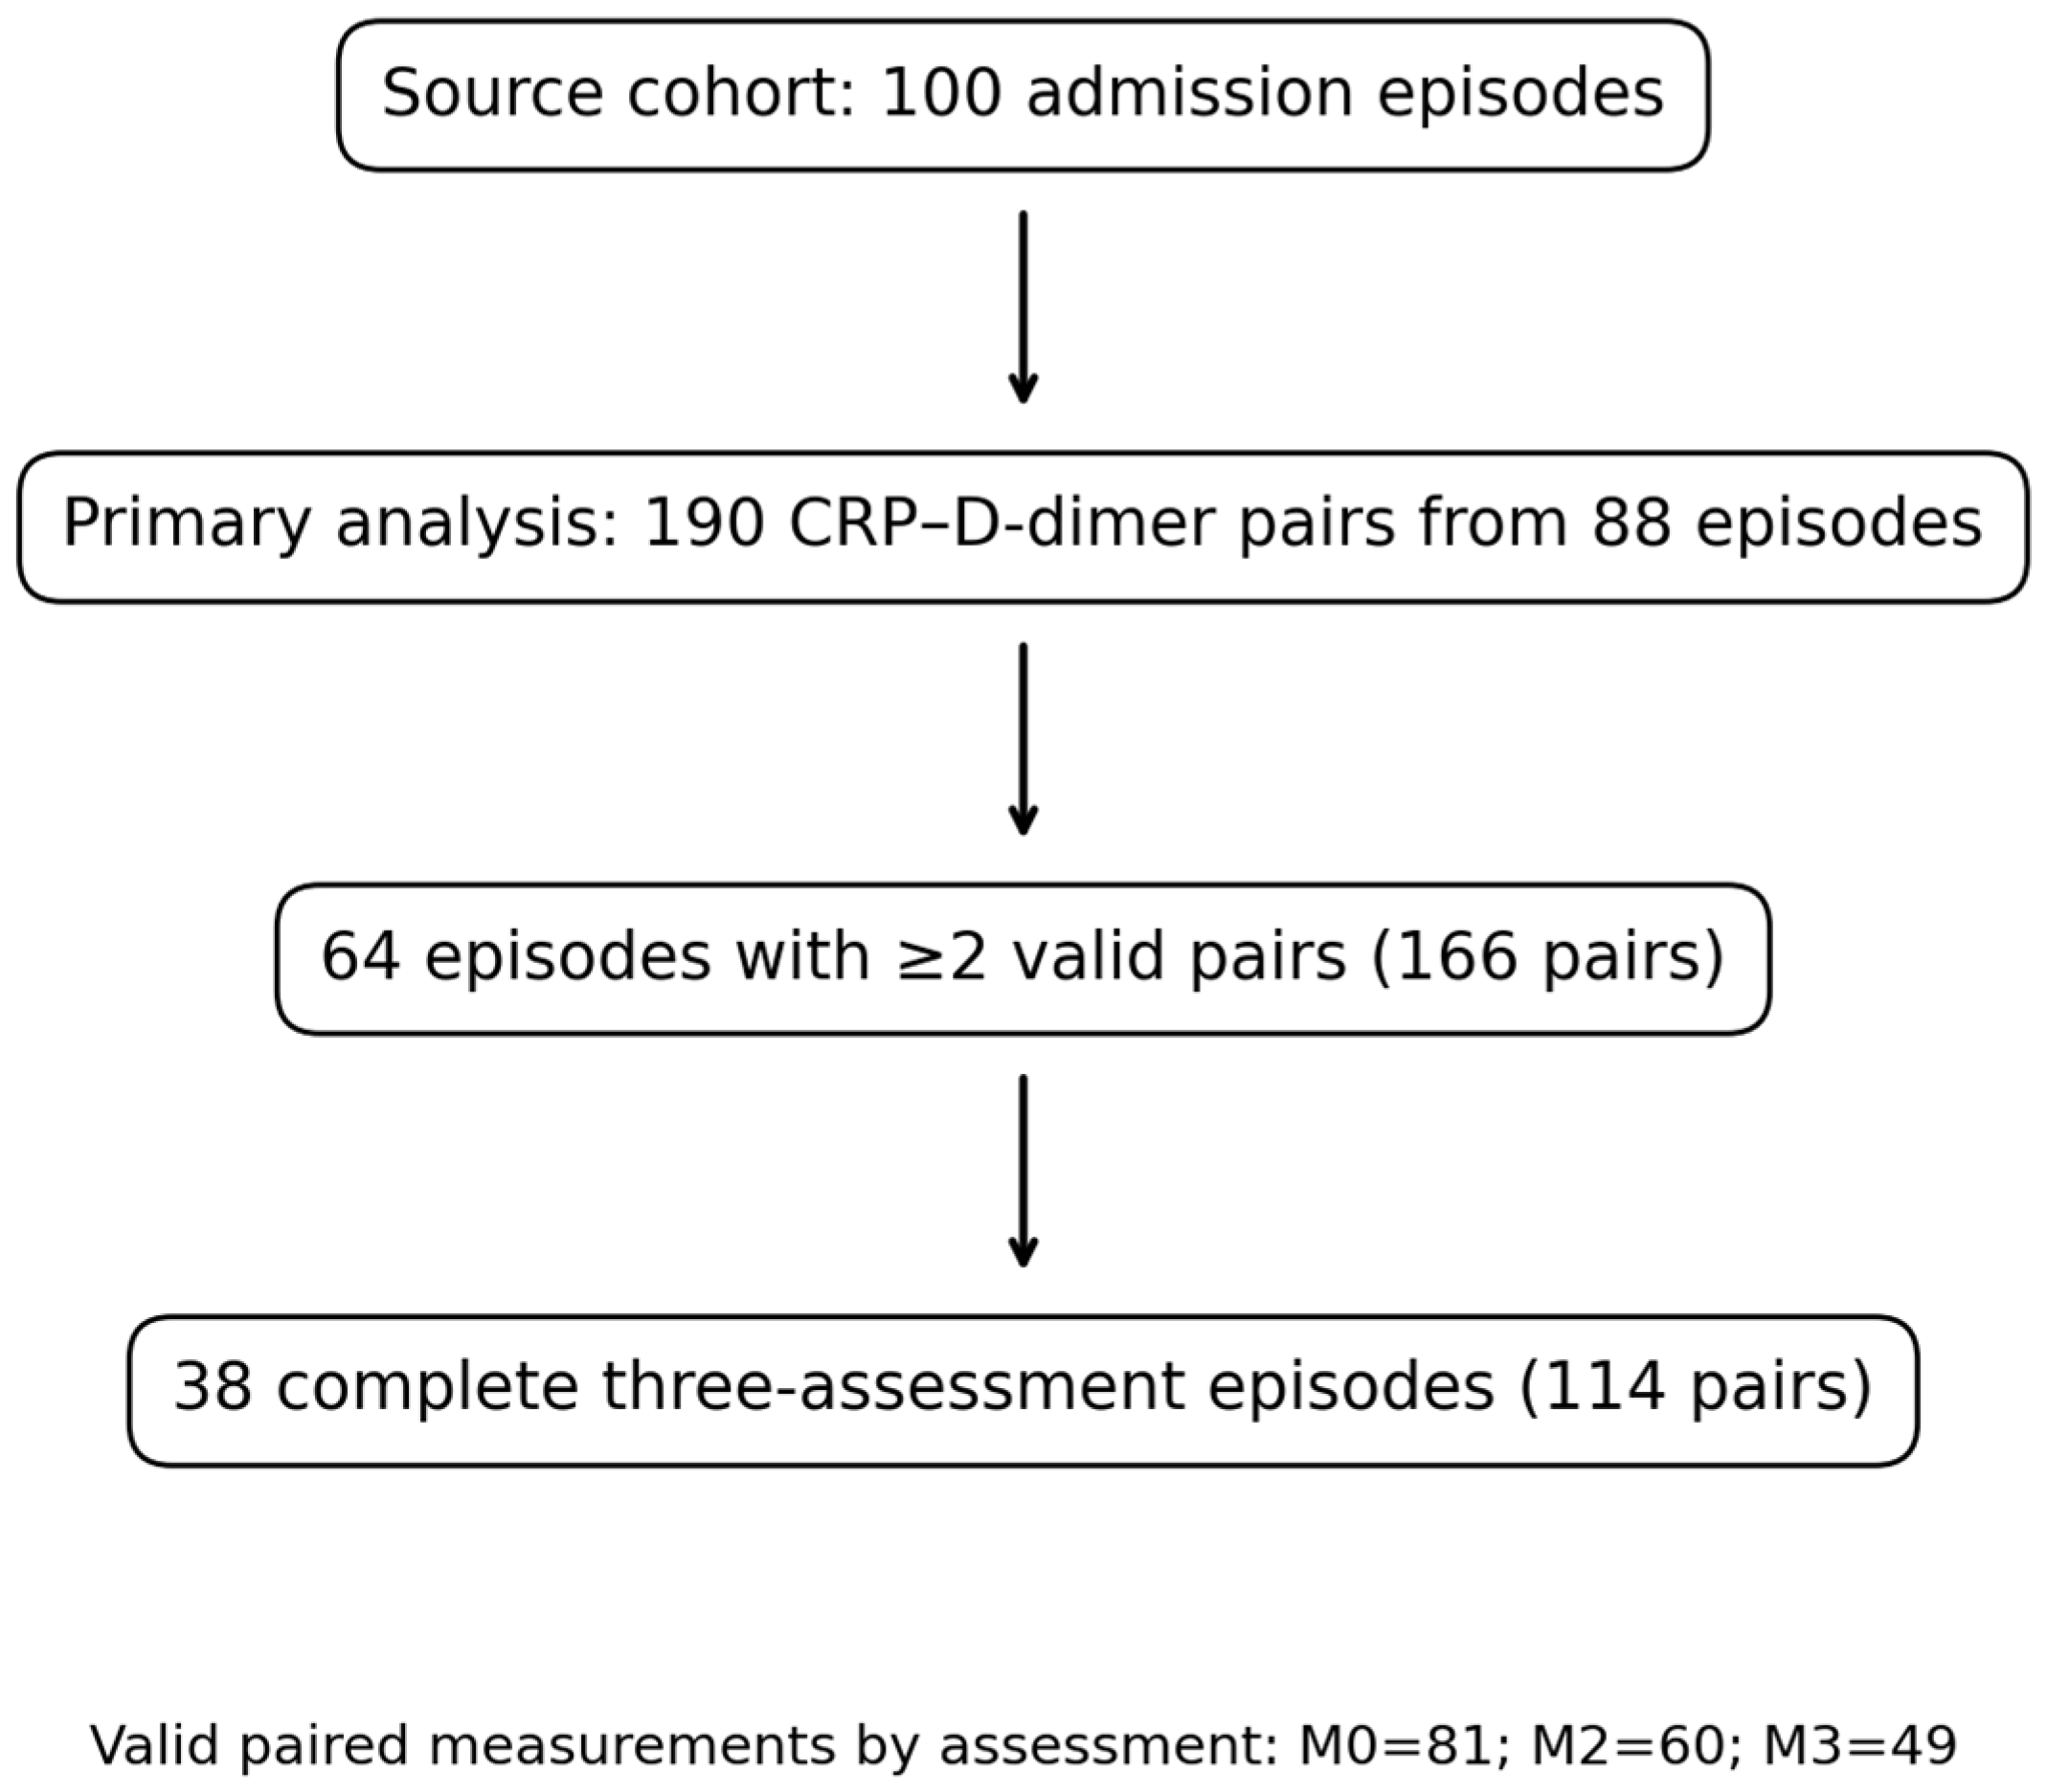
No de novo sample-size calculation was performed because the analysis used a fixed existing dataset. The study was not prospectively powered for the within-episode association. Precision was therefore evaluated through effect estimates and 95% confidence intervals rather than post hoc power calculations. The effective repeated-data information is materially smaller than the source-cohort size: only 64 episodes contributed at least two valid CRP–D-dimer pairs, 38 contributed all three paired assessments, and only 49/100 episodes contributed an M3 CRP–D-dimer pair (Figure 1).
Figure 1.
Study flow and contribution of hospital admission episodes to the primary CRP–D-dimer analysis. M0, M2, and M3 denote ordered recorded assessments rather than standardized elapsed-time intervals.
2.3. Recorded Assessment Framework
Laboratory measurements were organized at three ordered assessment points designated M0, M2, and M3. M0 represented the first available measurement at admission. Exact patient-level elapsed times corresponding to M2 and M3 were not encoded sufficiently reliably in the analytical dataset. Assessment was therefore modeled as a categorical variable with M0 as the reference category.
M0, M2, and M3 were interpreted as ordered recorded assessments rather than fixed 24-, 48-, or 72 h intervals. CRP/PCT and D-dimer were paired when they belonged to the same hospital episode and the same recorded assessment. Exact phlebotomy timestamps were unavailable, so “same-assessment” does not imply an identical blood draw. Because neither exact elapsed times nor synchronized sampling were available, lagged or lead–lag analyses could not be performed, and no temporal sequence between inflammatory-marker change and D-dimer change was inferred. Assessment was modeled categorically; no linear time trend was imposed.
2.4. Biomarkers, D-Dimer Documentation, and Data-Quality Rules
The primary coagulation outcome was D-dimer. CRP was the primary time-varying inflammatory marker, and PCT was the prespecified gated secondary inflammatory marker. CRP was recorded in mg/L and PCT in ng/mL. CRP was measured using the CRP Vario assay (Abbott Architect platform; Abbott Laboratories, Abbott Park, IL, USA). Before SAP execution, the investigator confirmed that D-dimer values at M0, M2, and M3 were recorded on the same analytical unit and numerical scale; the M0 source field specified ng/mL. However, the source workbook did not preserve a verifiable assay manufacturer, reagent/platform, laboratory reference interval, or fibrin-equivalent-unit (FEU) versus D-dimer-unit (DDU) designation. Consequently, assay traceability and absolute cross-study comparability cannot be independently verified, and no external D-dimer cutoff or absolute clinical interpretation is used. The source-recorded M0 maximum of 27,912 was retained because no source evidence supported correction or exclusion, but its absolute clinical meaning cannot be adjudicated from the available assay documentation. A prothrombin-time field was unpopulated, and fibrinogen was available only at M2 and M3, with no baseline fibrinogen field; therefore, SIC/DIC could not be reconstructed.
Only unambiguously numeric and strictly positive values were eligible for log-transformed analyses. No exact numeric zero values were present for CRP, PCT, or D-dimer, so the positivity rule did not exclude any otherwise exact numeric observation. No winsorization, trimming, arbitrary outlier deletion, or single-value imputation was performed. Two M2 PCT results were recorded only as lower-limit strings (<0.020 and <0.05) and were treated as missing exact concentrations. Both occurred at assessments without a valid same-assessment D-dimer value; therefore, alternative substitution for those two censored PCT values would not have changed the paired PCT–D-dimer analytic sample.
The primary CRP–D-dimer paired set contained 190 same-assessment observations from 88 episodes. Twenty-four episodes contributed only one valid pair and therefore did not provide repeated within-episode exposure variation; 64 episodes contributed at least two valid pairs and directly informed the repeated within-episode slope, and 38 contributed all three assessments. The corresponding exact-value PCT–D-dimer set contained 183 pairs from 85 episodes. The CRP-first/PCT-second hierarchy was frozen before formal association modeling and is interpreted as a pragmatic analytic hierarchy rather than a claim of biomarker superiority.
2.5. Statistical Analysis Plan, Primary Estimand, and Results Freeze
The analytic hierarchy, data-quality rules, endpoint definitions, transformations, primary model, multiplicity strategy, missing-data approach, and sensitivity analyses were formalized in a written Statistical Analysis Plan (SAP) before execution of the CRP–D-dimer association model. Because the source cohort and marginal biomarker distributions had already been examined in previous work, the SAP is not described as prospective preregistration; the present study is explicitly a secondary exploratory analysis. After confirmation of the common D-dimer scale, the SAP was frozen and executed on 27 September 2026. No endpoint hierarchy or primary model was changed after the primary result was viewed. Statistical analyses were performed in R (version 4.6.1; R Foundation, Vienna, Austria).
CRP and D-dimer were natural-log transformed because of right-skewed distributions. For each hospital episode i, the episode-specific mean of log(CRP) across valid same-assessment CRP–D-dimer pairs was calculated and denoted meanCRPi = (1/ni) × Σt log(CRPit), where ni is the number of valid pairs contributed by episode i. This quantity is referred to throughout as the episode-mean log(CRP). The within-episode component was defined as log(CRPit) − meanCRPi. This episode-mean-centering approach separates within-episode variation from between-episode differences in average exposure [24].
where CRPcit denotes the within-episode, episode-centered log(CRP) deviation for episode i at assessment t.
CRPcit = log(CRPit) − meanCRPi
The primary model was a random-intercept linear mixed-effects model estimated by restricted maximum likelihood (Equation (1)):
where β0 is the intercept; βW and βB are the within-episode and between-episode coefficients, respectively; β2 and β3 are the coefficients of the indicator variables for assessments M2 and M3 (reference, M0); ui is the episode-specific random intercept; and eit is the residual. The random intercept was assumed to be normally distributed, ui ~ N(0, σ2u), and the residual term was assumed to be normally distributed, eit ~ N(0, σ2e), independent of ui and of the covariates. Residuals were not modeled as autocorrelated because each episode contributed at most three observations and the modal number of pairs was one; an unstructured within-episode correlation was therefore not identifiable. The estimated variance components are reported in Section 3.7 (estimated σ2u = 0.4185; estimated σ2e = 0.3872; ICC = 0.519).
The analogous PCT–D-dimer model was specified as (Equation (2)):
where PCTcit = log(PCTit) − meanPCTi, and meanPCTi is defined analogously to meanCRPi. Equation (2) uses the same decomposition, categorical assessment adjustment, random-intercept specification, and distributional assumptions as the CRP model. The primary estimand was βW, the same-assessment within-episode association between CRP and D-dimer after removing between-episode CRP differences and adjusting for common assessment-point effects. βB represented the between-episode association and was treated as secondary/descriptive because it is vulnerable to between-patient confounding. Age and sex were not added to the primary model because they are time-invariant and cannot explain within-episode exposure deviations; no causal interpretation was assigned to βB. Random slopes were not prespecified because each episode contributed at most three measurements and many contributed fewer, making stable random-slope covariance estimation implausible in this sample.
The primary null hypothesis was H0: βW = 0, tested two-sided at α = 0.05. The coefficient was also transformed into the percentage difference in D-dimer associated with a two-fold higher CRP within the same episode as %ΔD-dimer = (2βW − 1) × 100. This transformation was applied identically to βW from the CRP model and to βW from the PCT model; the resulting values appear in the Abstract, Section 3.3 and Section 3.4. The PCT–D-dimer analysis used the same transformation, decomposition, categorical assessment adjustment, and random-intercept specification. A prespecified fixed-sequence gate was used: the PCT within-episode hypothesis was formally tested at α = 0.05 only if the primary CRP hypothesis met α = 0.05, thereby avoiding simultaneous unadjusted testing of the two ordered hypotheses. Given the secondary exploratory design, the PCT result was nevertheless interpreted as supportive, and all p-values were considered together with effect sizes, confidence intervals, missingness, and sensitivity analyses.
2.6. Planned Sensitivity and Influence Analyses
Robustness of the primary CRP–D-dimer association was evaluated using prespecified alternatives: (1) episode fixed-effects regression with episode-clustered standard errors; (2) generalized estimating equations (GEE) with exchangeable working correlation and robust covariance; (3) restriction to episodes with at least two valid paired assessments; (4) restriction to complete three-assessment episodes; (5) exclusion of the six episodes belonging to non-unique initials–age–sex combinations; and (6) leave-one-episode-out refitting of the primary mixed model. The primary model was not selected or replaced according to which specification produced the smallest p-value. The leave-one-episode-out procedure was treated as an influence analysis, not as independent confirmation of the within-episode effect; because 24 modeled episodes contained only one valid pair, their removal does not represent removal of repeated within-episode exposure information in the same sense as removal of episodes with two or three pairs. These alternative specifications also relax the distributional assumptions of the primary mixed model.
2.7. Post-Freeze Source-Data Verification Procedures
After the frozen analysis had been completed, the raw source workbook was re-audited during manuscript review. These checks were not prespecified and were not used to redefine the primary estimand. Five episodes had numerically identical D-dimer values at M0 and M2. Because exact equality can reflect either a legitimate repeat result or source carry-forward, a conservative post-freeze data-integrity analysis excluded all five episodes and refitted the unchanged primary model. The duplicated Nr FO value described above was also verified to represent two clinically distinct rows; the row-level episode identifier used in the original analysis prevented their erroneous merger. These reviewer-driven checks are reported separately from prespecified sensitivity analyses, and their p-values are not used for inferential claims.
2.8. Missing Data and Model Diagnostics
Missing biomarker values were not singly imputed. The primary mixed model used all valid same-assessment CRP–D-dimer pairs under its likelihood assumptions, but the model does not restore information that was never observed and does not eliminate bias if later measurement availability depends on unmeasured clinical evolution. Measurement availability was summarized separately by assessment and by number of contributed pairs. Potential selection associated with availability of an M3 CRP–D-dimer pair was evaluated using standardized mean differences (SMDs) rather than null-hypothesis tests. A missing completely at random mechanism was not assumed, and complete-case restriction was treated only as a sensitivity analysis.
Model convergence, random-intercept variance, residual variance, intraclass correlation, residual skewness, and random-intercept skewness were reviewed. Diagnostics were used to characterize model behavior rather than to select the specification producing the most favorable inferential result.
2.9. Ethics
The overarching retrospective doctoral project, entitled “Etiologia și mecanismele sepsisului neonatal comparativ cu sepsisul adultului” (Comparative Etiology and Mechanisms of Neonatal and Adult Sepsis), received ethical approval from the Local Ethics Committee for Scientific Research of the “Pius Brînzeu” County Emergency Clinical Hospital, Timișoara (Decision No. 596/09.02.2026). That decision identifies the Neonatology Department of the issuing hospital as the study site and specifies retrospective analysis of existing institutional data, with complete anonymization of patient data in compliance with the General Data Protection Regulation (GDPR) and the principles of the Declaration of Helsinki. Separately, access to and use of the adult-source database of Infectious Diseases Department 1 (Clinic I) of the “Dr. Victor Babeș” Clinical Hospital of Infectious Diseases and Pneumophthisiology, Timișoara, for the period 1 January 2020–31 December 2025 was authorized for the doctoral study under registered request No. 8325/21.08.2026, with the endorsements of hospital management, the head of the department, and the data protection officer. Under this authorization, the investigator undertook to use the data exclusively for the stated study and to safeguard confidentiality in accordance with Regulation (EU) 2016/679. The present analysis used a pseudonymized adult clinical data extract covering admissions from 9 December 2024 to 22 December 2025.
3. Results
3.1. Cohort Characteristics and Paired-Measurement Availability
The source cohort comprised 100 hospital admission episodes (Table 1). Mean age was 66.7 years (SD 17.7), and median age was 71 years (IQR 58–79). Fifty-three episodes involved female patients and 47 involved male patients. Documented vasopressor use was present in 14 episodes. Recorded infection-source categories were pulmonary in 20 episodes, abdominal/digestive in 23, mixed in 28, and other or unspecified in 29.
Table 1.
Source-cohort characteristics and contribution to the primary CRP–D-dimer model. Note: all 100 infection-source entries contained a “Sepsis” label; the baseline SOFA field was present but unpopulated in all rows, so Sepsis-3 status was not independently adjudicated.
D-dimer was available in 82, 63, and 50 episodes at M0, M2, and M3, respectively. Valid same-assessment CRP–D-dimer pairs numbered 81 at M0, 60 at M2, and 49 at M3, yielding 190 paired observations from 88 episodes. Twenty-four episodes contributed one pair, 26 contributed two, and 38 contributed three. Thus, only 64 episodes supplied repeated paired information for the within-episode contrast, and only 38% of the 100 source episodes had complete three-assessment pairing. The 24 single-pair episodes contributed to other model components but did not themselves provide repeated within-episode exposure contrasts.
3.2. Descriptive Biomarker Distributions
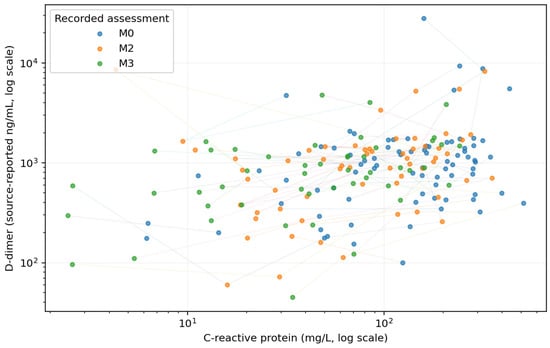
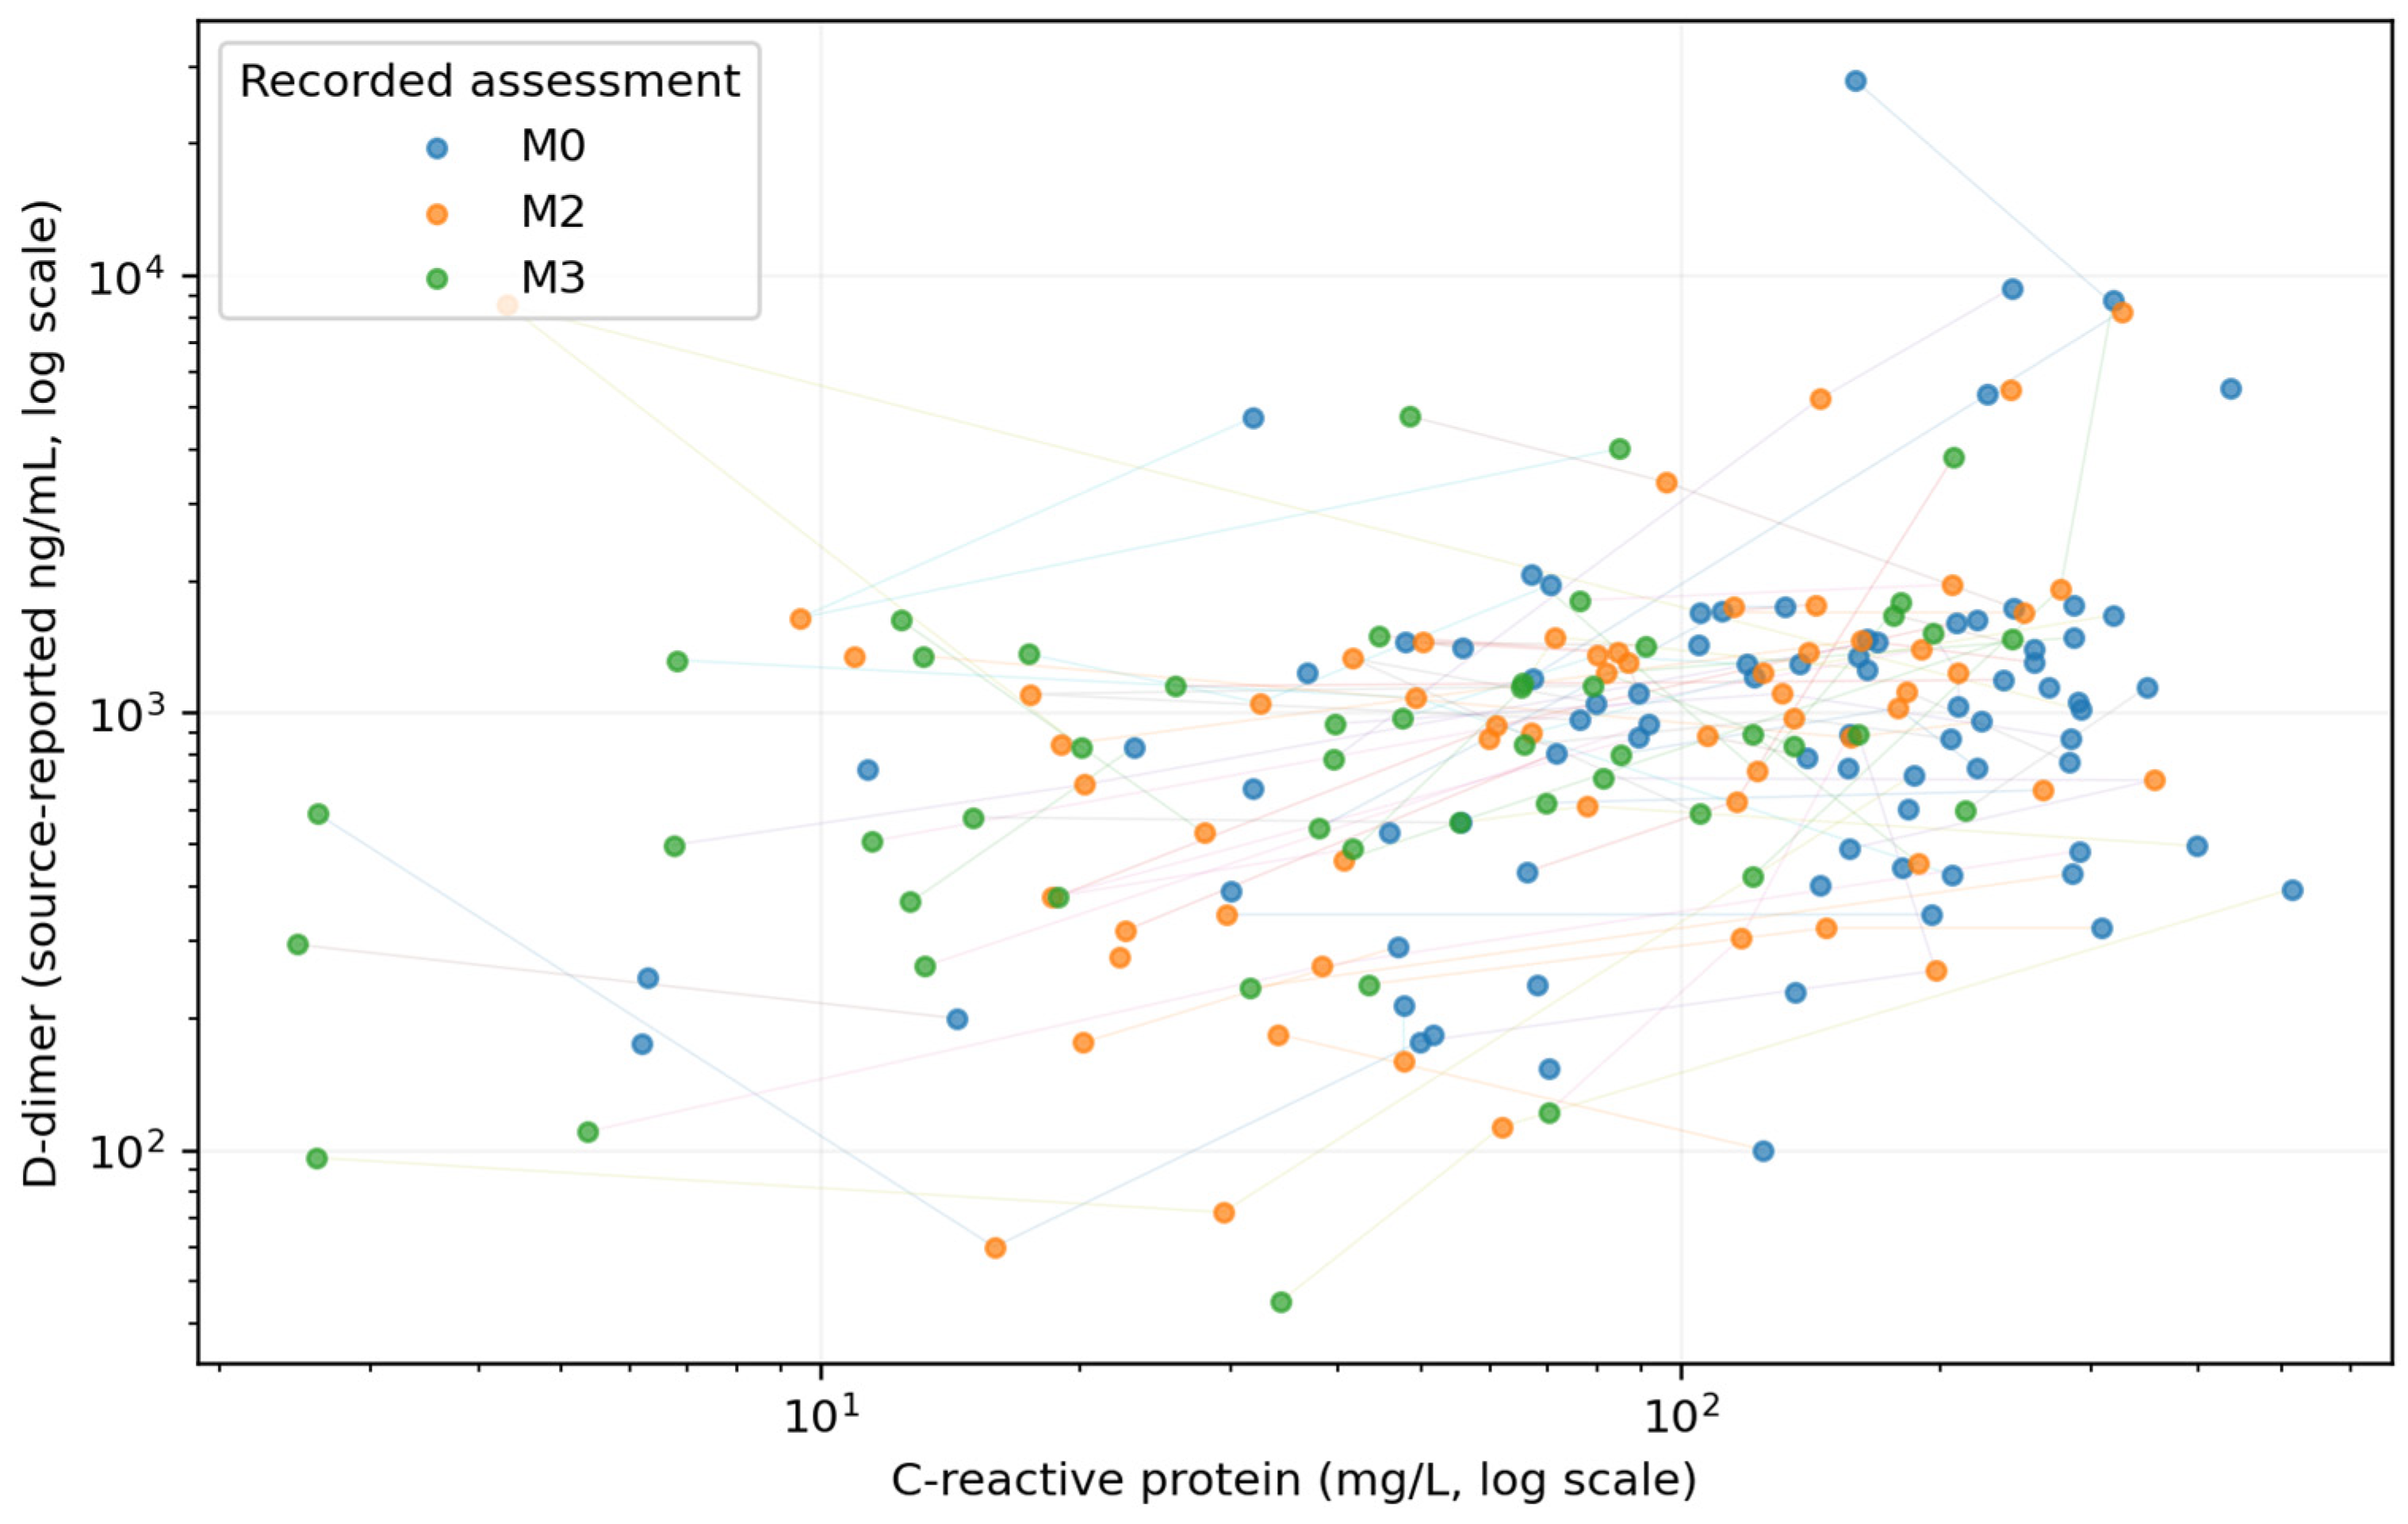
Observed biomarker distributions are summarized in Table 2; same-assessment CRP–D-dimer observations are shown in Figure 2. Median CRP and PCT decreased across the ordered assessments, whereas D-dimer showed a smaller non-monotonic change in unadjusted medians. These summaries are descriptive only. The D-dimer maximum of 27,912 at M0 is reported as a source-recorded value and is not interpreted against an external threshold because FEU/DDU status, assay platform, and reference interval were unavailable.
Table 2.
Biomarker availability and observed distributions by recorded assessment. Note: N denotes exact numeric observations used for descriptive summaries. Two additional M2 PCT entries were recorded only as <0.020 and <0.05 and were excluded from exact-value summaries and the key secondary model.
Figure 2.
Same-assessment CRP–D-dimer observations displayed on logarithmic axes, with repeated observations from the same hospital episode connected. Lines are descriptive and illustrate within-episode movement; they do not represent fitted trajectories or standardized elapsed-time intervals. Point colors denote the recorded assessment (M0, M2, or M3), as shown in the legend.
3.3. Primary Within-Episode CRP–D-Dimer Association
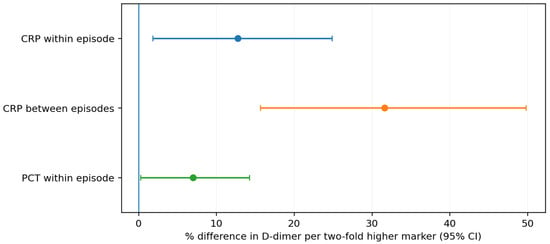
In the prespecified random-intercept within–between model, the within-episode log(CRP) coefficient was β = 0.1731 (95% CI 0.0259–0.3204; p = 0.0212). After adjustment for recorded assessment and separation of within-episode from between-episode CRP variation, a two-fold higher CRP relative to an episode’s own CRP profile was associated with an estimated 12.7% higher D-dimer recorded at the same assessment (95% CI 1.8%–24.9%; Table 3 and Figure 3).
Table 3.
Primary and hierarchically gated key secondary within–between model estimates.
Figure 3.
Primary and key secondary effect estimates expressed as percentage difference in D-dimer per two-fold higher inflammatory marker. The CRP within-episode estimate is the primary estimand. The CRP between-episode estimate is descriptive and should not be interpreted as a within-episode effect.
The between-episode mean log(CRP) coefficient was β = 0.3964 (95% CI 0.2097–0.5832; p = 3.16 × 10⁻⁵), corresponding descriptively to 31.6% higher D-dimer per two-fold higher episode-average CRP. Because this term compares different episodes rather than within-episode changes, it was interpreted as secondary and potentially confounded. The M2-versus-M0 assessment coefficient was −0.0436 (95% CI −0.2811 to 0.1938; p = 0.719), and the M3-versus-M0 coefficient was −0.0762 (95% CI −0.3663 to 0.2140; p = 0.607).
3.4. Key Secondary PCT–D-Dimer Association
The hierarchical testing gate was opened because the primary CRP within-episode test met the prespecified α = 0.05 criterion. The exact-value PCT–D-dimer model comprised 183 same-assessment pairs from 85 episodes; 62 episodes contributed at least two valid pairs, and 36 contributed all three assessments. The within-episode log(PCT) coefficient was β = 0.0979 (95% CI 0.0037–0.1921; p = 0.0415), corresponding to an estimated 7.0% higher D-dimer recorded at the same assessment (95% CI 0.3%–14.2%) for a two-fold higher PCT within the same episode (Table 3). This finding is treated as supportive/key secondary rather than as independent validation of a coagulation mechanism; two lower-limit M2 PCT entries were excluded from the exact-value model according to the frozen rule.
3.5. Prespecified Sensitivity and Influence Analyses
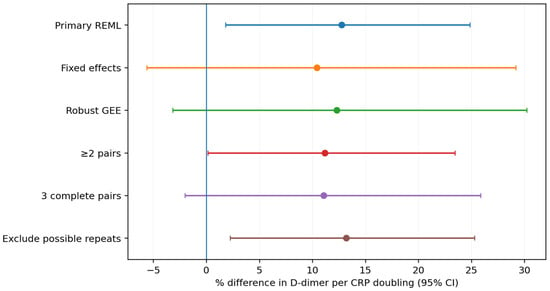
The estimated within-episode CRP–D-dimer association remained positive in every prespecified sensitivity specification (Table 4, Panel A, and Figure 4), but whether the 95% confidence interval excluded zero depended on the model. The episode fixed-effects model yielded β = 0.1431 (95% CI −0.0832 to 0.3694; p = 0.215), and the robust GEE model yielded β = 0.1672 (95% CI −0.0464 to 0.3808; p = 0.125). Restriction to the 64 episodes with at least two paired assessments yielded β = 0.1529 (95% CI 0.0019–0.3040; p = 0.0472). Among 38 complete three-assessment episodes, β = 0.1513 (95% CI −0.0294 to 0.3320; p = 0.101). Exclusion of six episodes belonging to non-unique initials–age–sex combinations yielded β = 0.1787 (95% CI 0.0322–0.3253; p = 0.0168).
Table 4.
Prespecified sensitivity analyses, missingness diagnostics, and post-freeze source-integrity sensitivity. Panel C is explicitly non-prespecified and is reported as reviewer-driven data-quality checking rather than confirmatory evidence.
Figure 4.
Prespecified sensitivity analyses of the primary within-episode CRP–D-dimer association. Estimates are expressed as percentage difference in D-dimer per two-fold higher within-episode CRP. The vertical reference line represents no association. The figure emphasizes effect magnitude and confidence intervals rather than dichotomous p-value interpretation. The non-prespecified post-freeze source-integrity check is intentionally not displayed. Colors distinguish the model specifications only and carry no additional meaning.
Leave-one-episode-out refitting of the primary model produced β estimates from 0.1347 to 0.2594, equivalent to approximately 9.8%–19.7% higher D-dimer per CRP doubling, and all 88 estimates remained positive. This is interpreted only as an influence analysis. In particular, 24 episodes had only one pair and did not themselves provide repeated within-episode exposure contrasts; removal of these episodes should not be interpreted as an independent repeated-data sensitivity test.
The sensitivity results therefore support directional consistency of the point estimate but not model-invariant statistical evidence. We do not classify the fixed-effects, GEE, and complete-case results as “negative” or the p = 0.0472 restricted result as independent confirmation; the pattern is interpreted jointly through magnitude, direction, and uncertainty.
3.6. Post-Freeze Source-Data-Integrity Checks
The post-freeze exclusion of all five episodes with identical source-recorded M0 and M2 D-dimer values yielded β = 0.1808 (95% CI 0.0275–0.3341; 179 observations from 83 episodes), corresponding to approximately 13.4% higher D-dimer per two-fold higher within-episode CRP. This non-prespecified data-integrity check did not materially change the direction or magnitude of the primary estimate. It is not interpreted as independent confirmation, and its nominal p-value was not used for inference. The duplicated Nr FO value was confirmed to occur on two clinically distinct source rows, and the original row-level episode identifier had already kept them separate.
3.7. Missingness and Model Diagnostics
An M3 CRP–D-dimer pair was available for 49 episodes and unavailable for 51 (Table 4, Panel B). Baseline imbalance by later pair availability was nontrivial for age (absolute SMD 0.239), baseline log(CRP) (0.565), and baseline log(D-dimer) (0.377), but small for sex (0.078) and documented vasopressor use (0.016). These imbalances make a missing completely at random mechanism implausible as a comfortable working assumption and raise the possibility that later paired-measurement availability was clinically informative.
The primary mixed model converged. The estimated random-intercept variance was 0.4185, residual variance 0.3872, and intraclass correlation coefficient 0.519. Residual skewness was 0.500 and random-intercept skewness −0.060. No diagnostic finding required abandonment of the frozen primary model, but the wider confidence intervals in robust alternative specifications remain central to interpretation.
4. Discussion
4.1. Principal Findings
This secondary repeated-measures analysis produced a positive same-assessment within-episode CRP–D-dimer estimate in the prespecified random-intercept model after separation of within- and between-episode CRP variation. A two-fold higher CRP relative to an episode’s own average corresponded to an estimated 12.7% higher D-dimer. However, this estimate arises from a small and incomplete dataset: only 64 episodes contributed repeated paired information, later measurement availability declined substantially, and several robust alternative specifications included the null. The result should therefore be viewed as an exploratory model-based estimate rather than a definitive demonstration of an association.
The inferential evidence is model-sensitive. Fixed-effects, robust GEE, and complete three-assessment analyses produced positive point estimates but confidence intervals that included zero, whereas the primary mixed model and the ≥2-pair restriction excluded zero. These discrepancies are not treated as a technical nuisance to be overcome; they are part of the result. Combined with potentially informative missingness, they limit the strength of inference and preclude a confirmatory interpretation.
4.2. Relation to Prior Evidence and Clinical Meaning
Earlier sepsis studies have examined D-dimer, CRP, and PCT primarily as baseline prognostic markers, serial trajectories, or components of severity and phenotype models [10,11,12,13,14,15,16,17,18,19,20,21,22,23]. For example, Rodelo et al. evaluated CRP, PCT, and D-dimer within the first 24 h in relation to 28-day mortality [10], while Yende et al. measured inflammatory and hemostatic biomarkers repeatedly over longer follow-up [19]. The present analysis asks a narrower methodological question: whether within-episode deviations in CRP are associated with D-dimer recorded at the same assessment after removing between-episode CRP differences.
The estimated 12.7% D-dimer difference per CRP doubling is modest. Because the D-dimer assay platform, FEU/DDU designation, reference interval, and relevant clinical outcomes were unavailable, this relative effect cannot be translated into a diagnostic cutoff, prognostic change, or treatment threshold. Its value is descriptive and methodological rather than immediately clinical.
Biological cross-talk between inflammation and coagulation provides a plausible context [2,3,4,5], but the dataset contains no measurements of tissue factor, thrombin generation, endothelial injury, neutrophil extracellular traps, or microvascular thrombosis. Likewise, the absence of complete PT, baseline fibrinogen, and organ-dysfunction information prevents SIC/DIC adjudication [6,7,8,9]. We therefore interpret the findings as biomarker covariation, not evidence of immunothrombosis or a specific coagulation mechanism.
4.3. Timing, Measurement, and Missingness
The study cannot determine whether CRP and D-dimer changed simultaneously or whether one preceded the other. M2 and M3 were ordered clinical assessments without verified elapsed times, and exact phlebotomy timestamps were unavailable. A lagged analysis was therefore not identifiable from the source data. This limitation is especially important because CRP, PCT, and D-dimer can have different biological response times; the same-assessment estimand should be understood as cross-domain co-occurrence within a recorded assessment rather than temporal coupling.
Assay traceability is a second major limitation. Common D-dimer unit/scale recording across assessments was confirmed, but manufacturer, reagent/platform, reference interval, and FEU/DDU designation were unavailable. The extreme M0 value of 27,912 and all other source-coherent values were retained under the frozen no-arbitrary-outlier-deletion rule, but absolute concentration comparisons with external thresholds or other assays are not warranted. Five episodes had identical M0 and M2 D-dimer values; because carry-forward could not be excluded, a non-prespecified exclusion analysis was performed and did not materially alter the primary point estimate. This sensitivity does not prove data validity and is not treated as confirmatory.
Later paired-measurement availability was incomplete and potentially informative: only 49 of 100 episodes contributed an M3 CRP–D-dimer pair, and baseline CRP and D-dimer differed between episodes with and without an M3 pair. Mixed-effects likelihood methods do not eliminate bias if observation depends on unmeasured clinical evolution. Repeated admissions by the same individual also could not be completely excluded, although the prespecified identifier-based sensitivity produced a similar point estimate.
4.4. Strengths, Limitations, and Implications
Methodological strengths include a frozen SAP before formal association modeling, explicit within–between decomposition, a prespecified testing hierarchy, multiple robustness analyses, and transparent separation of prespecified analyses from post-freeze data-integrity checks. The frozen SAP and a reproducibility script are supplied as Supplementary Files. These safeguards reduce analytical flexibility but cannot compensate for limited sample size, fragmented repeated measurements, potentially informative missingness, absence of independent Sepsis-3 adjudication, incomplete treatment and thrombosis-related covariates, or incomplete D-dimer assay traceability. The study therefore supports only exploratory estimation.
The practical implication is deliberately limited. The data suggest that routine inflammatory and fibrin-turnover measurements may contain partially concordant within-episode information, but the evidence is too incomplete and model-dependent to establish a clinically reliable relationship or support decision thresholds. Confirmation requires prospectively synchronized sampling, predefined sample-size planning, assay-standardized D-dimer reporting, complete coagulation phenotyping, treatment capture, and clinically adjudicated outcomes.
5. Conclusions
In this small secondary single-center dataset, the prespecified mixed model estimated a positive same-assessment within-episode association between CRP and D-dimer. However, only 64 episodes contributed repeated paired information; later measurements were substantially incomplete and potentially informative, and confidence intervals included zero in several robust alternative specifications. The findings therefore provide limited, model-dependent, hypothesis-generating evidence rather than a definitive association. No synchronized kinetics, temporal coupling, causality, SIC/DIC, treatment response, prognosis, or clinically actionable threshold can be inferred.
Supplementary Materials
The following supporting information can be downloaded at: https://www.mdpi.com/article/10.3390/biomedicines14112604/s1, Supplementary File S1: archival PDF text rendition of the Statistical Analysis Plan (SAP v1.2, dated 27 September 2026; not the original DOCX file). Supplementary File S2: reproducibility code implementing the primary CRP–D-dimer model, the gated PCT–D-dimer analysis and prespecified sensitivity/influence analyses.
Author Contributions
Conceptualization, A.R. and D.I.; methodology, A.R. and D.I.; investigation, B.R., A.R., M.A.D., I.E., B.C., M.-I.Ș. and O.R.; formal analysis, A.R.; data curation, B.R. and A.R.; validation, O.R., B.C., I.E., M.A.D., E.R.I. and A.G.; writing—original draft preparation, A.R. and B.R.; writing—review and editing, B.R., A.R., M.-I.Ș., O.R., B.C., I.E., M.A.D., E.R.I., A.G. and D.I.; supervision, D.I., E.R.I. and A.G.; project administration, B.R. and D.I., B.R. and A.R. contributed equally to this work. All authors have read and agreed to the published version of the manuscript.
Funding
We would like to acknowledge Victor Babeș University of Medicine and Pharmacy Timișoara for their support in covering the costs of publication for this research paper.
Institutional Review Board Statement
The overarching retrospective doctoral research project on comparative neonatal and adult sepsis was approved by the Local Ethics Committee for Scientific Research of the “Pius Brînzeu” County Emergency Clinical Hospital, Timișoara (Decision No. 596/09.02.2026), which identifies the Neonatology Department of that institution as its study site. For the adult records analyzed in the present manuscript, the “Dr. Victor Babeș” Clinical Hospital of Infectious Diseases and Pneumophthisiology, Timișoara, authorized study and data access (Infectious Diseases Department 1, period 1 January 2020–31 December 2025) through registered request No. 8325/21.08.2026, endorsed by hospital management, the head of the department, and the data protection officer. The two documents were issued by different institutions and establish distinct forms of authorization; they are therefore reported separately.
Informed Consent Statement
Individual informed consent was not obtained, as this was a retrospective analysis of a pseudonymized extract of existing hospital records, with no patient contact or intervention. The ethics approval and the data-access authorization are described in the Institutional Review Board Statement.
Data Availability Statement
The patient-level data analyzed in this study are subject to institutional privacy and data-protection restrictions. Requests for a de-identified analytic extract may be directed to the corresponding author and considered only after authorization by the responsible source institution, subject to all applicable legal and ethical conditions. An archived text rendition of the analysis plan and the reproducibility code are supplied as Supplementary Files S1 and S2, respectively.
Acknowledgments
The authors used ChatGPT (GPT-5; OpenAI, San Francisco, CA, USA), an AI language model, exclusively to improve the manuscript’s language and readability. All the scientific content, interpretations, and conclusions are the original work of the authors.
Conflicts of Interest
The authors declare no conflicts of interest.
References
- Singer, M.; Deutschman, C.S.; Seymour, C.W.; Shankar-Hari, M.; Annane, D.; Bauer, M.; Bellomo, R.; Bernard, G.R.; Chiche, J.-D.; Coopersmith, C.M.; et al. The Third International Consensus Definitions for Sepsis and Septic Shock (Sepsis-3). JAMA 2016, 315, 801–810. [Google Scholar] [CrossRef] [Scilit] [PubMed]
- van der Poll, T.; van de Veerdonk, F.L.; Scicluna, B.P.; Netea, M.G. The immunopathology of sepsis and potential therapeutic targets. Nat. Rev. Immunol. 2017, 17, 407–420. [Google Scholar] [CrossRef] [Scilit] [PubMed]
- Levi, M.; van der Poll, T. Inflammation and coagulation. Crit. Care Med. 2010, 38, S26–S34. [Google Scholar] [CrossRef] [Scilit] [PubMed]
- Iba, T.; Helms, J.; Okada, H.; Nagakari, K.; Sato, K.; Ferrer, R.; Levy, J.H. Damage-associated Molecular Patterns, Immunothrombosis, and Intravascular Inflammation in Sepsis: A Narrative Integrative Review. Semin. Thromb. Hemost. 2025. online ahead of print. [Google Scholar] [CrossRef] [Scilit] [PubMed]
- Levi, M.; Schultz, M.; van der Poll, T. Disseminated intravascular coagulation in infectious disease. Semin. Thromb. Hemost. 2010, 36, 367–377. [Google Scholar] [CrossRef] [Scilit] [PubMed]
- Iba, T.; Di Nisio, M.; Levy, J.H.; Kitamura, N.; Thachil, J. New criteria for sepsis-induced coagulopathy (SIC) following the revised sepsis definition: A retrospective analysis of a nationwide survey. BMJ Open 2017, 7, e017046. [Google Scholar] [CrossRef] [Scilit] [PubMed]
- Iba, T.; Levy, J.H.; Warkentin, T.E.; Thachil, J.; van der Poll, T.; Levi, M. Diagnosis and management of sepsis-induced coagulopathy and disseminated intravascular coagulation. J. Thromb. Haemost. 2019, 17, 1989–1994. [Google Scholar] [CrossRef] [Scilit] [PubMed]
- Tsantes, A.G.; Parastatidou, S.; Tsantes, E.A.; Bonova, E.; Tsante, K.A.; Mantzios, P.G.; Vaiopoulos, A.G.; Tsalas, S.; Konstantinidi, A.; Houhoula, D.; et al. Sepsis-Induced Coagulopathy: An Update on Pathophysiology, Biomarkers, and Current Guidelines. Life 2023, 13, 350. [Google Scholar] [CrossRef] [Scilit] [PubMed]
- Li, Y.; Li, H.; Wang, Y.; Guo, J.; Zhang, D. Potential Biomarkers for Early Diagnosis, Evaluation, and Prognosis of Sepsis-Induced Coagulopathy. Clin. Appl. Thromb. Hemost. 2023, 29, 10760296231195089. [Google Scholar] [CrossRef] [Scilit] [PubMed]
- Rodelo, J.R.; De la Rosa, G.; Valencia, M.L.; Ospina, S.; Arango, C.M.; Gómez, C.I.; García, A.; Nuñez, E.; Jaimes, F.A. D-dimer is a significant prognostic factor in patients with suspected infection and sepsis. Am. J. Emerg. Med. 2012, 30, 1991–1999. [Google Scholar] [CrossRef] [Scilit] [PubMed]
- Dhainaut, J.-F.; Shorr, A.F.; Macias, W.L.; Kollef, M.J.; Levi, M.; Reinhart, K.; Nelson, D.R. Dynamic evolution of coagulopathy in the first day of severe sepsis: Relationship with mortality and organ failure. Crit. Care Med. 2005, 33, 341–348. [Google Scholar] [CrossRef] [Scilit] [PubMed]
- Lorente, J.A.; García-Frade, L.J.; Landín, L.; de Pablo, R.; Torrado, C.; Renes, E.; García-Avello, A. Time course of hemostatic abnormalities in sepsis and its relation to outcome. Chest 1993, 103, 1536–1542. [Google Scholar] [CrossRef] [Scilit] [PubMed]
- Toh, J.M.H.; Ken-Dror, G.; Downey, C.; Abrams, S.T. The clinical utility of fibrin-related biomarkers in sepsis. Blood Coagul. Fibrinolysis 2013, 24, 839–843. [Google Scholar] [CrossRef] [Scilit] [PubMed]
- Semeraro, F.; Ammollo, C.T.; Caironi, P.; Masson, S.; Latini, R.; Panigada, M.; Pesenti, A.; Semeraro, N.; Gattinoni, L.; Colucci, M. D-dimer corrected for thrombin and plasmin generation is a strong predictor of mortality in patients with sepsis. Blood Transfus. 2020, 18, 304–311. [Google Scholar] [CrossRef] [Scilit] [PubMed]
- Schupp, T.; Weidner, K.; Rusnak, J.; Jawhar, S.; Forner, J.; Dulatahu, F.; Brück, L.M.; Hoffmann, U.; Kittel, M.; Bertsch, T.; et al. D-Dimer Levels and the Disseminated Intravascular Coagulation Score to Predict Severity and Outcomes in Sepsis or Septic Shock. Clin. Lab. 2023, 69, 985. [Google Scholar] [CrossRef] [Scilit] [PubMed]
- Schupp, T.; Weidner, K.; Rusnak, J.; Jawhar, S.; Forner, J.; Dulatahu, F.; Dudda, J.; Brück, L.M.; Hoffmann, U.; Bertsch, T.; et al. C-reactive protein and procalcitonin during course of sepsis and septic shock. Ir. J. Med. Sci. 2024, 193, 457–468. [Google Scholar] [CrossRef] [Scilit] [PubMed]
- Orfanu, A.; Aramă, V.; Popescu, C.; Tilişcan, C.; Streinu-Cercel, A.; Aramă, S.S. The Dynamical Assessment of Inflammatory Biomarkers in Predicting the Outcome of Septic Patients and the Response to Antimicrobial Therapy. J. Crit. Care Med. J. Crit. Care Med. 2020, 6, 25–31. [Google Scholar] [CrossRef] [Scilit] [PubMed]
- Varga, N.-I.; Benea, A.-T.; Suba, M.-I.; Bota, A.V.; Avram, C.R.; Boru, C.; Dragomir, T.L.; Prisca, M.; Tanasescu, S.; Susan, M.; et al. Predicting Mortality in Sepsis: The Role of Dynamic Biomarker Changes and Clinical Scores—A Retrospective Cohort Study. Diagnostics 2024, 14, 1973. [Google Scholar] [CrossRef] [Scilit] [PubMed]
- Yende, S.; Kellum, J.A.; Talisa, V.B.; Peck Palmer, O.M.; Chang, C.-C.H.; Filbin, M.R.; Shapiro, N.I.; Hou, P.C.; Venkat, A.; LoVecchio, F.; et al. Long-term Host Immune Response Trajectories Among Hospitalized Patients with Sepsis. JAMA Netw. Open 2019, 2, e198686. [Google Scholar] [CrossRef] [Scilit] [PubMed]
- Wang, B.-Y.; Liu-Fu, R.; Dong, R.; Chen, Y.; Wu, Y.; Zhao, X.-J.; Sun, Y.-L.; Du, B.; Weng, L. Clinical Characteristics and Prognosis of Sepsis Subphenotypes Identified by Coagulation Indicator Trajectories: A Single-Center Retrospective Study. Thromb. Haemost. 2025. online ahead of print. [Google Scholar] [CrossRef] [Scilit] [PubMed]
- Su, J.; Tie, X.; Zhou, R.; Zou, T.; Qin, Y.; Zeng, X.; Li, Y.; Yin, W. Correlation between sub-phenotypes of coagulopathy and prognosis in sepsis patients in ICU using longitudinal group trajectory modeling: A retrospective analysis. Eur. J. Med. Res. 2026, 31, 233. [Google Scholar] [CrossRef] [Scilit] [PubMed]
- Ding, Z.; Li, Q.; Ma, C.; Li, H. Diagnostic utility of combined coagulation and inflammatory biomarkers in sepsis stratification: A retrospective study. Clin. Chim. Acta 2026, 578, 120558. [Google Scholar] [CrossRef] [Scilit] [PubMed]
- Qu, X.; Wang, S.; Ye, X.; Jiang, G.; Kuerban, M.; Xie, Q. Prognostic value of baseline plasma D-dimer levels in sepsis: A prospective cohort study. Pract. Lab. Med. 2025, 46, e00498. [Google Scholar] [CrossRef] [Scilit] [PubMed]
- Curran, P.J.; Bauer, D.J. The disaggregation of within-person and between-person effects in longitudinal models of change. Annu. Rev. Psychol. 2011, 62, 583–619. [Google Scholar] [CrossRef] [Scilit] [PubMed]
- von Elm, E.; Altman, D.G.; Egger, M.; Pocock, S.J.; Gøtzsche, P.C.; Vandenbroucke, J.P.; STROBE Initiative. The Strengthening the Reporting of Observational Studies in Epidemiology (STROBE) statement: Guidelines for reporting observational studies. PLoS Med. 2007, 4, e296. [Google Scholar] [CrossRef] [Scilit] [PubMed]

Disclaimer/Publisher’s Note: The statements, opinions and data contained in all publications are solely those of the individual author(s) and contributor(s) and not of MDPI and/or the editor(s). MDPI and/or the editor(s) disclaim responsibility for any injury to people or property resulting from any ideas, methods, instructions or products referred to in the content. |
© 2026 by the authors. Licensee MDPI, Basel, Switzerland. This article is an open access article distributed under the terms and conditions of the Creative Commons Attribution (CC BY) license.