


Abstract
Introduction: Myxovirus resistance protein 1 (MX1) contributes to resistance against viral infections, including to influenza, and has recently been implicated in cancer. Methods: A tissue microarray with 17,909 samples from 145 tumor types/subtypes and 608 samples from 76 normal tissue types was analyzed by immunohistochemistry (IHC) to assess MX1 expression. Results: MX1 positivity was found in tumor cells of 5956 of 14,512 analyzable samples, and 131 of 145 entities included at least one positive case. High positivity rates occurred in squamous cell carcinomas (up to 88%), neuroendocrine neoplasms (up to 85%), germ cell neoplasms (up to 77%), salivary gland tumors (up to 75%), mesothelioma (up to 74%), endometrial and ovarian carcinomas (up to 73%), cervical adenocarcinoma (73%), pancreatic ductal adenocarcinoma (65%), and urothelial carcinoma (up to 62%). MX1 expression correlated with PD-L1 positivity and CD8+ lymphocyte density (p < 0.0001 each). High MX1 expression was linked to grade progression in breast cancer (p < 0.0001), microsatellite instability in colorectal adenocarcinoma (p = 0.0003), high grade (p = 0.0431) and advanced pT stage (p = 0.0269) in hepatocellular carcinoma, distant metastasis in clear cell renal cell carcinoma (ccRCC, p = 0.0164), and nodal metastasis in papillary RCC (pRCC; p = 0.0326). Low MX1 expression was linked to stage progression in muscle-invasive urothelial carcinoma (p = 0.0372) and colorectal adenocarcinoma (p = 0.0002), papillary (p = 0.013) and follicular (p = 0.0221) thyroid cancer, and nodal metastasis in serous high-grade ovarian carcinoma (p = 0.0355). MX1 expression was unrelated to phenotype in endometrioid endometrial and ovarian carcinoma. Conclusions: MX1 expression in tumors is strongly linked to CD8+ lymphocyte density and PD-L1 expression, suggesting an association with an immune-inflamed, type I interferon-related tumor microenvironment.
1. Introduction
The interferon-induced GTP-binding protein MX1 (myxovirus resistance protein 1) is encoded by the MX1 gene on chromosome 21q22.3. MX1 RNA is ubiquitously found in normal tissues. The MX1 protein belongs to a family of large GTPases which is part of the dynamin superfamily. MX1 expression is induced by type I interferons (IFNs), primarily IFN-α and IFN-β, which are part of the body’s innate immune response to viral infections [1]. In cell lines and in transgenic mice, MX1 plays a role in resistance to infections by several different viruses including influenza [2]. The molecular mechanisms causing resistance to virus infection are not well understood. Humans carrying different allelic variants of MX1 do not appear to be subjected to a different risk for acquiring influenza virus infections or an increased likelihood for a severe disease course [3].
Several recent studies using cell lines and animal models have proposed a role of MX1 in cancer. For example, MX1 overexpression was described to occur in malignant melanomas [4,5], cancers of the breast [6,7], head and neck cancer [8], colorectal adenocarcinomas [9], and squamous cell carcinomas (SQCCs) of various sites of origin [8,10]. Several reports have also described a clinical significance of MX1 overexpression in cancer. In breast cancer, high MX1 expression was significantly associated with a large tumor size, high histological grade, and poor prognosis [6,7]. In colorectal cancer, MX1 protein overexpression was found to play a role in lymph node metastasis [9]. Conversely, in head and neck cancer cells, it was found that low levels of MX1 protein contribute to apoptosis resistance during cancer development [10]. Downregulation of MX1 has been reported in prostate adenocarcinomas as compared to normal prostate glands [11]. In melanoma and prostate cancer cell lines, MX1 inhibited motility and invasiveness of tumor cells [11,12,13]. An in vitro study on colorectal carcinoma revealed that MX1 silencing in colon cancer cells reduced tumor cell migration and invasion [9]. Our own preliminary data also point towards an association between low MX1 expression and poor prognosis in a cohort of 1011 muscle-invasive urothelial carcinomas treated by cystectomy (unpublished data). As clinically established prognostic markers are still lacking for the urinary bladder [14], and not even the histologic grading can predict disease course, these data raise the hope that MX1 expression could be a major prognostic feature for other tumors as well.
To better understand the prevalence and potential role of MX1 protein expression in cancer, a survey of MX1 in a broad range of tumor types by immunohistochemistry (IHC) is needed. Therefore, in this study, we evaluated MX1 protein expression in more than 17,900 tumor tissue samples from 145 different tumor types and subtypes as well as 76 non-neoplastic tissue categories in a tissue microarray (TMA) format.
2. Materials and Methods
2.1. Tissue Microarrays (TMAs)
Our normal TMA was composed of 8 samples from 8 different donors from each of the 76 different normal tissue types (608 samples on one slide). The cancer TMAs included a total of 17,909 primary tumors from 145 different tumor types and subtypes. Detailed histopathological and molecular data were available for subtypes of cancers of the breast (n = 1680), kidney (n = 1757), liver (n = 301), bladder (n = 829), thyroid (n = 518), colon (n = 2351), endometrium (n = 259), and ovary (n = 524). Data on PD-L1 expression were available for 11,836 cancers, and on the density of CD8+ lymphocyte for 7747 cancers from a previous study using subsets of our TMAs (extended from [15]). The criteria for PD-L1 evaluation have been described before [15]. The composition of normal and cancer TMAs is described in Section 3. All samples were from the archives of the Institute of Pathology, University Hospital of Hamburg, Germany, the Institute of Pathology, Clinical Center Osnabrueck, Germany, and the Department of Pathology, Academic Hospital Fuerth, Germany. Tissues were fixed in 4% buffered formalin and then embedded in paraffin. The TMA manufacturing process was described earlier in detail [16,17]. In brief, one tissue spot (diameter: 0.6 mm) per patient was used. The use of archived remnants of diagnostic tissues for TMA manufacturing, their analysis for research purposes, and the use of patient data were in accordance with local laws (HmbKHG, §12) and the analysis was approved by the local ethics committee (Ethics commission Hamburg, WF-049/09). All work was carried out in compliance with the Helsinki Declaration.
2.2. Immunohistochemistry (IHC)
Freshly cut TMA sections were immunostained on one day and in one experiment. Slides were deparaffinized with xylene, rehydrated through a graded alcohol series and exposed to heat-induced antigen retrieval for 5 min in an autoclave at 121 °C in pH 7.8 Tris-EDTA-Citrate (TEC) buffer. Endogenous peroxidase activity was blocked with Dako REAL Peroxidase-Blocking Solution (Agilent Technologies, Santa Clara, CA, USA; #S2023) for 10 min. The primary antibody specific for MX1 (mouse monoclonal, HMV316, ardoci GmbH, Hamburg, Germany; cat. #6563-316) was applied at 37 °C for 60 min at a dilution of 1:150. For antibody validation, the normal tissue TMA was also analyzed by the rabbit monoclonal MX1 antibody clone D3W7I (Cell Signaling Technology, Danvers, MA, USA, cat. #37849) at a dilution of 1:7.5 and an otherwise identical protocol. Bound antibody was then visualized using the Dako REAL EnVision Detection System Peroxidase/DAB+, Rabbit/Mouse kit (Agilent Technologies, Santa Clara, CA, USA; #K5007) according to the manufacturer’s directions. The sections were counterstained with hemalum. All tissue spots were analyzed by one pathologist to enable the best possible consistency of interpretation within the study. For tumor tissues, the percentage of positive neoplastic cells was estimated, and the staining intensity was semi-quantitatively recorded (0, 1+, 2+, 3+). For statistical analyses, the staining results were categorized into four groups. Tumors without any staining were considered negative. Tumors with 1+ staining intensity in ≤70% of tumor cells or 2+ intensity in ≤30% of tumor cells were considered weakly positive. Tumors with 1+ staining intensity in >70% of tumor cells, 2+ intensity in 31–70%, or 3+ intensity in ≤30% of tumor cells were considered moderately positive. Tumors with 2+ intensity in >70% or 3+ intensity in >30% of tumor cells were considered strongly positive. This scoring system is established for the identification of diagnostic and prognostic markers and has been used in numerous marker studies by our group.
2.3. Statistics
Statistical calculations were performed with JMP17® software (SAS®, Cary, NC, USA). Contingency tables and the chi2-test were used to search for associations between MX1 immunostaining and tumor phenotype and PD-L1 immunostaining in tumor cells. Analysis of variance (ANOVA) analysis was used to search for associations between MX1 immunostaining and density of CD8+ lymphocytes. A p-value of ≤0.05 was considered statistically significant.
3. Results
3.1. Technical Issues
A total of 14,512 (81%) of 17,909 tumor samples were interpretable in our TMA analysis. Non-interpretable samples demonstrated absence of unequivocal tumor cells or a complete lack of individual tissue spots. The fraction of interpretable samples varied between tumor entities and was lowest in salivary gland tumors (407 of 1313; 31%). At least four samples of each normal tissue type were evaluable.
3.2. MX1 in Normal Tissues
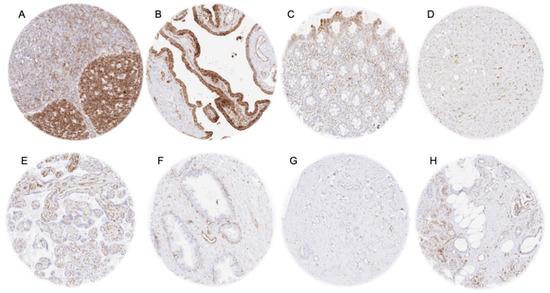
MX1 staining was always cytoplasmic. A strong MX1 positivity was especially seen in lymphatic cells (most intense in germinal centers), macrophages, and in endothelial cells (also sinus cells of the liver). Accordingly, some positive cells occurred in virtually all tissue types. A moderate to strong MX1 positivity was also seen in cells of the hematopoiesis, epithelial cells of the fallopian tube, surface epithelial cells of the gastrointestinal tract, a subset of epithelial cells of the gallbladder, subsets of respiratory epithelial cells, medullary cells of the adrenal gland, and groups of epithelial cells in salivary glands. A weak-to-moderate MX1 staining was seen in amnion cells, basal cells of the prostate (acinar cells negative), basal cells and in a subset of chief cells in the caput epididymis, follicular cells of the thyroid, a subset of epithelial cells of seminal vesicles, a subset of tubuli (mainly atrophic) and collecting ducts of the kidney. In some but not in all samples, there was a weak-to-strong staining, predominantly in the lower half of the epidermis and other squamous epithelia, or a weak-to-moderate positivity of the urothelium. Examples of MX1-positive normal tissues are shown in Figure 1.
Figure 1.
MX1 immunostaining in normal tissues. The panels show a strong cytoplasmic staining in tonsil germinal centers (A) and epithelial cells of the fallopian tube (B), weak-to-moderate staining of surface epithelial cells of the rectum (C), sinus cells of the liver (D), endothelial cells of the mature placenta (E), and basal cells of the prostate gland (F). MX1 staining was negative in breast epithelial cells (G) and in proliferative endometrial epithelium (H).
MX1 was largely negative in smooth muscle, heart muscle, skeletal muscle, myometrium, fat tissue, chorion and trophoblast cells of the placenta, hepatocytes, adrenocortical cells, adeno- and neurohypophysis, cerebrum, cerebellum, ovary (stroma cells, granulosa cells, theca cells, and corpus luteum cells), endometrium, endocervix, breast epithelial cells, testis, pancreas, and pneumocytes. However, in several of these “negative” tissue types, a distinct MX1 staining was occasionally seen in individual samples, especially in case of a “tissue damage” (Supplementary Figure S1).
3.3. MX1 Expression in Cancer
In tumor samples, a cytoplasmic MX1 staining was seen in lymphocytic cells, macrophages, endothelial cells, and, often, also in tumor cells. MX1 positivity of tumor cells was detectable in 5956 (41%) of the 14,512 analyzable tumor samples, including 1724 (12%) with weak, 978 (6.7%) with moderate, and 3254 (23%) with strong positivity. A total of 131 of 145 tumor types and subtypes showed detectable MX1 positivity, 121 of which included at least one case with strong positivity (Table 1).
Table 1.
MX1 immunostaining in tumors.
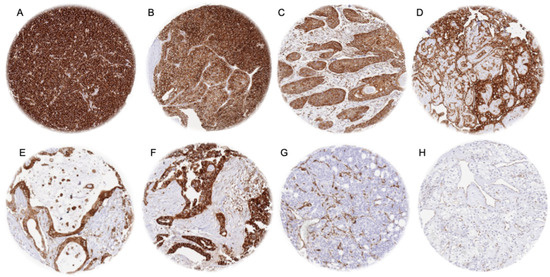
Representative images of MX1-positive tumors are shown in Figure 2.
Figure 2.
MX1 immunostaining in cancer. The panels show a strong, cytoplasmic MX1 positivity of all tumor cells of a diffuse large B-cell lymphoma (A), a neuroendocrine carcinoma of the ileum (B), a squamous cell carcinoma of the oral cavity (C), a mesothelioma (D), an adenocarcinoma of the pancreas (E), and a serous adenocarcinoma of the ovary (F). Examples of MX1-negative tumor cells but MX1-positive stroma cells include an adenocarcinoma of the prostate (G) and a clear cell renal cell carcinoma (H).
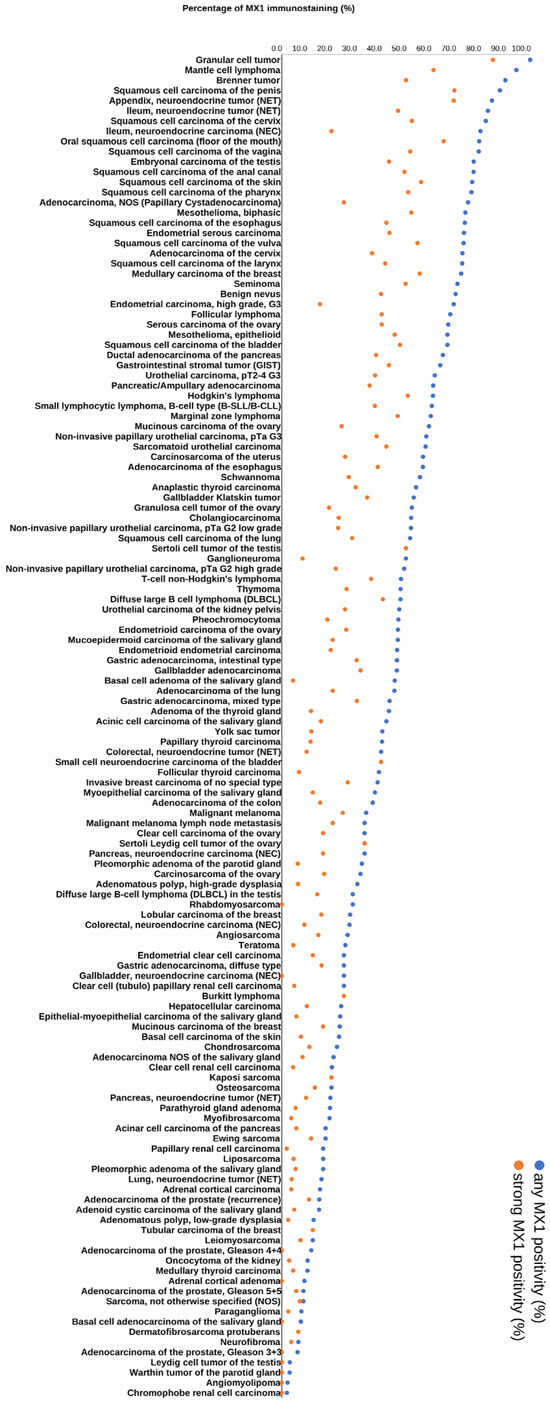
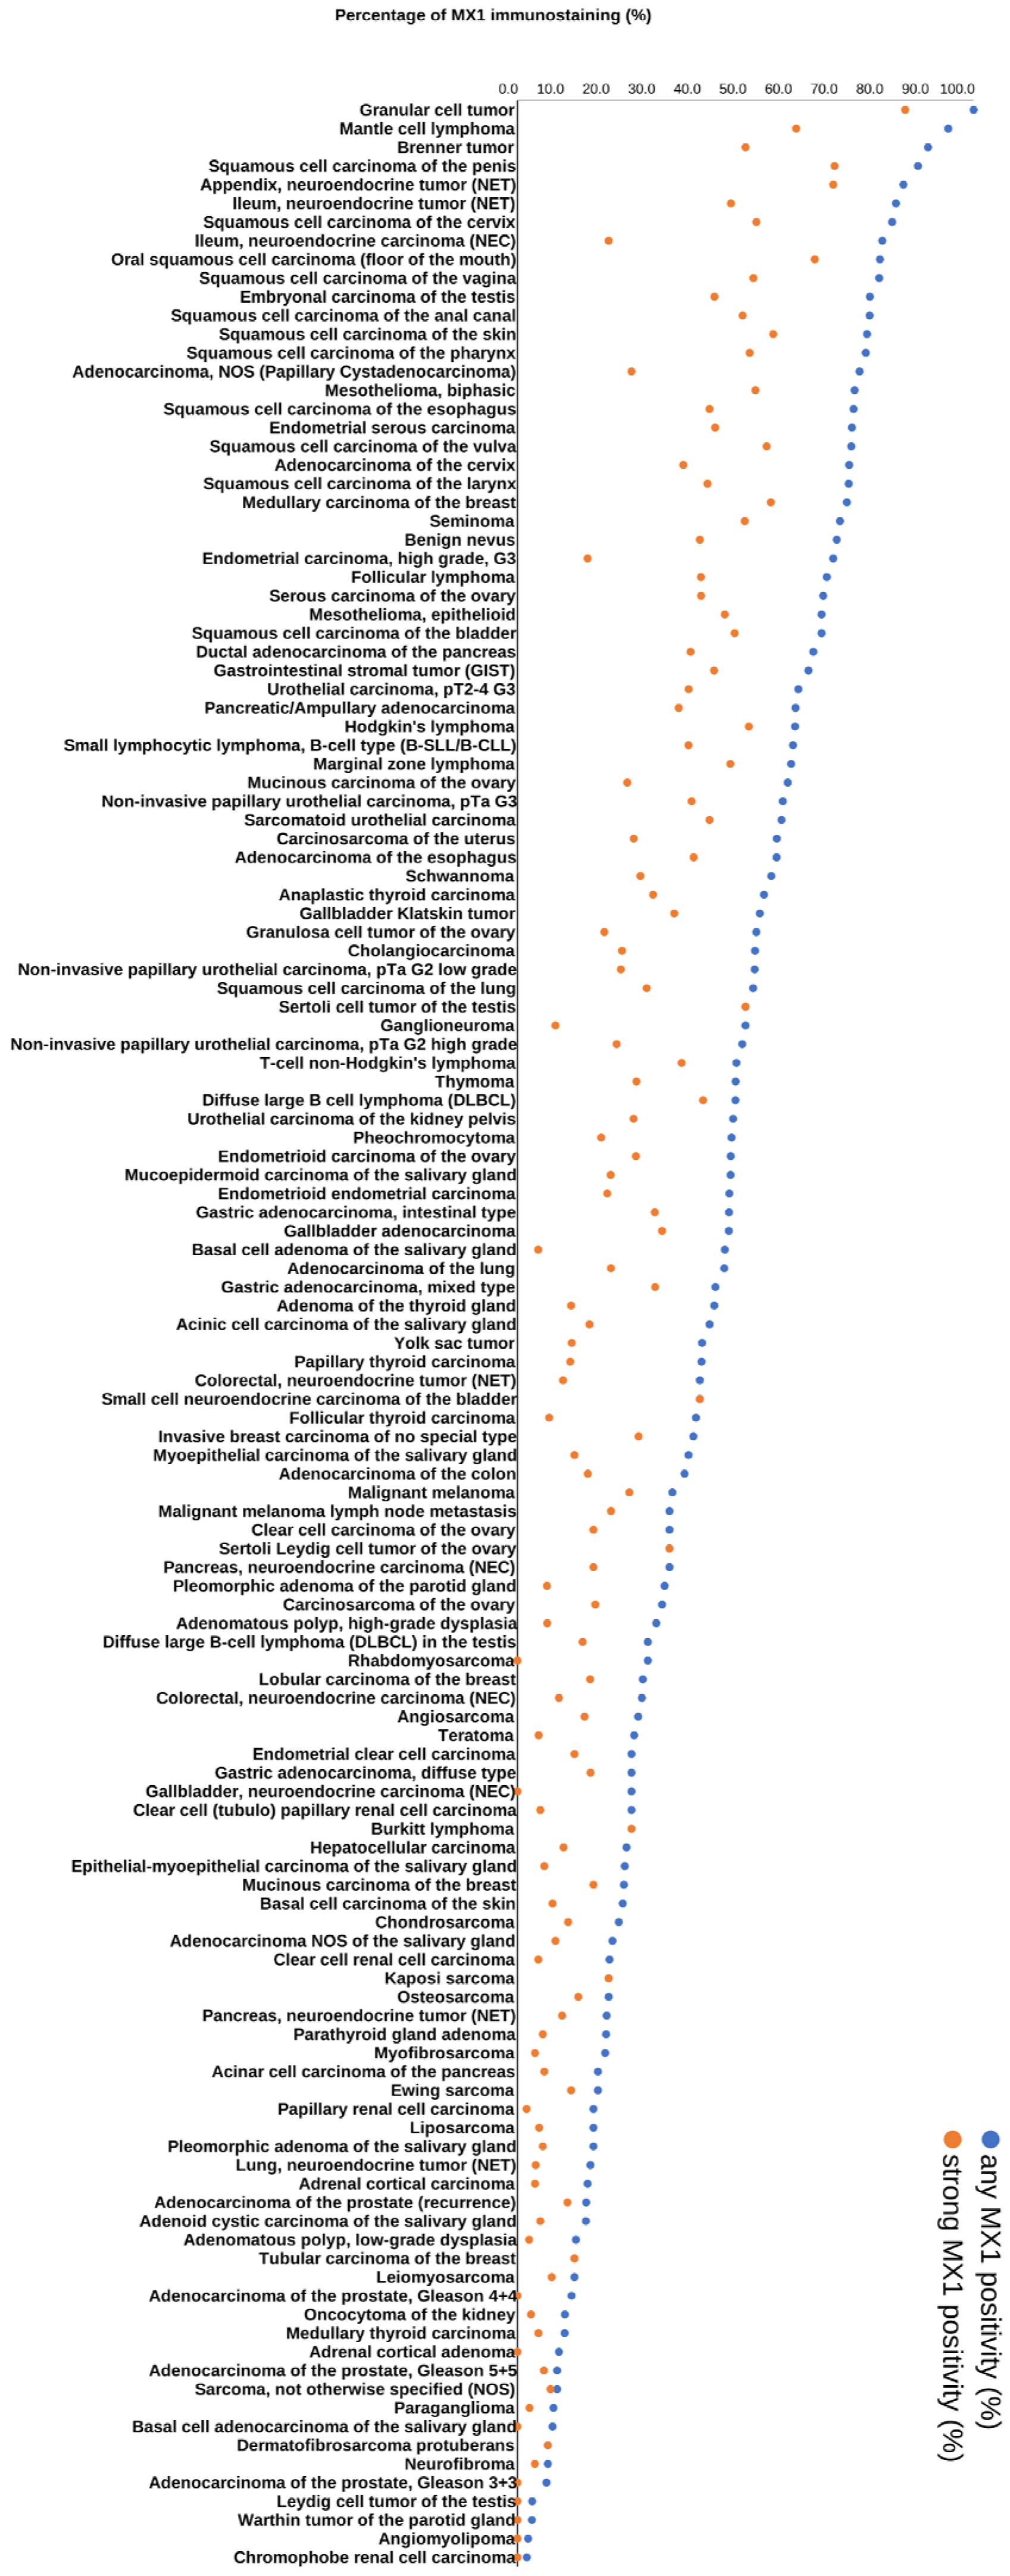
A particularly high rate of MX1 positivity was observed in granular cell tumors (100%), malignant lymphomas (up to 94%), squamous cell carcinomas of different sites of origin (up to 88%), neuroendocrine neoplasms (up to 85%), germ cell neoplasms (up to 77%), salivary gland tumors (up to 75%), malignant mesothelioma (up to 74%), endometrial and ovarian carcinomas (up to 73%), adenocarcinoma of the cervix (73%), ductal adenocarcinoma of the pancreas (65%), and in urothelial carcinomas (up to 62%). A graphical representation of a ranking order of MX1-positive and strongly positive cancers is given in Figure 3.
Figure 3.
Ranking order of MX1 immunostaining in tumors. Both the percentage of positive cases (blue dots) and the percentage of strongly positive cases (orange dots) are shown.
3.4. MX1 Expression and Tumor Phenotype
The relationship between MX1 expression and clinically important histopathological and molecular tumor features in carcinomas from different sites is shown in Table 2.
Table 2.
MX1 immunostaining and tumor phenotype.
High MX1 expression was associated with high grade in breast cancer of no special type (p < 0.0001), microsatellite instability in colorectal adenocarcinoma (CRC, p = 0.0003), high grade (p = 0.0431) and advanced pT stage (p = 0.0269) in hepatocellular carcinoma, distant metastasis in clear cell renal cell carcinoma (ccRCC; p = 0.0164), and nodal metastasis in papillary RCC (pRCC; p = 0.0326). Low MX1 was associated with advanced stage in muscle-invasive urothelial carcinoma (p = 0.0372), colorectal adenocarcinoma (p = 0.0002), and in both papillary (p = 0.013) and follicular (p = 0.0221) thyroid cancer, as well as with nodal metastasis in serous high-grade ovarian carcinoma (p = 0.0355). However, the analyses are exploratory, and associations with borderline p-values may not hold after correction for multiple testing. MX1 expression was unrelated to tumor phenotype in endometrioid endometrial carcinoma, and in endometrioid ovarian carcinoma.
3.5. MX1 Expression, PD-L1 Status, and Tumor-Infiltrating CD8+ Lymphocytes
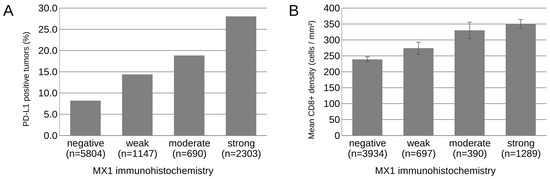
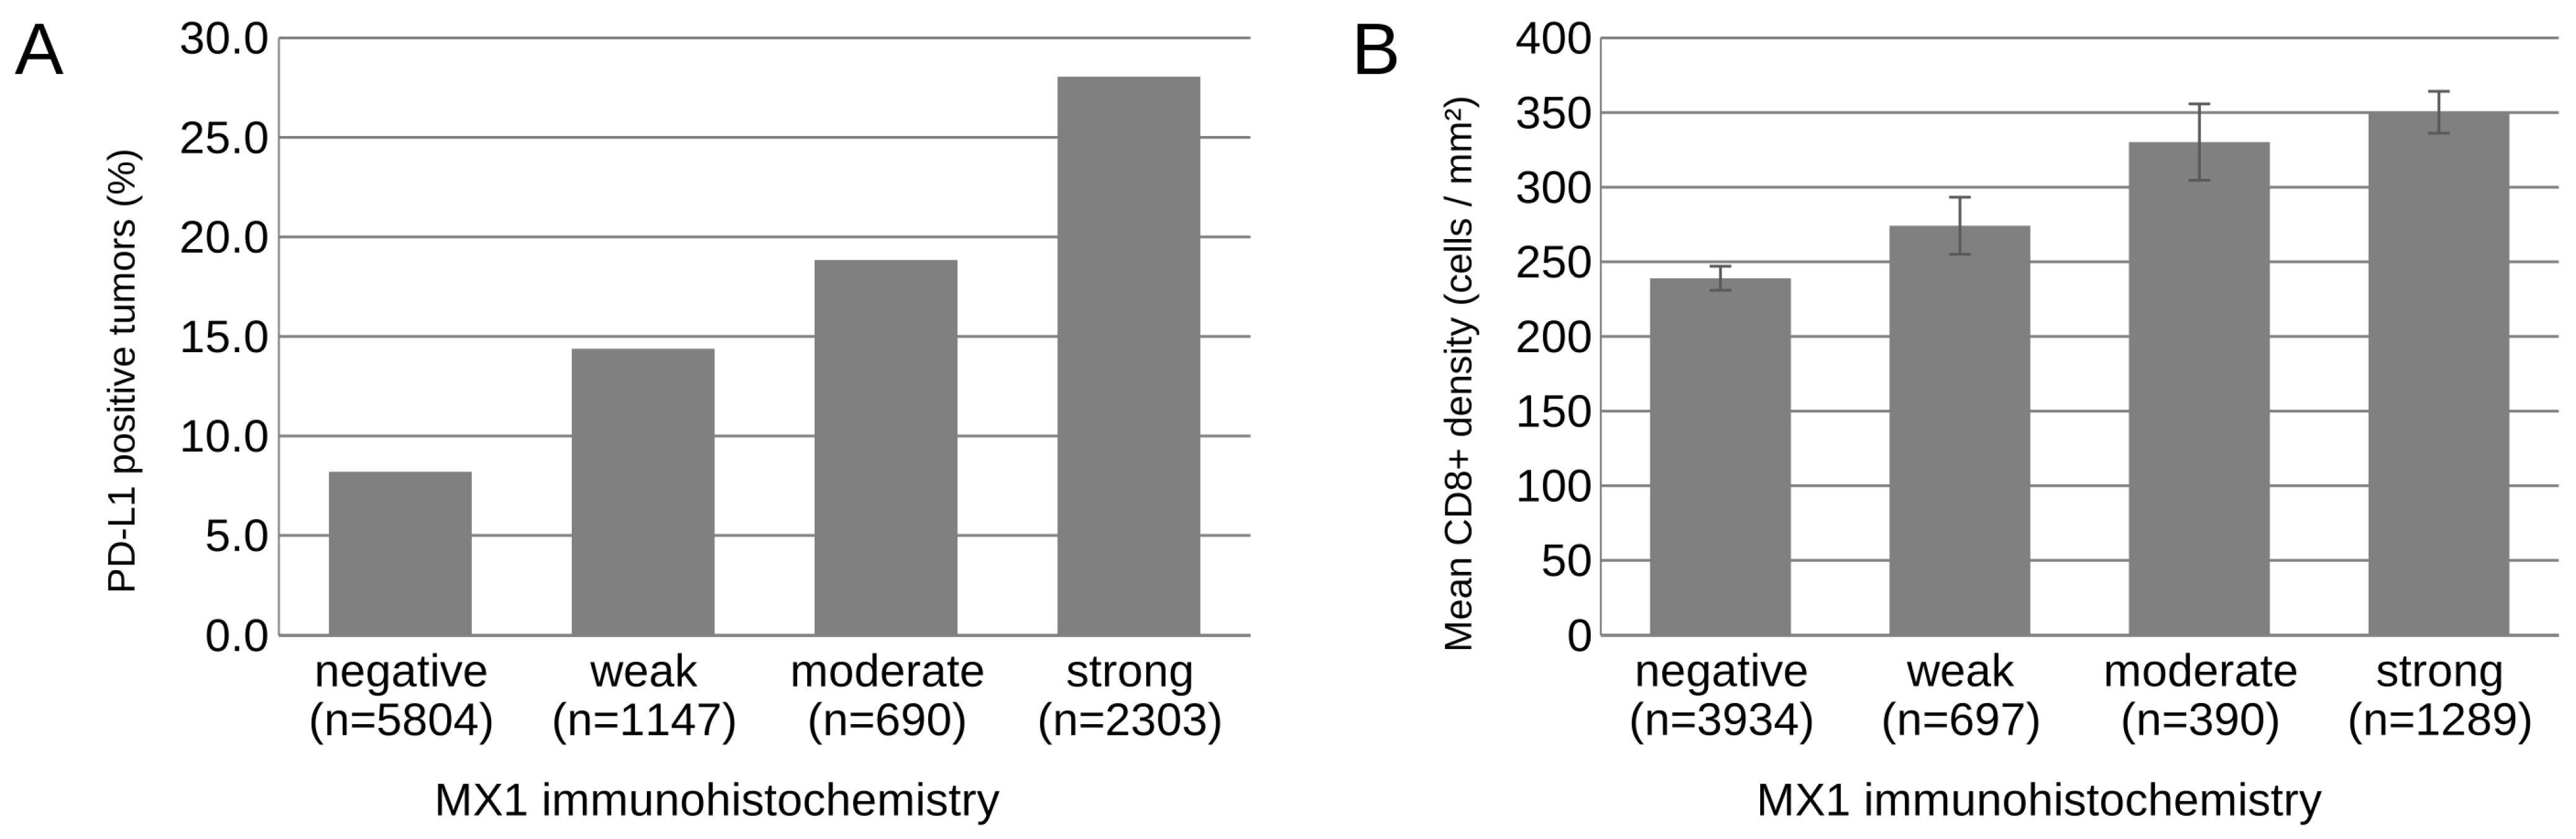
Of the 11,836 tumors with available PD-L1 data, 9944 were also interpretable for MX1, and of the 7747 tumors with available data on CD8+ lymphocyte density, 6310 were also interpretable for MX1. Across all tumor entities, there was a highly significant association between high MX1 expression in tumor cells and PD-L1 positivity of tumor cells (p < 0.0001; Figure 4A). There was also a significant link between MX1 expression and the density of CD8+ lymphocytes (p < 0.0001, Figure 4B). These associations were independent of the tumor entity. In a logistic regression model including tumor entity as a covariate, the likelihood of PD-L1 positivity increased with the level of MX1 staining (odds ratio versus MX1-negative tumors: 1.83, 95% CI 1.48–2.26 for weak; 2.61, 2.04–3.34 for moderate; 4.96, 4.18–5.88 for strong MX1 staining; p < 0.0001). In a linear model adjusted for tumor entity, the density of CD8+ lymphocytes was 1.36-fold (1.20–1.54), 1.47-fold (1.25–1.73), and 1.85-fold (1.67–2.05) higher in tumors with weak, moderate, and strong MX1 staining, respectively, than in MX1-negative tumors (p < 0.0001). This relationship also held true within individual tumor types such as for CRC (p < 0.0001), ccRCC (p < 0.0001), and serous high-grade ovarian carcinoma (p = 0.0158).
Figure 4.
Relationship between MX1 immunostaining and PD-L1 positivity in tumor cells (A) and CD8+ lymphocyte density (B) across all tumor entities.
4. Discussion
The successful analysis of 14,512 tumors from 145 tumor entities provides a comprehensive overview on the prevalence of MX1 expression in tumor cells across a broad range of different tumor entities. Our data demonstrate substantial heterogeneity of tumoral MX1 expression between cancer types and individual patients. The fact that 131 of the 145 analyzed tumor entities had at least one MX1-positive case, and 121 of them contained at least one case with strong MX1 positivity demonstrates that MX1 expression is a common feature of cancer cells. It is still conspicuous that some cancer entities such as squamous cell carcinomas of various sites, several categories of neuroendocrine tumors (NETs), germ cell neoplasms, adenocarcinoma of the cervix, ovarian and endometrial cancer, ductal adenocarcinoma of the pancreas, urothelial carcinomas, and lymphomas particularly often showed high MX1 expression levels while other entities such as prostatic adenocarcinomas, renal cell carcinomas, salivary gland tumors as well as many mesenchymal tumors were MX1-positive markedly less frequently.
The most significant finding of this study is the striking link between MX1 positivity of tumor cells and a high density of CD8+ lymphocytes in the tumor microenvironment. This observation is consistent with data from three previous studies on 845 and 168 breast cancers [6,18], as well as on 195 head and neck cancers [8] which all reported significant associations between MX1 in tumor cells and increased numbers of tumor-infiltrating lymphocytes. These observations are well in line with the response of tumor cells and T-cells to the interferons IFN-α and IFN-β which are secreted by plasmacytoid dendritic cells and macrophages in the tumor microenvironment [19,20]. One possible mechanism could be based on the direct regulation of the MX1 gene, a direct transcriptional target of these interferons [21], which in parallel also activates the proliferation and recruitment of CD8+ lymphocytes [4]. That MX1 expression also correlated with PD-L1 expression in cancer cells is consistent with the well-known relationship between the extent of intratumoral immune cells and PD-L1 expression of tumor cells [22]. However, Gong et al. found that cancer cell-specific type I interferon signaling promoted cancer stemness and CD8+ T-cell exhaustion in tumor models and the functional lymphocyte state was not assessed in our study [8].
The striking relationship between MX1 expression and the extent of immune cell infiltration could serve as an explanation for the partly conflicting relationship between MX1 expression and parameters of cancer aggressiveness. In a previous study applying the same MX1 IHC assay to a cohort of 1980 urothelial carcinomas of the urinary bladder, we had already found highly counterintuitive results with a marked increase in MX1 expression with increasing grade of malignancy in non-invasive carcinomas while low MX1 expression correlated with advanced stage—consistent with the data from the present study—and shortened survival in muscle-invasive carcinomas (unpublished data). Based on these results it was hypothesized that MX1 expression might increase in cancers with high genomic instability and high immunogenicity. This is also supported by studies reporting associations between DNA damage accumulation and type I interferon upregulation in systemic sclerosis [23], psoriatic arthritis [24], and germ cell cancers with induction of MX1 expression [25]. In such a scenario, MX1 expression would increase in high-grade tumors because a high number of genomic alterations typically goes along with particularly drastic morphologic aberrations resulting in a high-grade tumor aspect [26]. Although genomically instable high-grade tumors might induce a strong immune reaction, the immune cells would not be capable of “downgrading” the morphologic features of the tumor cells. An increased immune response of MX1-positive tumors could, however, limit the expansion of a cancer, confine a tumor to a low pT stage, and result in significant associations between MX1 positivity and low pT stage and favorable prognosis.
A large majority of the relationships between MX1 expression and parameters of cancer aggressiveness are in line with this concept of MX1 representing a surrogate parameter for an immune-inflamed, type I interferon-related tumor microenvironment. The high number of mutations and the high immunogenicity found in colorectal cancer could explain the fact that MX1 expression was strongly linked to MSI. The fact that high MX1 expression was associated with high grade in breast cancer of no special type and in hepatocellular carcinoma is consistent with the concept that a high level of genomic alterations in high-grade tumors results in increased immunogenicity and a strong immune response which, however, cannot “down-grade” a tumor. In agreement with our data, four earlier studies analyzing the relationship between MX1 expression and the histological grade in cancer by IHC also identified a link between high grade and high MX1 expression [6,7,9,18]. Of note, in none of the tumor entities in our study was a high grade associated with low MX1 expression.
The fact that high levels of MX1 expression were linked to low stage in muscle-invasive urothelial carcinoma, colorectal adenocarcinoma, as well as in papillary and in follicular thyroid cancer demonstrates that MX1 expression—although related to high grade in many tumor types—is not a marker of cancer aggressiveness “per se”. In line with a proposed role as a marker of an immune-inflamed tumor microenvironment, high levels of MX1 in tumor cells may indicate a strong host immune response that can confine local tumor expansion and therefore can go along with a low tumor stage. Of three earlier studies analyzing the relationship between MX1 expression and the pT stage, one had also identified a link between low pT and high MX1 expression [6] while one study did not find a significant relationship [8] and one found an opposite result [7]. It must be expected that even a strong immune reaction may not be able to notably confine cancer expansion in the case of highly aggressive cancers. In our study, high MX1 expression was associated with low pT stage in four cancer entities, but in one entity (hepatocellular carcinoma), a high MX1 level was associated with a high pT stage.
Considering the large scale of our study, emphasis was placed on an adequate validation of our MX1 IHC assay. The International Working Group for Antibody Validation (IWGAV) has proposed that an acceptable antibody validation for IHC on formalin-fixed tissues must include either a confirmation of the findings obtained by a second independent antibody or a comparison with expression data obtained by another independent method [27]. Both approaches have been followed in this study. Given the high variability of MX1 expression within normal tissue types, the occurrence of MX1-positive cell types (i.e., endothelia, lymphocytes, macrophages) in virtually all organs, and the cell type specificity of MX1 expression, a comparison with a method based on disaggregated tissue is suboptimal for MX1 antibody validation. In agreement with RNA expression data obtained from three independent databases [28,29,30,31], the highest MX1 staining levels were seen in hematolymphoid tissues. The best evidence for the validity of our assay comes from a confirmation of all MX1-positive cell types and staining variabilities within individual tissue samples seen by the independent antibody clone D3W7I. The additional diffuse staining of smooth muscle cells observed with clone D3W7I but not with HMV316 represents an antibody-specific cross-reactivity of the clone D3W7I (Supplementary Figure S3). It is of note that the use of a very broad selection of normal tissues (n = 76) for antibody validation maximizes the probability for detecting cross-reactivities because virtually all proteins occurring in normal human adult cells are included in the validation process.
A limitation of our study is that for some rare tumor entities, fewer than 10 tumors could be analyzed. The absence of MX1 staining in these tumor types can therefore not exclude the possibility that they also express MX1 at least occasionally. It is of note, that tumor heterogeneity can always impact the results of IHC studies because entire tumors cannot be analyzed and even a whole section containing a 3 × 2 cm tumor would only represent 0.0023% of the mass of a tumor measuring 5 cm in diameter. The likelihood of detecting focal aberrations increases with the quantity of analyzed tissue [32,33]. In this study, the use of a TMA containing one 0.6 mm spot per tumor offers the advantage of a standardized tissue quantity per tumor while tumor quantity could range from <1 mm2 to >6 cm2 (x-fold range > 60) if whole sections were used. Accordingly, the only study searching for prognostic features on whole sections and TMAs from a large cohort of patients has provided superior results for TMAs [33].
5. Conclusions
Our data provide an overview on the prevalence of MX1 expression in cancer cells across 145 different tumor types and demonstrate that high MX1 expression is strongly linked to CD8+ lymphocyte infiltration and PD-L1 expression. Although the mechanisms leading to MX1 overexpression remain unclear, MX1 positivity appears to be a marker of an immune-inflamed, type I interferon-related tumor microenvironment.
Supplementary Materials
The following supporting information can be downloaded at https://www.mdpi.com/article/10.3390/biomedicines14112455/s1. Figure S1 Examples of variability of MX1 staining in normal tissues. (A) Normal breast with mild inflammation and some MX1-positive epithelial cells, (B) normal kidney cortex with occasional MX1 staining in individual tubules. Figure S2. Immunohistochemistry validation by comparison of two antibodies. The panels show a concordance of immunostaining results obtained by two independent MX1 antibodies with respect to both stained cell types and intensity distribution within tissues. Using HMV316, a cytoplasmic staining is seen in squamous epithelium of the skin (A), urothelial cells of the urinary bladder (B), tonsil lymphocytes (C), surface epithelial cells of the stomach (D), sinus cells of the liver (E), some foci of the gallbladder epithelium (F), and a subset of collecting ducts in the renal medulla (G) while staining was absent in smooth muscle (H). Using clone D3W7I, a comparable staining was seen in the skin (I), bladder (K), tonsil (L), stomach (M), liver (N), gallbladder (O), and the kidney (P). In contrast to HMV316, clone D3W7I also showed an diffuse staining of smooth muscle cells (Q). This staining was considered an antibody-specific cross-reactivity of D3W7I. The images A-H and I-Q are from consecutive tissue sections. Figure S3. MX1 immunostaining obtained by two independent antibodies. The panels show cross—reactivity of the antibody D3W71 in smooth muscle cells (black arrow) of the uterus (a/b) and the urinary bladder (c/d), which was not observed with the antibody HMV316 (A-D).
Author Contributions
Conceptualization, B.B., K.J., R.S. (Ronald Simon) and G.S.; methodology, B.B., M.L., R.S. (Ronald Simon) and G.S.; validation, A.H., S.B., C.v.B., F.J., D.D., R.S. (Ria Schlichter), P.L., C.B., V.C., P.C., S.K., M.L., T.S.C., A.H.M., W.W., M.C.T., S.S., S.M. and T.K.; formal analysis, R.S. (Ronald Simon), C.H.-M., G.M.-F. and M.K.; investigation, B.B., A.H., S.B., C.v.B., F.J., D.D., R.S. (Ria Schlichter), P.L., C.B., V.C., P.C., S.K., M.L., T.S.C., A.H.M., W.W., M.C.T., S.S., S.M., T.K., M.F. and K.J.; writing—original draft preparation, B.B., K.J., R.S. (Ronald Simon) and G.S.; writing—review and editing, A.H., S.B., C.v.B., F.J., D.D., R.S. (Ria Schlichter), P.L., C.B., V.C., P.C., S.K., M.L., T.S.C., A.H.M., W.W., M.C.T., S.S., S.M., T.K., M.F., C.H.-M., G.M.-F. and M.K.; data curation, B.B., A.H., S.B., C.v.B., F.J., D.D., R.S. (Ria Schlichter), P.L., C.B., V.C., P.C., S.K., M.L., T.S.C., A.H.M., W.W., M.C.T., S.S., S.M., T.K., M.F., C.H.-M., G.M.-F., M.K. and K.J.; supervision and project administration, K.J., R.S. (Ronald Simon) and G.S. All authors have read and agreed to the published version of the manuscript.
Funding
This research received no external funding.
Institutional Review Board Statement
Formal ethics approval was not required for this study because anonymized archived diagnostic tissue samples were used for the preparation and analysis of tissue microarrays (TMAs). The Ethics Commission Hamburg (reference number: WF-049/09) confirmed that there were no ethical concerns regarding the use of anonymized human tissue samples for TMA research. The study was conducted in accordance with applicable local legislation (HmbKHG, Section 12) and the Declaration of Helsinki.
Informed Consent Statement
Informed consent was not required in accordance with local legislation (HmbKHG, Section 12(1)), as the study used anonymized leftover diagnostic tissue samples.
Data Availability Statement
All data generated or analyzed during this study are included in this published article.
Acknowledgments
We are grateful to Melanie Steurer, Laura Behm, Inge Brandt, and Sünje Seekamp for excellent technical assistance.
Conflicts of Interest
The mouse monoclonal MX1 antibody, clone HMV316, was provided by ardoci GmbH, Hamburg, Germany (owned by a family member of GS). This in-kind contribution was limited to the provision of the antibody reagent. Ardoci GmbH and the related individual had no role in the study design, data collection, data analysis, interpretation of the results, preparation of the manuscript, or the decision to submit the manuscript for publication.
Abbreviations
The following abbreviations are used in this manuscript:
| CRC | Colorectal adenocarcinoma |
| IHC | Immunohistochemistry |
| IFN | Interferon |
| ISUP | International Society of Urological Pathology |
| IWGAV | International Working Group for Antibody Validation |
| MX1 | Myxovirus resistance protein 1 |
| RCC | Renal cell carcinoma |
| SQCC | Squamous cell carcinomas |
| TMA | Tissue microarray |
| UICC | Union for International Cancer Control |
References
- Haller, O.; Staeheli, P.; Kochs, G. Interferon-induced Mx proteins in antiviral host defense. Biochimie 2007, 89, 812–818. [Google Scholar] [CrossRef] [Scilit] [PubMed]
- Haller, O.; Staeheli, P.; Kochs, G. Protective role of interferon-induced Mx GTPases against influenza viruses. Rev. Sci. Tech. 2009, 28, 219–231. [Google Scholar] [CrossRef] [Scilit] [PubMed]
- Haller, O.; Kochs, G. Mx genes: Host determinants controlling influenza virus infection and trans-species transmission. Hum. Genet. 2020, 139, 695–705. [Google Scholar] [CrossRef] [Scilit] [PubMed]
- Wenzel, J.; Bekisch, B.; Uerlich, M.; Haller, O.; Bieber, T.; Tuting, T. Type I interferon-associated recruitment of cytotoxic lymphocytes: A common mechanism in regressive melanocytic lesions. Am. J. Clin. Pathol. 2005, 124, 37–48. [Google Scholar] [CrossRef] [PubMed]
- Verver, D.; Poirier-Colame, V.; Tomasic, G.; Cherif-Rebai, K.; Grunhagen, D.J.; Verhoef, C.; Suciu, S.; Robert, C.; Zitvogel, L.; Eggermont, A.M.M. Upregulation of intratumoral HLA class I and peritumoral Mx1 in ulcerated melanomas. Oncoimmunology 2019, 8, e1660121. [Google Scholar] [CrossRef] [Scilit] [PubMed]
- Lee, S.J.; Hwang, C.S.; Kim, Y.K.; Lee, H.J.; Ahn, S.J.; Shin, N.; Lee, J.H.; Shin, D.H.; Choi, K.U.; Park, D.Y.; et al. Expression of Myxovirus Resistance A (MxA) Is Associated with Tumor-Infiltrating Lymphocytes in Human Epidermal Growth Factor Receptor 2 (HER2)-Positive Breast Cancers. Cancer Res. Treat. 2017, 49, 313–321. [Google Scholar] [CrossRef] [Scilit] [PubMed][Green Version]
- Aljohani, A.I.; Joseph, C.; Kurozumi, S.; Mohammed, O.J.; Miligy, I.M.; Green, A.R.; Rakha, E.A. Myxovirus resistance 1 (MX1) is an independent predictor of poor outcome in invasive breast cancer. Breast Cancer Res. Treat. 2020, 181, 541–551. [Google Scholar] [CrossRef] [Scilit] [PubMed]
- Gong, W.; Donnelly, C.R.; Heath, B.R.; Bellile, E.; Donnelly, L.A.; Taner, H.F.; Broses, L.; Brenner, J.C.; Chinn, S.B.; Ji, R.R.; et al. Cancer-specific type-I interferon receptor signaling promotes cancer stemness and effector CD8+ T-cell exhaustion. Oncoimmunology 2021, 10, 1997385. [Google Scholar] [CrossRef] [Scilit] [PubMed]
- Croner, R.S.; Sturzl, M.; Rau, T.T.; Metodieva, G.; Geppert, C.I.; Naschberger, E.; Lausen, B.; Metodiev, M.V. Quantitative proteome profiling of lymph node-positive vs. -negative colorectal carcinomas pinpoints MX1 as a marker for lymph node metastasis. Int. J. Cancer 2014, 135, 2878–2886. [Google Scholar] [CrossRef] [Scilit] [PubMed]
- Calmon, M.F.; Rodrigues, R.V.; Kaneto, C.M.; Moura, R.P.; Silva, S.D.; Mota, L.D.; Pinheiro, D.G.; Torres, C.; de Carvalho, A.F.; Cury, P.M.; et al. Epigenetic silencing of CRABP2 and MX1 in head and neck tumors. Neoplasia 2009, 11, 1329–1339. [Google Scholar] [CrossRef] [Scilit] [PubMed]
- Brown, S.G.; Knowell, A.E.; Hunt, A.; Patel, D.; Bhosle, S.; Chaudhary, J. Interferon inducible antiviral MxA is inversely associated with prostate cancer and regulates cell cycle, invasion and Docetaxel induced apoptosis. Prostate 2015, 75, 266–279. [Google Scholar] [CrossRef] [Scilit] [PubMed]
- Mushinski, J.F.; Nguyen, P.; Stevens, L.M.; Khanna, C.; Lee, S.; Chung, E.J.; Lee, M.J.; Kim, Y.S.; Linehan, W.M.; Horisberger, M.A.; et al. Inhibition of tumor cell motility by the interferon-inducible GTPase MxA. J. Biol. Chem. 2009, 284, 15206–15214. [Google Scholar] [CrossRef] [Scilit] [PubMed]
- Lucarini, V.; Buccione, C.; Ziccheddu, G.; Peschiaroli, F.; Sestili, P.; Puglisi, R.; Mattia, G.; Zanetti, C.; Parolini, I.; Bracci, L.; et al. Combining Type I Interferons and 5-Aza-2′-Deoxycitidine to Improve Anti-Tumor Response against Melanoma. J. Investig. Dermatol. 2017, 137, 159–169. [Google Scholar] [CrossRef] [Scilit] [PubMed]
- Soria, F.; Krabbe, L.M.; Todenhofer, T.; Dobruch, J.; Mitra, A.P.; Inman, B.A.; Gust, K.M.; Lotan, Y.; Shariat, S.F. Molecular markers in bladder cancer. World J. Urol. 2019, 37, 31–40. [Google Scholar] [CrossRef] [Scilit] [PubMed]
- Moller, K.; Knoll, M.; Bady, E.; Schmerder, M.J.; Rico, S.D.; Kluth, M.; Hube-Magg, C.; Blessin, N.C.; Mandelkow, T.; Lennartz, M.; et al. PD-L1 expression and CD8 positive lymphocytes in human neoplasms: A tissue microarray study on 11,838 tumor samples. Cancer Biomark. 2023, 36, 177–191. [Google Scholar] [CrossRef] [Scilit] [PubMed]
- Kononen, J.; Bubendorf, L.; Kallioniemi, A.; Barlund, M.; Schraml, P.; Leighton, S.; Torhorst, J.; Mihatsch, M.J.; Sauter, G.; Kallioniemi, O.P. Tissue microarrays for high-throughput molecular profiling of tumor specimens. Nat. Med. 1998, 4, 844–847. [Google Scholar] [CrossRef] [Scilit] [PubMed]
- Dancau, A.M.; Simon, R.; Mirlacher, M.; Sauter, G. Tissue Microarrays. Methods Mol. Biol. 2016, 1381, 53–65. [Google Scholar] [CrossRef] [Scilit] [PubMed]
- Kim, Y.A.; Lee, H.J.; Heo, S.H.; Park, H.S.; Park, S.Y.; Bang, W.; Song, I.H.; Park, I.A.; Gong, G. MxA expression is associated with tumor-infiltrating lymphocytes and is a prognostic factor in triple-negative breast cancer. Breast Cancer Res. Treat. 2016, 156, 597–606. [Google Scholar] [CrossRef] [Scilit] [PubMed]
- Cantell, K.; Pirhonen, J. IFN-gamma enhances production of IFN-alpha in human macrophages but not in monocytes. J. Interferon Cytokine Res. 1996, 16, 461–463. [Google Scholar] [CrossRef] [Scilit] [PubMed]
- Reizis, B. Plasmacytoid Dendritic Cells: Development, Regulation, and Function. Immunity 2019, 50, 37–50. [Google Scholar] [CrossRef] [Scilit] [PubMed]
- Haller, O.; Staeheli, P.; Schwemmle, M.; Kochs, G. Mx GTPases: Dynamin-like antiviral machines of innate immunity. Trends Microbiol. 2015, 23, 154–163. [Google Scholar] [CrossRef] [Scilit] [PubMed]
- Teng, M.W.; Ngiow, S.F.; Ribas, A.; Smyth, M.J. Classifying Cancers Based on T-cell Infiltration and PD-L1. Cancer Res. 2015, 75, 2139–2145. [Google Scholar] [CrossRef] [Scilit] [PubMed]
- Vlachogiannis, N.I.; Pappa, M.; Ntouros, P.A.; Nezos, A.; Mavragani, C.P.; Souliotis, V.L.; Sfikakis, P.P. Association Between DNA Damage Response, Fibrosis and Type I Interferon Signature in Systemic Sclerosis. Front. Immunol. 2020, 11, 582401. [Google Scholar] [CrossRef] [Scilit] [PubMed]
- Fragoulis, G.E.; Ntouros, P.A.; Nezos, A.; Vlachogiannis, N.I.; McInnes, I.B.; Tektonidou, M.G.; Skarlis, C.; Souliotis, V.L.; Mavragani, C.P.; Sfikakis, P.P. Type-I interferon pathway and DNA damage accumulation in peripheral blood of patients with psoriatic arthritis. Front. Immunol. 2023, 14, 1274060. [Google Scholar] [CrossRef] [Scilit] [PubMed]
- Krivega, M.; Zimmer, J.; Slezko, A.; Frank-Herrmann, P.; Rehnitz, J.; Hohenfellner, M.; Bettendorf, M.; Luzarowski, M.; Strowitzki, T. Genomic instability in individuals with sex determination defects and germ cell cancer. Cell Death Discov. 2023, 9, 173. [Google Scholar] [CrossRef] [Scilit] [PubMed]
- Sha, D.; Jin, Z.; Budczies, J.; Kluck, K.; Stenzinger, A.; Sinicrope, F.A. Tumor Mutational Burden as a Predictive Biomarker in Solid Tumors. Cancer Discov. 2020, 10, 1808–1825. [Google Scholar] [CrossRef] [Scilit] [PubMed]
- Uhlen, M.; Bandrowski, A.; Carr, S.; Edwards, A.; Ellenberg, J.; Lundberg, E.; Rimm, D.L.; Rodriguez, H.; Hiltke, T.; Snyder, M.; et al. A proposal for validation of antibodies. Nat. Methods 2016, 13, 823–827. [Google Scholar] [CrossRef] [Scilit] [PubMed]
- Thul, P.J.; Akesson, L.; Wiking, M.; Mahdessian, D.; Geladaki, A.; Ait Blal, H.; Alm, T.; Asplund, A.; Bjork, L.; Breckels, L.M.; et al. A subcellular map of the human proteome. Science 2017, 356, eaal3321. [Google Scholar] [CrossRef] [Scilit] [PubMed]
- Lizio, M.; Harshbarger, J.; Shimoji, H.; Severin, J.; Kasukawa, T.; Sahin, S.; Abugessaisa, I.; Fukuda, S.; Hori, F.; Ishikawa-Kato, S.; et al. Gateways to the FANTOM5 promoter level mammalian expression atlas. Genome Biol. 2015, 16, 22. [Google Scholar] [CrossRef] [Scilit] [PubMed]
- Lizio, M.; Abugessaisa, I.; Noguchi, S.; Kondo, A.; Hasegawa, A.; Hon, C.C.; de Hoon, M.; Severin, J.; Oki, S.; Hayashizaki, Y.; et al. Update of the FANTOM web resource: Expansion to provide additional transcriptome atlases. Nucleic Acids Res. 2019, 47, D752–D758. [Google Scholar] [CrossRef] [Scilit] [PubMed]
- Consortium, G.T. The Genotype-Tissue Expression (GTEx) project. Nat. Genet. 2013, 45, 580–585. [Google Scholar] [CrossRef] [Scilit] [PubMed]
- Sauter, G.; Kluth, M.; Tsourlakis, M.C.; Sauter, M.; Dieckert, S.; Simon, R. Using large-scale tissue microarray resources for the identification and evaluation of old, new, and novel targets for surgical pathology. Pol. J. Pathol. 2026, 77, 117–128. [Google Scholar] [CrossRef] [Scilit] [PubMed]
- Torhorst, J.; Bucher, C.; Kononen, J.; Haas, P.; Zuber, M.; Kochli, O.R.; Mross, F.; Dieterich, H.; Moch, H.; Mihatsch, M.; et al. Tissue microarrays for rapid linking of molecular changes to clinical endpoints. Am. J. Pathol. 2001, 159, 2249–2256. [Google Scholar] [CrossRef] [Scilit] [PubMed]

Disclaimer/Publisher’s Note: The statements, opinions and data contained in all publications are solely those of the individual author(s) and contributor(s) and not of MDPI and/or the editor(s). MDPI and/or the editor(s) disclaim responsibility for any injury to people or property resulting from any ideas, methods, instructions or products referred to in the content. |
© 2026 by the authors. Licensee MDPI, Basel, Switzerland. This article is an open access article distributed under the terms and conditions of the Creative Commons Attribution (CC BY) license.