


Abstract
Background/Objective: Systemic lupus erythematosus (SLE) is a complex autoimmune disease with clinical and serological heterogeneity. Current laboratory assays show variable performance for disease detection and risk stratification, resulting in diagnostic delays exceeding six years. There is an unmet need for improved diagnostic and monitoring tools. This study examines the clinical application of Fourier-transform infrared (FTIR) spectroscopy as a rapid, label-free technique for classifying SLE and other connective tissue diseases (CTDs). Methods: Serum samples from patients with SLE, Sjögren’s syndrome (SS), undifferentiated CTD (UCTD), and healthy controls (HCs) were analysed by FTIR spectroscopy followed by genetic algorithm–linear discriminant analysis (GA-LDA) modelling at two time points: baseline and six-month follow-up. Results: FTIR spectroscopy reliably differentiated CTDs from HCs with accuracies of 94.2% (inclusive of all time points), 99.3% at baseline, and 97.5% at follow-up. SLE patients were successfully separated from disease controls, achieving classification accuracies of 100% at baseline and 97.4% at follow-up. Subgroup analysis also demonstrated good classification accuracies for SLE (81.7%), SS (82.9%), and UCTD (86.1%), with discriminatory spectral features aligning with disease-related biochemical assignments. Notably, wavenumbers associated with proteins, carbohydrates, lipids, and DNA showed increased absorbance intensities in CTD patients, potentially reflecting immune dysregulation and metabolic changes. Conclusions: FTIR spectroscopy can reliably distinguish patients with SLE from both other CTDs and healthy individuals and may offer greater diagnostic utility than conventional serological testing. Identification of longitudinal variations in wavenumber biomarkers further supports the clinical potential of this technique and suggests possible future applications in therapeutic monitoring and risk stratification within rheumatological autoimmune disorders.
1. Introduction
Systemic lupus erythematosus (SLE) is a complex, heterogeneous autoimmune disease for which no diagnostic criteria exist. Whilst classification criteria have been developed for research purposes, they prioritise specificity, so using them in clinical practice can lead to missed or delayed diagnoses, particularly in early, mild, or atypical cases. As a result, patients may see multiple providers and spend months or years seeking an accurate diagnosis. Diagnostic delays and errors have vast consequences for patients with lupus, both mentally and physically.
Conventional laboratory approaches, many of which were established several decades ago, demonstrate variable performance for disease detection and risk stratification. These methods have not kept pace with advances in our understanding of complex immunological disease mechanisms, highlighting a clear need for the development and integration of novel diagnostic technologies.
Analytical approaches capable of capturing systemic biochemical alterations are increasingly being explored in complex diseases such as SLE. Among these, vibrational spectroscopic techniques provide a means of examining the molecular composition of biological samples in a non-targeted manner [1,2]. Rather than quantifying individual biomarkers, these methods detect collective biochemical changes that occur as a result of disease-driven physiological processes.
Fourier-transform infrared (FTIR) spectroscopy is one method of vibrational spectroscopy that measures how infrared radiation interacts with a sample to produce a spectrum reflective of its molecular structure [3]. Variations within this spectrum arise from differences in chemical bond vibrations across a wide range of biomolecules, including proteins, nucleic acids, lipids, and carbohydrates. Changes in these spectral patterns can therefore reflect underlying pathological processes, supporting the use of FTIR as a novel diagnostic approach.
Alongside FTIR, a range of alternative label-free analytical platforms have been explored for biomedical diagnostics, most notably Raman spectroscopy and electrochemical sensing approaches. Raman-based techniques, including surface-enhanced Raman spectroscopy (SERS), offer high molecular specificity and, when combined with nanostructured substrates, can achieve ultra-sensitive detection of biomolecules at extremely low concentrations. Recent reviews by Lin et al. and Zhang et al. 2024 [4,5] have demonstrated the capability of SERS to detect and differentiate analytes within biological specimens using engineered substrates and machine learning approaches. In parallel, electrochemical sensing platforms provide rapid, quantitative, and highly sensitive detection through analyte-specific signal transduction and have been widely applied in point-of-care diagnostics, including biomarker detection in complex biofluids [6]. Nevertheless, these approaches are typically dependent on predefined targets, which may limit their ability to capture broader biochemical changes associated with complex disease states. The widespread adoption of these platforms into routine diagnostic pathways has been further hindered by reproducibility issues and high costs.
In contrast, FTIR spectroscopy enables an untargeted approach, capturing biochemical information across multiple molecular groups within a single measurement [1,2,3]. This feature is a key strength in heterogeneous diseases such as systemic lupus erythematosus, where pathological processes involve widespread immune system dysfunction and multi-organ damage. Moreover, recent advances in chemometric analysis and machine learning have significantly accelerated the clinical potential of vibrational spectroscopy, facilitating the interpretation of complex spectral datasets into reliable diagnostic tools [7]. Fourier-transform infrared (FTIR) spectroscopy has demonstrated utility across a range of clinical applications, as reviewed by Callery and Rowbottom and Kannan et al. [8,9], supporting its diagnostic performance.
Current diagnostic testing for SLE has limitations. Routinely used approaches lack the ability to detect the full repertoire of SLE-associated autoantibodies, further hindered by the fact that these antibodies chemically and structurally change over time. Furthermore, there are well-described methodological variances between current platforms described in the literature, the clinical relevance of which remains unknown; thus, clinicians are faced with a diagnostic dilemma when managing their patients. Delayed or inaccurate diagnosis has significant consequences, leading to postponed treatment and poorer clinical outcomes.
The overarching aim of this work is to advance the clinical translation of vibrational biospectroscopy towards routine use within diagnostic immunology laboratories and, ultimately, near-patient testing in clinical settings. The development of a superior blood test that can reliably differentiate SLE from the healthy population and other connective tissue diseases (CTDs) could provide substantial clinical benefit in both primary and secondary care settings. Herein, we have applied FTIR spectroscopy to build upon our previous work demonstrating the diagnostic potential of vibrational spectroscopy in SLE. We previously applied the complementary method of Raman spectroscopy to classify SLE patients from controls with 99% accuracy, 100% sensitivity and 99% specificity [10]. While Raman-based approaches evaluated in our earlier work showed promising diagnostic performance, their broader clinical translation remains limited by higher instrumentation costs, susceptibility to fluorescence interference and challenges in achieving inter-laboratory consistency. In contrast, FTIR enables low-cost, standardised biochemical profiling, making it more suitable for translation into routine diagnostic settings (Baker et al., 2016 [1]).
In this study, we evaluate the diagnostic role of FTIR spectroscopy using a larger cohort of SLE patient samples and disease controls. We assess spectral differences across two time points to examine potential disease changes over time and include patients with Sjögren’s syndrome (SS) and Undifferentiated Connective Tissue Disease (UCTD) as disease controls. Further, we identified significant disease-specific spectral features which may be developed into future diagnostic biomarkers. As an underutilised platform in immunological disorders, FTIR spectroscopy has far-reaching potential as a diagnostic method, overcoming current diagnostic challenges and improving patient care.
2. Materials and Methods
2.1. Sample Population
Between 4 May 2022 and 9 November 2022, adult patients were recruited into the Disease Outcomes and Biomarkers across SARDs cohort from Manchester University NHS Foundation Trust, a tertiary SARDs referral centre. Patients were recruited consecutively from new and follow-up connective tissue disease clinics, as previously described [11]. Patients with an established SARD diagnosis of UCTD, SLE and SS were eligible for inclusion if they had ≥1 clinical feature of an SARD and were positive for the anti-Ro (SSA) antibody, measured using the BioPlex 2200 ANA Screen [12]. A clinical diagnosis by a consultant rheumatologist was used to identify eligible patients, and patients were required to meet the classification criteria for their respective disease [13,14,15]. Ethical approval was obtained [REC ID: 21-WM-0235]; all patients signed written informed consent, and the study was conducted in accordance with the Declaration of Helsinki. Healthy controls (HCs) were included from the Lupus Extended Autoimmune Phenotype (LEAP) study [16]. Ethical approval was obtained [REC ID: 13/NW/0564]; all patients signed written informed consent, and the study was conducted in accordance with the Declaration of Helsinki.
2.2. Data Collection
Comprehensive clinical data were obtained at the time of participant recruitment and at the 6-month follow-up. Autoantibodies were measured using the BioPlex 2200 ANA Screen with Medical Decision Support Software (MDSS) (comprising the following autoantigens: dsDNA, Chromatin/nucleosome, Ro/SS-A, La/SS-B, Smith (Sm), SmRNP, RNP, Scl-70, Jo-1 and Centromere) [12]. Demographics for each participant were recorded in laboratory information management systems and extracted prior to statistical analysis.
2.3. Statistical Analysis
Patient and serological data were exported from laboratory information management systems to Microsoft Excel for analysis. Data comparisons were made using MATLAB R2014b for sex, age, ethnicity, disease activity score (DAS), treatments (anti-malarials and biologic immunosuppressants), and the following antibodies: dsDNA, anti-Ro52, anti-Ro60, anti-La, anti-Sm, anti-RNP, anti-Chromatin, anti-Centromere, anti-Scl70, and anti-Jo-1. Statistical analysis was carried out using a Kruskal–Wallis test, where p-values below 0.05 were considered statistically significant.
2.4. Acquisition of Spectra by FTIR
Spectral analysis was performed based on published protocols [17]. All samples were stored at −80 °C until processing and underwent a single freeze–thaw cycle prior to FTIR analysis. Frozen serum samples were defrosted and homogenised by vortexing. Spots of 5 µL of serum were placed on a calcium fluoride slide and spread to a diameter of approximately 1 cm. Two slides were prepared per serum sample. The slides were left to air dry for 2 h at 19 °C. All sample preparation and drying procedures were conducted in a temperature-controlled, air-conditioned laboratory environment to minimise the potential influence of environmental variability on spectral acquisition. Samples were tested blindly, in four batches during the period 16 July 2024 and 27 September 2024. Spectra were acquired on the Nicolet Summit Pro FTIR analyser (ThermoFisher, Waltham, MA, USA) at a resolution of 4 cm−1 and a wavenumber range of 800–4000 cm−1, with 32 scans per acquisition. A blank background reading was measured by analysing an area of the slide with no sample present, and this was subtracted from the measurement of the sample. Each sample was acquired with 6 technical replicates (3 replicates each on 2 slides). To ensure repeatability and minimise experimental variability, each sample was analysed using multiple technical replicates, and spectra were pre-processed using optimised methods established in prior work [18], including smoothing, derivative transformation, and normalisation. These steps, together with control of environmental and experimental factors, have been shown to improve spectral consistency and reproducibility in FTIR analysis of biofluids.
2.5. Data Analysis
The FTIR spectra at the biofingerprint region (900–1800 cm−1) were analysed within the MATLAB R2014b (MathWorks, Inc., Natick, MA, USA) environment using lab-made routines, the Irootlab toolbox [19], and the Classification Toolbox for MATLAB [20]. The six replica spectra per sample were averaged so the classification analyses were performed on a sample basis. To ensure spectral quality, raw spectra were first visually inspected for artefacts, and signal-to-noise ratios (S/N) were evaluated across representative samples prior to pre-processing. A predefined absorbance threshold was not applied. Instead, spectral quality was assessed through visual inspection for artefacts, signal-to-noise ratio evaluation and objective outlier detection using Hotelling’s T2 versus Q residual analysis. The acquired spectra exhibited high absorbance intensity typical of dried serum films, with clear amide I and II features. The S/N values calculated based on the amide I peak (1650 cm−1) in relation to the noise (800 cm−1) resulted in 10.94 ± 2.75 absorbance units, indicating a 10-fold signal intensity compared to the noise. Thereafter, two outlier spectra were identified and removed from the dataset based on the Hotelling’s T2 vs. Q residuals test [7] (Supplementary Information, Figure S1). These outliers show anomalous spectra with great suppression of amide I and II peaks, which may be caused by errors during sample preparation or when handling the samples during spectral acquisition. The data were then pre-processed by Savitzky–Golay smoothing (window of 15 points, 2nd order polynomial fitting) to reduce random noise, 2nd derivative to correct the baseline and enhance small spectral differences, and vector normalisation to reduce possible experimental variations such as sample thickness [7]. Six discriminatory comparisons between the samples were performed in the dataset: (1) HC (n = 10) vs. all CTDs (inclusive of all time points) (n = 56); (2) HC (n = 10) vs. all CTD baselines (n = 28) vs. all CTD follow-ups (n = 28); (3) primary subgroup analysis for SLE/SLE overlap syndrome (n = 14) vs. other CTDs (n = 14) for baseline samples; (4) primary subgroup analysis for SLE/SLE overlap syndrome (n = 16) vs. other CTDs (n = 12) for follow-up samples; (5) secondary subgroup analysis for SLE/SLE overlap (n = 14) vs. SS (n = 8) vs. UCTD (n = 6) for baseline samples; and (6) secondary subgroup analysis for SLE (n = 16) vs. SS (n = 7) vs. UCTD (n = 5) for follow-up samples.
The pre-processed spectral data underwent chemometric analysis by genetic algorithm with linear discriminant analysis (GA-LDA) [21], which was shown to be the best discriminatory algorithm among other algorithms tested in comparison (1) (Supplementary Information, Table S1). Due to the small number of samples, the GA-LDA models were built using all the available samples and validated by Monte Carlo cross-validation using 1000 iterations with 20% of samples left out for validation [10]. The genetic algorithm (GA) is a feature selection algorithm inspired by Mendelian genetics [22], where a set of initial variables (e.g., wavenumbers) undergo processes such as selection, cross-over and mutation until the best set of variables according to a fitness function is found [7]. The GA fitness function is calculated by minimising the cost function :
where represents the number of validation samples and is calculated by:
where is the squared Mahalanobis distance between the sample and the centre of its true class , and is the squared Mahalanobis distance between the sample and the centre of the closest wrong class [21]. In this study, GA was performed using 100 generations with 200 chromosomes each. Mutation and cross-over probabilities were set at 10% and 60%, respectively [23].
The linear discriminant analysis (LDA) is then applied to the selected variables by GA, for which the classification scores are calculated as follows:
where is the LDA classification score, is a vector containing the input variables for sample , is the mean vector of class and is the pooled covariance matrix between the investigated classes [21].
Model performance was assessed using Monte Carlo cross-validation, an exhaustive iterative algorithm where a random portion of the data (20%, in this case) is set apart in a temporary validation set and predicted using the remaining training data (80%) [24]. Model validation is ensured by calculating the mean accuracy (AC), sensitivity (SENS) and specificity (SPEC) during this process [7]. These quality metrics are calculated as follows:
where TP stands for true positives, TN for true negatives, FP for false positives and FN for false negatives.
Wavenumbers responsible for class separation were identified on the 2nd derivative spectrum to enhance small spectral differences. The discriminatory wavenumbers identified by GA-LDA are model-specific and correspond to variables contributing most strongly to class separation. Therefore, different disease-group comparisons may generate distinct spectral biomarkers despite similarities in overall spectral appearance, reflecting the unique biochemical differences captured within each model. Furthermore, receiver operating characteristic (ROC) curves and their area under the curve (AUC) values were calculated for both training and Monte Carlo cross-validation. The AUC is a metric to evaluate the model’s ability to discriminate the samples, where AUC ≤ 0.5 suggest no discrimination, between 0.7 and 0.8 suggests acceptable discrimination, between 0.8 and 0.9 suggests excellent discrimination, and above 0.9 suggests outstanding discrimination [10].
3. Results
The clinical characteristics of the patients (n = 30) recruited were collected by physicians using medical records where required, summarised in Table 1. The diagnosis of CTD and clinical classification of patients into subgroups were made according to 1997 ACR criteria for SLE and the 2016 ACR/EULAR criteria for SS at the discretion of a trained rheumatologist. Patients diagnosed as UCTD did not meet classification criteria at recruitment for a definitive CTD, but had clinical and laboratory findings typical for CTD. Of the 30 patients recruited, two SLE patients in the baseline cohort were identified as outliers (as described in Section 2.5). In the follow-up cohort, samples were not provided for two patients (1 SS and 1 UCTD).
Table 1.
Demographics of patient cohort.
Patient demographic data were compared as outlined in the Methods section to identify variables that might influence subgroup discrimination. Statistical analysis identified significant differences between disease groups for immunosuppressant use and anti-Sm antibody positivity (p < 0.05; Supplementary Information, Table S2). However, the present study was not sufficiently powered to determine the independent contribution of these variables to spectral discrimination. Additional demographic differences were observed between patient groups (Table 1). Specifically, individuals of Black ethnicity were overrepresented within the UCTD cohort, anti-La antibodies were more prevalent in patients with SS, and anti-Sm antibodies were more frequently observed in patients with UCTD. No other statistical differences were observed based on the demographic data, although some borderline associations may be present when evaluating anti-RNP and anti-Chromatin manifestations (more frequent in SLE/SLE overlaps) and anti-malarial medication, which is more frequent in SLE/SLE overlap follow-ups.
3.1. HCs (n = 10) vs. All CTD Patients (n = 56); Baseline (n = 28) vs. Follow Ups (n = 28)
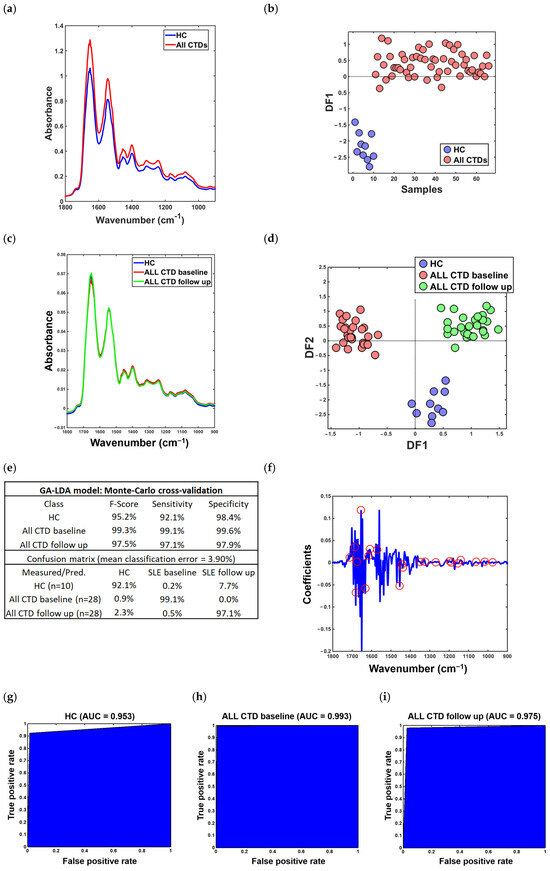
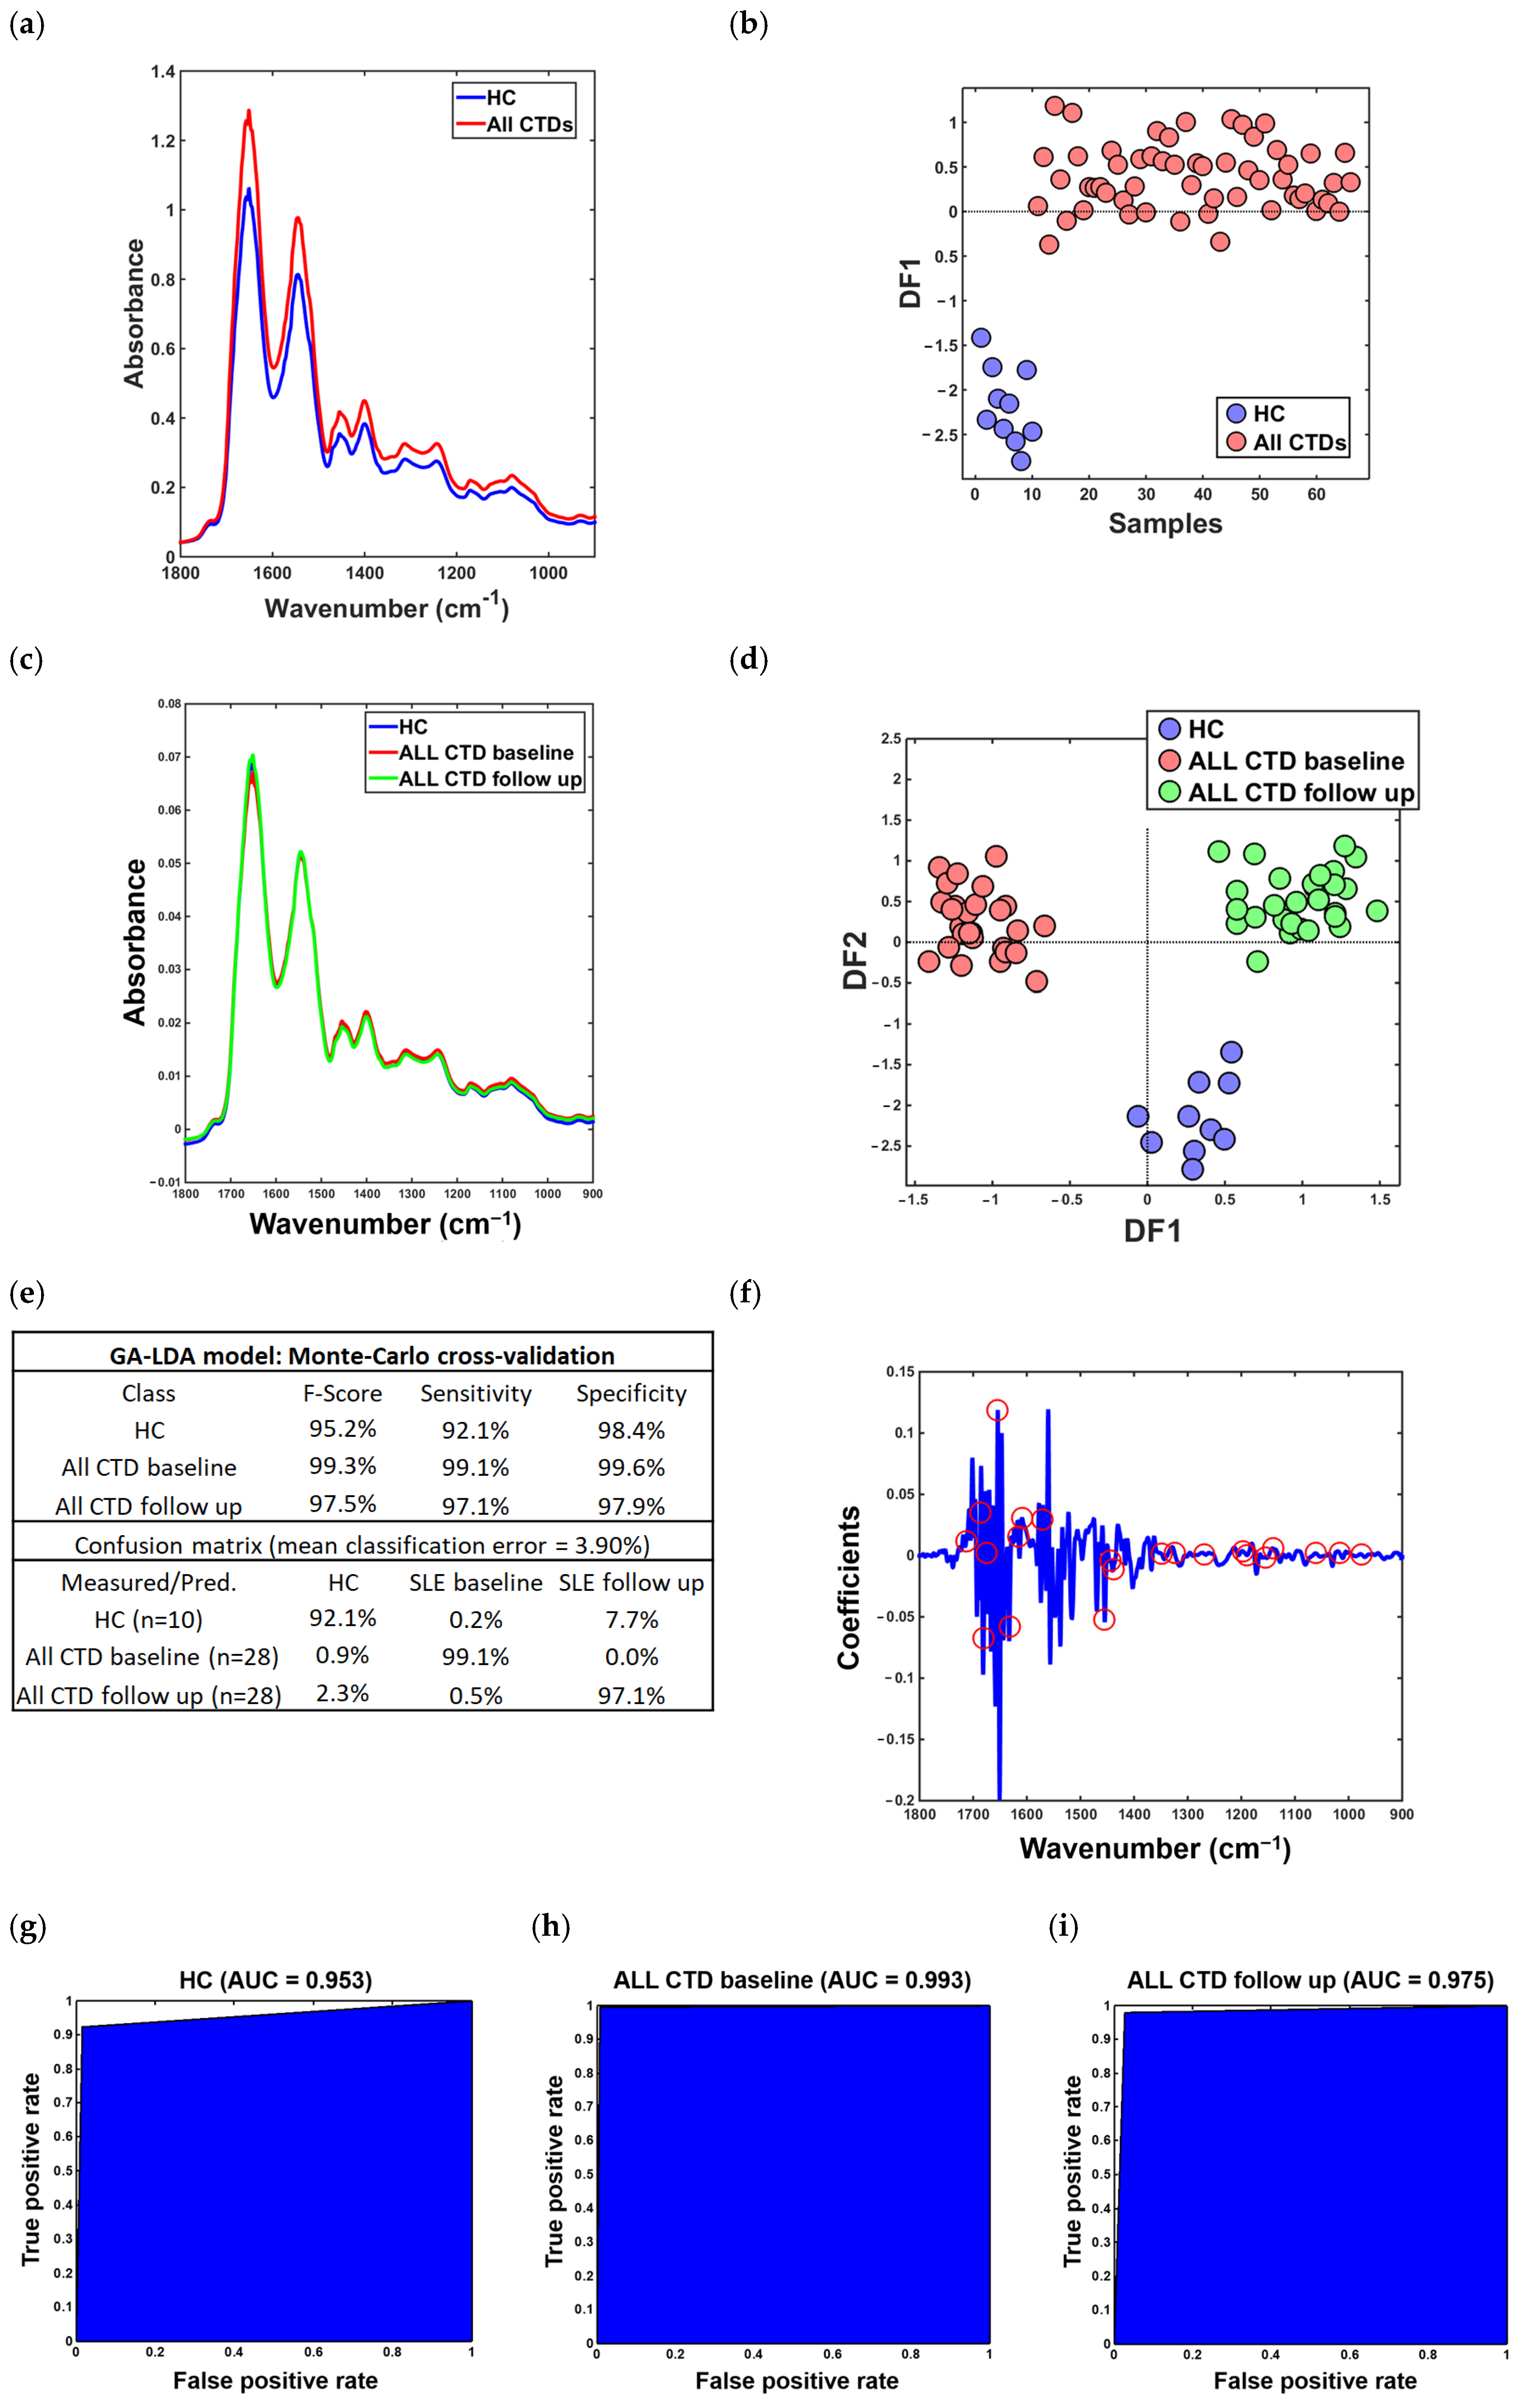
We performed an analysis of HC vs. all CTD patients, inclusive of all time points. The six replica spectra per sample were pre-processed and averaged (Figure 1a) so that all classification analyses were performed on a sample basis. The spectra were analysed in the biofingerprint region (900–1800 cm−1), which is a key region of the IR spectrum that contains several vibrations of functional groups in important biomolecules such as proteins, lipids, carbohydrates and amino acids [7,25]. Chemometric analysis of pre-processed spectra by GA-LDA and Monte Carlo cross-validation showed excellent discrimination between HC and all CTD patients (Figure 1b). For HC classification, diagnostic performance was assessed and showed an accuracy of 94.2%, sensitivity of 90.2% and specificity of 98.4%. For CTD classification, the model demonstrated an accuracy of 94.2%, sensitivity of 98.4% and specificity of 90.2%. In the analysis of HC vs. all CTD (baseline) vs. all CTD (follow-up) patient groups, replica spectra were pre-processed and averaged (Figure 1c) prior to chemometric analysis. GA-LDA and Monte Carlo cross-validation showed excellent discrimination between HC, all CTD patients at baseline analysis, and all CTD patients at follow-up (Figure 1d). Quality metrics were calculated for the GA-LDA model, as shown in the confusion matrix for the Monte Carlo validation data (Figure 1e). For HC classification, accuracy, sensitivity, and specificity of the validation set were 95.2%, 92.1% and 98.4%, respectively; for all CTD baseline patients, 99.3%, 99.1% and 99.6%, respectively; and for all CTD follow-up patients, 97.5%, 97.1% and 97.9%, respectively. The 22 wavenumbers responsible for class separation were identified on the second derivative spectrum to enhance small spectral differences (Figure 1f). Receiver operating characteristic (ROC) curve analysis with AUC values was calculated for HC, all CTD baseline and all CTD follow-up at 0.953, 0.993 and 0.975, respectively (Figure 1g–i).
Figure 1.
FTIR spectral analysis of healthy controls (HC) vs. all connective tissue disease (CTD) patients (inclusive of all time points), and HC vs. all CTD at baseline vs. all CTD patients at follow-up. (a) Averaged fingerprint spectra of HC vs. all CTD patients (inclusive of all time points). (b) Genetic algorithm with linear discriminant analysis (GA-LDA) model showing excellent separation between groups; DF is the discriminant function showing the scores on canonical variable 1. (c) Averaged fingerprint spectra of HC vs. all CTD at baseline vs. all CTD patients at follow-up. (d) GA-LDA model showing excellent separation between groups, DF are the discriminant functions showing the scores on the canonical variables 1 and 2. (e) GA-LDA confusion matrix: accuracy (F-score), sensitivity and specificity calculated for the Monte Carlo cross-validation data were 95.2%, 92.1% and 98.4%, respectively, for HC; 99.3%, 99.1% and 99.6%, respectively, for SLE baseline; and 97.5%, 97.1% and 97.9%, respectively, for SLE follow up. (f) Key wavenumbers (red circles) identified on 2nd derivative spectrum by GA-LDA. (g–i) Receiver operating characteristic (ROC) curve analysis using Monte Carlo cross-validation showed areas under the curve (AUC) of 0.953 for HC, 0.993 for CTD baseline, and 0.975 for CTD follow-up patients.
Band assignments referenced in Table 2, Table 3 and Table 4 are tentative and based on the established literature [26]. Due to the complex composition of serum, individual wavenumbers reflect overlapping contributions from multiple biomolecular classes rather than specific molecular species. The absorbance for all selected wavenumbers by the GA-LDA model was higher for the CTD follow-up group and lower for the HC group (Supplementary Information, Table S3). Using the GA-LDA model, we found 11 protein-associated wavenumbers (1268, 1323, 1348, 1570, 1608, 1615, 1631, 1653, 1674, 1679, and 1685 cm−1), corresponding primarily to the amide I and amide II regions. These bands reflect C=O stretching and N-H bending/C-N stretching in the protein backbone and are indicative of overall protein content and structure. We identified five carbohydrate-associated biomarkers (975, 1016, 1061, 1140, and 1154 cm−1), representing C-O, C-C, and C-O-C vibrations typical of carbohydrates. Lipid-associated wavenumbers (1438, 1442, 1454, and 1712 cm−1) were associated with CH2 bending and ester C=O stretching, indicative of fatty acids and esterified lipids. Additionally, wavenumbers at 1189 and 1196 cm−1 were associated with phosphate-containing biomolecules (nucleic acids and phospholipids), primarily reflecting asymmetric PO2− stretching vibrations.
Table 2.
Key wavenumbers responsible for classification of HC, all CTD (baseline) and all CTD (follow-up) patient groups, with corresponding biomolecular associations and FTIR assignments [26].
Table 3.
Key wavenumbers responsible for classification of SLE vs. other CTD patient groups at baseline and follow-up, with corresponding biomolecular associations and FTIR assignments [26].
Table 4.
Key wavenumbers responsible for classification of SLE vs. SS vs. UCTD patient groups at baseline and follow-up, with corresponding biomolecular associations and FTIR assignments [26].
3.2. Primary Patient Subgroup Analysis. Baseline: SLE and SLE Overlap Syndrome (SLEs) (n = 14) vs. Other CTDs (n = 14); Follow-Up: SLE and SLE Overlap Syndrome (SLEs) (n = 16) vs. Other CTDs (n = 12)
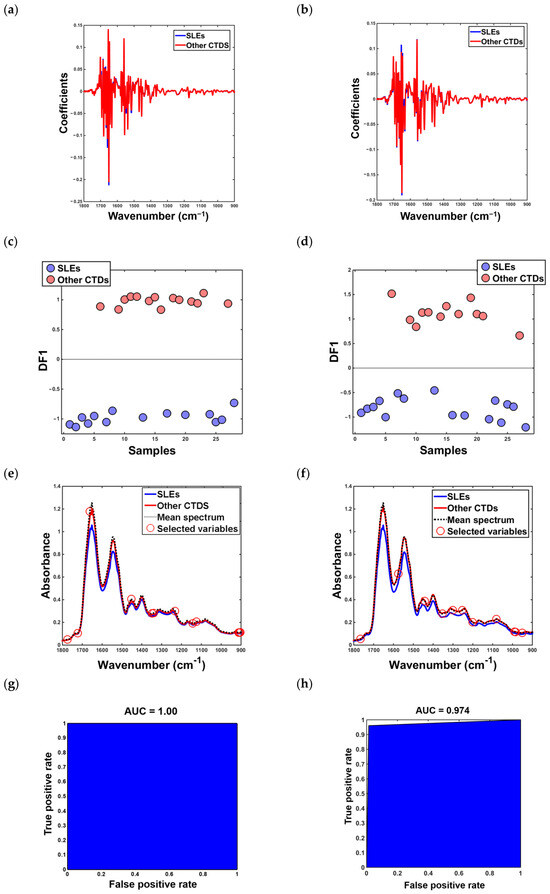
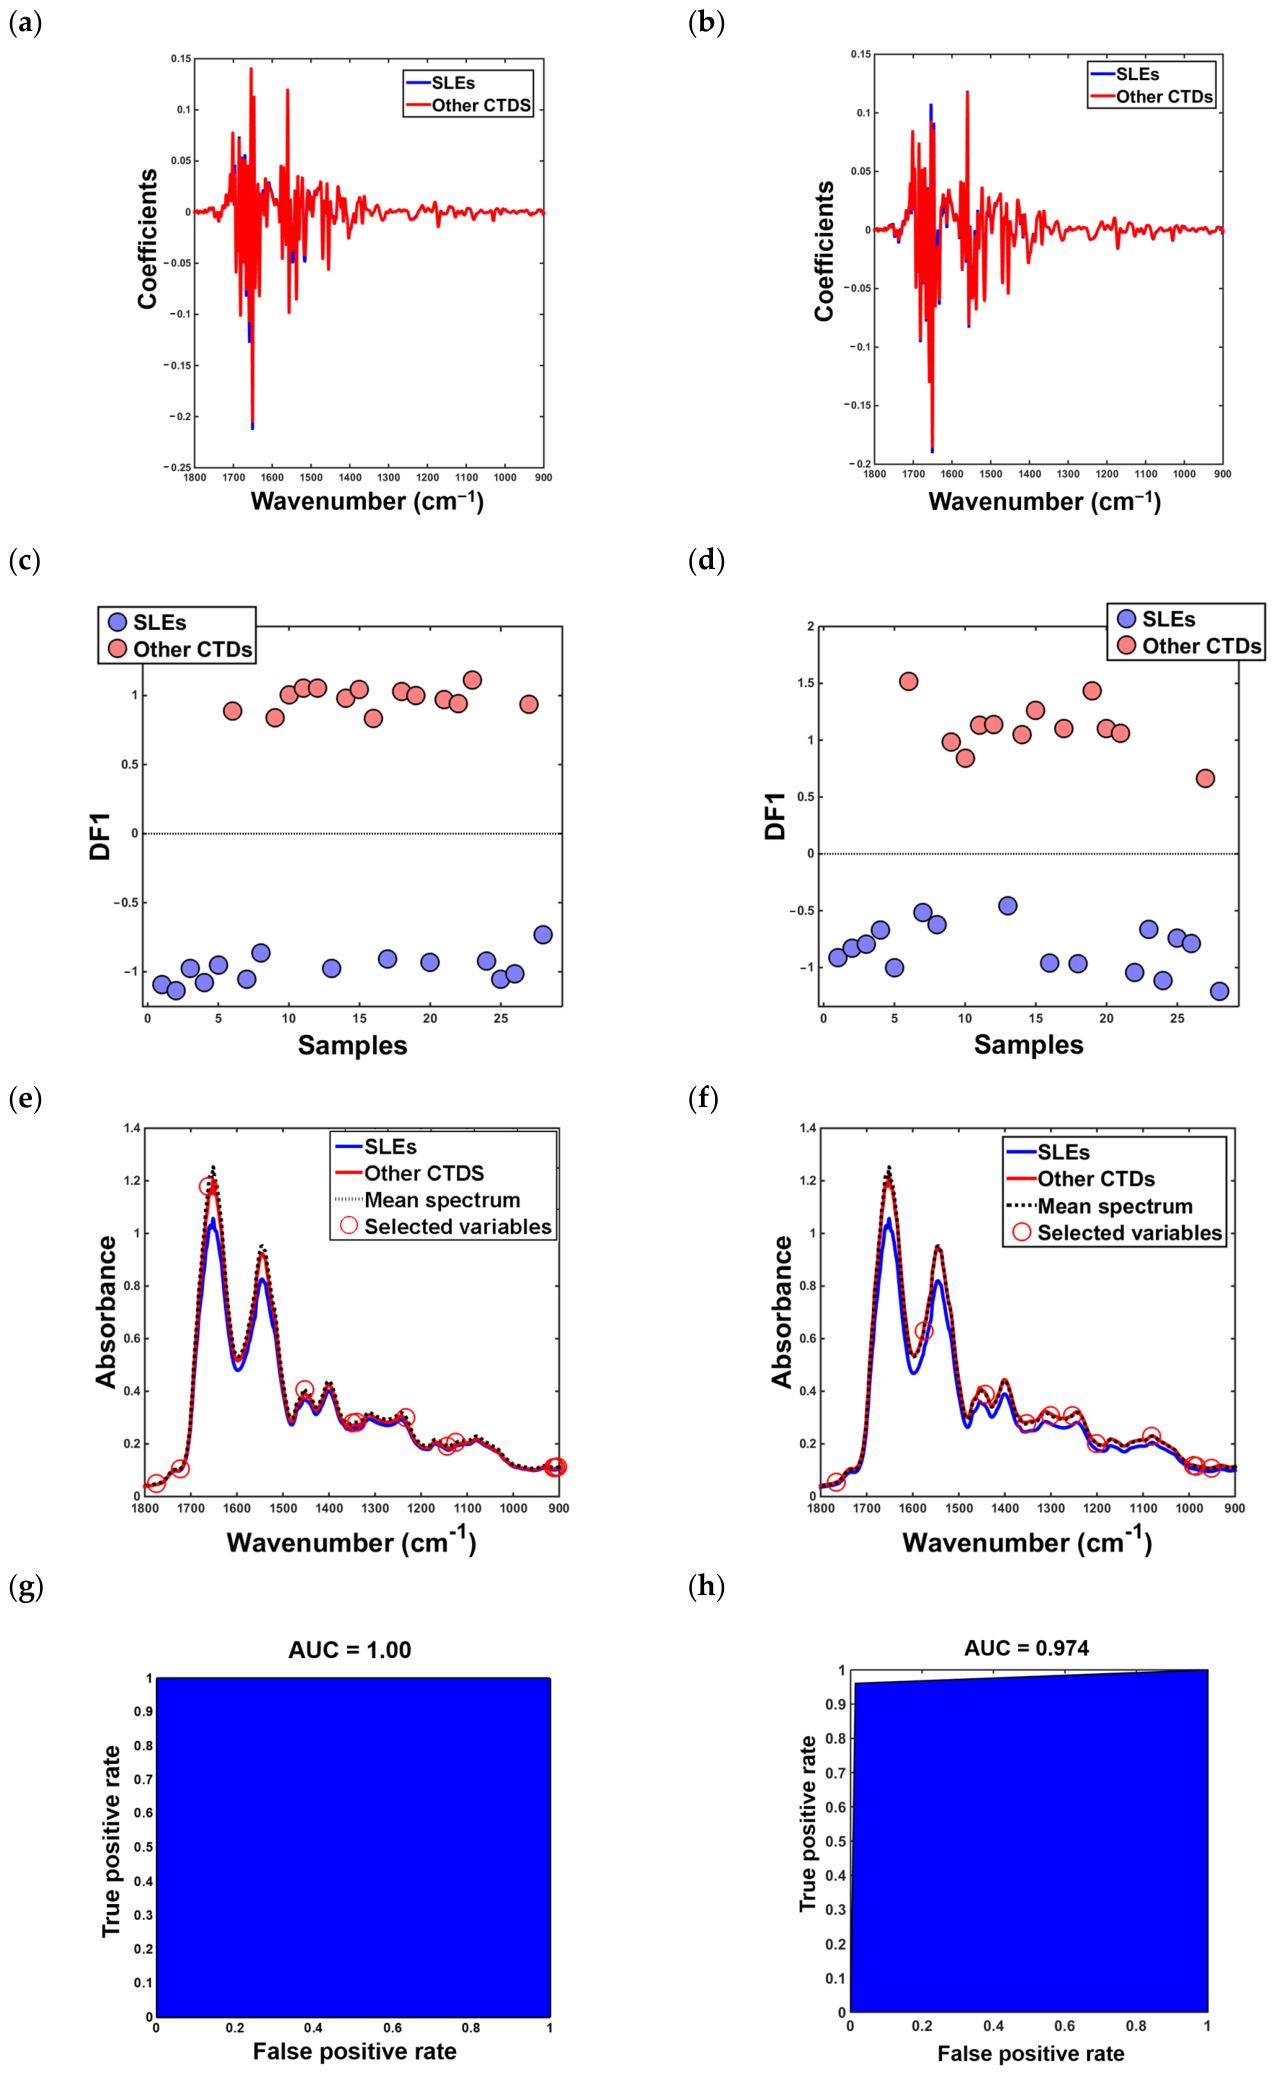
In the primary subgroup analysis of CTD patients, classification was performed on a sample basis for patients with SLE and SLE overlap syndrome (SLEs) vs. other CTDS (SS, UCTD). Averaged spectra (second derivative + vector normalisation) per class were compared for baseline and follow-up time points (Figure 2a and Figure 2b, respectively). GA-LDA classification modelling with Monte Carlo cross-validation showed excellent discrimination between SLE and other CTDs at baseline and follow-up analysis (Figure 2c and Figure 2d, respectively). Quality metrics were calculated for the training and validation sets. At baseline for SLE patients, Monte Carlo validation classification accuracy, sensitivity and specificity were 100%, 100% and 100%, respectively, and for other CTD baseline patients, 100%, 100% and 100%, respectively. At the follow-up time point for SLE patients, validation classification accuracy, sensitivity and specificity were 97.4%, 96.1% and 98.7%, respectively, and for other CTD baseline patients, 97.9%, 98.7% and 97.1%, respectively.
Figure 2.
FTIR spectral analysis of systemic lupus erythematosus (SLE) and SLE overlap (SLEs) vs. other CTD patients (primary Sjögren’s syndrome (SS) and undifferentiated CTD (UCTD)) at baseline and at follow-up time points. (a) Averaged 2nd derivative, vector-normalised fingerprint spectra at baseline. (b) Averaged 2nd derivative, vector-normalised fingerprint spectra at follow-up. (c) GA-LDA model (Monte Carlo cross-validated) showing excellent separation between groups at baseline. For SLEs, accuracy, sensitivity and specificity were 100%, 100% and 100%, respectively, and for other CTD baseline patients, 100%, 100% and 100%, respectively. (d) GA-LDA model (Monte Carlo cross-validated) showing excellent separation between groups at follow-up. For SLEs, accuracy, sensitivity and specificity were 97.4%, 96.1% and 98.7%, respectively, and for other CTD baseline patients, 97.9%, 98.7% and 97.1%, respectively. (e) Key wavenumbers responsible for GA-LDA model class separation at baseline shown on the original spectra. (f) Key wavenumbers responsible for GA-LDA model class separation at follow-up shown on the original spectra. (g) ROC analysis for Monte Carlo cross-validation at baseline showed an AUC of 1.00. (h) ROC analysis for Monte Carlo cross-validation at follow-up showed an AUC of 0.974.
The 12 wavenumbers responsible for class separation at each time point were identified on the second derivative spectrum to enhance small spectral differences and plotted on the original spectrum for baseline and follow-up time points (Figure 2e and Figure 2f, respectively). ROC curve analysis with AUC values was calculated for baseline and follow-up at 1.00 and 0.974, respectively. Tentative molecular assignments for biomarkers responsible for separation of SLE and other CTDS patients are referenced in Table 3 for baseline and follow-up analysis [26]. At both time points, the absorbance for all selected wavenumbers by the GA-LDA model was higher for the other CTDs group compared to SLE patients (Supplementary Information, Tables S4 and S5).
At baseline, twelve discriminatory wavenumbers were identified, spanning nucleic acids, carbohydrates, proteins, and lipids. Three DNA-associated peaks (903, 907, and 912 cm−1) correspond to phosphodiester backbone vibrations. Carbohydrate-associated bands (1125, 1144, and 1339 cm−1) reflect C-O, C-O-C, and ring vibrations characteristic of carbohydrate structures. Protein contributions were represented by the amide I band at 1662 cm−1, associated with protein backbone vibrations, predominantly from serum proteins such as albumin, together with an overlapping band at 1233 cm−1 indicating contributions from both amide III vibrations and phosphate-containing biomolecules. Lipid-associated features (1349, 1453, 1723, and 1775 cm−1) correspond to CH2/CH3 deformation and ester carbonyl (C=O) stretching vibrations.
In the follow-up data, a further twelve discriminatory wavenumbers were identified, again encompassing all major biomolecular classes. Three DNA-associated wavenumbers (951, 1081, and 1202 cm−1) correspond to phosphate-related vibrations, including symmetric and asymmetric PO2− stretching. Carbohydrate-associated bands (984, 985, and 990 cm−1) represent C-O and C-C vibrations typical of carbohydrate structures. Protein-associated contributions were more prominent at follow-up, with four wavenumbers (1253, 1300, 1353, and 1576 cm−1) corresponding to amide III vibrations, protein side-chain modes, and the amide II band. Lipid-associated features (1442 and 1766 cm−1) correspond to CH2 bending and ester carbonyl stretching vibrations.
3.3. Secondary Subgroup Analysis. Baseline: SLE (n = 14) vs. SS (n = 8) vs. UCTD (n = 6) for Baseline Samples; Follow-Up: SLE (n = 16) vs. SS (n = 7) vs. UCTD (n = 5)
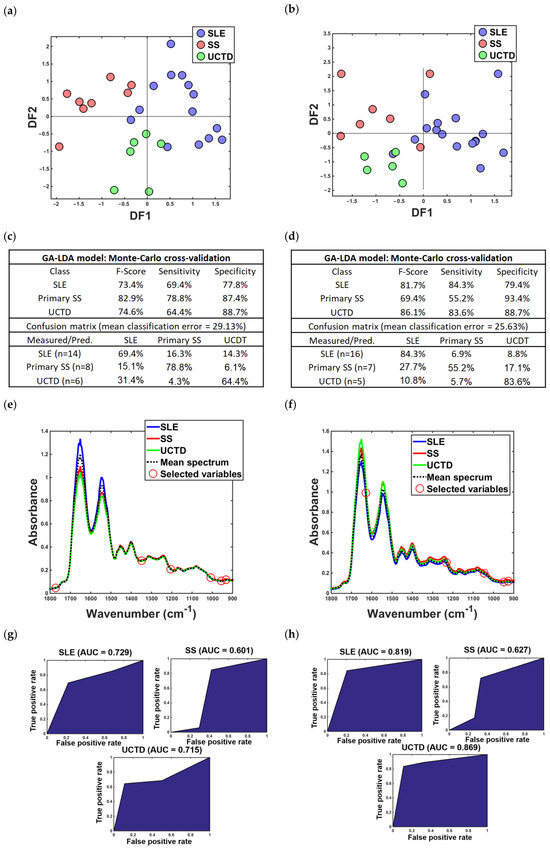
In the secondary subgroup analysis of patients with SLE and SLE overlap syndrome (SLEs) vs. SS vs. UCTD, classification was performed on a sample basis. GA-LDA classification modelling with Monte Carlo cross-validation showed discrimination between SLE, SS and UCTD patients at baseline and follow-up time points (Figure 3a and Figure 3b, respectively). Performance was assessed for the Monte Carlo cross-validated GA-LDA model; at baseline, it demonstrated accuracy, sensitivity and specificity at 73.4%, 69.4% and 77.8%, respectively, for SLE; 82.9%, 78.8% and 87.4%, respectively, for SS; and 74.6%, 64.4% and 88.7%, respectively, for UCTD (Figure 3c). At follow-up, we demonstrated accuracy, sensitivity and specificity at 81.7%, 84.3% and 79.4%, respectively, for SLE; 69.4%, 55.2% and 93.4, respectively, for SS; and 86.1%, 83.6% and 88.7%, respectively, for UCTD (Figure 3d).
Figure 3.
GA-LDA classification analysis showing clustering for SLE, SS and UCTD patients at (a) baseline and (b) follow-up time points. (c) Accuracy, sensitivity and specificity calculated for the Monte Carlo cross-validation data at baseline: 73.4%, 69.4% and 77.8%, respectively, for SLE; 82.9%, 78.8% and 87.4%, respectively, for SS; and 74.6%, 64.4% and 88.7%, respectively, for UCTD. (d) Accuracy, sensitivity and specificity calculated for the Monte Carlo cross-validation data at follow-up: 81.7%, 84.3% and 79.4%, respectively, for SLE; 69.4%, 55.2% and 93.4%, respectively, for SS; and 86.1%, 83.6% and 88.7%, respectively, for UCTD. (e) Average fingerprint spectra per class at baseline. (f) Average fingerprint spectra per class at follow-up. (g) ROC for Monte Carlo cross-validation GA-LDA model at baseline showed AUCs of 0.729 for SLE, 0.601 for SS, and 0.715 for UCTD. (h) ROC for Monte Carlo cross-validation GA-LDA model at follow-up showed AUCs of 0.818 for SLE, 0.627 for SS, and 0.869 for UCTD.
The wavenumbers responsible for class separation were identified on the second derivative spectrum; six wavenumbers were identified for baseline analysis and five for follow-up (Figure 3e and Figure 3f, respectively). ROC curve analysis with AUC values was calculated for the Monte Carlo cross-validated GA-LDA model; for baseline data, AUC values for SLE were 0.729, for SS 0.601, and for UCTD 0.715 (Figure 3g). At follow-up, AUC values for SLE were 0.818, for SS 0.627, and for UCTD 0.869 (Figure 3h).
Tentative molecular assignments for biomarkers responsible for separation of SLE, SS and UCTD at baseline and follow-up time points are referenced in Table 4 [26]. At baseline, six discriminatory wavenumbers were identified across nucleic acids, carbohydrates, proteins, and lipids. Nucleic acid-associated bands at 933 and 956 cm−1 correspond to phosphate-related vibrations, while overlapping contributions from carbohydrates and phosphate-containing biomolecules were observed at 1205 cm−1 and from proteins and nucleic acids at 1008 cm−1. A mixed lipid/protein signal at 1348 cm−1 reflects CH2 wagging, and a lipid-associated band at 1774 cm−1 corresponds to ester carbonyl (C=O) stretching. At follow-up, five wavenumbers were identified spanning nucleic acid, carbohydrate, and protein classes. Nucleic acid-associated vibrations (927, 948, and 1231 cm−1) reflect phosphodiester and phosphate stretching modes, while carbohydrate contributions at 1045 cm−1 correspond to C-O stretching. Protein features were represented by the amide I band at 1629 cm−1, with no lipid-associated bands detected at follow-up.
At baseline, the absorbance for all six wavenumbers selected by the GA-LDA model was higher for the SS group compared to SLE patients and UCTD (Supplementary Information, Table S6). At follow-up, the absorbance for all selected wavenumbers was higher for the Primary SS group, with the exception of 1629 cm−1, which was higher for UCTD (Supplementary Information, Table S7).
4. Discussion
Using a blood-based spectroscopic approach, this study demonstrates the capability of FTIR to distinguish SLE patients from both healthy individuals and other CTDs. Furthermore, FTIR spectroscopy detected spectral differences within CTD patients between baseline and 6-month follow-up, enabling subgroup classification at both time points. The high performance of the GA-LDA classification model strengthens our prior findings using Raman spectroscopy for SLE classification [10]. Although Raman spectroscopy achieved excellent classification performance in our previous study, FTIR is better placed for routine clinical use given its lower cost, faster analysis, and greater availability in diagnostic laboratories. Together, our data support the potential of vibrational spectroscopy as a clinically relevant platform for disease screening, classification and monitoring.
Autoantibodies remain central to the diagnosis and classification of SLE, associated with the underlying clinical and immunological heterogeneity of the disease [27]. Anti-dsDNA antibodies, found in 70–98% of patients, are highly specific (up to 97.4%) and thus remain a key biomarker despite concerns about assay variability and variable association with disease pathogenesis [28,29].
However, not all patients with SLE present with anti-dsDNA antibodies. Data from the Lupus Extended Autoimmune Phenotype (LEAP) cohort suggest that less than 50% of patients are dsDNA-positive [16], highlighting the limitations of using this biomarker alone. In clinical practice, two main laboratory methods are used to detect anti-dsDNA antibodies: enzyme-linked immunosorbent assay (ELISA) and the Crithidia luciliae immunofluorescence test. However, differences in results between these methods highlight issues with reliability and, consequently, clinical usefulness. These uncertainties can contribute to significant delays in diagnosis, sometimes extending beyond six years [30]. This highlights a clear unmet need for new approaches that better capture the biochemical heterogeneity of SLE, particularly for patients who do not present with typical serological markers such as anti-dsDNA antibodies.
FTIR spectroscopy is a form of vibrational spectroscopy capable of detecting metabolic changes associated with a variety of immunological disorders, including several cancers, reviewed in detail by Callery and Rowbottom (2021); Kannan et al. (2023) [8,9]. Herein, FTIR spectroscopy combined with chemometric analysis was applied to distinguish SLE patients from both healthy individuals and disease controls. The spectral features driving this separation likely reflect metabolic changes caused by the autoimmune pathogenesis of CTDs. Importantly, these spectral differences appear to be specific to SLE and distinguish it from other CTDs.
The GA-LDA results described outstanding classification performance between the total CTD cohort (SLE, Sjögren’s syndrome (SS), Undifferentiated CTD (UCTD)) and HCs, with clear segregation of CTD patients at baseline and at the 6-month time point. Between the three subgroups, we reported an average classification accuracy of 97%, sensitivity of 96% and specificity of 99%. To interpret FTIR spectral differences in biomedical studies and assign molecular associations which may contribute to disease-specific changes, researchers can use published literature databases and libraries [26]. Importantly, the discriminatory wavenumbers identified by the GA-LDA models differed between disease-group comparisons. This is expected, as the genetic algorithm selects spectral variables that contribute most strongly to class separation within each comparison, reflecting the specific biochemical differences present between the groups rather than identifying a universal set of biomarkers across all CTDs. Furthermore, the overall spectral profiles of biological fluids such as serum are expected to be broadly similar because all individuals share a common biochemical matrix composed predominantly of proteins, lipids, nucleic acids, carbohydrates and other circulating metabolites. Consequently, many spectral features are conserved across samples, and disease-related alterations may be subtle and not readily apparent by visual inspection alone. The GA-LDA approach is specifically designed to identify those spectral regions that contribute most strongly to discrimination, enabling detection of biologically relevant differences despite substantial overlap in the overall spectral appearance. We identified clear spectral differences between CTD patients and HC, with several key discriminatory wavenumbers associated with protein molecules at 1268, 1323, 1348, 1570, 1608, 1615, 1631, 1653, 1674, 1679, and 1685 cm−1. These FTIR peaks primarily correspond to the amide I and amide II bands, which reflect C=O stretching and N-H bending/C-N stretching in the protein backbone, key indicators of protein content and secondary structure, including α-helices and β-sheets. Of interest, all wavenumbers demonstrated higher absorbance intensities in the CTD group compared to the HC; we postulate this likely reflects the chronic immune dysregulation associated with these rheumatological disorders, including poorly controlled autoimmune responses, complement activation, interferon dysregulation, and associated inflammation [31]. These features are common across diseases like SLE, mixed connective tissue disease (MCTD), and Sjögren’s syndrome (SS), where patients frequently exhibit hypergammaglobulinemia, increased pro-inflammatory cytokine expression, and evidence of systemic involvement [27,29,32,33,34].
We identified five carbohydrate-associated wavenumbers (975, 1016, 1061, 1140, and 1154 cm−1), corresponding to C-O, C-C, and C-O-C vibrations. Carbohydrate-related serological markers are increasingly recognised in autoimmune diseases for their roles in cell signalling, immune recognition and acute-phase responses. Glycosylated proteins and glycosylation patterns are emerging as valuable biomarkers and therapeutic targets in inflammatory disease [35,36]. In SLE, glycosylation of IgG is a known contributor to disease pathogenesis, with recent studies demonstrating subgroup-specific glycosylation patterns [37]. While glycomic profiling shows promise, its high cost and complexity limit clinical uptake. In contrast, FTIR spectroscopy offers a rapid, cost-efficient method to assess such post-translational modifications (PTMs), as supported by our current findings and prior Raman-based work identifying protein phosphorylation signatures in SLE [10].
We also identified four lipid-associated wavenumbers (1438, 1442, 1454, and 1712 cm−1), reflecting CH2 bending and C=O ester stretching in fatty acids and esterified lipids. Dysregulated lipid metabolism is increasingly implicated in SLE pathogenesis and monitoring. Altered levels of HDL, LDL, triglycerides, and VLDL have been linked to disease activity and cardiovascular risk [38,39]. Additional lipid-related biomarkers such as oxLDL, anti-oxLDL antibodies, and sphingolipids correlate with vascular inflammation, immune signalling, and organ involvement [38,40,41,42]. Currently, the clinical application of lipidomics remains restricted by cost and standardisation issues. FTIR spectroscopy provides a potential alternative for capturing these lipid-related changes.
In this study, we identified two nucleic acid-associated wavenumbers (1189 and 1196 cm−1), each with increased absorbance intensity in CTD patients compared to HCs. These findings support our earlier work using Raman spectroscopy, which also showed elevated DNA signals in SLE patients [10]. The clinical utility of measuring nucleic acid-associated biomarkers such as cell-free circulating DNA (cf-DNA) and mitochondrial DNA has previously been investigated, becoming increasingly recognised as mediators of inflammation in autoimmune diseases, including SLE and SS, where they activate innate immune pathways like TLR9 and promote type I interferon responses [43,44,45]. Elevated levels of cfDNA have been shown to correlate with disease activity and tissue inflammation in SLE [46] and SS [47]. To detect these biomarkers, highly sensitive analytical techniques such as quantitative PCR and fluorometric assays are required; however, the cost and complexity of these tests limit their routine use. FTIR spectroscopy is a label-free, low-cost technique that requires minimal sample preparation, making it a practical approach for detecting nucleic acid-associated changes in SLE and related CTDs.
Of further interest, the absorbance intensity of all key spectral wavenumbers was higher in the 6-month follow-up CTD subgroup compared to the baseline. This likely suggests continued inflammatory changes and increased pro-inflammatory processes involving proteins, carbohydrates, lipids, and DNA molecules over time in these patient groups. Of clinical relevance and future impact, in our patient cohort, six patients (two SLE/SLE overlap, three SS, one UCTD) were classified as having a high DAS in the baseline group, which increased to eleven patients (seven SLE/SLE overlap, three SS, one UCTD) in the 6-month follow-up. Whilst the present study was not designed to directly evaluate associations between FTIR-derived spectral biomarkers and clinical disease activity measures, the observed longitudinal changes in wavenumber biomarkers, together with the increase in high disease activity cases at follow-up, suggest that FTIR spectroscopy may be sensitive to disease-related biochemical changes over time. Future longitudinal studies incorporating established disease activity measures, including SLEDAI-2K scores, complement concentrations and autoantibody titres, will be important to determine the potential role of FTIR spectroscopy in disease monitoring and therapeutic response assessment.
Our SLE-focussed primary analysis distinguishing SLE/SLE-overlap from other CTDs (SS and UCTD) generated excellent results using GA-LDA, with 100% accuracy, sensitivity, and specificity at baseline, and 97.4% accuracy, 96.1% sensitivity, and 98.7% specificity at follow-up. At baseline, 12 discriminatory wavenumbers were identified, including carbohydrates (1125, 1144, 1339 cm−1), lipids (1349, 1453, 1723, 1775 cm−1), and nucleic acids (903, 907, 912 cm−1), with only one protein-associated marker (1662 cm−1) and an overlapping nucleic acid/protein-associated wavenumber at 1233 cm−1. All biomolecular peak intensities were higher in the ‘other CTDs’ group, suggesting overlapping protein features among CTDs but more distinct carbohydrate, lipid, and DNA signatures in SLE. At follow-up, discriminatory wavenumbers spanned all biomolecule classes, including proteins (1253, 1300, 1353 cm−1), carbohydrates (984–990 cm−1), lipids (1442, 1766 cm−1), and nucleic acids (951, 1081, 1202, 1576 cm−1). The follow-up group had five additional SLE patients with high DAS compared to the baseline group, in which two patients had high DAS (which continued into the follow-up group). These findings may also suggest an association with changes in disease activity, further supporting the use of FTIR spectroscopy for disease monitoring.
We also performed a secondary analysis to assess whether FTIR spectroscopy could differentiate between distinct CTDs (SLE/SLE overlap, SS, and UCTD). At baseline, GA-LDA showed good subgroup clustering and classification metrics for SLE (73.4% accuracy), SS (82.9%), and UCTD (74.6%). Follow-up analysis demonstrated improved performance for SLE (81.7%) and UCTD (86.1%), though SS showed lower sensitivity (55.2%) despite high specificity (93.4%). The lower AUC values observed likely reflect the challenge of differentiating closely related CTDs, where considerable overlap in clinical manifestations and autoantibody profiles may result in similar underlying biochemical patterns.
We acknowledge that the findings of this study are limited by a small subgroup sample size. However, our findings demonstrate the potential of FTIR spectroscopy to detect biochemical changes beyond the reach of conventional serological assays for CTDs. Further, inclusion of a mixed-ethnicity population demonstrates that our results are applicable across a diverse ethnic population.
Treatment exposure represents an important consideration in spectroscopic analyses of biofluids. In the present cohort, immunosuppressive medication use differed significantly between disease groups, with greater use observed in patients with SLE/SLE overlap syndrome than in SS or UCTD. Whilst classification performance remained high across both baseline and follow-up analyses, the study was not sufficiently powered to perform robust medication-stratified modelling, and therefore the potential influence of treatment on the observed spectral profiles was not assessed independently. Nevertheless, the consistency of the classification results across multiple disease-group comparisons and time points suggests that disease-associated biochemical differences contribute substantially to the observed spectral discrimination. Future studies involving larger cohorts and longitudinal treatment monitoring will be important to further investigate the relationship between therapeutic interventions and FTIR spectral signatures, including their potential value for treatment response assessment.
Current autoantibody-based diagnostics, while critical for SLE classification, have well-documented weaknesses. Moreover, current techniques do not have the capacity to reveal underlying functional or pathophysiological mechanisms. The ANA test, performed via indirect immunofluorescence on HEp-2 cells, offers high sensitivity (95–98%) but low specificity (~57–60%) due to positivity in other autoimmune diseases and healthy individuals [48]. Anti-dsDNA antibodies are highly specific for SLE (95–98%) but show only moderate sensitivity (50–70%) and may fluctuate independently of clinical activity [49,50]. Anti-Sm antibodies are highly specific (~99%) but have low sensitivity (20–30%) and limited value in monitoring disease activity [51]. Similarly, anti-Ro/SSA, anti-RNP, and antiphospholipid antibodies contribute diagnostically or prognostically, but their relative stability limits use in short-term disease monitoring [52,53].
As current approaches to CTD diagnosis and classification do not fully capture the heterogeneity observed within and between diseases, additional tools are needed to better define disease subtypes, support treatment decisions and reduce diagnostic delay. FTIR spectroscopy is a promising, clinically viable option. This technique requires minimal patient sample (~five microlitres) to generate a biochemical profile which may reflect differences in disease phenotype, activity and treatment response. FTIR spectroscopy may also be useful for investigating factors that contribute to disease variability, including sex, ethnicity and underlying pathogenic mechanisms. Combining FTIR-derived spectral data with genomic, transcriptomic and proteomic datasets may provide further insight into the biological processes underlying CTDs and support biomarker identification. While further validation is required, FTIR spectroscopy has the potential to complement existing immunological testing for the diagnosis and monitoring of autoimmune disease.
5. Conclusions
SLE remains a challenging disease to diagnose because of its heterogeneous clinical presentation and variable serological findings, which can contribute to substantial diagnostic delays. FTIR spectroscopy offers a rapid, cost-effective and label-free approach for assessing biochemical changes in biofluids, with the ability to detect alterations associated with immune dysregulation and inflammation. In this study, FTIR spectroscopy combined with chemometric analysis successfully distinguished patients with SLE from both healthy controls and individuals with other autoimmune CTDs using serum samples. To our knowledge, this is the first study to demonstrate discrimination of SLE from multiple CTD groups using FTIR spectroscopy. In addition, FTIR spectroscopy detected temporal changes in serum biochemical profiles of patients with CTDs. These findings suggest that FTIR spectroscopy identifies detailed biochemical changes associated with disease status that would not be possible by conventional autoantibody testing alone. While further validation in larger and more diverse cohorts is required, FTIR spectroscopy may complement existing immunological testing for the diagnosis and monitoring of autoimmune disease.
Supplementary Materials
The following supporting information can be downloaded at https://www.mdpi.com/article/10.3390/biomedicines14102191/s1. Figure S1: Two outliers’ spectra identified in the dataset. Table S1: Monte Carlo cross-validation accuracy (20% of samples out, 1000 iterations) for different classification algorithms applied to classify between healthy controls (HC), SLE baselines and SLE follow-ups. PCA-LDA: Principal component analysis with linear discriminant analysis; PLS-DA: partial least squares discriminant analysis; iPLS-DA: interval partial least squares discriminant analysis; SPA-LDA: successive projections algorithm with linear discriminant analysis; GA-LDA: genetic algorithm with linear discriminant analysis. Table S2: Statistical analysis was carried out using a Kruskal–Wallis test, where p-values below 0.05 were considered statistically significant. Data comparisons were for sex, age, ethnicity, disease activity score (DAS), treatments (anti-malarials and biologic immunosuppressants), and the following antibodies: anti-double stranded DNA (dsDNA), anti-Ro52, anti-Ro60, anti-La, anti-Sm, anti-RNP, anti-Chromatin, anti-Centromere, anti-Scl70, and anti-Jo-1. Table S3: Comparison of wavenumber average absorbance intensities for key discriminatory wavenumbers between HC, all CTD baseline and all CTD follow-up patients. The absorbances for all selected wavenumbers by the GA-LDA model are higher for the SLE follow-up group and lower for the HC group. Table S4: Comparison of wavenumber average absorbance intensities for key discriminatory wavenumbers between SLE/SLE overlap patients and other CTDs at baseline. The absorbance for all selected wavenumbers by the GA-LDA model is higher for the other CTDs group. Table S5: Comparison of wavenumber average absorbance intensities for key discriminatory wavenumbers between SLE/SLE overlap patients and other CTDs at follow-up. The absorbance for all selected wavenumbers by the GA-LDA model is higher for the other CTDs group. Table S6: Comparison of wavenumber average absorbance intensities for key discriminatory wavenumbers between SLE/SLE overlap, SS and UCTD patients at baseline. The absorbance for all selected wavenumbers by the GA-LDA model is higher for the primary SS group. Table S7: Comparison of wavenumber average absorbance intensities for key discriminatory wavenumbers between SLE/SLE overlap, SS and UCTD patients at follow-up. The absorbance for all selected wavenumbers by the GA-LDA model is higher for the primary SS group, with the exception of 1629 cm−1.
Author Contributions
Conceptualisation, E.L.C., and A.W.R.; methodology, E.L.C., C.L.M.M., S.D., A.-V.M., J.V.T.,I.U.R., I.N.B. and A.W.R.; software, C.L.M.M.; validation, E.L.C., S.D., A.W.R. and C.L.M.M.; formal analysis, E.L.C., C.L.M.M. and A.W.R.; investigation, E.L.C., J.V.T., S.D., A.-V.M. and I.N.B.; resources, E.L.C., S.D., A.-V.M., I.N.B., A.W.R., I.U.R. and C.L.M.M.; data curation, A.-V.M., E.L.C., C.L.M.M. and J.V.T.; writing—original draft preparation, E.L.C., C.L.M.M., S.D., J.V.T. and A.W.R.; writing—review and editing, E.L.C., C.L.M.M., S.D., J.V.T., A.-V.M., I.U.R., I.N.B. and A.W.R.; visualisation, E.L.C., C.L.M.M. and J.V.T.; supervision, S.D., I.U.R., I.N.B. and A.W.R.; project administration, E.L.C., J.V.T., A.-V.M. and A.W.R.; funding acquisition, E.L.C., A.-V.M., S.D., I.N.B. and A.W.R. Author Anthony W. Rowbottom passed away prior to the publication of this manuscript. All other authors have read and agreed to the published version of this manuscript.
Funding
EC was partially funded by the National Institute for Health and Care Research (NIHR) Regional Research Delivery Networks North West, and the NIHR Applied Research Collaboration North West Coast (ARC NWC). The views expressed in this publication are those of the author(s) and not necessarily those of the NIHR or the Department of Health and Social Care. This study is funded by the National Institute for Health and Care Research (NIHR) Manchester Biomedical Research Centre (BRC) (NIHR203308). The views expressed are those of the author(s) and not necessarily those of the NIHR or the Department of Health and Social Care.
Institutional Review Board Statement
This study was conducted in accordance with the Declaration of Helsinki and approved by the Health Research Authority (HRA) and Health and Care Research Wales (HCRW), United Kingdom. REC ID: 21-WM-0235 (29 September 2021) for the Disease Outcomes and Biomarkers across SARDs cohort and REC ID: 13/NW/0564 (16 September 2013) for the LEAP study.
Informed Consent Statement
Informed consent was obtained from all subjects involved in the study.
Data Availability Statement
Raw data along with appropriate class identifiers will be uploaded to the publicly accessible data repository Figshare (https://doi.org/10.6084/m9.figshare.6025748).
Acknowledgments
We would like to acknowledge the School of Medicine and Dentistry, University of Central Lancashire, for the loan of equipment to the Department of Immunology, Royal Preston Hospital, for the completion of this work.
- In Memory of Professor Anthony Rowbottom MBE (1960–2026)This manuscript is dedicated to the memory of Professor Anthony Rowbottom MBE, whose vision, wisdom, and friendship touched the lives and careers of many. A passionate advocate for translational research, Anthony believed in bringing scientific innovation into clinical practice to improve patient care. Anthony combined scientific rigour with a genuine commitment to others, supporting and inspiring colleagues throughout their careers. His contribution to pathology was recognised with the award of an MBE in 2021 for services to Pathology during the COVID-19 pandemic, an honour he accepted with characteristic humility. Through the colleagues he mentored, the collaborations he fostered, and the advances he helped achieve in patient care, Anthony’s influence extends far beyond this work. We gratefully dedicate this publication to his memory and to the lasting legacy he leaves within laboratory medicine.
Conflicts of Interest
Sarah Dyball has received grant support from Novartis. Anastasia-Vasiliki Madenidou has received grant support from UCB and Janssen and honoraria from Boehringer Ingelheim. The remaining authors declare that the research was conducted in the absence of any commercial or financial relationships that could be construed as a potential conflict of interest.
Abbreviations
The following abbreviations are used in this manuscript:
| ANA | Antinuclear Antibodies |
| ARC NWC | Applied Research Collaboration North West Coast |
| AUC | Area Under Curve |
| BRC | Biomedical Research Centre |
| cfDNA | Cell-free DNA |
| CTD | Connective Tissue Disease |
| DAS | Disease Activity Score |
| DNA | Deoxyribonucleic Acid |
| dsDNA | Double-stranded DNA |
| FTIR | Fourier-Transform Infrared |
| GA | Genetic Algorithm |
| GA-LDA | Genetic Algorithm–Linear Discriminant Analysis |
| HC | Healthy Control |
| HCRW | Health and Care Research Wales |
| HDL | High-density Lipoprotein |
| HEp-2 | Human Epithelial Cell Line |
| HRA | Health Research Authority |
| iPLS-DA | Interval Partial Least Squares Discriminant Analysis |
| LDA | Linear Discriminant Analysis |
| LDL | Low-density Lipoprotein |
| LEAP | Lupus Extended Autoimmune Phenotype |
| MCTD | Mixed Connective Tissue Disease |
| MDSS | Medical Decision Support Software |
| NIHR | National Institute for Health and Care Research |
| PCA-LDA | Principal Component Analysis with Linear Discriminant Analysis |
| PLS-DA | Partial Least Squares Discriminant Analysis |
| PTM | Post-Translational Modification |
| qPCR | Quantitative PCR |
| ROC | Receiver Operating Characteristics |
| SARD | Systemic Autoimmune Rheumatic Diseases |
| SLE | Systemic lupus erythematosus |
| SPA-LDA | Successive Projections Algorithm with Linear Discriminant Analysis |
| SS | Sjögren’s Syndrome |
| UCTD | Undifferentiated Connective Tissue Disease |
| VLDL | Very Low-density Lipoprotein |
References
- Baker, M.J.; Hussain, S.R.; Lovergne, L.; Untereiner, V.; Hughes, C.; Lukaszewski, R.A.; Thiéfin, G.; Sockalingum, G.D. Developing and understanding biofluid vibrational spectroscopy: A critical review. Chem. Soc. Rev. 2016, 45, 1803–1818. [Google Scholar] [CrossRef] [Scilit]
- Bunaciu, A.A.; Aboul-Enein, H.Y.; Fleschin, Ş. Vibrational Spectroscopy in Clinical Analysis. Appl. Spectrosc. Rev. 2015, 50, 176–191. [Google Scholar] [CrossRef] [Scilit]
- Naumann, D. Vibrational Spectroscopy in Microbiology and Medical Diagnostics. In Biomedical Vibrational Spectroscopy; Lasch, P., Kneipp, J., Eds.; John Wiley & Sons: Hoboken, NJ, USA, 2008; pp. 1–8. [Google Scholar] [CrossRef] [Scilit]
- Lin, L.L.; Alvarez-Puebla, R.; Liz-Marzán, L.M.; Trau, M.; Wang, J.; Fabris, L.; Wang, X.; Liu, G.; Xu, S.; Han, X.X.; et al. Surface-Enhanced Raman Spectroscopy for Biomedical Applications: Recent Advances and Future Challenges. ACS Appl. Mater. Interfaces 2025, 17, 16287–16379. [Google Scholar] [CrossRef] [Scilit]
- Zhang, T.; Li, Y.; Lv, X.; Jiang, S.; Jiang, S.; Sun, Z.; Zhang, M.; Li, Y. Ultra-Sensitive and Unlabeled SERS Nanosheets for Specific Identification of Glucose in Body Fluids. Adv. Funct. Mater. 2024, 34, 2315668. [Google Scholar] [CrossRef] [Scilit]
- Wu, J.; Liu, H.; Chen, W.; Ma, B.; Ju, H. Device integration of electrochemical biosensors. Nat. Rev. Bioeng. 2023, 1, 346–360. [Google Scholar] [CrossRef] [Scilit]
- Morais, C.L.M.; Lima, K.M.G.; Singh, M.; Martin, F.L. Tutorial: Multivariate classification for vibrational spectroscopy in biological samples. Nat. Protoc. 2020, 15, 2143–2162. [Google Scholar] [CrossRef] [Scilit]
- Callery, E.L.; Rowbottom, A.W. Vibrational spectroscopy and multivariate analysis techniques in the clinical immunology laboratory: A review of current applications and requirements for diagnostic use. Appl. Spectrosc. Rev. 2021, 57, 411–440. [Google Scholar] [CrossRef] [Scilit]
- Kannan, S.; Callery, E.L.; Rowbottom, A.W. Vibrational Biospectroscopy in the Clinical Setting: Exploring the Impact of New Advances in the Field of Immunology. J. Spectrosc. 2023, 2023, 5557441. [Google Scholar] [CrossRef] [Scilit]
- Callery, E.L.; Morais, C.L.M.; Nugent, L.; Rowbottom, A.W. Classification of Systemic Lupus Erythematosus Using Raman Spectroscopy of Blood and Automated Computational Detection Methods: A Novel Tool for Future Diagnostic Testing. Diagnostics 2022, 12, 3158. [Google Scholar] [CrossRef] [Scilit]
- Dyball, S.; Shukla, R.; Madenidou, A.V.; Buch, M.H.; Bruce, I.N.; Parker, B. High throughput multiplex immunoassays stratify patients according to symptom burden across the anti-Ro positive systemic autoimmune rheumatic disease spectrum. Autoimmunity 2024, 57, 2433237. [Google Scholar] [CrossRef] [Scilit]
- Desplat-Jego, S.; Bardin, N.; Larida, B.; Sanmarco, M. Evaluation of the BioPlex 2200 ANA screen for the detection of antinuclear antibodies and comparison with conventional methods. Ann. N. Y. Acad. Sci. 2007, 1109, 245–255. [Google Scholar] [CrossRef] [Scilit]
- Hochberg, M.C. Updating the American College of Rheumatology revised criteria for the classification of systemic lupus erythematosus. Arthritis Rheum. 1997, 40, 1725. [Google Scholar] [CrossRef] [Scilit]
- Mosca, M.; Neri, R.; Bombardieri, S. Undifferentiated connective tissue diseases (UCTD): A review of the literature and a proposal for preliminary classification criteria. Clin. Exp. Rheumatol. 1999, 17, 615–620. [Google Scholar]
- Shiboski, C.H.; Shiboski, S.C.; Seror, R.; Criswell, L.A.; Labetoulle, M.; Lietman, T.M.; Rasmussen, A.; Scofield, H.; Vitali, C.; Bowman, S.J.; et al. 2016 American College of Rheumatology/European League Against Rheumatism Classification Criteria for Primary Sjögren’s Syndrome: A Consensus and Data-Driven Methodology Involving Three International Patient Cohorts. Arthritis Rheumatol. 2017, 69, 35–45. [Google Scholar] [CrossRef] [Scilit]
- Dyball, S.; Madenidou, A.-V.; Rodziewicz, M.; Reynolds, J.A.; Herrick, A.L.; Haque, S.; Chinoy, H.; Bruce, E.; Bruce, I.N.; Parker, B. Clinical trial eligibility of a real-world connective tissue disease cohort: Results from the LEAP cohort. Semin. Arthritis Rheum. 2024, 67, 152463. [Google Scholar] [CrossRef] [Scilit]
- Morais, C.L.M.; Paraskevaidi, M.; Cui, L.; Fullwood, N.J.; Isabelle, M.; Lima, K.M.G.; Martin-Hirsch, P.L.; Sreedhar, H.; Trevisan, J.; Walsh, M.J.; et al. Standardization of complex biologically derived spectrochemical datasets. Nat. Protoc. 2019, 14, 1546–1577. [Google Scholar] [CrossRef] [Scilit]
- Callery, E. Investigating the Clinical Application of Vibrational Spectroscopy: A Novel Technique for the Diagnosis of Common Variable Immune Deficiency. Ph.D. Thesis, The University of Manchester, Manchester, UK, 2022. [Google Scholar]
- Trevisan, J.; Angelov, P.P.; Scott, A.D.; Carmichael, P.L.; Martin, F.L. IRootLab: A free and open-source MATLAB toolbox for vibrational biospectroscopy data analysis. Bioinformatics 2013, 29, 1095–1097. [Google Scholar] [CrossRef] [Scilit]
- Ballabio, D.; Consonni, V. Classification tools in chemistry. Part 1: Linear models. PLS-DA. Anal. Methods 2013, 5, 3790–3798. [Google Scholar] [CrossRef] [Scilit]
- de Souza, A.T.B.; Câmara, A.B.F.; de Araújo Medeiros Santos, C.M.; de Lelis Medeiros de Morais, C.; de Oliveira Crispim, J.C.; de Lima, K.M.G. Spectrochemical differentiation in endometriosis based on infrared spectroscopy, advanced data fusion and multivariate analysis. Sci. Rep. 2025, 15, 5071. [Google Scholar] [CrossRef] [Scilit]
- McCall, J. Genetic algorithms for modelling and optimisation. J. Comput. Appl. Math. 2005, 184, 205–222. [Google Scholar] [CrossRef] [Scilit]
- Silva, L.G.; Péres, A.F.S.; Freitas, D.L.D.; Morais, C.L.M.; Martin, F.L.; Crispim, J.C.O.; Lima, K.M.G. ATR-FTIR spectroscopy in blood plasma combined with multivariate analysis to detect HIV infection in pregnant women. Sci. Rep. 2020, 10, 20156. [Google Scholar] [CrossRef] [Scilit]
- Xu, Q.S.; Liang, Y.Z. Monte Carlo cross validation. Chemom. Intell. Lab. Syst. 2001, 56, 1–11. [Google Scholar] [CrossRef] [Scilit]
- Baker, M.J.; Trevisan, J.; Bassan, P.; Bhargava, R.; Butler, H.J.; Dorling, K.M.; Fielden, P.R.; Fogarty, S.W.; Fullwood, N.J.; Heys, K.A.; et al. Using Fourier transform IR spectroscopy to analyze biological materials. Nat. Protoc. 2014, 9, 1771–1791. [Google Scholar] [CrossRef] [Scilit]
- Movasaghi, Z.; Rehman, S.; Rehman, D.I.U. Fourier Transform Infrared (FTIR) Spectroscopy of Biological Tissues. Appl. Spectrosc. Rev. 2008, 43, 134–179. [Google Scholar] [CrossRef] [Scilit]
- Aringer, M.; Costenbader, K.; Daikh, D.; Brinks, R.; Mosca, M.; Ramsey-Goldman, R.; Smolen, J.S.; Wofsy, D.; Boumpas, D.T.; Kamen, D.L.; et al. 2019 European League Against Rheumatism/American College of Rheumatology Classification Criteria for Systemic Lupus Erythematosus. Arthritis Rheumatol. 2019, 71, 1400–1412. [Google Scholar] [CrossRef] [Scilit]
- Isenberg, D.A.; Manson, J.J.; Ehrenstein, M.R.; Rahman, A. Fifty years of anti-dsDNA antibodies: Are we approaching journey’s end? Rheumatology 2007, 46, 1052–1056. [Google Scholar] [CrossRef] [Scilit]
- Tsokos, G.C.; Lo, M.S.; Reis, P.C.; Sullivan, K.E. New insights into the immunopathogenesis of systemic lupus erythematosus. Nat. Rev. Rheumatol. 2016, 12, 716–730. [Google Scholar] [CrossRef] [Scilit]
- Nightingale, A.L.; Davidson, J.E.; Molta, C.T.; Kan, H.J.; McHugh, N.J. Presentation of SLE in UK primary care using the Clinical Practice Research Datalink. Lupus Sci. Med. 2017, 4, e000172. [Google Scholar] [CrossRef] [Scilit]
- Jog, N.R.; James, J.A. Biomarkers in Connective Tissue Diseases. J. Allergy Clin. Immunol. 2017, 140, 1473–1483. [Google Scholar] [CrossRef] [Scilit]
- John, K.J.; Sadiq, M.; George, T.; Gunasekaran, K.; Francis, N.; Rajadurai, E.; Sudarsanam, T.D. Clinical and Immunological Profile of Mixed Connective Tissue Disease and a Comparison of Four Diagnostic Criteria. Int. J. Rheumatol. 2020, 2020, 9692030. [Google Scholar] [CrossRef] [Scilit]
- Mavragani, C.P.; Moutsopoulos, H.M. Sjögren’s syndrome: Old and new therapeutic targets. J. Autoimmun. 2020, 110, 102364. [Google Scholar] [CrossRef] [Scilit]
- Reynolds, J.A.; Briggs, T.A.; Rice, G.I.; Darmalinggam, S.; Bondet, V.; Bruce, E.; Khan, M.; Haque, S.; Chinoy, H.; Herrick, A.L.; et al. Type I interferon in patients with systemic autoimmune rheumatic disease is associated with haematological abnormalities and specific autoantibody profiles. Arthritis Res. Ther. 2019, 21, 147. [Google Scholar] [CrossRef] [Scilit]
- Parekh, R.B.; Dwek, R.A.; Sutton, B.J.; Fernandes, D.L.; Leung, A.; Stanworth, D.; Rademacher, T.W.; Mizuochi, T.; Taniguchi, T.; Matsuta, K.; et al. Association of rheumatoid arthritis and primary osteoarthritis with changes in the glycosylation pattern of total serum IgG. Nature 1985, 316, 452–457. [Google Scholar] [CrossRef] [Scilit]
- Wang, T.T.; Ravetch, J.V. Functional diversification of IgGs through Fc glycosylation. J. Clin. Investig. 2019, 129, 3492–3498. [Google Scholar] [CrossRef] [Scilit]
- Wu, Y.; Wang, M.; Hu, C.; Zhang, S.; Zhao, J.; Wang, Q.; Xu, D.; Tian, X.; Zhao, Y.; Zeng, X.; et al. IgG glycosylation profiling of systemic lupus erythematosus using lectin microarray. Lupus Sci. Med. 2025, 12, e001413. [Google Scholar] [CrossRef] [Scilit]
- Harden, O.C.; Hammad, S.M. Sphingolipids and Diagnosis, Prognosis, and Organ Damage in Systemic Lupus Erythematosus. Front. Immunol. 2020, 11, 586737. [Google Scholar] [CrossRef] [Scilit]
- Zhou, B.; Xia, Y.; She, J. Dysregulated serum lipid profile and its correlation to disease activity in young female adults diagnosed with systemic lupus erythematosus: A cross-sectional study. Lipids Health Dis. 2020, 19, 40. [Google Scholar] [CrossRef] [Scilit]
- Ahmad, H.M.; Sarhan, E.M.; Komber, U. Higher circulating levels of OxLDL % of LDL are associated with subclinical atherosclerosis in female patients with systemic lupus erythematosus. Rheumatol. Int. 2014, 34, 617–623. [Google Scholar] [CrossRef] [Scilit]
- Li, Y.; Liang, L.; Deng, X.; Zhong, L. Lipidomic and metabolomic profiling reveals novel candidate biomarkers in active systemic lupus erythematosus. Int. J. Clin. Exp. Pathol. 2019, 12, 857–866. [Google Scholar]
- Wirestam, L.; Jönsson, F.; Enocsson, H.; Svensson, C.; Weiner, M.; Wetterö, J.; Zachrisson, H.; Eriksson, P.; Sjöwall, C. Limited Association between Antibodies to Oxidized Low-Density Lipoprotein and Vascular Affection in Patients with Established Systemic Lupus Erythematosus. Int. J. Mol. Sci. 2023, 24, 8987. [Google Scholar] [CrossRef] [Scilit]
- Duvvuri, B.; Lood, C. Cell-Free DNA as a Biomarker in Autoimmune Rheumatic Diseases. Front. Immunol. 2019, 10, 502. [Google Scholar] [CrossRef] [Scilit]
- Hakkim, A.; Fürnrohr, B.G.; Amann, K.; Laube, B.; Abed, U.A.; Brinkmann, V.; Herrmann, M.; Voll, R.E.; Zychlinsky, A. Impairment of neutrophil extracellular trap degradation is associated with lupus nephritis. Proc. Natl. Acad. Sci. USA 2010, 107, 9813–9818. [Google Scholar] [CrossRef] [Scilit]
- Lood, C.; Blanco, L.P.; Purmalek, M.M.; Carmona-Rivera, C.; De Ravin, S.S.; Smith, C.K.; Malech, H.L.; A Ledbetter, J.; Elkon, K.B.; Kaplan, M.J. Neutrophil extracellular traps enriched in oxidized mitochondrial DNA are interferogenic and contribute to lupus-like disease. Nat. Med. 2016, 22, 146–153. [Google Scholar] [CrossRef] [Scilit]
- Giaglis, S.; Daoudlarian, D.; Voll, R.E.; Kyburz, D.; Venhoff, N.; Walker, U.A. Circulating mitochondrial DNA copy numbers represent a sensitive marker for diagnosis and monitoring of disease activity in systemic lupus erythematosus. RMD Open 2021, 7, e002010. [Google Scholar] [CrossRef] [Scilit]
- Vakrakou, A.G.; Boiu, S.; Ziakas, P.D.; Xingi, E.; Boleti, H.; Manoussakis, M.N. Systemic activation of NLRP3 inflammasome in patients with severe primary Sjögren’s syndrome fueled by inflammagenic DNA accumulations. J. Autoimmun. 2018, 91, 23–33. [Google Scholar] [CrossRef] [Scilit]
- Pisetsky, D.S.; Spencer, D.M.; Lipsky, P.E.; Rovin, B.H. Assay variation in the detection of antinuclear antibodies in the sera of patients with established SLE. Ann. Rheum. Dis. 2018, 77, 911–913. [Google Scholar] [CrossRef] [Scilit]
- Bertsias, G.; A Ioannidis, J.P.; Boletis, J.; Bombardieri, S.; Cervera, R.; Dostal, C.; Font, J.; Gilboe, I.M.; Houssiau, F.; Huizinga, T.; et al. EULAR recommendations for the management of systemic lupus erythematosus: Report of a Task Force of the EULAR Standing Committee for International Clinical Studies Including Therapeutics. Ann. Rheum. Dis. 2008, 67, 195–205. [Google Scholar] [CrossRef] [Scilit]
- Petri, M.; Orbai, A.; Alarcón, G.S.; Gordon, C.; Merrill, J.T.; Fortin, P.R.; Bruce, I.N.; Isenberg, D.; Wallace, D.J.; Nived, O.; et al. Derivation and validation of the Systemic Lupus International Collaborating Clinics classification criteria for systemic lupus erythematosus. Arthritis Rheum. 2012, 64, 2677–2686. [Google Scholar] [CrossRef] [Scilit]
- Tan, E.M.; Cohen, A.S.; Fries, J.F.; Masi, A.T.; Mcshane, D.J.; Rothfield, N.F.; Schaller, J.G.; Talal, N.; Winchester, R.J. The 1982 revised criteria for the classification of systemic lupus erythematosus. Arthritis Rheum. 1982, 25, 1271–1277. [Google Scholar] [CrossRef] [Scilit]
- Hassan, A.B.; Lundberg, I.E.; Isenberg, D.; Wahren-Herlenius, M. Serial analysis of Ro/SSA and La/SSB antibody levels and correlation with clinical disease activity in patients with systemic lupus erythematosus. Scand. J. Rheumatol. 2002, 31, 133–139. [Google Scholar] [CrossRef]
- Miyakis, S.; Lockshin, M.D.; Atsumi, T.; Branch, D.W.; Brey, R.L.; Cervera, R.; Derksen, R.H.W.M.; De Groot, P.G.; Koike, T.; Meroni, P.L.; et al. International consensus statement on an update of the classification criteria for definite antiphospholipid syndrome (APS). J. Thromb. Haemost. 2006, 4, 295–306. [Google Scholar] [CrossRef] [Scilit]

Disclaimer/Publisher’s Note: The statements, opinions and data contained in all publications are solely those of the individual author(s) and contributor(s) and not of MDPI and/or the editor(s). MDPI and/or the editor(s) disclaim responsibility for any injury to people or property resulting from any ideas, methods, instructions or products referred to in the content. |
© 2026 by the authors. Licensee MDPI, Basel, Switzerland. This article is an open access article distributed under the terms and conditions of the Creative Commons Attribution (CC BY) license.