


Abstract
Despite the rapid expansion of AI and machine-learning techniques in bankruptcy prediction, classical statistical methods such as discriminant analysis and logistic regression remain relevant because of their transparency and interpretability. These characteristics are crucial for stakeholders who require understandable decision-making tools, especially in NACE Rev. 2 Section I—Accommodation and Food Service Activities, a sector characterized by high operating leverage, vulnerability to economic shocks, and strong macroeconomic importance. The study aims to evaluate and compare the predictive performance of discriminant analysis and logistic regression for bankruptcy prediction and to identify key predictors that can serve as managerial early-warning signals for companies in crisis across B9 countries. The sample of 4395 companies was used. The classification ability of all models is assessed using multiple performance metrics, including overall accuracy, sensitivity, specificity, precision, the F1-score, the F2-score, the Matthews correlation coefficient, and the area under the receiver operating characteristic curve. The results show that both approaches achieve consistently high predictive performance, with all major metrics exceeding 0.92 on the test sample of prosperous and non-prosperous enterprises. Six significant bankruptcy predictors are identified for each method, with three common indicators: financial leverage, total liabilities to assets, and return on costs. The comparative analysis results in a methodological “draw,” confirming comparable predictive power. These findings reaffirm the relevance of classical prediction models and identify key financial indicators that can be used as practical early-warning signals by managers in the sector.
Keywords:
bankruptcy; Bucharest Nine; company in crisis; financial health; discriminant analysis; logistic regression; NACE I MSC:
62H30; 62M20; 62P20; 91B02
1. Introduction
This research focuses on bankruptcy, understood not in the legal sense, but as an early-warning signal of companies in crisis in the tourism and hospitality sector. While this issue has attracted sustained scholarly attention in Central and Eastern Europe, empirical evidence remains uneven across Bucharest Nine countries and only partly standardized with respect to industry definition. Prusak [1] argues that bankruptcy research in Central and Eastern Europe has developed asymmetrically across countries, with more advanced methodological adoption concentrated in settings with better data availability and research capacity. The results indicate that the most advanced research is conducted in the Czech Republic, Poland, Slovakia, Estonia, Russia, and Hungary, while Belarus, Bulgaria, and Latvia are at the opposite end; in the remaining countries, traditional approaches to predicting business insolvency tend to prevail [1]. Within the Bucharest Nine context, this asymmetry is reflected in the stronger empirical stream for Poland and Slovakia, where tourism- and hospitality-adjacent bankruptcy prediction is examined using financial-statement-based models under crisis conditions [2], as well as in multi-country Visegrad research that develops prediction frameworks from large firm samples and can serve as a methodological baseline for broader regional application [3,4]. Evidence from Romania further suggests that insolvency dynamics can be monitored specifically for hotels and restaurants using national register data, supporting the feasibility of hospitality-focused insolvency measurement in another Bucharest Nine economy even when firm-level modeling is less standardized [5]. Complementing this line of work, Rujescu et al. [6] apply survival analysis to accommodation establishments and report statistically significant differences in survival by accommodation type and comfort category; notably, the Bucharest–Ilfov region ranks among the lowest in survival probability, which indicates that vulnerability can be measured on clearly defined hospitality populations and that regional heterogeneity is empirically detectable. At the same time, Durana et al. [7] suggest that comparative distress modelling framed explicitly around the “Bucharest Nine” is becoming more common, even if it is not always focused exclusively on tourism. In Bulgaria, Gigova et al. [8] provide complementary methodological grounding by demonstrating how firm-level crisis forecasting models can be implemented as early-warning tools on national datasets; although not tourism-specific, their approach illustrates transferable prediction frameworks that can subsequently be restricted to NACE-based hospitality subsamples, reinforcing the broader point that cross-country evidence differs not only in results but also in the consistency of sector operationalization.
To establish the sectoral context and justify the subsequent modeling framework, a preliminary hypothesis is formulated as follows:
: There is a significantly higher frequency of non-prosperous companies in the Accommodation and Food Service Industry compared to a situation in which company prosperity and NACE classification are independent.
A central comparability problem concerns how “tourism” is defined in firm-level studies. The most defensible and internationally comparable proxy is NACE Rev. 2 Section I (Accommodation and food service activities), because it isolates core supply-side tourism industries and can be aligned with business demography and official bankruptcy statistics. However, the available evidence suggests that only a minority of studies operationalize the sector explicitly using NACE Section I or its sub-divisions (I55 and I56), whereas many employ broader labels such as “tourism sector” or “hospitality” without consistent coding, which undermines cross-country comparability across the Bucharest Nine. In this context, [9] focuses on the Slovak business environment and defines the accommodation and food service sector using NACE Section I. Their cluster analysis shows that this sector frequently exhibits homogeneous patterns of indebtedness with a broad group of other economic activities, particularly in terms of total indebtedness and self-financing ratios. Moreover, NACE I demonstrates comparable levels of both short-term and long-term financial liabilities relative to its cluster counterparts, indicating a consistent approach to liability management within this segment of the service economy. The identification of sectoral clusters with similar debt profiles provides managers and financial institutions with a useful benchmark for assessing the financial stability and independence of the hospitality industry, as well as for evaluating firm survival and performance. In contrast, Czuczor et al. [10] narrow the focus to Division 56 to capture food and beverage services, thereby highlighting that vulnerabilities may differ even within the same NACE section. Evidence from Visegrad hotel studies supports this interpretation, as Bacik et al. [11] document cross-country differences in hotel financial performance, implying that resilience to shocks and potential failure risk may vary substantially within an industry that is often treated as homogeneous. At the same time, it is important to acknowledge a definitional boundary: while NACE Section I captures the core of hospitality-related tourism supply, it does not encompass the full tourism economy (e.g., transport, culture, retail), which is distributed across multiple NACE sections; therefore, a focus on Section I is best interpreted as a sectorally consistent lens on the hospitality core rather than on tourism in its broadest sense.
Thus, this study aims to evaluate and compare the predictive performance of discriminant analysis and logistic regression for bankruptcy prediction and to identify key predictors that can serve as managerial early-warning signals for companies in crisis in the Accommodation and Food Service Industry across B9 countries.
Methodologically, the literature spans classical bankruptcy prediction models as well as econometric and non-parametric approaches that are often tailored to crisis periods. Gu and Gao [12] provide an early benchmark for hospitality failure prediction using multivariate discriminant analysis, illustrating how financial-statement-based classification can achieve high predictive accuracy in hospitality samples. Building on related logic in a Central and Eastern European setting, Wieprow and Gawlik [2] combine discriminant analysis with logit modeling to assess bankruptcy risk in the Polish tourism sector under crisis conditions, suggesting that conventional statistical prediction frameworks remain central in sector-focused bankruptcy assessment. By comparison, Heryan [3] move toward more advanced econometric modelling by studying hotel insolvency determinants across Visegrad-Plus countries with pooled-data generalized method of moments, emphasizing liquidity and working-capital dynamics as key drivers of hotel solvency across multiple markets. At a more granular level, Bednarova and Sotakova [13] show that bankruptcy prediction modelling can be applied to hospitality-related activity codes within Slovakia, reinforcing the feasibility of sector-specific modelling when industry classification is explicit and the sample is appropriately defined.
Across studies, financial ratios dominate the set of significant predictors, with recurring emphasis on leverage, liquidity, and debt servicing capacity. A longer-run Slovak perspective is provided by Elexa et al. [14], who identify warning signals before failure, linking distress trajectories to weakening cash-based liquidity and deteriorating equity positions, while also noting that accommodation and food services may experience comparatively long bankruptcy process durations. Beyond firm-level predictors, macro-institutional evidence from Poland indicates that crisis periods can substantially affect the scale of bankruptcies and restructuring procedures and that sectoral variation in these processes is pronounced, providing additional context for interpreting hospitality distress within the Bucharest Nine [15]. Relatedly, Maliszewska et al. [16] analyze insolvency trends after 2021, offering a post-pandemic reference point that can inform cross-country comparisons where similar sectoral vulnerabilities are expected.
Although NACE I is frequently described as uniquely exposed due to seasonality and sensitivity to external shocks, the reviewed evidence operationalizes these mechanisms only partially. Fenyves et al. [17] emphasize seasonality as a contextual vulnerability in accommodation services, implying that hospitality firms require stronger financial management to withstand predictable demand fluctuations. In contrast, Droj et al. [18] show that tourism companies’ financial performance in Central and Eastern Europe can deteriorate in response to external shocks and macroeconomic uncertainty beyond domestic fundamentals, broadening the interpretation of failure risk to include demand-side disruptions and uncertainty channels. At the same time, Prusak and Karas [4] synthesize bankruptcy prediction model development in the Visegrad region and argue that predictors can cluster in ways that do not fully align with traditional ratio categories, supporting the view that indicator sets may need to be adapted to the conditions of Central and Eastern European economies.
Based on the reviewed literature, the following hypotheses are formulated:
: Specific significant predictors of companies in crisis in the Accommodation and Food Service Industry across B9 countries detected by discriminant analysis exist.
: Specific significant predictors of companies in crisis in the Accommodation and Food Service Industry across B9 countries detected by logistic regression exist.
While previous studies on bankruptcy prediction in Central and Eastern Europe have examined a broad range of sectors and firm sizes, few have focused specifically on the Accommodation and Food Service Industry across Bucharest Nine (B9) countries. Moreover, although classical statistical methods such as linear discriminant analysis (DA) and logistic regression (LR) are well-established, their comparative performance has seldom been evaluated in a homogeneous, high-volatility sector.
This study aims to address this gap by comparing DA and LR not merely in terms of predictive accuracy, but also with respect to the interpretability and robustness of early-warning signals and sector-specific sensitivity to operational versus profitability indicators. By doing so, the research provides both theoretical insight into how classical models perform under sectoral homogeneity and practical guidance for managers and policymakers in identifying early-warning signs of corporate distress.
The remainder of the paper is structured as follows. Following the literature review and the formulation of the research aim and hypotheses, Section 2 describes the data sample, its structure, and the applied methodological approaches. Section 3 tests the stated hypotheses and compares the predictive performance of the employed methods, including a benchmark comparison with the Altman and Ohlson models. Finally, the paper concludes with a summary of the main results, practical and theoretical implications, study limitations, and directions for future research.
2. Materials and Methods
2.1. Samples, Period, Variables
Countries from Bucharest Nine were used in this investigation. Firstly, a full sample of 163,431 (Bulgarian, Czech, Estonian, Hungarian, Latvian, Lithuanian, Polish, Romanian and Slovak) companies was used. The data was gained from Moody’s Orbis. The study covers the years 2023 and 2024. The prosperity (dependent variable) was computed according to the ‘company in crisis’ used in Slovak legislation to gain a warning signal for managers. The rule for determining the financial state of a company was based on Act 513/1991 Coll—Commercial Code. If a company is in crisis according to the equity-to-debt ratio, it is a red flag of a non-prosperous company because the value of the equity-to-debt ratio falls below 0.08 in the year 2024. Companies from B9 and the same approach of setting legal bankruptcy were used by Durana et al. [7].
The whole sample was used to test the first hypothesis concerning the dependence between company prosperity and NACE classification. The relationship was examined using the Pearson chi-square test of independence. For the validity of the test, the standard conditions were required to be simultaneously satisfied, namely that at least 80% of the expected frequencies were equal to or greater than 5 and that no expected frequency was less than 1. These conditions were met. The chi-square test was complemented by an analysis of the strength of association using Pearson’s contingency coefficient and Cramér’s V. According to Vrtana and Duricova [19], the strength of association can be interpreted as follows: values below 0.20 indicate a negligible or weak association between NACE classification and company prosperity; values between 0.20 and 0.40 indicate a moderate association; values between 0.40 and 0.80 suggest a relatively strong or strong association; and values above 0.80 represent a very strong association.
Subsequently, the sign scheme was applied. The sign scheme, as described by Vrtana and Duricova [19], similarly to the chi-square test itself, is based on comparing observed and expected frequencies in each cell of the contingency table, resulting in the calculation of residual values. Using the adjusted standardized residuals, individual cells of the contingency table are visually annotated according to the direction and magnitude of deviation, indicating whether a given combination of variable categories exhibits overrepresentation or underrepresentation relative to the null hypothesis of independence. The designation “sign scheme” reflects the fact that this method uses the sign of the calculated residual to determine the direction of deviation. Three symbols are employed: “o” indicates no relationship, meaning no statistically significant difference between the observed and expected frequencies; “+” denotes a positive association, where the observed frequency exceeds the expected frequency; and “−” indicates a negative association, where the observed frequency is lower than the expected frequency. The number of symbols assigned, ranging from one to three, reflects the statistical significance of the adjusted residuals. One symbol corresponds to a significance level of α = 0.05, two symbols to α = 0.01, and three symbols to α = 0.001.
Following the sign scheme analysis, a sample of 4395 companies operating in NACE Rev. 2 Section I—Accommodation and Food Service Activities was used. Despite sectoral filtering, the resulting sample size remains sufficient for robust multivariate modeling. The structure of the sample is presented in Table 1. Company size classification follows the methodology applied in the Moody’s Orbis database. Enterprises are categorized as medium-sized (operating revenues ≥ EUR 1 million, total assets ≥ EUR 2 million, and at least 15 employees), large (operating revenues ≥ EUR 10 million, total assets ≥ EUR 20 million, and at least 150 employees). Enterprises that do not meet these criteria are classified as small enterprises [20].
Table 1.
Structure of the Sample for NACE Rev. 2 Section I.
The final sample was divided into training set (804 companies) and test set (3591 companies). The models were estimated using the training sample and validated on both the training and test samples to provide a comprehensive assessment of model performance. For all models, non-prosperous enterprises were split into training and test sets using an 80:20 ratio. After determining the size of the training sample of non-prosperous enterprises, an equal-sized sample of prosperous enterprises was constructed through random selection, following established approaches [21]. The resulting training sample of prosperous enterprises preserves the original country distribution, in line with Barboza et al. [22]. The remaining prosperous enterprises were assigned to the test sample.
To test the second and third hypotheses, it was necessary to compare the predictive performance of discriminant analysis and logistic regression. The set of independent predictors covers the years 2022 and 2023. Based on previous studies [7,23,24], twenty variables were selected from the areas of liquidity, activity, profitability, and indebtedness.
To control multicollinearity among independent variables in the constructed models, the variance inflation factor (VIF) was examined, with a threshold of VIF < 3. In addition, eigenvalues greater than 0.01, a condition index below 30, and variance proportions below 0.5 were verified in accordance with the recommendations of Durana et al. [7].
2.2. Discriminant Analysis
Discriminant analysis (DA) is a statistical method that relates a categorical dependent variable to one or more continuous explanatory variables and assigns observations to predefined groups to maximize classification accuracy. Despite the availability of more advanced techniques, DA remains widely used in bankruptcy prediction due to its computational efficiency, transparency, and interpretability of the model structure and coefficients [25].
In each model, observations are classified into disjoint groups; in this study, , representing prosperous and non-prosperous companies. Each entity is described by a set of explanatory variables, where the number of variables must be at least two fewer than the number of observations [26]. Regarding sample size requirements, at least five observations per group should be available for each independent variable, while bankruptcy prediction literature often recommends a minimum of twenty observations per variable to ensure robustness [23].
Another practical requirement is that each group contains more observations than the number of explanatory variables included in the model; these conditions were satisfied in the present study.
An important assumption concerns the discriminatory power of predictors, which is typically supported when mean values of the explanatory variables differ significantly across groups, thereby maximizing the separation between prosperous and non-prosperous companies in the discriminant function [25].
The null hypothesis tests the equality of the mean values of the discriminating variables across prosperity groups, while the alternative hypothesis assumes that the group means differ significantly [27]. To verify this assumption, Wilks’ lambda (λ) based on the F-statistic was employed. If the -value of the test is lower than the selected significance level, the group means are considered significantly different, indicating that the explanatory variables effectively discriminate between prosperous and non-prosperous companies and contribute to the high classification accuracy of the constructed models.
The existence of multivariate normality in the distribution of explanatory variables within individual disjoint groups and homoscedasticity, defined as the equality or approximate equality of covariance matrices across groups, represent further assumptions of discriminant analysis [26]. Multivariate normality was not tested explicitly, as Kliestik et al. [25] emphasize that violations of this assumption do not distort the overall classification error. Instead, the classification accuracy tends to be underestimated in one group and overestimated in the other, while the total misclassification rate remains largely unaffected.
The equality of covariance matrices is commonly examined using Box’s M test. The null hypothesis of this test assumes equality of the covariance matrices of the independent variables between the groups of prosperous and non-prosperous companies, whereas the alternative hypothesis tests for differences in covariance structures [27]. Valaskova et al. [23] note that a violation of this assumption is indicated by a large value of Box’s M accompanied by a low -value. They further emphasize that Box’s M statistic tends to be inflated in large samples, as is the case in the present study. Kral et al. [26] suggest addressing violations of homoscedasticity by applying quadratic discriminant analysis instead of linear discriminant analysis or by incorporating separate covariance matrices for each prosperity group rather than a single pooled matrix.
The construction of a statistically significant prediction model for the dependent variable prosperity was carried out using canonical discriminant analysis implemented in IBM SPSS Statistics, version 28.0, applying the stepwise method. The overall quality of the developed prediction models was assessed using the canonical correlation of the discriminant function and tests of statistical significance, where the null hypothesis assumes that the model is not statistically significant, while the alternative hypothesis tests the statistical significance of the model.
Furthermore, the eigenvalue and Wilks’ lambda (λ) were used to evaluate the canonical correlation, which expresses the relationship between the groups of the dependent variable and the discriminant function of the constructed model. The eigenvalue is determined by the ratio of explained to unexplained variability in the model, with higher values indicating stronger discriminatory power. Wilks’ lambda is calculated as λ = (1 − explained variability) and is used to assess the relevance of the discriminant functions [23].
The assessment of the influence of explanatory variables is conducted using standardized coefficients of the discriminant function and correlation coefficients between individual independent variables and the resulting discriminant function. The standardized coefficients indicate which explanatory variables exhibit the greatest discriminatory power in the final model. Based on the magnitude of these coefficients, the variables can be ranked according to their ability to discriminate between prosperous and non-prosperous companies [25].
Kliestik et al. [25] further emphasize that calculating correlation coefficients between the discriminant function and individual explanatory variables provides information not only on the strength of each variable’s influence on the overall discriminant score but also on the direction of this influence, which is determined by the sign of the correlation coefficient. A positive correlation coefficient indicates that the selected indicator increases the value of the discriminant Z-score (direct effect), whereas a negative correlation coefficient implies that the indicator decreases the value of the discriminant Z-score (inverse effect). The strength of the correlation coefficients was evaluated using a scale analogous to that applied for contingency coefficients.
Unstandardized coefficients of the discriminant function were used to construct the discriminant functions y for each analyzed period. Based on the estimated equations, a discriminant Z-score can be calculated for each company. Classification based on group centroids was not applied, as IBM SPSS Statistics incorporates the model constant when computing centroids, thereby performing an intentional adjustment so that the weighted mean of the centroids (weighted by the number of companies in each group) equals zero [25].
Consequently, when an intercept is included in the model, centroid values are not used for assigning companies to the groups of prosperous or non-prosperous enterprises. Instead, classification is based solely on the sign of the discriminant Z-score. The sign of the centroid indicates which group corresponds to positive Z-scores and which corresponds to negative Z-scores.
2.3. Logistic Regression
Logistic regression (LR) is a widely used approach for modeling a categorical dependent variable and estimating the probability of an event based on a set of explanatory variables [26]. In this study, LR is applied to model financial health, where prosperity is encoded as a binary variable with prosperous companies coded as and non-prosperous companies coded as . The sample size requirement of at least ten observations per explanatory variable was satisfied [25]. Following Kliestik et al. [25] and Horvathova and Mokrisova [28], for independent variables, the probability that a company is non-prosperous is expressed as:
where denotes the dependent variable for the -th observation, represents the value of the -th predictor for the -th observation, is the regression coefficient, and denotes the intercept. The logit is expressed as the natural logarithm of the odds ratio:
The prediction model was constructed in IBM SPSS Statistics (version 28.0) using logistic regression with the backward stepwise procedure. In SPSS, the backward stepwise selection is performed using the Wald statistic as the decision criterion, whereby predictors are iteratively removed based on their statistical significance (p-to-remove), while previously removed variables may be re-entered if they meet the entry criterion (p-to-enter). The default SPSS thresholds (p-to-enter = 0.05; p-to-remove = 0.10) were applied to obtain a parsimonious and interpretable model. Model adequacy was assessed using standard LR diagnostics, including the Omnibus Test of Model Coefficients and the −2log-likelihood , which evaluate whether the fitted model improves over the intercept-only specification and whether model fit increases as predictors are retained [25,26].
Because the traditional R2 measure is not applicable in logistic regression, several pseudo-R2 measures have been proposed. The Cox and Snell R2 is based on a comparison of the likelihoods of the fitted and null models; however, its maximum value is less than one. To address this limitation, the Nagelkerke R2 adjusts the Cox and Snell measure to allow values within the interval ⟨0,1⟩. These pseudo-R2 measures provide an indication of the model’s explanatory power, with higher values suggesting a stronger relationship between the predictors and the dependent variable [26].
The Hosmer–Lemeshow test evaluates the goodness of fit of a logistic regression model by comparing observed and predicted frequencies across groups formed based on estimated probabilities. The null hypothesis assumes no significant difference between observed and expected values. A non-significant test result indicates that the model fits the data adequately and that there is no evidence of systematic deviation between observed outcomes and model predictions [25].
2.4. Traditional Bankruptcy Prediction Models
Predicting financial distress and possible bankruptcy of a company is an important tool for investors, creditors, and company management. Two classic models used for this purpose are Altman’s Z-score and Ohlson’s O-score. Both methods provide a quantitative assessment of the risk of financial instability based on financial ratios, but they differ in their structure and assumptions [29]. Parametric bankruptcy prediction models, especially accounting-based ones, rely on financial ratios to measure default risk [30].
Altman’s Z-score is a multivariate discriminant model originally developed by Edward I. Altman in 1968 to predict the probability of bankruptcy of publicly traded manufacturing companies [29]. Edward Altman’s Z-Score was an early multivariate model predicting U.S. corporate bankruptcy using five key ratios. Tested on 66 firms, it achieved 95% accuracy one year before failure and became widely adopted, with later studies adjusting its variables to suit changing business conditions [30]. This model classifies companies into “safe,” “gray,” or “distressed” zones based on their final score [29]. Although initially developed for manufacturing firms, the Z′-Score has proven adaptable across different industries and countries. Edward Altman’s Z′-Score classifies firms into three financial health zones: safe (above 2.90), gray (1.23–2.90), and distressed (below 1.23). While its one-year predictive accuracy reached 95%, this fell to 83% over two years. For private firms, Altman introduced the Z″-Score, replacing market equity with book value and adjusting thresholds (safe above 2.60; distressed below 1.10), maintaining high accuracy despite slightly higher error rates. He later developed the Z″-Score EMS for emerging markets, excluding one variable to reduce industry bias and using higher cut-offs (safe above 5.85; distressed below 4.35). Successfully applied in countries such as Mexico and relevant to contexts like Colombia, the EMS version enables sector-specific assessment and supports financial risk monitoring in volatile and developing economies [30,31].
where
Empirical studies of the use of Z-score in 2024–2025 show its strong relevance in various contexts. For example, Dolinšek and Kovač [32] tested the model for Slovenian companies and found that the Z-score can distinguish between bankrupt and non-bankrupt companies with a relatively high rate of correct classification, although the accuracy was not absolute. Other modern empirical applications include an analysis of companies on the Bucharest Stock Exchange, which highlighted the significant use of Z-scores in identifying the financial risk of companies in the context of the Central European market [33]. In all these applications, Altman’s model remains a valuable tool for predicting bankruptcy, which is easy to calculate and interpret, although it may require adjustment for specific industries or markets [29].
To ensure the comparability of classification outcomes across the applied models, the gray zone of the Z″-Score EMS model was not treated as a separate category in this article. Instead, the gray zone interval (4.35–5.85) was divided at its midpoint (Z″ = 5.10). Enterprises with Z″-Score values above 5.10 were classified as financially prosperous, whereas those with values below 5.10 were classified as financially non-prosperous. This approach enables a binary classification consistent with the dependent variable structure used in the statistical models and avoids the exclusion of observations falling within the gray zone, thereby preserving the balance and comparability of the classification framework across methods.
The Ohlson O-score is a model based on logistic regression, which was introduced by James Ohlson in 1980 as an alternative to the classic discriminant approach [34]. Limitations of discriminant analysis later led to logit models. James Ohlson’s O-Score applied a logit approach with nine financial and non-financial variables. Based on 2163 firms (105 bankrupt), it marked a major step forward in distress prediction and has since been broadly adapted to different financial environments [30]. Unlike the Z-score, the O-score produces a probability of bankruptcy ranging from 0 to 1 by combining several variables such as the debt-to-asset ratio, working capital, net income, the difference between net income in two consecutive years, and other indicators. This model is more flexible in incorporating variable accounting and operational characteristics of companies [34]. The O-Score offers stakeholders clear, actionable insight by expressing default risk as a probability between 0 and 1, enabling intuitive evaluation and proactive management of financial distress [30].
where:
The model applies a 0.38 cutoff: firms scoring below this threshold are classified as safe with low bankruptcy risk, while those above it are considered distressed and financially vulnerable [30].
Empirical comparative studies show that both Altman’s Z-score and Ohlson’s O-score remain relevant in current financial research, but may show varying degrees of accuracy in different sectors and market conditions. One analysis conducted on life insurance companies in Indonesia concluded that Altman’s model was more reliable than Ohlson’s in predicting bankruptcy in this case [35]. In other contexts, Ohlson’s model appears to be more flexible for short-term predictions in dynamic sectors, while Altman’s model is robust as an early warning signal for potential financial difficulties [36]. Overall, today’s research places classic bankruptcy prediction models in a broader framework, where they are often supplemented by modern computational and machine learning approaches to increase the accuracy and adaptability of the models [29].
2.5. Classification Performance
Durica et al. [37] state that the quality and performance of the constructed prediction models can be quantified and evaluated using a confusion matrix (coincidence matrix). The classification table distinguishes four outcomes: true positives (TP), false positives (FP), false negatives (FN), and true negatives (TN).
Based on the confusion matrix, several performance metrics can be derived to assess the quality of the constructed models.
Overall accuracy represents the proportion of correctly classified companies relative to the total number of companies in the sample.
Sensitivity represents the ratio of true positive cases to all actual positive cases.
Specificity represents the ratio of true negative cases to all actual negative cases.
Balanced accuracy represents the arithmetic mean of sensitivity and specificity, accounting for correct predictions in both classes when one class is substantially more prevalent than the other [38].
Precision represents the proportion of correctly classified positive cases among all predicted positive cases.
To jointly summarize precision and sensitivity, F-scores were calculated as special cases of the general Fβ-score. For β = 1, precision and sensitivity are weighted equally:
For β = 2, sensitivity is emphasized (twice the weight of precision):
Michalkova and Ponisciakova [38] state that the Matthews correlation coefficient (MCC) is a robust metric for classification evaluation because it incorporates all four confusion-matrix outcomes and is less sensitive to class imbalance:
Finally, sensitivity and specificity were used to construct the ROC curve, and model discrimination was evaluated by the area under the curve (AUC). Li et al. [39] note that higher AUC values indicate better discriminative ability, while Durica et al. [37] provide the standard interpretation scale, where values close to 0.5 indicate performance comparable to a random classifier and values approaching 1 indicate excellent predictive performance. The statistical significance of AUC was tested against the null hypothesis AUC = 0.5. All statistical tests were conducted at the significance level α = 0.05.
3. Results and Discussion
Firstly, the dependence between company prosperity (2 categories) and NACE classification (19 categories) was confirmed by the -value from Table 2. Both contingency coefficients, Pearson’s contingency coefficient and Cramér’s V, depicted in Table 3, show moderate statistically significant contingency between prosperity and NACE classification.
Table 2.
Pearson chi-square test of independence.
Table 3.
Contingency coefficients.
Table 4 contains the adjusted residuals between prosperity represented by 0, non-prosperity represented by 1, and each NACE classification in Bucharest Nine.
Table 4.
Adjusted standardized residuals.
The sign scheme analysis (Table 5) reveals four distinct patterns of association between NACE classification and company prosperity. The symbol “o” indicates that no statistically significant relationship exists. The symbol “+” denotes a positive association, while the symbol “−” indicates a negative association. One symbol (+ or −) corresponds to the significance level α = 0.05, two symbols (++ or −−) correspond to α = 0.01, and three symbols (+++ or −−−) correspond to α = 0.001. A first group of sectors exhibits no statistically significant association between sector affiliation and prosperity, indicating that the observed frequencies of prosperous and non-prosperous companies do not differ from those expected under the assumption of independence (B, E, G, J, K, L, O, S). A second group of sectors is characterized by a strong or very strong overrepresentation of prosperous companies accompanied by a corresponding underrepresentation of non-prosperous enterprises, suggesting relatively high financial resilience within these industries (A, C, F). In contrast, a third group displays a strong or very strong overrepresentation of non-prosperous companies and a pronounced underrepresentation of prosperous firms, pointing to elevated sectoral vulnerability and a higher concentration of financial distress (D, I, M, N, Q, R). Finally, a small group of sectors shows only weak but statistically significant deviations from independence, where non-prosperous enterprises are mildly overrepresented, indicating limited yet detectable sector-specific effects (H, P).
Table 5.
Sign scheme.
Thus, the sign scheme analysis clearly confirms the first hypothesis, which states that there is a significantly higher frequency of non-prosperous companies in the Accommodation and Food Service Industry compared to a situation in which company prosperity and NACE classification are independent. The very strong overrepresentation of non-prosperous enterprises and the corresponding underrepresentation of prosperous enterprises in NACE I provide robust empirical support for this conclusion.
Secondly, discriminant analysis was performed. The assumption of different mean values of the explanatory variables between the groups of prosperous and non-prosperous companies is. By comparing the -values of the significant predictors reported in Table 6 with the selected significance level α, the null hypothesis was rejected in favor of the alternative hypothesis. This indicates that the mean values of the selected independent variables differ significantly between the groups and that these variables exhibit sufficient discriminatory power with respect to the dependent variable, prosperity.
Table 6.
Test of equality of means.
Then, Box’s test of equality of covariance matrices was performed. By comparing the -value reported in Table 7 with the selected significance level α = 0.05, the null hypothesis was rejected in favor of the alternative hypothesis, indicating that the covariance matrices of the independent variables are not equal across the groups. Consequently, further computations were conducted assuming two distinct covariance matrices rather than a single pooled matrix, and discriminant analysis could therefore be appropriately implemented.
Table 7.
Box’s M.
To demonstrate the elimination of multicollinearity through the stepwise procedure, individual values of VIF were calculated for each independent variable. As reported in Table 8, all VIF values are below the threshold of 3. In addition, none of the reported diagnostic metrics simultaneously satisfy the conditions of an eigenvalue below 0.01, a condition index above 30, and a variance proportion exceeding 0.5 (Table 9). These results indicate the absence of substantial multicollinearity among the explanatory predictors.
Table 8.
VIF for DA.
Table 9.
Eigenvalue, condition index, variance proportions for DA.
Table 10 reports the eigenvalue and the canonical correlation of the classification function derived from canonical discriminant analysis. The canonical correlation value of 0.809 indicates the existence of a discriminant function that provides a relatively strong separation between prosperous and non-prosperous companies. Table 10 also presents the significance test of the derived canonical discriminant function using Wilks’ λ. By comparing the -value with the selected significance level α, the null hypothesis was rejected in favor of the alternative hypothesis. Consequently, it can be concluded that the identified canonical discriminant function for the crisis period is statistically significant.
Table 10.
Canonical correlation.
Thus, the second hypothesis is confirmed, indicating that specific significant predictors of companies in crisis in the Accommodation and Food Service Industry across B9 countries can be identified using discriminant analysis.
Table 11 evaluates the standardized coefficients of the explanatory variables. From the perspective of standardized discriminant coefficients, the variable total indebtedness emerges as the discriminator with the highest discriminating power. It is followed by financial leverage, return on costs, return on equity, credit period ratio, and inventory turnover.
Table 11.
Standardized canonical discriminant function coefficients.
Based on Table 12, the relationship between the discriminant function and the individual explanatory variables is evaluated. The indicators are ordered in descending order according to the strength of their association. A very strong relationship between the discriminant function and total indebtedness is documented by the calculated correlation coefficient. The remaining correlation coefficients indicate either moderate or weak associations. The weakest relationship with the discriminant function is observed for inventory turnover.
Table 12.
Correlation coefficients.
Based on the estimated unstandardized coefficients, the following model was constructed:
Based on the classification equation and the specific values of the predictors, a Z-score is calculated for each company operating in the B9 region. Table 13 reports the centroids for the individual groups of companies. Classification is performed by comparing only the sign of the calculated Z-score with the sign of the corresponding centroid. If the computed Z-score is positive, the company is classified as non-prosperous. Conversely, if the Z-score is negative, the company is classified as prosperous.
Table 13.
Centroids.
Model validation was performed using the training sample of companies (Table 14). By comparing the actual and predicted classifications, it can be concluded that 762 enterprises were correctly classified out of a total of 804 enterprises in the training sample. Within the group of prosperous companies, 93.53% of enterprises were correctly classified, while particularly strong performance was observed for non-prosperous companies, where 96.02% were correctly assigned to the appropriate category.
Table 14.
Confusion matrix based on the training sample for DA.
Given that negative values of the discriminant score indicate prosperous companies, while positive values indicate non-prosperous companies, the estimated coefficients can be interpreted as managerial early-warning signals for companies operating in the Accommodation and Food Service Industry.
Predictors with positive coefficients increase the value of the discriminant score and therefore raise the likelihood of non-prosperity, representing warning signals. Conversely, predictors with negative coefficients reduce the discriminant score and act as protective factors supporting prosperity.
Total indebtedness emerges as the strongest warning signal in the model. An increase in overall debt substantially elevates the risk of non-prosperity, which is particularly critical in the hospitality sector due to its pronounced sensitivity to demand fluctuations, seasonality, and external economic shocks. High indebtedness significantly reduces financial flexibility during periods of revenue instability.
Similarly, a longer credit period ratio contributes to higher distress risk by worsening cash-flow dynamics, especially relevant in hospitality firms relying on delayed payments from intermediaries or corporate clients.
The positive coefficient of inventory turnover suggests that unusually high turnover may reflect operational instability rather than efficiency, such as forced inventory adjustments, demand volatility, or non-standard purchasing behavior during crisis periods.
The positive association of return on equity with non-prosperity indicates that high ROE may be driven by excessive leverage or a weakened equity base, producing artificially inflated profitability figures that mask underlying financial fragility.
In contrast, return on costs represents the strongest protective factor in the model. Higher ROC significantly lowers the probability of non-prosperity, highlighting the importance of effective cost management, pricing strategies, and operational efficiency in hospitality businesses.
Financial leverage exhibits a negative coefficient, suggesting a stabilizing effect within the sample analyzed. This result indicates that firms with a structured and controlled leverage position may be more resilient, whereas financial distress is more strongly captured by overall indebtedness rather than leverage alone.
Finally, logistic regression was run. To demonstrate the elimination of multicollinearity through the backward stepwise procedure, individual values of VIF were calculated for each independent variable. As reported in Table 15, all VIF values are below the threshold of 3. In addition, none of the reported diagnostic metrics simultaneously satisfy the conditions of an eigenvalue below 0.01, a condition index above 30, and a variance proportion exceeding 0.5 (Table 16). These results indicate the absence of substantial multicollinearity among the explanatory predictors.
Table 15.
VIF for LR.
Table 16.
Eigenvalue, condition index, variance proportions.
The results of the Omnibus tests of model coefficients (Table 17) indicate that the overall logistic regression model is statistically significant. -value below 0.001, which clearly demonstrates that the set of explanatory variables included in the model significantly improves model fit compared to the intercept-only model. The same conclusion applies to the block-level test, which confirms that the predictors entered as a block contribute significantly to explaining variation in company prosperity.
Table 17.
Omnibus tests of model coefficients.
Table 18 reports the values of the −2 Log Likelihood and pseudo coefficients of determination for the estimated logistic regression model. The −2 Log Likelihood value of 352.290 indicates a substantial improvement in model fit compared to the intercept-only specification, confirming the strong explanatory capacity of the final model. The Cox and Snell R2 reaches 0.492, suggesting that nearly half of the variation in company prosperity is explained by the included predictors. Given the known upper-bound limitation of this measure, the Nagelkerke R2 provides a more interpretable estimate, reaching a value of 0.776. This result indicates a high level of explanatory power and suggests a strong relationship between the explanatory variables and the probability of company distress.
Table 18.
Goodness-of-fit statistics.
The adequacy of model fit is further assessed using the Hosmer–Lemeshow goodness-of-fit test, reported in Table 19. Since the -value exceeds the selected significance level of α = 0.05, the null hypothesis of no difference between observed and predicted frequencies cannot be rejected. This outcome indicates that the model fits the data well and that there is no evidence of systematic deviation between the observed outcomes and the model’s predictions. Taken together, the reported goodness-of-fit statistics confirm that the estimated logistic regression model is statistically sound, well calibrated, and suitable for reliable bankruptcy prediction and early-warning assessment in the Accommodation and Food Service Industry across B9 countries.
Table 19.
Hosmer and Lemeshow test.
Thus, the third hypothesis was confirmed: that specific significant predictors of companies in crisis in the Accommodation and Food Service Industry across B9 countries detected by logistic regression exist.
Despite the inclusion of the constant term, six significant variables were identified by logistic regression: the quick ratio, return on assets, return on sales, return on costs, total indebtedness, and financial leverage (Table 20).
Table 20.
Significant variables for LR.
Based on the estimated beta coefficients, the following model was constructed:
Model validation was performed using the training sample of companies (Table 21). By comparing the actual and predicted classifications, it can be concluded that 751 enterprises were correctly classified out of a total of 804 enterprises in the training sample. Within the group of prosperous companies, 91.79% of enterprises were correctly classified. Strong performance was also observed by non-prosperous companies, where 95.02% were correctly assigned to the appropriate category.
Table 21.
Confusion matrix based on the training sample for LR.
Subsequent results correspond to the Altman model (Table 22). By comparing the actual and predicted classifications, it can be concluded that 530 enterprises were correctly classified out of a total of 804 enterprises in the training sample. Within the group of prosperous companies, 61.94% of enterprises were correctly classified. In the case of non-prosperous companies, 69.90% were correctly assigned to the appropriate category, indicating lower classification performance compared to the previously estimated statistical models.
Table 22.
Confusion matrix based on the training sample for the Altman model.
The Ohlson model was also validated (Table 23). By comparing the actual and predicted classifications, it can be concluded that 498 enterprises were correctly classified out of a total of 804 enterprises in the training sample. Within the group of prosperous companies, 58.96% of enterprises were correctly classified. In the group of non-prosperous companies, 64.93% were correctly assigned to the appropriate category, reflecting a further decrease in classification accuracy compared to the Altman model as well as to discriminant analysis and logistic regression.
Table 23.
Confusion matrix based on the training sample for the Ohlson model.
The Altman and Ohlson models exhibit substantially lower classification performance on the training sample compared to discriminant analysis and logistic regression, confirming the superior predictive ability of the developed statistical models.
In the logistic regression framework, the dependent variable is coded as y = 1 for non-prosperous companies and y = 0 for prosperous companies, with a classification cut-off point set at 0.5. Positive coefficients increase the probability of a company being classified as non-prosperous, thereby representing early-warning signals, whereas negative coefficients reduce this probability and act as stabilizing factors.
Three predictors identified by logistic regression coincide with those detected by discriminant analysis: total indebtedness, financial leverage, and return on costs.
Beyond these shared variables, logistic regression identifies several additional early-warning indicators that provide complementary managerial insights. The quick ratio exhibits a negative coefficient, indicating that higher short-term liquidity reduces the probability of non-prosperity. From a managerial perspective, this confirms that the ability to cover current liabilities with liquid assets plays a critical stabilizing role in the Accommodation and Food Service Industry, where cash-flow volatility and short operating cycles are common.
Both profitability ratios, namely ROA and ROS, display positive coefficients, implying that higher values increase the likelihood of a company being classified as non-prosperous. From the perspective of financial analysis theory, these profitability ratios of enterprises in a set are the bearers of unique information about the analyzed economic phenomenon and are generally expected to reflect an ability to generate profit. However, in the present sample of enterprises in the Accommodation and Food Service Industry, their positive coefficients in the logistic regression model indicate the opposite: higher values are associated with an increased likelihood of financial distress. This can be explained by the fact that short-term or temporarily inflated profitability—driven by aggressive cost-cutting, asset sales, pricing strategies, or accounting effects—does not necessarily translate into sustainable financial health. Moreover, the coefficients in logistic regression must be interpreted in the context of all other variables in the model [2], since for the process of modeling economic reality, it holds true that the coefficient of a particular variable never describes an isolated cause-and-effect relationship in the real world [29]; it only describes how the variable contributes to the prediction beyond the information already provided by the other variables in the model. For instance, while ROA and ROS reflect revenue-based profitability, ROC captures cost efficiency and shows a strong negative effect, highlighting that effective cost management, rather than revenue-based margins alone, is crucial for financial stability. In this case, temporarily high ROA or ROS can be explained as warning signals rather than indicators of true financial soundness [40].
Both return on assets and return on sales display positive coefficients, implying that higher values increase the likelihood of a company being classified as non-prosperous. Although counterintuitive at first glance, this result can be interpreted as a signal of distorted profitability driven by financial leverage, accounting effects, or temporarily inflated margins. In crisis-prone service sectors, high ROA or ROS may reflect aggressive cost cutting, underinvestment, or a shrinking asset base rather than sustainable performance, thus serving as warning signals rather than indicators of financial health.
The confusion matrices reported in Table 24 and Table 25 provide a detailed insight into the classification performance of discriminant analysis and logistic regression on the test sample. In the case of discriminant analysis, 3582 out of 3892 prosperous companies were correctly classified, corresponding to a correct classification rate of 92.03%. Similarly, 93 out of 101 non-prosperous companies were correctly identified, yielding a classification accuracy of 92.08% for the distressed group. Misclassification errors are relatively limited, with 310 prosperous companies incorrectly classified as non-prosperous and only 8 non-prosperous companies incorrectly classified as prosperous, indicating a low Type I error rate.
Table 24.
Confusion matrix based on the test sample for DA.
Table 25.
Confusion matrix based on the test sample for LR.
Logistic regression exhibits slightly superior classification performance. Specifically, 3620 prosperous companies were correctly classified, corresponding to a correct classification rate of 93.01%, while 96 out of 101 non-prosperous companies were correctly identified, resulting in a classification accuracy of 95.05% for non-prosperous enterprises. The number of misclassified non-prosperous companies is particularly low, with only 5 cases incorrectly assigned to the prosperous group, reflecting a further reduction in Type I error compared to discriminant analysis.
The confusion matrices reported in Table 26 and Table 27 provide a detailed insight into the classification performance of the Altman and Ohlson models on the test sample. In the case of the Altman model, 2433 out of 3892 prosperous companies were correctly classified, corresponding to a correct classification rate of 62.51%. In the group of non-prosperous companies, 69 out of 101 enterprises were correctly identified, yielding a classification accuracy of 68.32% for distressed enterprises. Misclassification errors are substantially higher compared to the previously applied statistical models, with 1459 prosperous companies incorrectly classified as non-prosperous and 32 non-prosperous companies incorrectly classified as prosperous, indicating a higher Type I error rate.
Table 26.
Confusion matrix based on the test sample for the Altman model.
Table 27.
Confusion matrix based on the test sample for the Ohlson model.
The Ohlson model exhibits slightly weaker classification performance. Specifically, 2257 prosperous companies were correctly classified, corresponding to a correct classification rate of 57.99%, while 64 out of 101 non-prosperous companies were correctly identified, resulting in a classification accuracy of 63.37% for non-prosperous enterprises. The number of misclassified non-prosperous companies is higher than in the Altman model, with 37 cases incorrectly assigned to the prosperous group, indicating a further increase in Type I error and a lower overall predictive performance compared to both the Altman model and the previously estimated discriminant analysis and logistic regression models.
The classification performance of discriminant analysis and logistic regression is summarized in Table 28 using a broad set of evaluation metrics. Focusing primarily on the test sample, both approaches demonstrate consistently high predictive accuracy across all reported measures. Overall accuracy exceeds 0.92 for both models, indicating a high proportion of correctly classified enterprises. Sensitivity and specificity are well balanced, with values above 0.92, suggesting that both prosperous and non-prosperous companies are identified with comparable reliability. Logistic regression achieves slightly higher specificity (0.9505) and sensitivity (0.9301) than discriminant analysis, indicating a marginally better ability to distinguish between the two classes.
Table 28.
Classification performance.
Precision reaches extremely high values for both methods in the test sample (above 0.997), implying that almost all enterprises classified as non-prosperous are indeed non-prosperous. Balanced accuracy confirms these findings, exceeding 0.92 for both approaches and indicating robustness to potential class imbalance. The F1- and F2-scores further support the strong performance of both models, with logistic regression again showing slightly higher values, particularly when greater emphasis is placed on sensitivity. The Matthews correlation coefficient on the test sample indicates moderate classification agreement, with logistic regression (0.4780) outperforming discriminant analysis (0.4384).
In contrast, the Altman and Ohlson models (Table 28) exhibit substantially lower predictive performance on the test sample. Overall accuracy reaches only 0.6266 for the Altman model and 0.5813 for the Ohlson model. Sensitivity and specificity are also considerably lower, with both models showing a weaker ability to correctly identify prosperous and non-prosperous enterprises. Balanced accuracy remains below 0.66 for Altman and 0.61 for Ohlson, confirming limited robustness in the presence of class imbalance. Although precision remains relatively high due to the low number of false positive classifications, the F1- and F2-scores are markedly lower than those of discriminant analysis and logistic regression. The Matthews correlation coefficient further highlights the limited predictive power of these traditional scoring models, with values of 0.0996 for Altman and 0.0678 for Ohlson, indicating only weak agreement beyond random classification.
Results for the training sample are even stronger for discriminant analysis and logistic regression, with most metrics exceeding 0.93, reflecting excellent in-sample fit. While discriminant analysis achieves slightly higher overall accuracy and MCC on the training data, the differences between the two methods remain limited. The Altman and Ohlson models also improve on the training sample; however, their performance remains substantially below that of the statistical models, with overall accuracy below 0.66 and MCC values indicating only modest predictive relationships. Overall, the results confirm that discriminant analysis and logistic regression exhibit high and comparable predictive performance, whereas the Altman and Ohlson models show considerably lower classification ability, thereby reinforcing the conclusion of a methodological “draw” between the two developed models and their clear superiority over traditional scoring approaches.
The results reported in Table 29 indicate a very high classification performance of both discriminant analysis and logistic regression as measured by the area under the ROC curve. For the test sample, the AUC reaches 0.925 for discriminant analysis and 0.934 for logistic regression, which, according to the commonly accepted interpretation scale, corresponds to outstanding predictive performance. Similarly, the training sample exhibits even higher AUC values, equal to 0.957 for discriminant analysis and 0.971 for logistic regression, confirming excellent model discrimination between prosperous and non-prosperous enterprises.
Table 29.
Area under ROC curve.
In contrast, the Altman and Ohlson models achieve noticeably lower AUC values. For the test sample, the AUC equals 0.785 for the Altman model, which corresponds to good but not outstanding discrimination ability, while the Ohlson model reaches only 0.619, indicating weak to moderate predictive performance and limited ability to distinguish between the two groups. A similar pattern is observed for the training sample, where the Altman model attains an AUC of 0.795 and the Ohlson model 0.675, both remaining substantially below the values obtained for discriminant analysis and logistic regression.
All reported AUC values are statistically significant at the 0.1% significance level (p-value < 0.0001), indicating that all models perform significantly better than a random classifier. However, the relatively low standard errors and narrow confidence intervals above 0.9 are observed only for discriminant analysis and logistic regression, confirming the stability and robustness of these models. In the case of the Altman and especially the Ohlson model, the confidence intervals are wider and remain well below the outstanding performance threshold, which further supports their lower discriminatory power in the analyzed NACE I sample.
The ROC analysis confirms the superior classification ability of discriminant analysis and logistic regression, while the Altman model provides only moderate predictive performance and the Ohlson model demonstrates limited discriminatory capacity.
Figure 1 and Figure 2 illustrate the comparison of the ROC curves generated by all models for the test and training samples.
Figure 1.
ROC curves for test sample.
Figure 2.
ROC curve for training sample.
Our results highlight that while DA and LR produce comparable overall classification performance, they differ in the emphasis placed on specific predictors. DA captures operational and working-capital dynamics more strongly, whereas LR is more sensitive to profitability and liquidity ratios. This distinction is practically meaningful for managers in the Accommodation and Food Service Industry, where cash-flow sensitivity, seasonality, and short-term operational pressures are critical.
From a theoretical perspective, the study demonstrates that classical statistical models remain informative and interpretable when applied to a homogeneous sector, challenging the view that machine-learning approaches are universally superior. The consistent identification of core predictors across methods further strengthens confidence in their structural relevance.
Therefore, the novelty of this work lies not only in comparing DA and LR in terms of predictive performance, but also in highlighting method-dependent differences in predictor sensitivity, enhancing interpretability, and providing actionable early-warning insights tailored to the B9 hospitality sector.
LDA shows limited robustness to covariance matrix violations, but robust variants can substantially improve classification performance without significant efficiency loss. The sources reveal mixed findings. Classical LDA is sensitive to heteroscedasticity (unequal covariance matrices) [41,42]. However, when violations are moderate, LDA results remain reasonably close to more flexible methods [43]. LR serves as an appropriate robustness check for LDA under moderate assumption violations.
Although logistic regression achieved slightly higher sensitivity, specificity, and overall accuracy than discriminant analysis, the differences in classification performance were marginal. Given the high predictive power of both models and the substantial overlap in correctly classified observations, these improvements do not indicate structural superiority of one method over the other but rather confirm the robustness of both approaches. From a practical perspective, the relevance of these differences depends primarily on the relative cost of misclassification. In early-warning settings—particularly in the Accommodation and Food Service Industry—even small improvements in sensitivity (i.e., detection of distressed firms) may be economically meaningful. However, when performance differences remain narrow, model interpretability, stability, and implementation simplicity become equally important selection criteria. Overall, the results suggest comparable and practically reliable performance of both methods, with logistic regression providing only a marginal advantage.
The sets of early-warning predictors identified by both discriminant analysis and logistic regression show a high degree of consistency with the broader bankruptcy-prediction literature for Central and Eastern Europe and, in particular, with recent evidence for Bucharest Nine countries reported by Durana et al. [7]. Across both modeling approaches, indebtedness-related indicators dominate the prediction structure, confirming the central role of capital structure imbalance in the emergence of corporate distress.
Three predictors—total indebtedness, financial leverage, and return on costs—are common to both models, which strengthens their interpretation as robust and method-independent early-warning signals. This finding aligns closely with Durana et al. [7], who repeatedly identify indebtedness ratios and cost-efficiency measures as key drivers of financial distress across different phases of the economic cycle in B9 countries. The persistence of these variables across methods suggests that excessive reliance on debt financing combined with declining cost efficiency constitutes a structural vulnerability rather than a model-specific artifact.
Beyond these shared predictors, discriminant analysis places stronger emphasis on operational efficiency and working-capital dynamics, as reflected by the inclusion of inventory turnover and the credit period ratio. These variables capture short-term liquidity pressure and operational rigidity, which are particularly relevant in the Accommodation and Food Service Industry, where seasonality, demand volatility, and supplier dependence amplify cash-flow sensitivity. This interpretation is consistent with the discussion in Durana et al. [7], who argue that activity and liquidity indicators become especially informative in sectors exposed to cyclical shocks.
In contrast, logistic regression highlights profitability and liquidity ratios more prominently, including the quick ratio, ROA, and ROS. This suggests that the probabilistic framework of logistic regression is more sensitive to marginal deterioration in profitability and immediate liquidity buffers. Such results are again in line with Durana et al. [7], who report that profitability indicators retain strong explanatory power even when more advanced selection techniques are applied, particularly in post-crisis and growth phases.
Our findings are largely consistent with the conclusions of Labosova et al. [44], who emphasize that key financial indicators remain stable and informative predictors of financial distress across different economic conditions.
While their study is centered on SMEs across multiple economic periods in Slovakia and prioritizes model stability, our research narrows the focus to the Accommodation and Food Service Industry across B9 countries, thereby providing sector-specific evidence that complements their more general conclusions.
In line with Labosova et al. [44], our results confirm that indebtedness-related indicators and profitability measures consistently play a dominant role in distinguishing distressed from non-distressed companies. In our case, total indebtedness, financial leverage, and ROC emerged as robust predictors in both discriminant analysis and logistic regression. This aligns with their conclusion that debt burden and profitability remain critical determinants of distress regardless of economic phase, supporting the notion of structural persistence in core financial risk drivers.
However, an important point of divergence lies in methodological interpretation. While the referenced article concludes that non-linear machine learning methods (CHAID, CART, ANN) outperform classical statistical approaches in terms of predictive accuracy, our study demonstrates that classical methods—discriminant analysis and logistic regression—can still achieve very high predictive performance when applied to a homogeneous sector. This suggests that the weaker performance of discriminant analysis observed by Labosova et al. [44] may be partly attributable to cross-sector heterogeneity and macroeconomic variation rather than an inherent inferiority of the method itself.
Moreover, whereas Labosova et al. [44] stress model robustness across economic regimes, our conclusions highlight managerial interpretability and early-warning usability as central advantages of classical models. The clear sign and magnitude of coefficients in both DA and LR allow for direct translation into actionable early-warning signals, which is particularly valuable in the Accommodation and Food Service Industry, where managers often require transparent and easily interpretable tools rather than black-box solutions.
4. Conclusions
This study aimed to evaluate and compare the predictive performance of discriminant analysis and logistic regression for bankruptcy prediction while identifying key bankruptcy predictors for companies in the Accommodation and Food Service Industry across B9 countries. The results demonstrate that both methods achieve consistently high predictive accuracy on the test sample, with all major performance metrics exceeding 0.92, and no clear dominance of one approach over the other. The comparative analysis therefore results in a methodological “draw,” confirming that classical statistical methods remain highly effective despite the growing prevalence of machine-learning techniques.
Across both modeling approaches, a stable core of early-warning indicators was identified, particularly total indebtedness, financial leverage, and return on costs. Additional method-specific predictors further highlight the importance of liquidity, profitability, and operational efficiency in explaining financial distress in hospitality firms. These findings confirm that bankruptcy risk in the Accommodation and Food Service Industry is driven by structural financial vulnerabilities rather than short-term anomalies.
4.1. Practical Implications
From a practical perspective, the results provide managers, analysts, and policymakers with transparent and interpretable early-warning tools that can be readily implemented using standard financial statements. Monitoring indebtedness, cost efficiency, liquidity, and profitability indicators allows managers in the hospitality sector to detect emerging financial distress at an early stage and to adjust financing structures, pricing strategies, and working-capital management accordingly. The simplicity and interpretability of the applied models enhance their usability for decision-making.
4.2. Theoretical Implications
Theoretically, this study contributes to the bankruptcy prediction literature by demonstrating that classical statistical methods retain strong explanatory and predictive power when applied to a clearly defined sectoral and regional context. The convergence of predictors across discriminant analysis and logistic regression supports the robustness of core financial distress drivers and reinforces existing evidence from Central and Eastern Europe. Moreover, the sector-specific focus extends prior multi-industry research by highlighting how the relative importance of predictors may vary across industries while preserving a common structural foundation.
4.3. Limitations of the Study
Several limitations should be acknowledged. First, the analysis is based on financial statement data for a limited time horizon, which does not allow for explicit modeling of dynamic distress trajectories or regime changes across different phases of the economic cycle. Second, although the sample covers multiple B9 countries, institutional and regulatory differences across countries are not explicitly modeled. Third, the study relies exclusively on accounting-based indicators, excluding qualitative, macroeconomic, and behavioral variables that may further improve predictive performance. Finally, the comparison is restricted to two classical methods and does not include advanced machine-learning and AI techniques.
4.4. Future Research Directions
Future research could examine the long-term stability of the proposed models across different macroeconomic regimes, including pre-crisis periods. It could also extend the present study by incorporating longitudinal and panel-based approaches to better capture the dynamic evolution of financial distress over time. The integration of macroeconomic indicators, institutional factors, and non-financial variables may further enhance early-warning capabilities. Additionally, comparing classical statistical models with modern machine-learning and hybrid approaches within the same sectoral framework would allow for assessing trade-offs between predictive accuracy and interpretability. Finally, expanding the analysis to other tourism-related industries beyond NACE I would enable broader generalization of the findings.
Author Contributions
Conceptualization, S.V.; methodology, P.D. and K.K.; software, P.D.; validation, V.L.; formal analysis, S.V.; investigation, K.K.; resources, V.L.; data curation, K.K.; writing—original draft preparation, S.V.; writing—review and editing, K.K. and V.L.; visualization, S.V.; supervision, K.K. and V.L.; project administration, P.D.; funding acquisition, P.D. All authors have read and agreed to the published version of the manuscript.
Funding
This research received no external funding.
Data Availability Statement
The original contributions presented in this study are included in the article. Further inquiries can be directed to the corresponding author.
Acknowledgments
This research was financially supported by the Slovak Research and Development Agency Grant VEGA 1/0494/24: Metamorphoses and causalities of indebtedness, liquidity and solvency of companies in the context of the global environment.
Conflicts of Interest
The authors declare no conflicts of interest.
References
- Prusak, B. Review of research into enterprise bankruptcy prediction in selected Central and Eastern European countries. Int. J. Financ. Stud. 2018, 6, 60. [Google Scholar] [CrossRef] [Scilit]
- Wieprow, J.; Gawlik, A. The use of discriminant analysis to assess the risk of bankruptcy of enterprises in crisis conditions using the example of the tourism sector in Poland. Risks 2021, 9, 78. [Google Scholar] [CrossRef] [Scilit]
- Heryan, T. Eurasian Business Perspectives, 1st ed.; Springer: Cham, Switzerland, 2018; pp. 39–48. [Google Scholar] [CrossRef] [Scilit]
- Prusak, B.; Karas, M. Bankruptcy prediction in Visegrad Group countries. Pol. J. Manag. Stud. 2024, 30, 268–288. [Google Scholar] [CrossRef] [Scilit]
- Baltes, N.; Pavel, R.M. Assessment of the insolvency risk in companies listed on the Bucharest Stock Exchange. Stud. Univ. “Vasile Goldis” Arad Econ. Ser. 2019, 29, 58–71. [Google Scholar] [CrossRef] [Scilit]
- Rujescu, C.; Rujescu, C.I.; Giurca, D.; Giurca, A. Survival probability of tourist accommodation establishments in Romania in relation to the action of some relevant factors. Sustainability 2024, 16, 6344. [Google Scholar] [CrossRef] [Scilit]
- Durana, P.; Poliak, M.; Kovalova, E.; Blazek, R. Prediction models reloaded: Advanced insights for SMEs in the Bucharest Nine countries. Oeconomia Copernic. 2025, 16, 689–760. [Google Scholar] [CrossRef] [Scilit]
- Gigova, V.; Valeva, K.; Nikolova, N. Application of business crisis forecasting models in Bulgaria. In Proceedings of the IOP Conference Series: Materials Science and Engineering, Plovdiv, Bulgaria, 16–18 May 2019. [Google Scholar] [CrossRef] [Scilit]
- Gajdosikova, D.; Valaskova, K.; Lopatka, A.; Lazaroiu, G. Corporate debt dynamics: Sectoral clustering analysis using NACE classification in Slovakia. J. Bus. Sect. 2024, 2, 32–46. [Google Scholar] [CrossRef] [Scilit]
- Czuczor, K.; Kozma, G.; Dorogi, Z.; Li, T.; Radics, Z. The comprehensive analysis of the network of superstructure based on territorial characteristics of accommodation and food and beverage service providers considering the financial crisis and COVID-19: The case of Bihor County, Romania. Sustainability 2023, 15, 6759. [Google Scholar] [CrossRef] [Scilit]
- Bacik, R.; Fedorko, R.; Gavurova, B.; Ivankova, V.; Rigelsky, M. Differences in financial performance between various categories of hotels in the Visegrad Group countries. J. Int. Stud. 2020, 13, 279–290. [Google Scholar] [CrossRef] [Scilit]
- Gu, Z.; Gao, L. A multivariate model for predicting business failures of hospitality firms. Tour. Hosp. Res. 2000, 2, 37–49. [Google Scholar] [CrossRef] [Scilit]
- Bednarova, J.; Sotakova, K. Bankruptcy prediction models in Prešov region of the Slovak Republic. In Proceedings of the EDAMBA 2022, Bratislava, Slovakia, 16 September 2022; pp. 52–63. [Google Scholar] [CrossRef] [Scilit]
- Elexa, L.; Hvolkova, L.; Knapkova, M. Anticrisis management: Warning signals before failure. Mark. Manag. Innov. 2019, 3, 98–111. [Google Scholar] [CrossRef] [Scilit]
- Wentk, A. Impact of economic crises on the scale of bankruptcy and restructuring of enterprises in Poland. Sci. Pap. Silesian Univ. Technol. Organ. Manag. Ser. 2025, 227, 548–559. [Google Scholar] [CrossRef] [Scilit]
- Maliszewska, M.; Karlikowska, B.; Prachowski, J. Analysis of corporate insolvency trends in Poland between 2021 and 2024. Eur. Res. Stud. J. 2025, 28, 1050–1071. [Google Scholar] [CrossRef] [Scilit]
- Fenyves, V.; Dajnoki, K.; Mate, D.; Baji-Gal, K. Examination of the solvency of enterprises dealing with accommodation service providing in the Northern Great Plain Region. SEA Pract. Appl. Sci. 2016, 4, 197–203. [Google Scholar]
- Droj, L.; Ban, O.I.; Droj, G. The Changing Financial Landscape: Financial Performance Analysis of Real and Banking Sectors in Europe; Springer: Cham, Switzerland, 2021; pp. 81–95. [Google Scholar] [CrossRef] [Scilit]
- Vrtana, D.; Duricova, L. Generational and economic differences in the effectiveness of product placement: A predictive approach using CART analysis. Adm. Sci. 2026, 16, 61. [Google Scholar] [CrossRef] [Scilit]
- Mazanec, J.; Filip, M. Predictive model as screening tool for early warning of corporate insolvency in risk management: Case study from Slovak Republic. Systems 2025, 13, 1014. [Google Scholar] [CrossRef] [Scilit]
- Altman, E.I.; Balzano, M.; Giannozzi, A.; Srhoj, S. Revisiting SME default predictors: The Omega Score. J. Small Bus. Manag. 2023, 61, 2383–2417. [Google Scholar] [CrossRef] [Scilit]
- Barboza, F.; Kimura, H.; Altman, E. Machine learning models and bankruptcy prediction. Expert Syst. Appl. 2017, 83, 405–417. [Google Scholar] [CrossRef] [Scilit]
- Valaskova, K.; Gajdosikova, D.; Belas, J. Bankruptcy prediction in the postpandemic period: A case study of Visegrad Group countries. Oeconomia Copernic. 2023, 14, 253–293. [Google Scholar] [CrossRef] [Scilit]
- Gajdosikova, D.; Chatterjee, S.; Kovalova, E. The impact of significant macroeconomic turbulence on corporate debt levels: A case study of Visegrad Group countries during COVID-19 pandemic. Equilib. Q. J. Econ. Econ. Policy 2025, 20, 803–848. [Google Scholar] [CrossRef] [Scilit]
- Kliestik, T.; Valaskova, K.; Kliestikova, J.; Kovacova, M.; Svabova, L. Prediction of Financial Health of Business Entities in Transition Economies, 1st ed.; EDIS: Žilina, Slovakia, 2019. [Google Scholar]
- Kral, P.; Kanderova, M.; Kascakova, A.; Nedelova, G.; Valencakova, V. Multidimensional Statistical Methods with a Focus on Solving Problems of Economic Practice, 1st ed.; Matej Bel University: Banská Bystrica, Slovakia, 2009. [Google Scholar]
- Gajdosikova, D.; Valaskova, K.; Kliestik, T. Predicting bankruptcy and ensuring financial sustainability: A focus on Visegrad economies. J. Int. Stud. 2025, 18, 122–143. [Google Scholar] [CrossRef] [Scilit]
- Horvathova, J.; Mokrisova, M. Integrated performance measurement system for Slovak heating industry: A balanced scorecard approach. Probl. Perspect. Manag. 2023, 21, 393–407. [Google Scholar] [CrossRef] [Scilit]
- Braunsberger, C.; Aschauer, E. Corporate failure prediction: A literature review of Altman Z-score and machine learning models within a technology adoption framework. J. Risk Financ. Manag. 2025, 18, 465. [Google Scholar] [CrossRef] [Scilit]
- Sánchez-Almeyda, C.; González-Bueno, J.; Koval, V.; Reyes-Maldonado, N.; Kryshtal, H.; Zharikova, O. Predicting financial distress in the food production sector: A dual-model approach using Z-score and O-score methods. Discov. Sustain. 2025, 6, 731. [Google Scholar] [CrossRef] [Scilit]
- Altman, E.I.; Iwanicz-Drozdowska, M.; Laitinen, E.K.; Suvas, A. Financial distress prediction in an international context: A review and empirical analysis of Altman’s Z-score model. J. Int. Financ. Manag. Account. 2017, 28, 131–171. [Google Scholar] [CrossRef] [Scilit]
- Dolinšek, T.; Kovač, T. Application of the Altman model for the prediction of financial distress in the case of Slovenian companies. Organizacija 2024, 57, 115–126. [Google Scholar] [CrossRef] [Scilit]
- Spulbar, C.; Cinciulescu, D.; Ene, C.C.; Spulbar, L.F. Altman Z-score modeling and financial risk analysis: An empirical study on companies listed on the Bucharest Stock Exchange. Stud. Bus. Econ. 2025, 20, 314–340. [Google Scholar] [CrossRef] [Scilit]
- Saputro, A.F.; Mubarrok, U.S. Financial distress analysis using the Altman Z-score and Ohlson methods on companies listed on the Indonesian Sharia Stock Index for 2020–2023. In Proceedings of the 3rd International Conference on Islamic Economics and Business (ICIEB), Yogyakarta, Indonesia, 30–31 July 2024. [Google Scholar]
- Bayyinah, A.N.; Helena, P.Z. Bankruptcy prediction analysis of life insurance companies using Altman Z-score dan Ohlson O-score methods. Int. J. Glob. Oper. Res. 2024, 5, 256–262. [Google Scholar] [CrossRef] [Scilit]
- Mazzuccato, V. Bankruptcy Prediction Models: A Comparison Between Altman Z-Score and Ohlson O-Score Models in the Italian Pharmaceutical Manufacturing Industry. Master’s Thesis, Università Ca’ Foscari Venezia, Venezia, Italy, 2024. [Google Scholar]
- Durica, M.; Frnda, J.; Svabova, L. Artificial neural network and decision tree-based modelling of non-prosperity of companies. Equilib. Q. J. Econ. Econ. Policy 2023, 18, 1105–1131. [Google Scholar] [CrossRef] [Scilit]
- Michalkova, L.; Ponisciakova, O. Bankruptcy prediction, financial distress and corporate life cycle: Case study of Central European enterprises. Adm. Sci. 2025, 15, 63. [Google Scholar] [CrossRef] [Scilit]
- Li, Z.; Crook, J.; Andreeva, G.; Tang, Y. Predicting the risk of financial distress using corporate governance measures. Pac.-Basin Financ. J. 2021, 68, 101334. [Google Scholar] [CrossRef] [Scilit]
- Veganzones, D.; Séverin, E.; Chlibi, S. Influence of earnings management on forecasting corporate failure. Int. J. Forecast. 2023, 39, 123–143. [Google Scholar] [CrossRef] [Scilit]
- Yahaya, S.S.S.; Lim, Y.F.; Ali, H.; Omar, Z. Robust linear discriminant analysis. J. Math. Stat. 2016, 12, 312–316. [Google Scholar] [CrossRef] [Scilit]
- Lim, Y.F.; Yahaya, S.S.S.; Ali, H. Robust linear discriminant analysis with highest breakdown point estimator. J. Telecommun. Electron. Comput. Eng. 2018, 10, 7–12. [Google Scholar]
- Pohar, M.; Blas, M.; Turk, S. Comparison of logistic regression and linear discriminant analysis: A simulation study. Metodol. Zv. 2004, 1, 143–161. [Google Scholar] [CrossRef] [Scilit]
- Labosova, V.; Duricova, L.; Durana, P. One model fits all? Evaluating bankruptcy prediction across different economic periods. Economies 2025, 13, 361. [Google Scholar] [CrossRef] [Scilit]
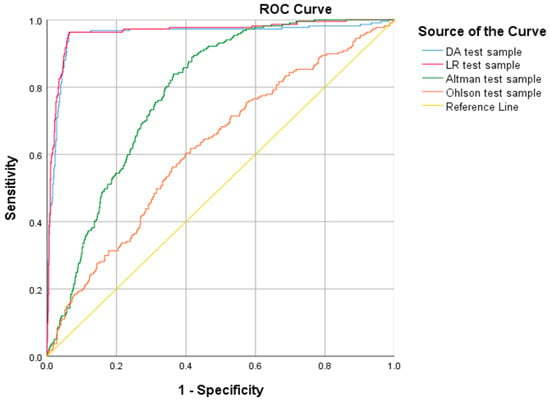
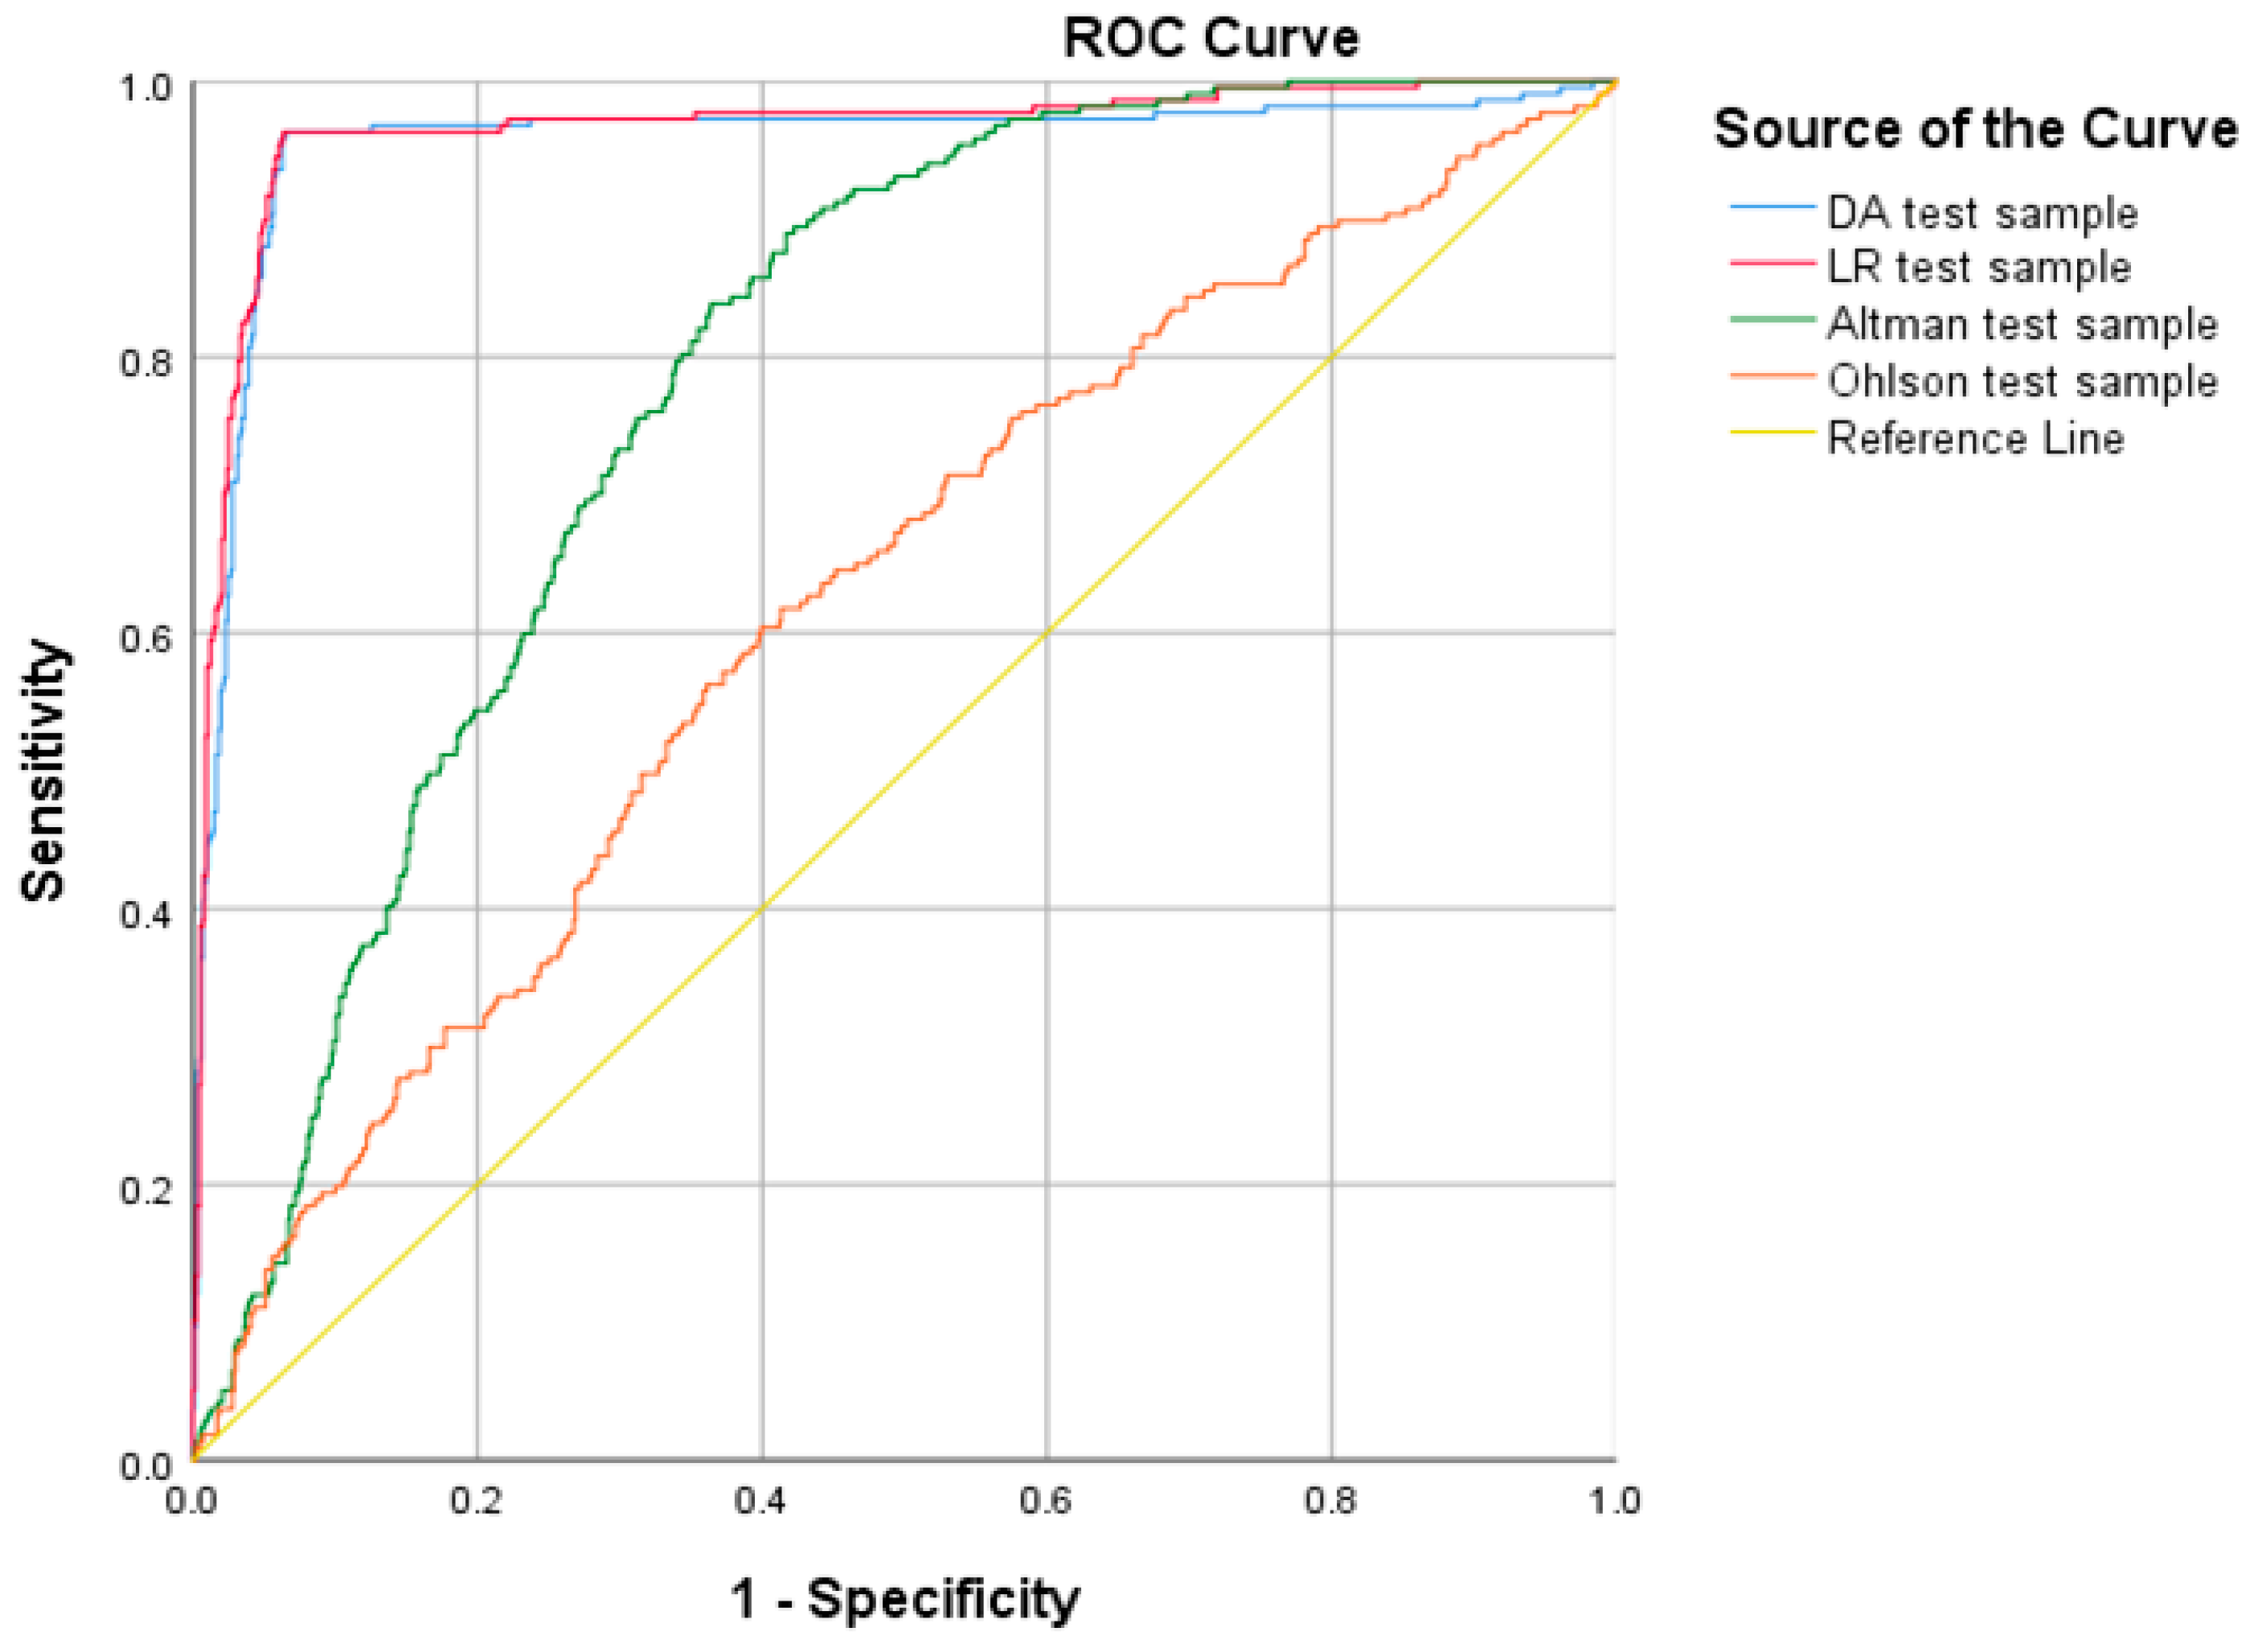
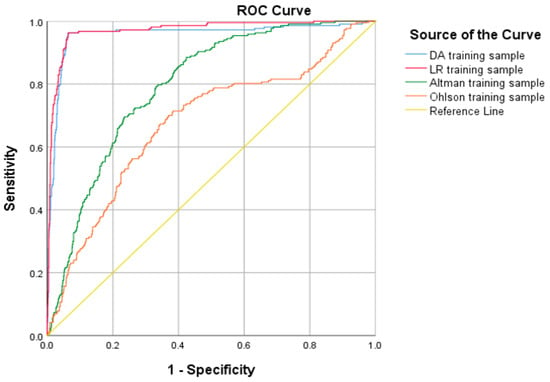
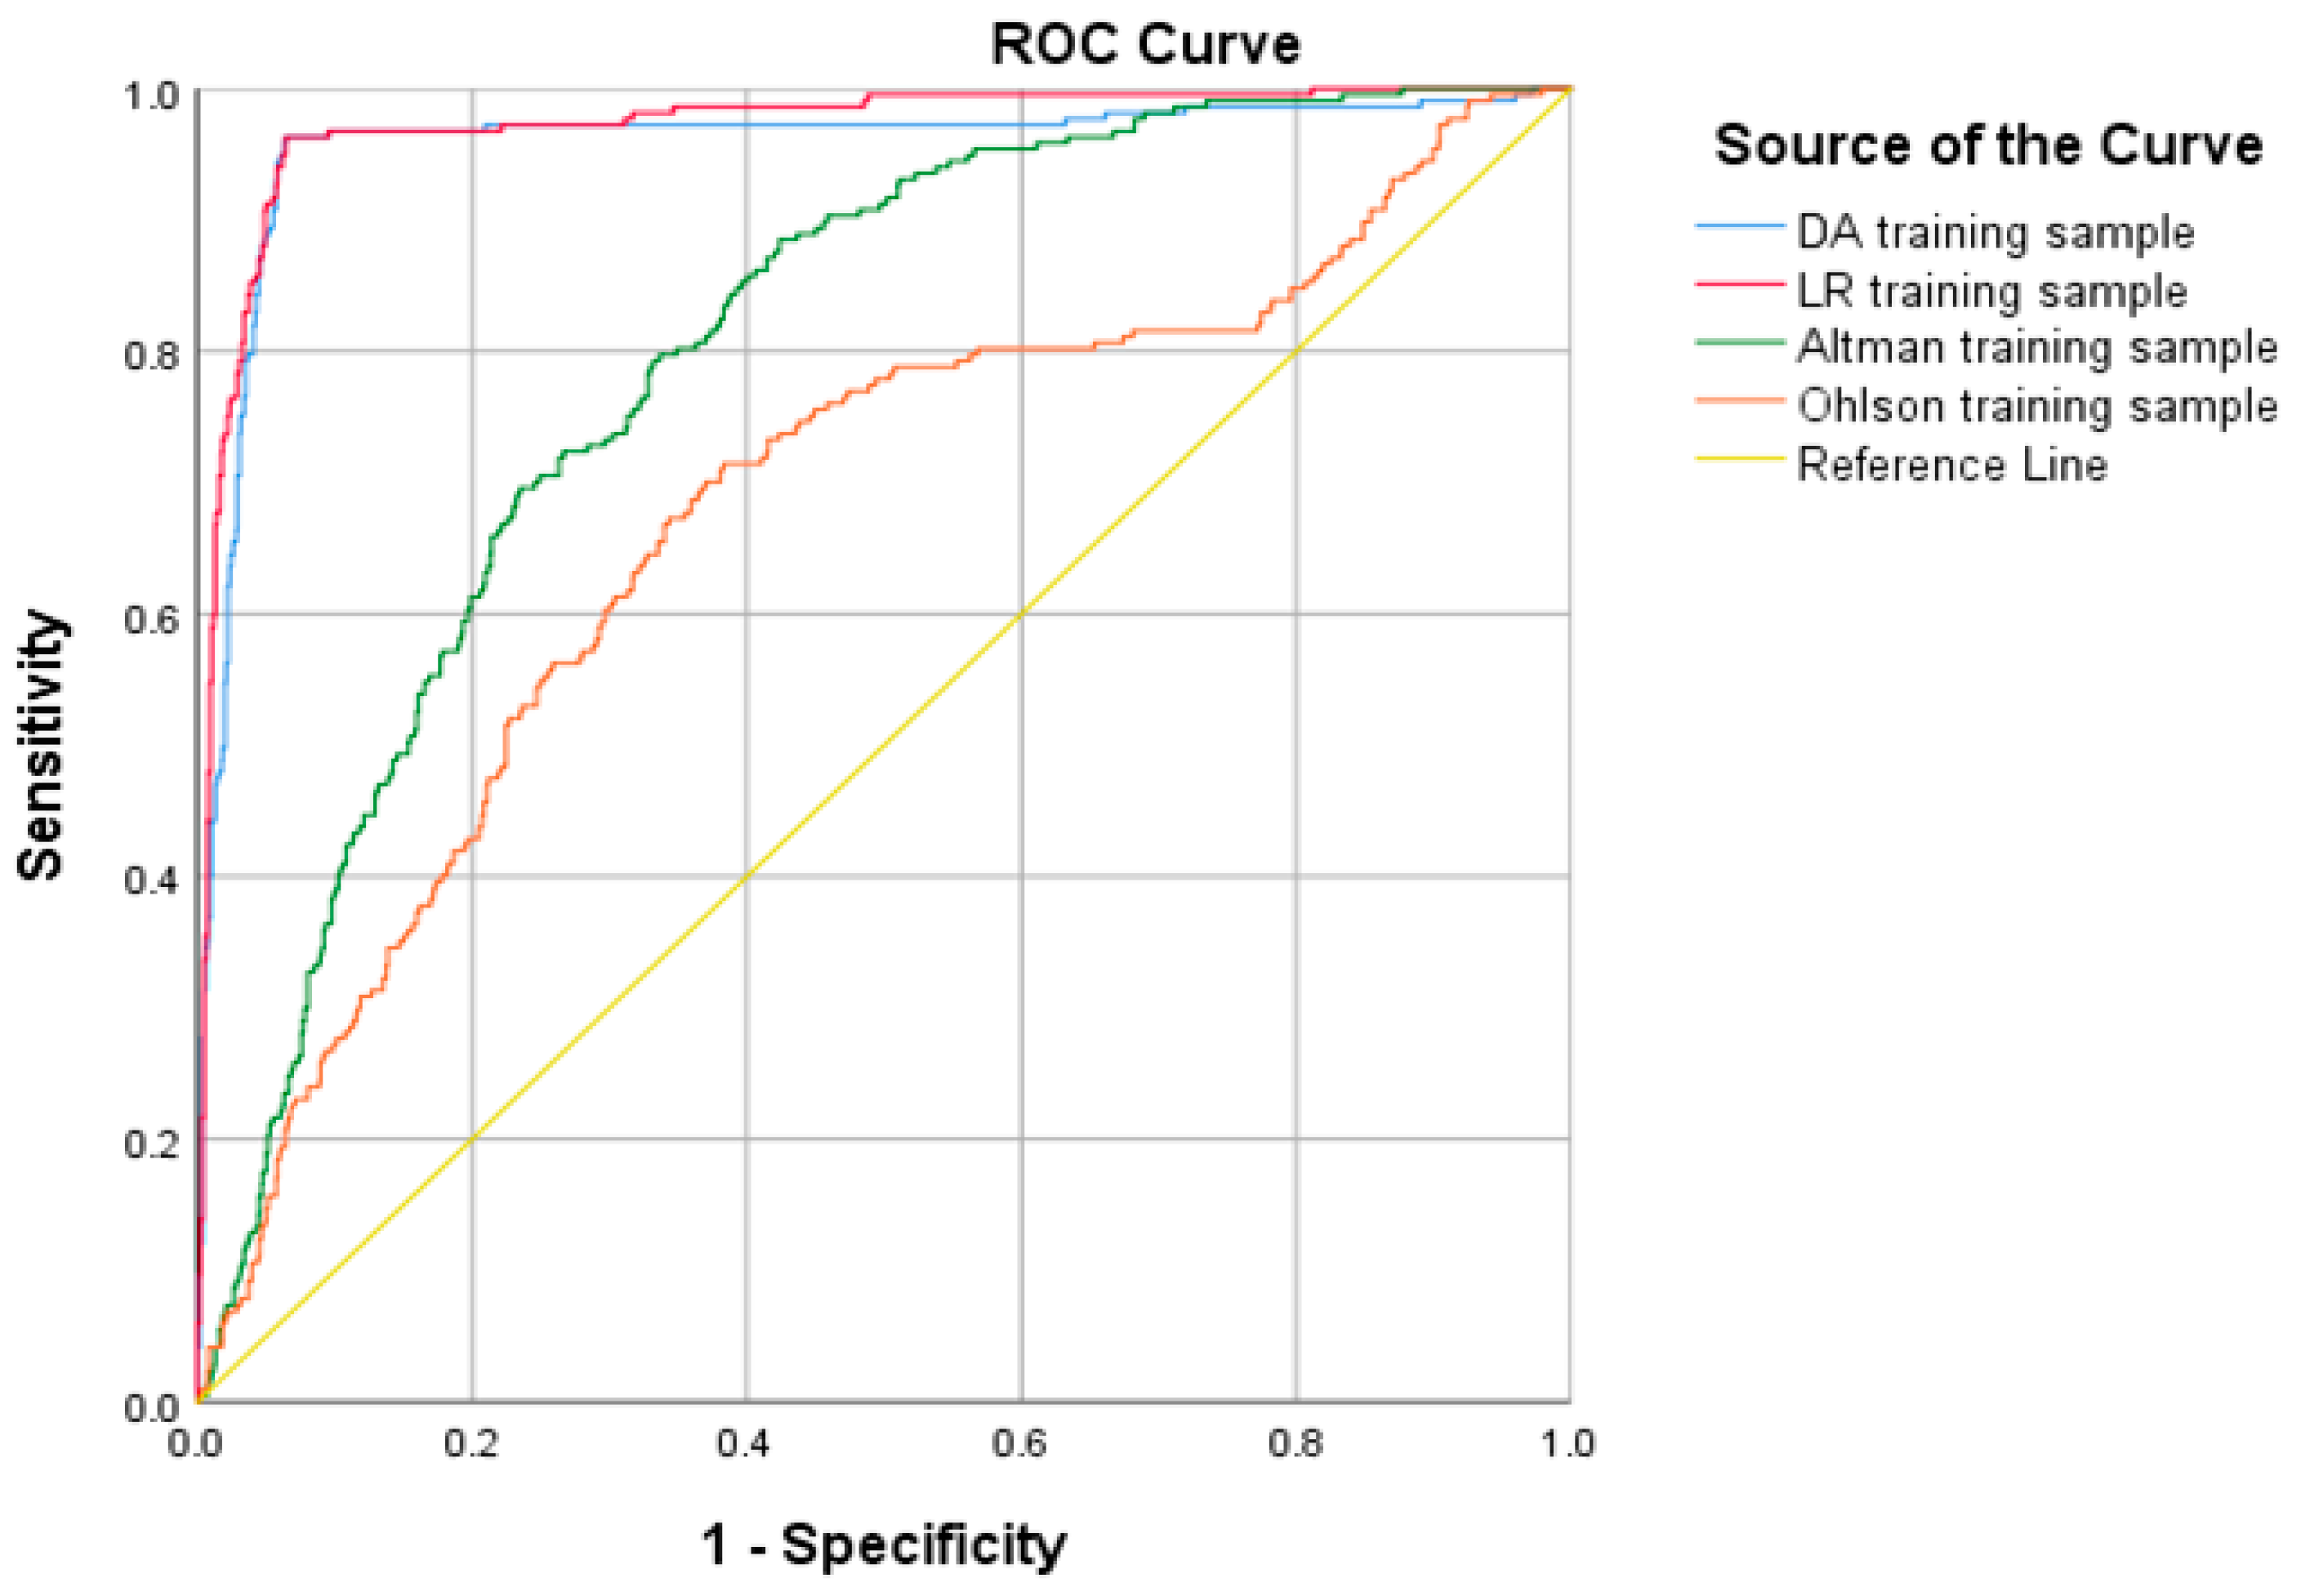

Disclaimer/Publisher’s Note: The statements, opinions and data contained in all publications are solely those of the individual author(s) and contributor(s) and not of MDPI and/or the editor(s). MDPI and/or the editor(s) disclaim responsibility for any injury to people or property resulting from any ideas, methods, instructions or products referred to in the content. |
© 2026 by the authors. Licensee MDPI, Basel, Switzerland. This article is an open access article distributed under the terms and conditions of the Creative Commons Attribution (CC BY) license.