Article

One-Year Follow-Up of Two Intensive Supplemental Reading and Mathematics Programs in Swedish Elementary School


by
Hanna Lindström-Sandahl
1,*,
Henrik Danielsson
2,
Åsa Elwér
1,
Joakim Samuelsson
1 and
Stefan Samuelsson
1
1
Department of Behavioural Sciences and Learning, Linköping University, 581 83 Linköping, Sweden
2
The Swedish Institute for Disability Research, Linköping University, 581 83 Linköping, Sweden
*
Author to whom correspondence should be addressed.
Educ. Sci. 2025, 15(12), 1678; https://doi.org/10.3390/educsci15121678
Submission received: 31 August 2025 / Revised: 6 December 2025 / Accepted: 9 December 2025 / Published: 12 December 2025
(This article belongs to the Special Issue Special and Inclusive Education: Challenges, Policy and Practice)

Abstract

This study presents the one-year follow-up in grade 3 of two randomized controlled interventions, addressing phonics and numeracy targeting children at-risk for early reading or mathematics difficulties. The participants (n = 130) had been part of two intervention studies including 21 Swedish elementary schools. Results show that the post-test advantage of the intervention groups had faded for most outcome measures. A significant difference between groups sustained only for conceptual knowledge in the mathematics intervention group and for the speeded reading test in the reading intervention group. These results raise questions about the integration of rigorous interventions into mainstream education. Furthermore, the study pinpoints the importance of longitudinal intervention research and conditions to make special education interventions sustainable.

1. Introduction

Early school-based interventions have consistently demonstrated immediate benefits; however, questions remain regarding the long-term sustainability of these effects. Short-term improvements in reading and numeracy skills are often observed in early elementary grades, even following relatively brief interventions (Dietrichson et al., 2021; Gersten et al., 2020; Hall et al., 2022; Wanzek et al., 2016). However, these gains frequently diminish over time, and few follow-up studies extend their evaluations to one-year post-intervention (Bailey, 2019; Dietrichson et al., 2021; Gersten et al., 2020; Neitzel et al., 2021; Williams et al., 2022). Given this situation, the current study advances the restricted timeframe of intervention studies and addresses the sustained effects of two second grade randomized controlled trial (RCTs) studies conducted in second grade, targeting children at risk for early reading and mathematics difficulties (Lindström-Sandahl et al., 2023; Lindström-Sandahl et al., 2024). Both interventions were designed to incorporate known factors associated with successful reading and mathematics outcomes. The findings raise critical questions about the enduring impact of early interventions and implications for both researchers and practitioners.

1.1. Follow-Up in Longitudinal Special Education Intervention Research

Conducting intervention research in special education is both time-intensive and resource-demanding, which explains why relatively few studies report data beyond immediate post-test measures. Extending school-based interventions to include follow-up assessments presents significant logistical and administrative challenges—particularly when implementing a randomized controlled trial, and few such studies have a longitudinal design (Daniel et al., 2021; Dietrichson et al., 2021). When follow-up data are available, the timing varies considerably. Many studies assess outcomes after less than six months post-intervention, limiting conclusions regarding the sustainability of intervention effects (Powell et al., 2022; Suggate, 2016; Xin & Jitendra, 1999). A notable example is the meta-analysis by Dietrichson et al. (2021), which categorized studies assessing effects more than three months after the intervention as “long-term.” In addition, only 10% of the 205 included studies reported follow-up data between 4 and 12 months, and these were predominantly focused on reading outcomes. Rare exceptions extend follow-up periods up to a decade, but most are limited to one year (e.g., Blachman et al., 2004, 2014; Watts et al., 2019). This scarcity of long-term data restricts our understanding of the enduring effects of early educational interventions (Gersten et al., 2020). From a Scandinavian perspective—where RCT-based educational intervention research is still limited but growing (Pontoppidan et al., 2018)—this study offers a meaningful contribution to the evidence base on the long-term effectiveness of early reading and mathematics interventions.

1.2. Long-Term Early Reading and Mathematics Intervention Effects

Experimental and quasi-experimental intervention studies aimed at students with or at risk for reading difficulties present mixed long-term results, with some showcasing sustained effects after a year. In a meta-analysis of reading intervention effects, Suggate (2016) reported a radical decline in mean effect size of phonics interventions from 0.29 (Cohen’s d) at post-test to 0.07 (d) at one-year follow-up. Blachman et al. (2004) evaluated outcomes of a phonics and fluency intervention in second and third grade. Effect sizes at post-test were 1.31 (d) for word recognition, 0.55 (d) for reading comprehension and maintained at 1.05 and 0.24 (d) at the one-year follow-up. In a Swedish phonics-oriented intervention for third graders, Wolff (2011) reported significant effects for reading comprehension 0.33 (d), and reading speed 0.13 (d), one year post-intervention compared to immediate post-test effects of 0.41 and 0.15 (d). In addition, a lasting impact on reading comprehension was shown in a meta-analysis of reading interventions targeting foundational skills in grades K-3 (Denton et al., 2022), with a follow-up mean ES of 0.29 (Hedge’s g) compared to 0.39 (g) at post-test. No specific details were, however, given on the timepoint of follow-up measurement, instead referred to as weeks and months after the intervention (Denton et al., 2022). While certain phonics interventions demonstrate lasting significant effects, the overall consistency of these is varied, and the evaluation of reading comprehension interventions is complicated by the absence of clear follow-up timelines.
The post-test effects observed in RCT mathematics intervention studies also tend to diminish over time. For instance, Bailey et al. (2020) conducted a follow-up on a 16-week explicit arithmetic intervention in first grade and found no statistically significant effects on any arithmetic or numeracy measures one year after the intervention. Initial post-test effect sizes ranged from 0.24 to 0.42 (Cohen’s d) for mathematics facts and computation, but these declined to effects of 0.01 to 0.08 at follow-up. A similar decline was reported by Hassler Hallstedt et al. (2018), who evaluated a 20-week tablet-based basic arithmetic intervention in second grade. While post-test effect sizes ranged from 0.13 to 0.67 (d), the one-year follow-up revealed non-significant results for calculation, with mean effect sizes for addition and subtraction reduced to between 0.02 and 0.13 (d). Furthermore, Powell et al. (2022) documented fading effects of an explicit mathematics word problem-solving intervention for third graders. At a follow-up conducted 6 to 12 months post-intervention, the effects had declined to 0.31–0.43, compared to immediate post-test values of 2.44–2.66, and were partly non-significant. Again, the immediate outcomes of these interventions appear promising, while sustaining the gains achieved remains a considerable challenge.

1.3. Designing for Sustainable Special Education Intervention Effects

Because of the long-term academic consequences of comprised reading and mathematics skills (e.g., Foster & Miller, 2007; Vukovic & Siegel, 2010), addressing fade-out factors and planning for long term follow-up is essential in designing sustainable intervention programs for at-risk students (Hulme et al., 2025; Schneider & Bradford, 2020). Special education intervention researchers need to consider both the reasons for fading effects and how to prevent them. In longitudinal studies of reading and mathematics intervention, fade-out has been interpreted in diverse ways (Bailey, 2019; Bailey et al., 2017; Suggate, 2016). Besides attrition due to teacher shift and student mobility, which is a potential problem in long-term follow-ups (Schneider & Bradford, 2020; Vadasy et al., 2008), declining effects can be attributed to several factors.
First, the individual perspective ascribes fading to cognitive processing issues such as forgetting content practiced intensively during the intervention (Kang et al., 2019), alternatively, that cognitive resources spent on repetition may hinder the integration of new skills (see Bailey et al., 2020, for discussion).
Second, the environmental perspective links fade-out to a lack of continued educational support following the intervention and the combined effect of individual and environmental factors may cause individual children to revert to their predicted learning trajectory post-intervention, even if gains were made compared to controls (Bailey, 2019; Bailey et al., 2016).
A third perspective highlights how children in control groups may catch up to their counterparts shortly after the intervention attenuating group differences, as the basic content taught is also part of standard classroom instruction (Bailey et al., 2020; Lemons et al., 2014; Suggate, 2016). In addition, extra attention might be given to control students because of schools taking notice of their academic needs (Hulme et al., 2025).
Fourth, test scaling in follow-up measuring may not accurately reflect the magnitude of sustained effects, potentially masking true skill changes over time (Bailey, 2019). Improvement specific to certain timeframes, grades, and curricula may eventually lose relevance (Schneider & Bradford, 2020). Seemingly, declining post-intervention effects may have multifaceted causes.
Bailey et al. (2017), to prevent fading, proposed constructing interventions that target fundamental skills, which are possible to manipulate by intervening and that do not develop easily without intervention. It is argued these three principles are essential for lasting impact of cognitive skills interventions.
While some pre-test–post-test design studies overlook post-intervention educational support, supplementary practice has been shown to bolster skill retention. For example, short practicing sequences after finishing one-to-one interventions help students sustain reading skills (P. M. Nelson et al., 2021). However, response to training may depend on individual students’ level of competency pre-intervention (Peng et al., 2020), where weak (or resistant) responders seem to benefit less from more of the same sessions (Wanzek & Vaughn, 2008). For example, students with the strongest pre-intervention reading may benefit most from training and be able to sustain their enhanced performance subsequently (Peng et al., 2020; Vaughn et al., 2003).
In a recent study, Hulme et al. (2025) underscored that circumstances beyond the limits of the intervention per se such as socio-economic factors and average reading performance of schools are indeed related to sustainability of reading skills post-intervention, pointing out the impact of the overall learning environment. The learning environment should support already mastered skills by recognizing the need for complementary instruction after an intervention meant to build on these same skills, rather than instruction interchangeable to the intervention (Bailey et al., 2020). In sum, providing adequate post-intervention support and consistently monitoring student performance may represent essential steps to ensure sustained progress and skill mastery.
In relation to the present study, carefully choosing appropriate content, instructional approaches, and outcome measures for the intervention programs were considered relevant to the immediate and lasting impact on reading and mathematics skills. Our two programs did not cover post-intervention monitoring or any additional student instruction or teacher professional development as the main research interest was program evaluation and the impact of these highly intensive efforts over time under mainstream conditions. However, students in need of support in academic domains are entitled to receive it according to Swedish school policy (SFS, 2010) and thus students in both intervention- and control conditions should have received continued support from their schools after the interventions, when needed.
The present interventions’ ingredients were not considered differentiated from curricular content in mathematics and reading, but emphasized explicit, systematic, and intensive instruction, and therefore provided a more intense and extended format than typically found in Swedish special education. In the present study, children were assumed to receive mathematics and reading classroom instruction parallel to the interventions. Focusing on fundamental number and arithmetic skills and word reading skills, overlapping content was emphasized and potentially overlearned, supporting memorization by classroom instruction as well as by the supplemental programs. To ensure adequate measures that would give reliable estimates of students’ skills, we considered when available standardized tests intended to mirror developmental changes in reading and mathematics-related outcomes, presented in the Methods section. It should be noted that the reporting of intervention effects in education studies using the benchmarks for standardized effects proposed by Cohen (1988) has been criticized for failing to consider the complexity of study-specific features of design, outcome measures, and costs (Kraft, 2020). However, limiting our comparison of the present study’s results to other RCT studies, targeting similar skills, and using similar reporting of effects facilitates interpretation.
In summary, our study reports the one-year follow-up effects of two randomized controlled trial (RCT) interventions targeting second-grade children at risk for early reading and mathematics difficulties. The primary research question concerned whether, and to what extent, the effects of these interventions persisted after one year. The discussion will address strategies to mitigate fade-out effects and to enhance the sustainability of such interventions.

2. Method

2.1. Participants

During the school years of 2019/20 and 2020/21, two cohorts of first grade students from southern Sweden public schools were enrolled in the original studies. n = 753 had parental consent to participate. Two screenings in spring-term of first grade were performed to identify children at risk for mathematics or reading difficulties. The 25 percent lowest performers in mathematics or reading on both occasions were individually randomized into each program’s intervention- and control groups, resulting in approximately 9% of the total sample in each study. The interventions were delivered at the start of second grade. In all, the children came from 21 schools and were served by 13 special education teachers or experienced early elementary school teachers in each program.
For participant characteristics, screening assessment, and information on teacher training, (see Lindström-Sandahl et al., 2023, 2024). The mathematics program at post-test had n = 32 students in the intervention and n = 30 in the control condition, whereas the reading program had n = 34 students in the intervention group and n = 34 in the control group. Attrition was low. Outcome measures were collected at three timepoints: pre-, immediate post-intervention, and 1 year after the post-testing.
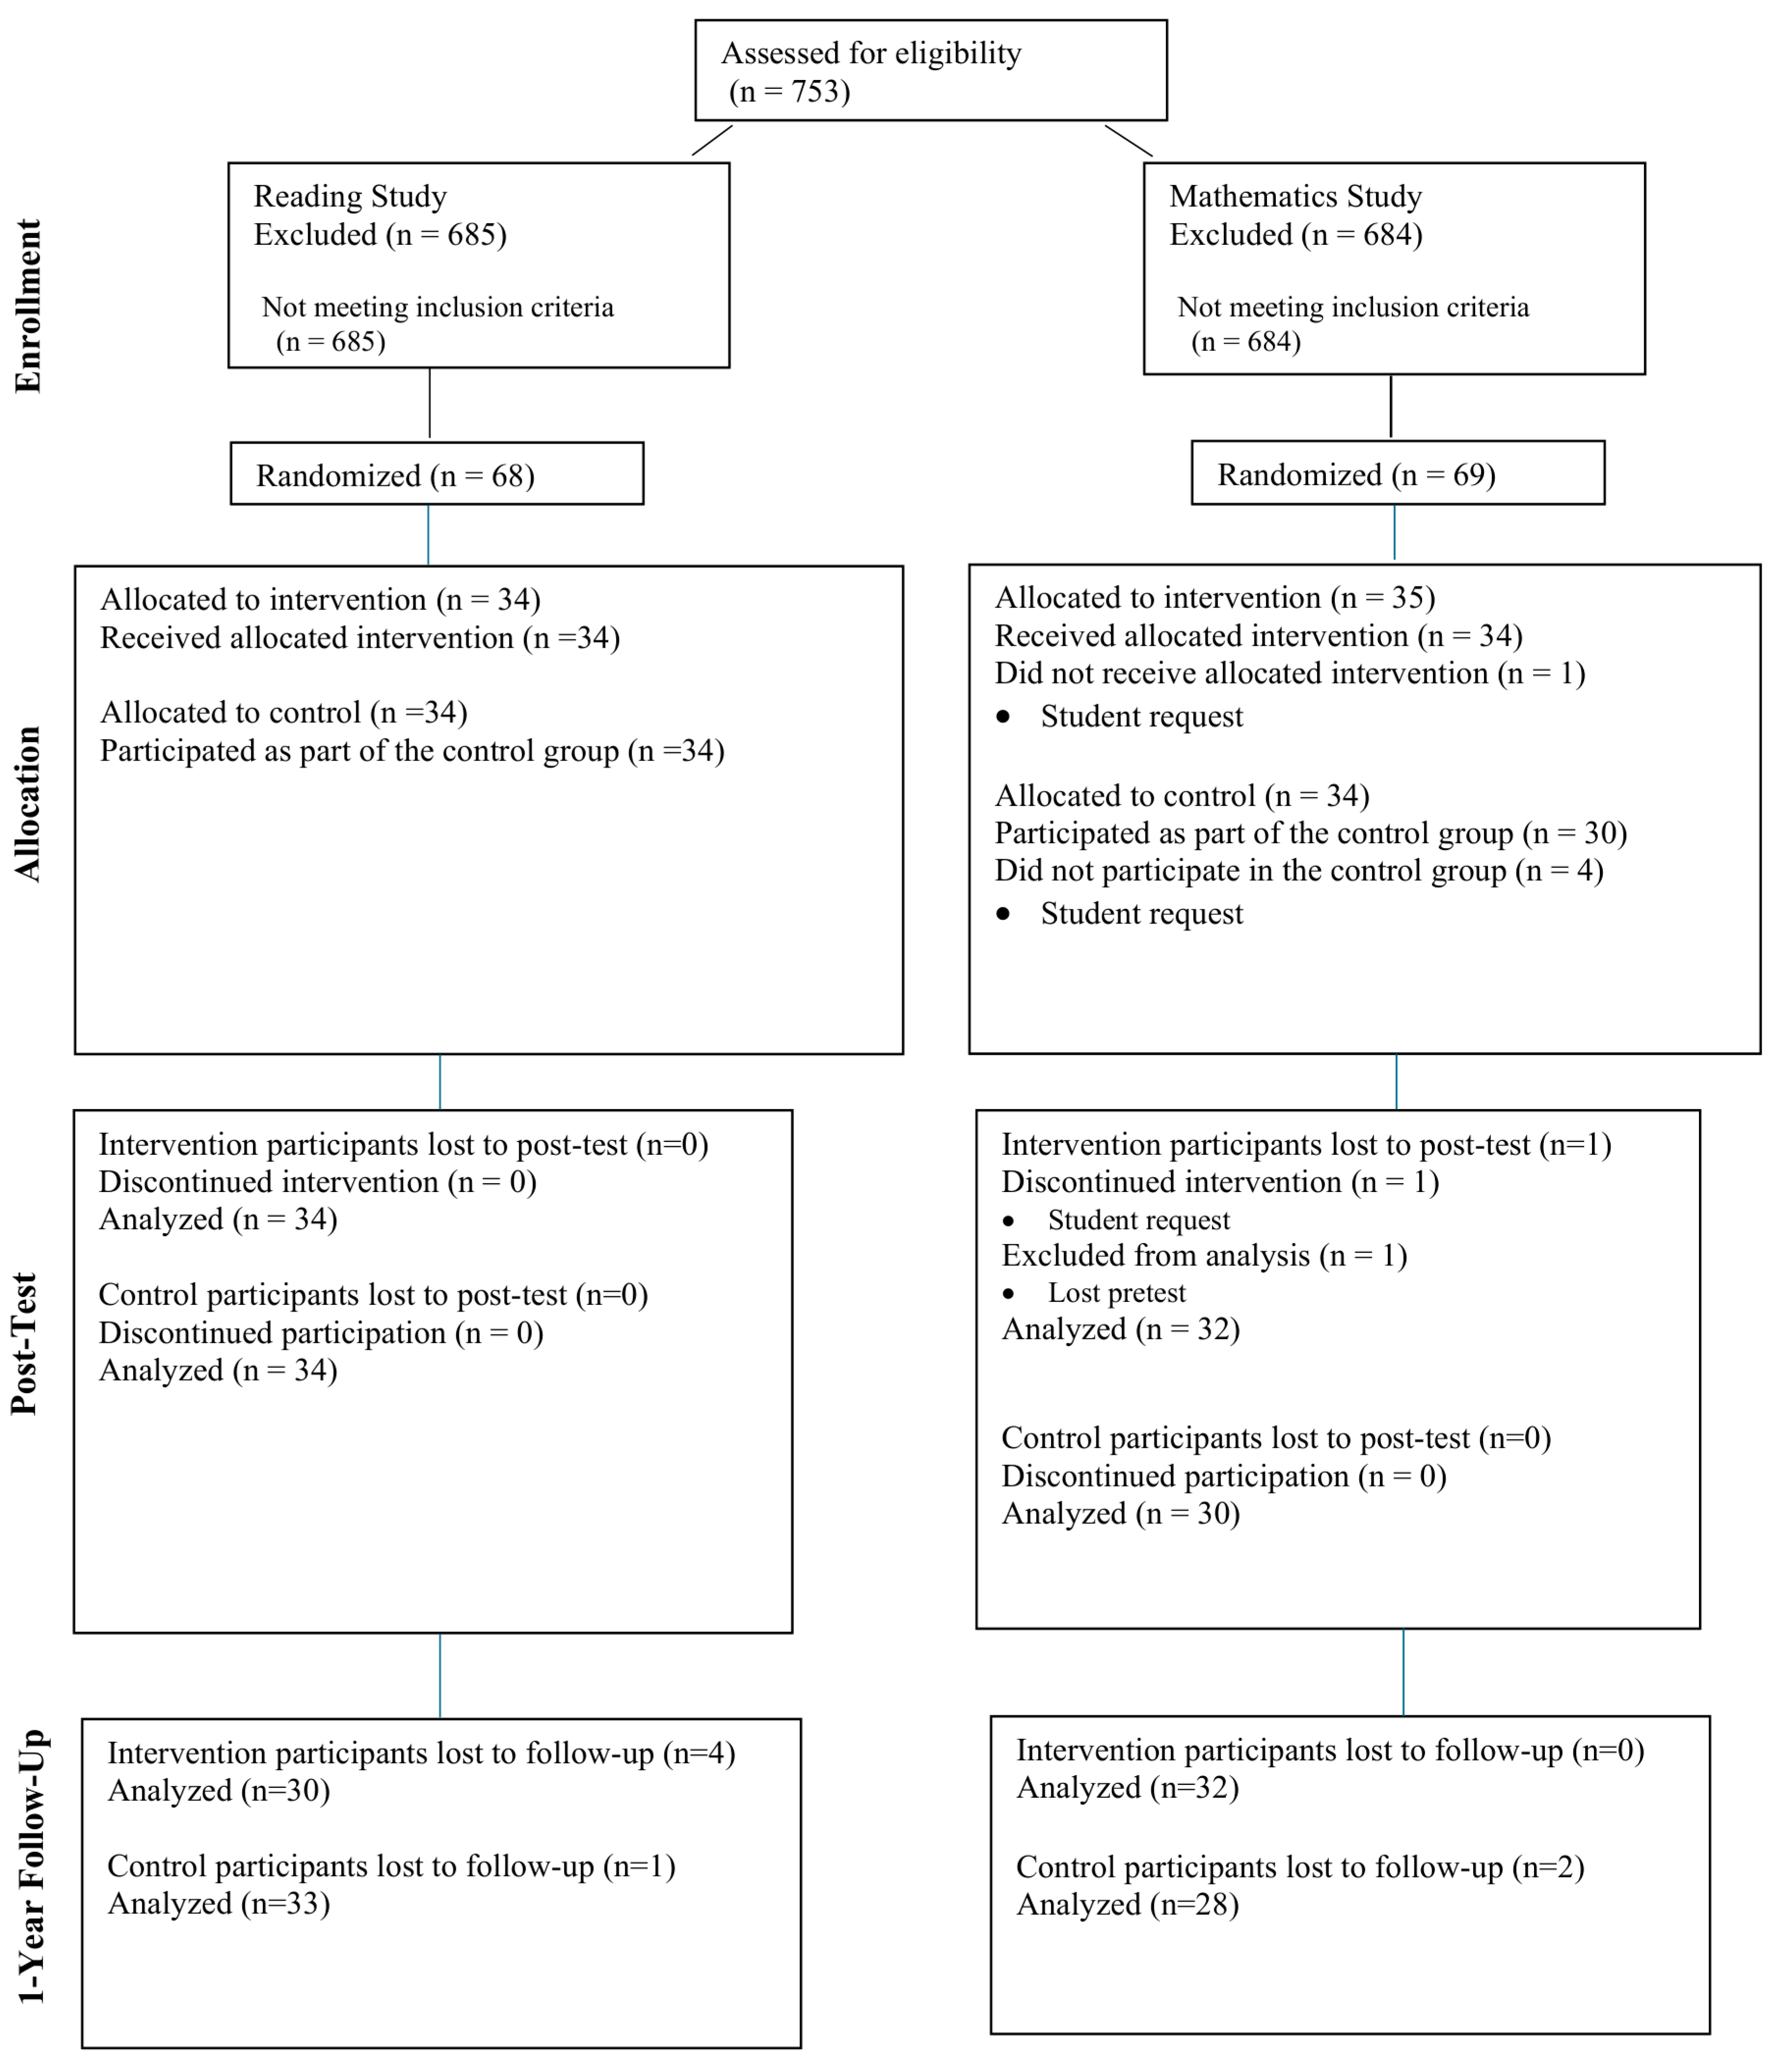
At follow-up all students with post-test scores were re-tested. For the present study, n = 32 intervention group students from the mathematics program participated and n = 28 from the control group, n = 30 intervention group students from the reading program and n = 33 reading controls. Attrition, 7% in the reading program and 3% in the mathematics program, was due to children moving during the year after intervention and these were lost for follow-up assessment. Appendix A, Figure A1, shows the flow of participants from enrollment to follow-up assessment.

2.2. Intervention- and Control Groups

Training was set up at participants’ schools as an individual supplement to classroom instruction 4 days a week over three months, in all thirty-six scripted lessons and 21 h of instruction. Due to the COVID 19-pandemic, the implementation suffered from lack of in-person monitoring by the research team. Instead, teachers recorded if there were deviations to program plans and the researcher team arranged online meetings with teachers throughout the implementation period to strengthen program fidelity. Few deviations were reported; time management was challenging for some implementers in both programs.
The mathematics and reading interventions shared core instructional features, which were high intensity, explicit and systematic instruction. The programs were multi-componential, concentrating on basic number knowledge and procedural skills in arithmetic and decoding and word reading skills, respectively. Specifically, participants in the reading intervention were instructed in phoneme awareness, phoneme–grapheme connections, blending technique, decoding, and word reading fluency. Meanwhile, participants in the mathematics intervention were instructed in number relations, composition, and decomposition of numbers, counting as well as understanding and using different number representations (see Lindström-Sandahl et al., 2023, 2024 for detailed program descriptions).
Students in the comparison groups followed teaching as usual, including any educational support in mathematics or reading planned by their schools. They were, if they received additional special educational support, served by mainly the same teachers who conducted the intervention. No blinding of participants occurred for practical reasons. According to reports from participating schools, special education was provided through small-group instruction or by the special education teacher in the classroom during regular mathematics or reading hours.

2.3. Tests and Test Procedure

Assessment for the follow-up took place at the students’ schools by the same special education teachers who managed testing in the original studies. A member of the research team performed tests with a handful of students. The individual assessment procedure replicated previous testing and was completed for all groups during November–December of third grade.
In mathematics, a 22-item test was the outcome measure for conceptual knowledge (McIntosh, 2008) with tasks evaluating the student’s skills with place value, number relations, and number line estimation. Procedural knowledge was measured by a 26-item test (McIntosh, 2008) assessing arithmetic calculation in single- and multidigit addition and subtraction tasks. Finally, a subtest from Wide Range Achievement Test, WRAT (Wilkinson & Robertson, 2006) was used to test mathematical problem-solving. In reading, word decoding and word recognition were assessed by LäSt (Elwér et al., 2016), a timed test of nonword and word reading proficiency, i.e., decoding and word recognition. Reading comprehension was measured by a subtest of passage reading from the Woodcock test battery (Woodcock, 1987).
In addition, we included researcher-developed and program-dependent one-minute speeded fluency tests of word recognition and simple arithmetic calculation, which were administered at the end of each test session. Students only completed their program-specific one-minute tests. It yielded outcomes of fluency for students in the mathematics program and reading program at follow-up. These were combined, averaged, and compared with results from one-minute tests that were administered at pre- and post-test.

2.4. Data Analysis

All data analyses were conducted in r (R Core Team, 2021) and RStudio (RStudio Team, 2022), and the manuscript was formatted with the papaja package (Aust & Barth, 2020). The following r packages were used: tidyverse (Wickham et al., 2019) for data wrangling and more, mice (van Buuren & Groothuis-Oudshoorn, 2011) for imputation of missing values, afex (Singmann et al., 2021) for anovas and plots, and emmeans (Lenth, 2021) for calculation of planned contrasts. The very few (0.9% of all data) missing values were imputed with the mice package separate for type of test (reading tests, math tests), test occasion (pre-, post-, and follow-up), and group (intervention group, control group) based on the other tests of the same type with the default method (predictive mean matching) to create five (default setting) complete data sets that were used in the inference statistics.
Robust regression with the rlm function from the MASS package (Venables & Ripley, 2002) was used for all regression analyses. In all analyses, a directional hypothesis (post-score is higher than pre-score or intervention improvement is larger than control improvement) has been used. Analyses were run separately on each imputed data set, and the averaged estimates are reported. Full pooling using Rubin’s rules was also conducted for all regression analyses; these yielded results that were numerically and substantively equivalent, reflecting the extremely low fraction of missing information. For transparency, we note that the pooled analyses primarily differed in producing very large degrees of freedom, as expected when between-imputation variability is minimal.

3. Results

3.1. Reading Intervention Effects

Descriptive statistics of the two groups’ performance at the pre-, post-, and follow-up test along with intervention effects are presented in Table 1. As expected, the intervention group improved significantly on all measures from pre-test to follow-up (Cohen’s d range 0.79–1.68), as did the control group (Cohen’s d range 0.68–1.56); see Table 1 for details.
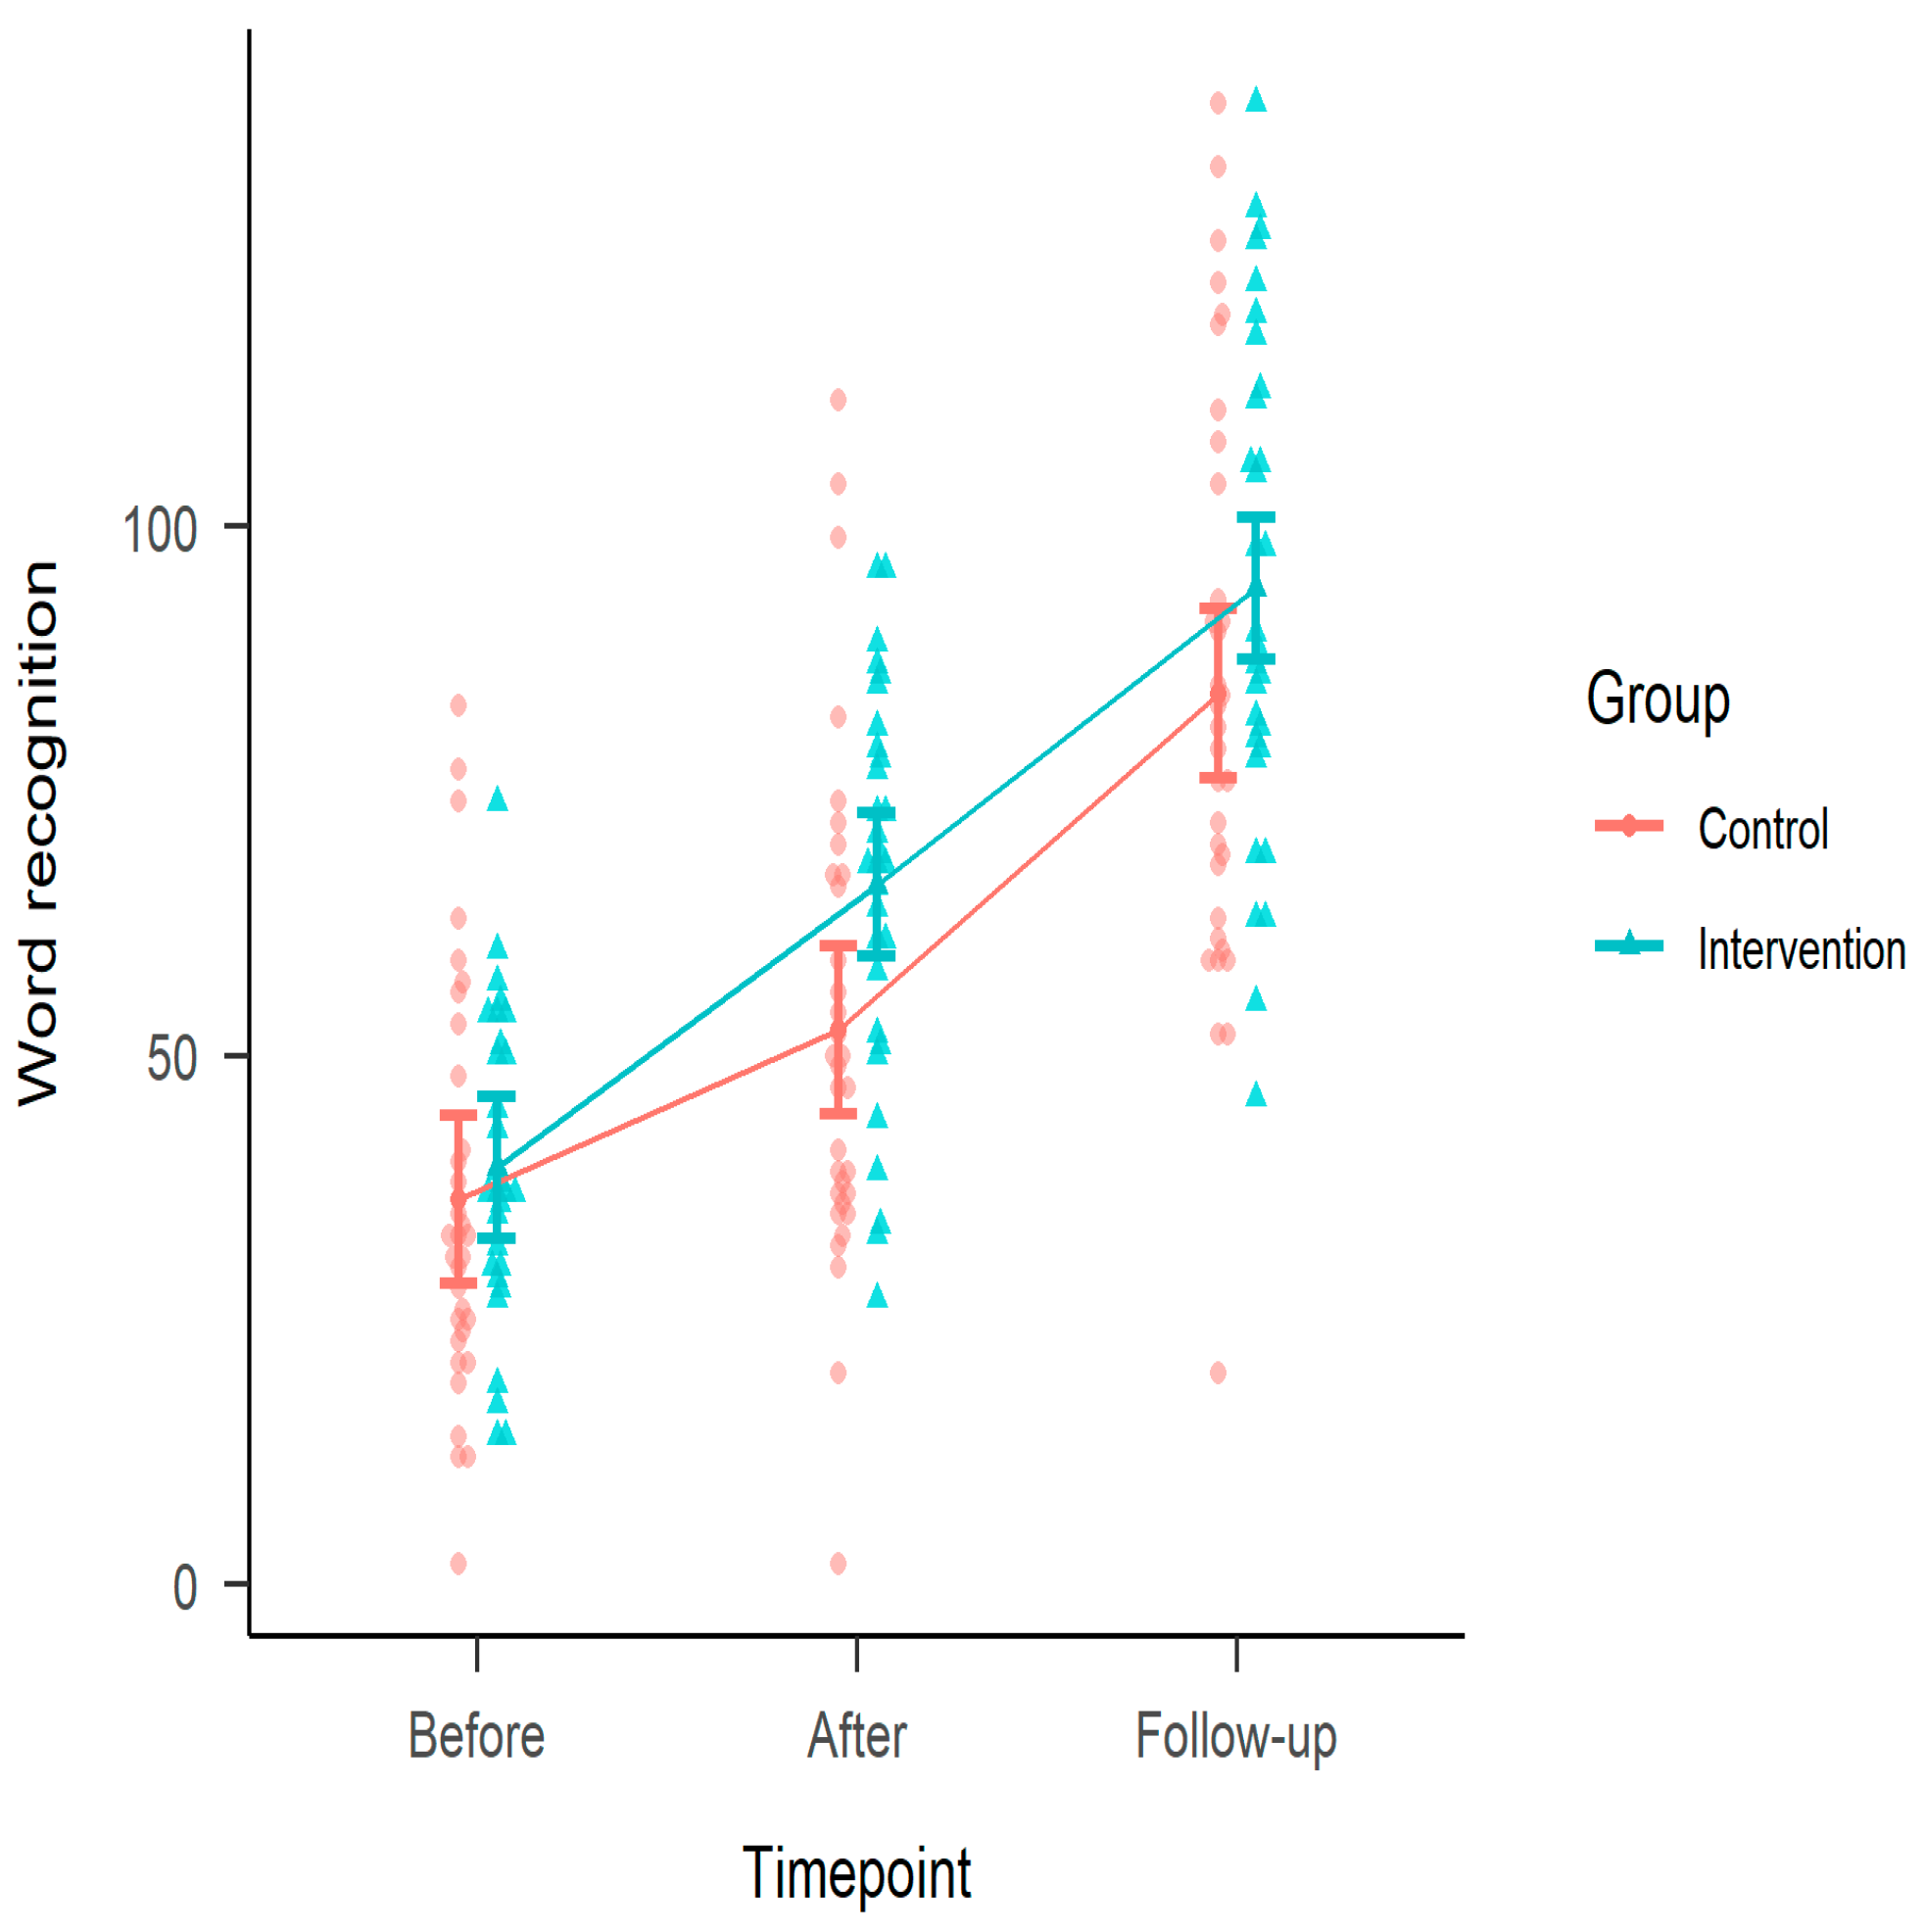
The planned contrast with the pre-test score as a covariate in a robust regression showed a difference between groups at follow-up for word recognition (Figure 1). ∆M = 5.91, 95% CI [−1.81, ∞], t(60) = 1.26, p = 0.10, Cohen’s d = 0.36, 95% CI [−0.11, ∞].
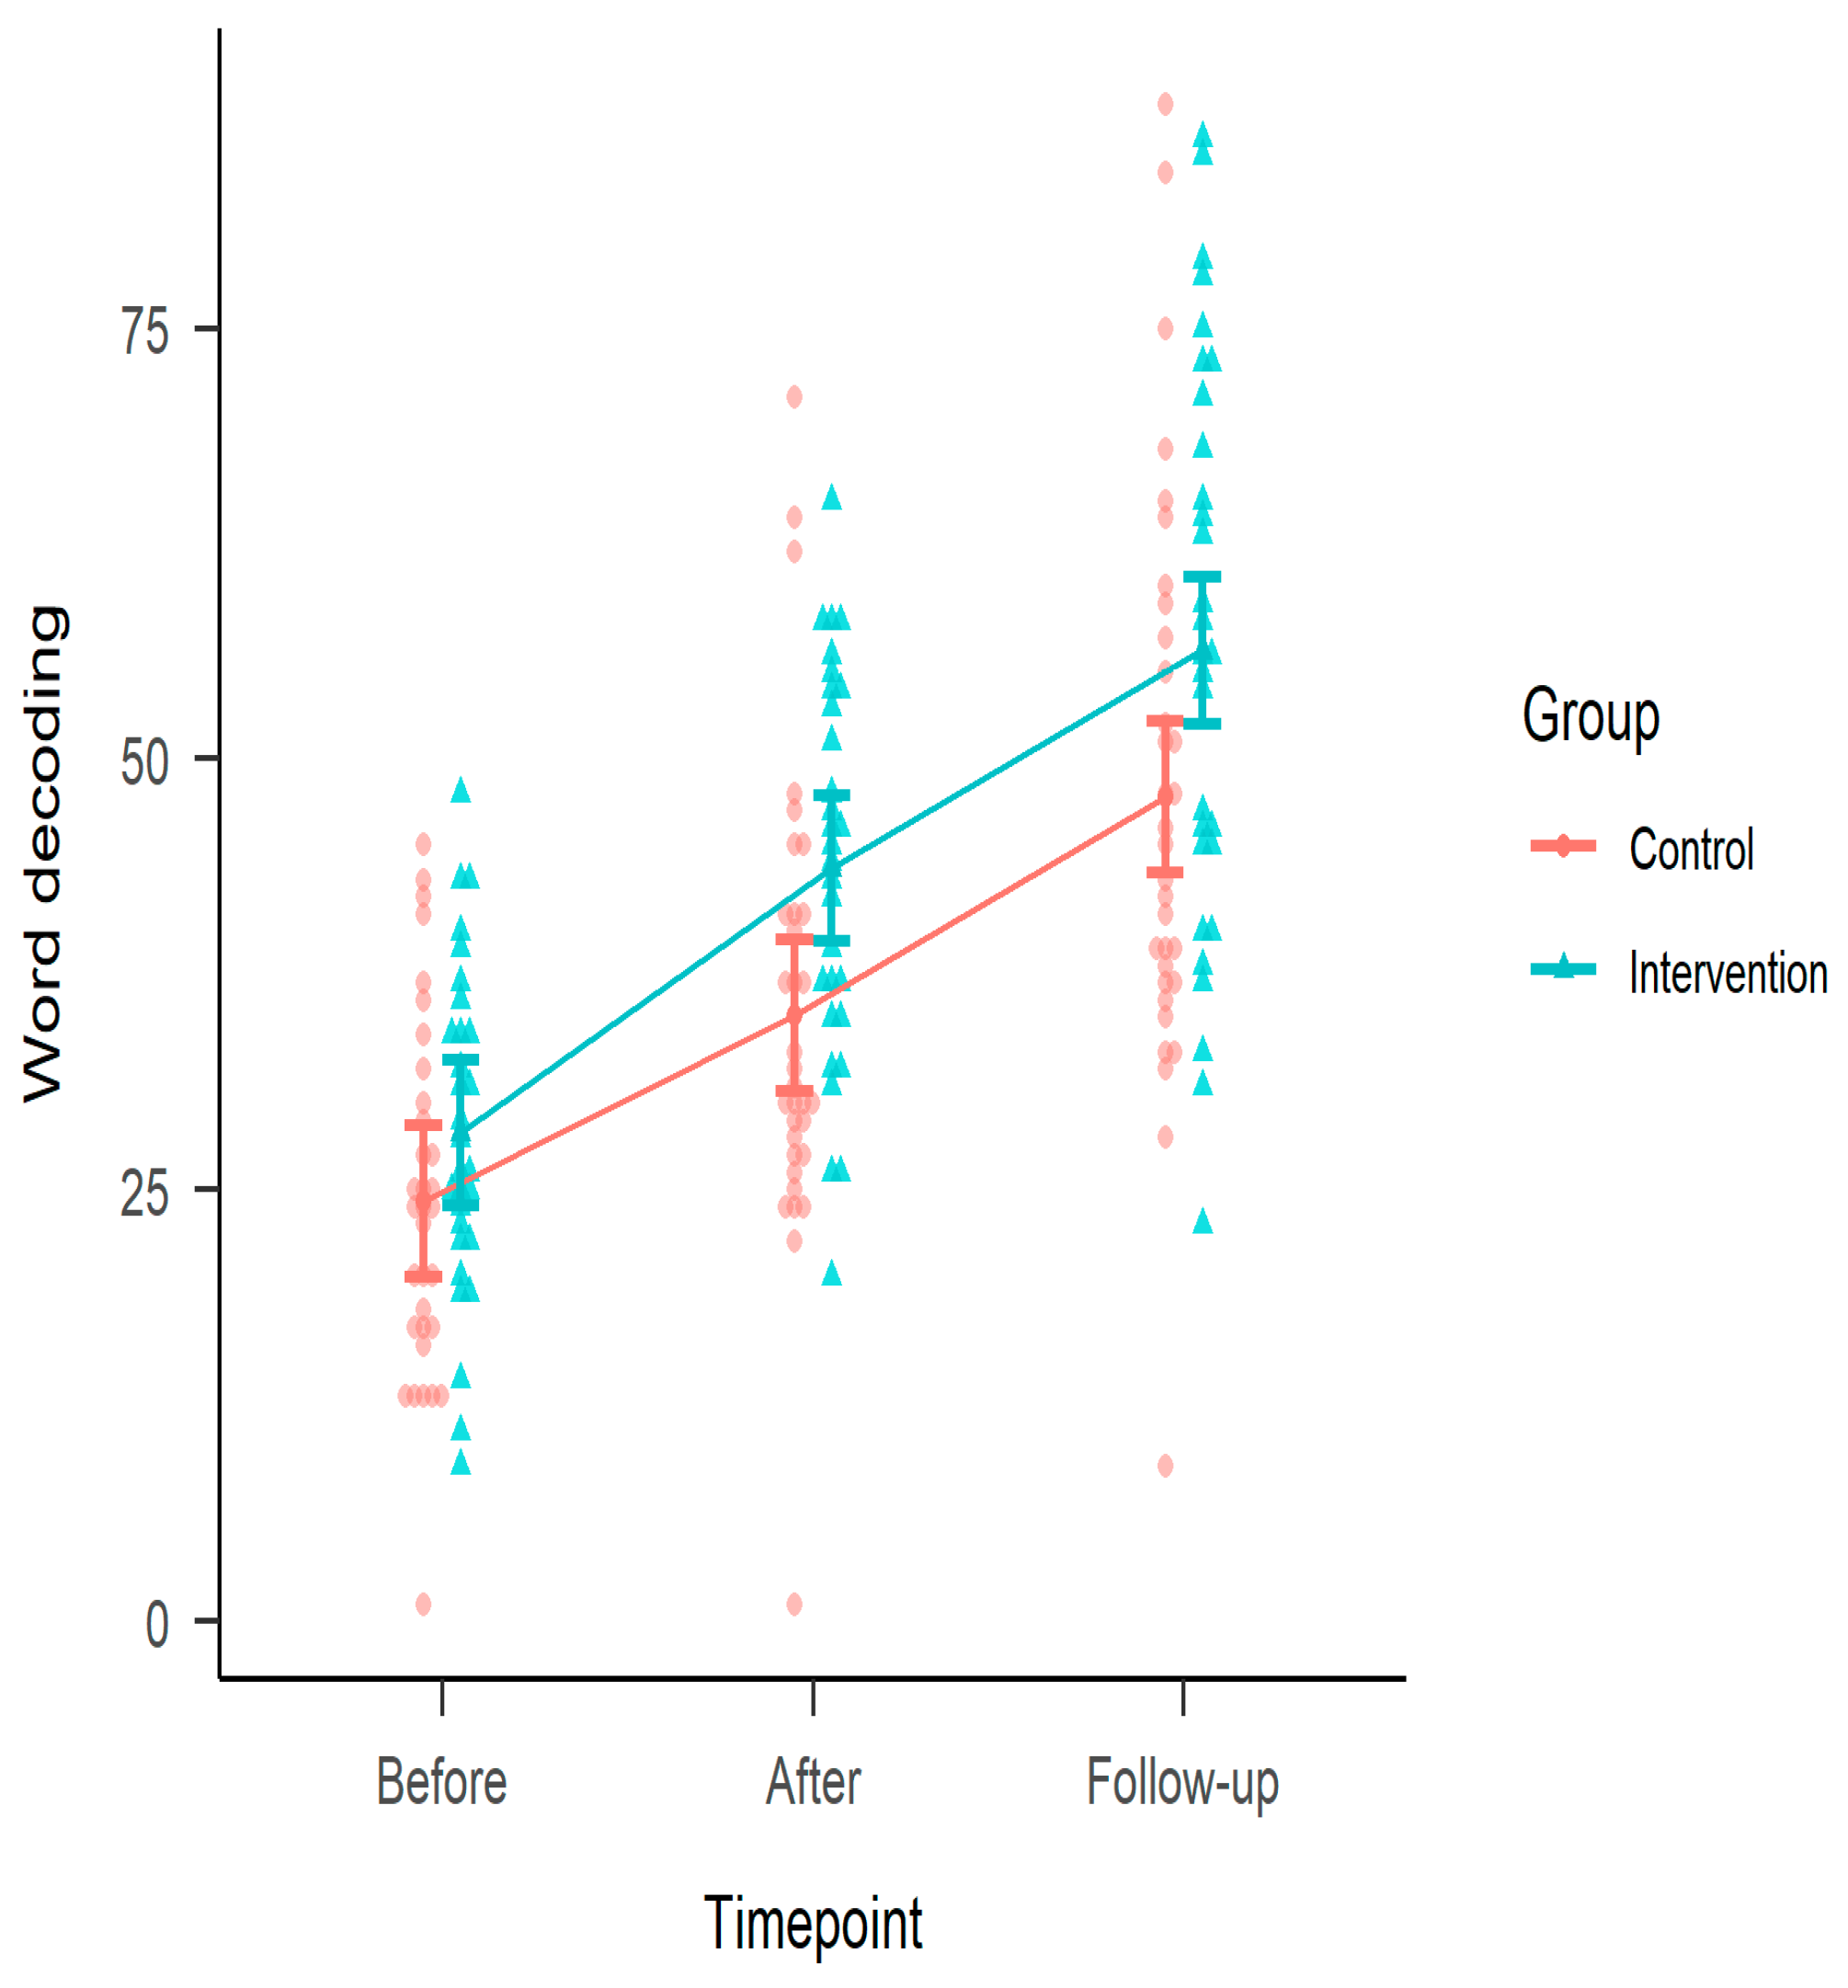
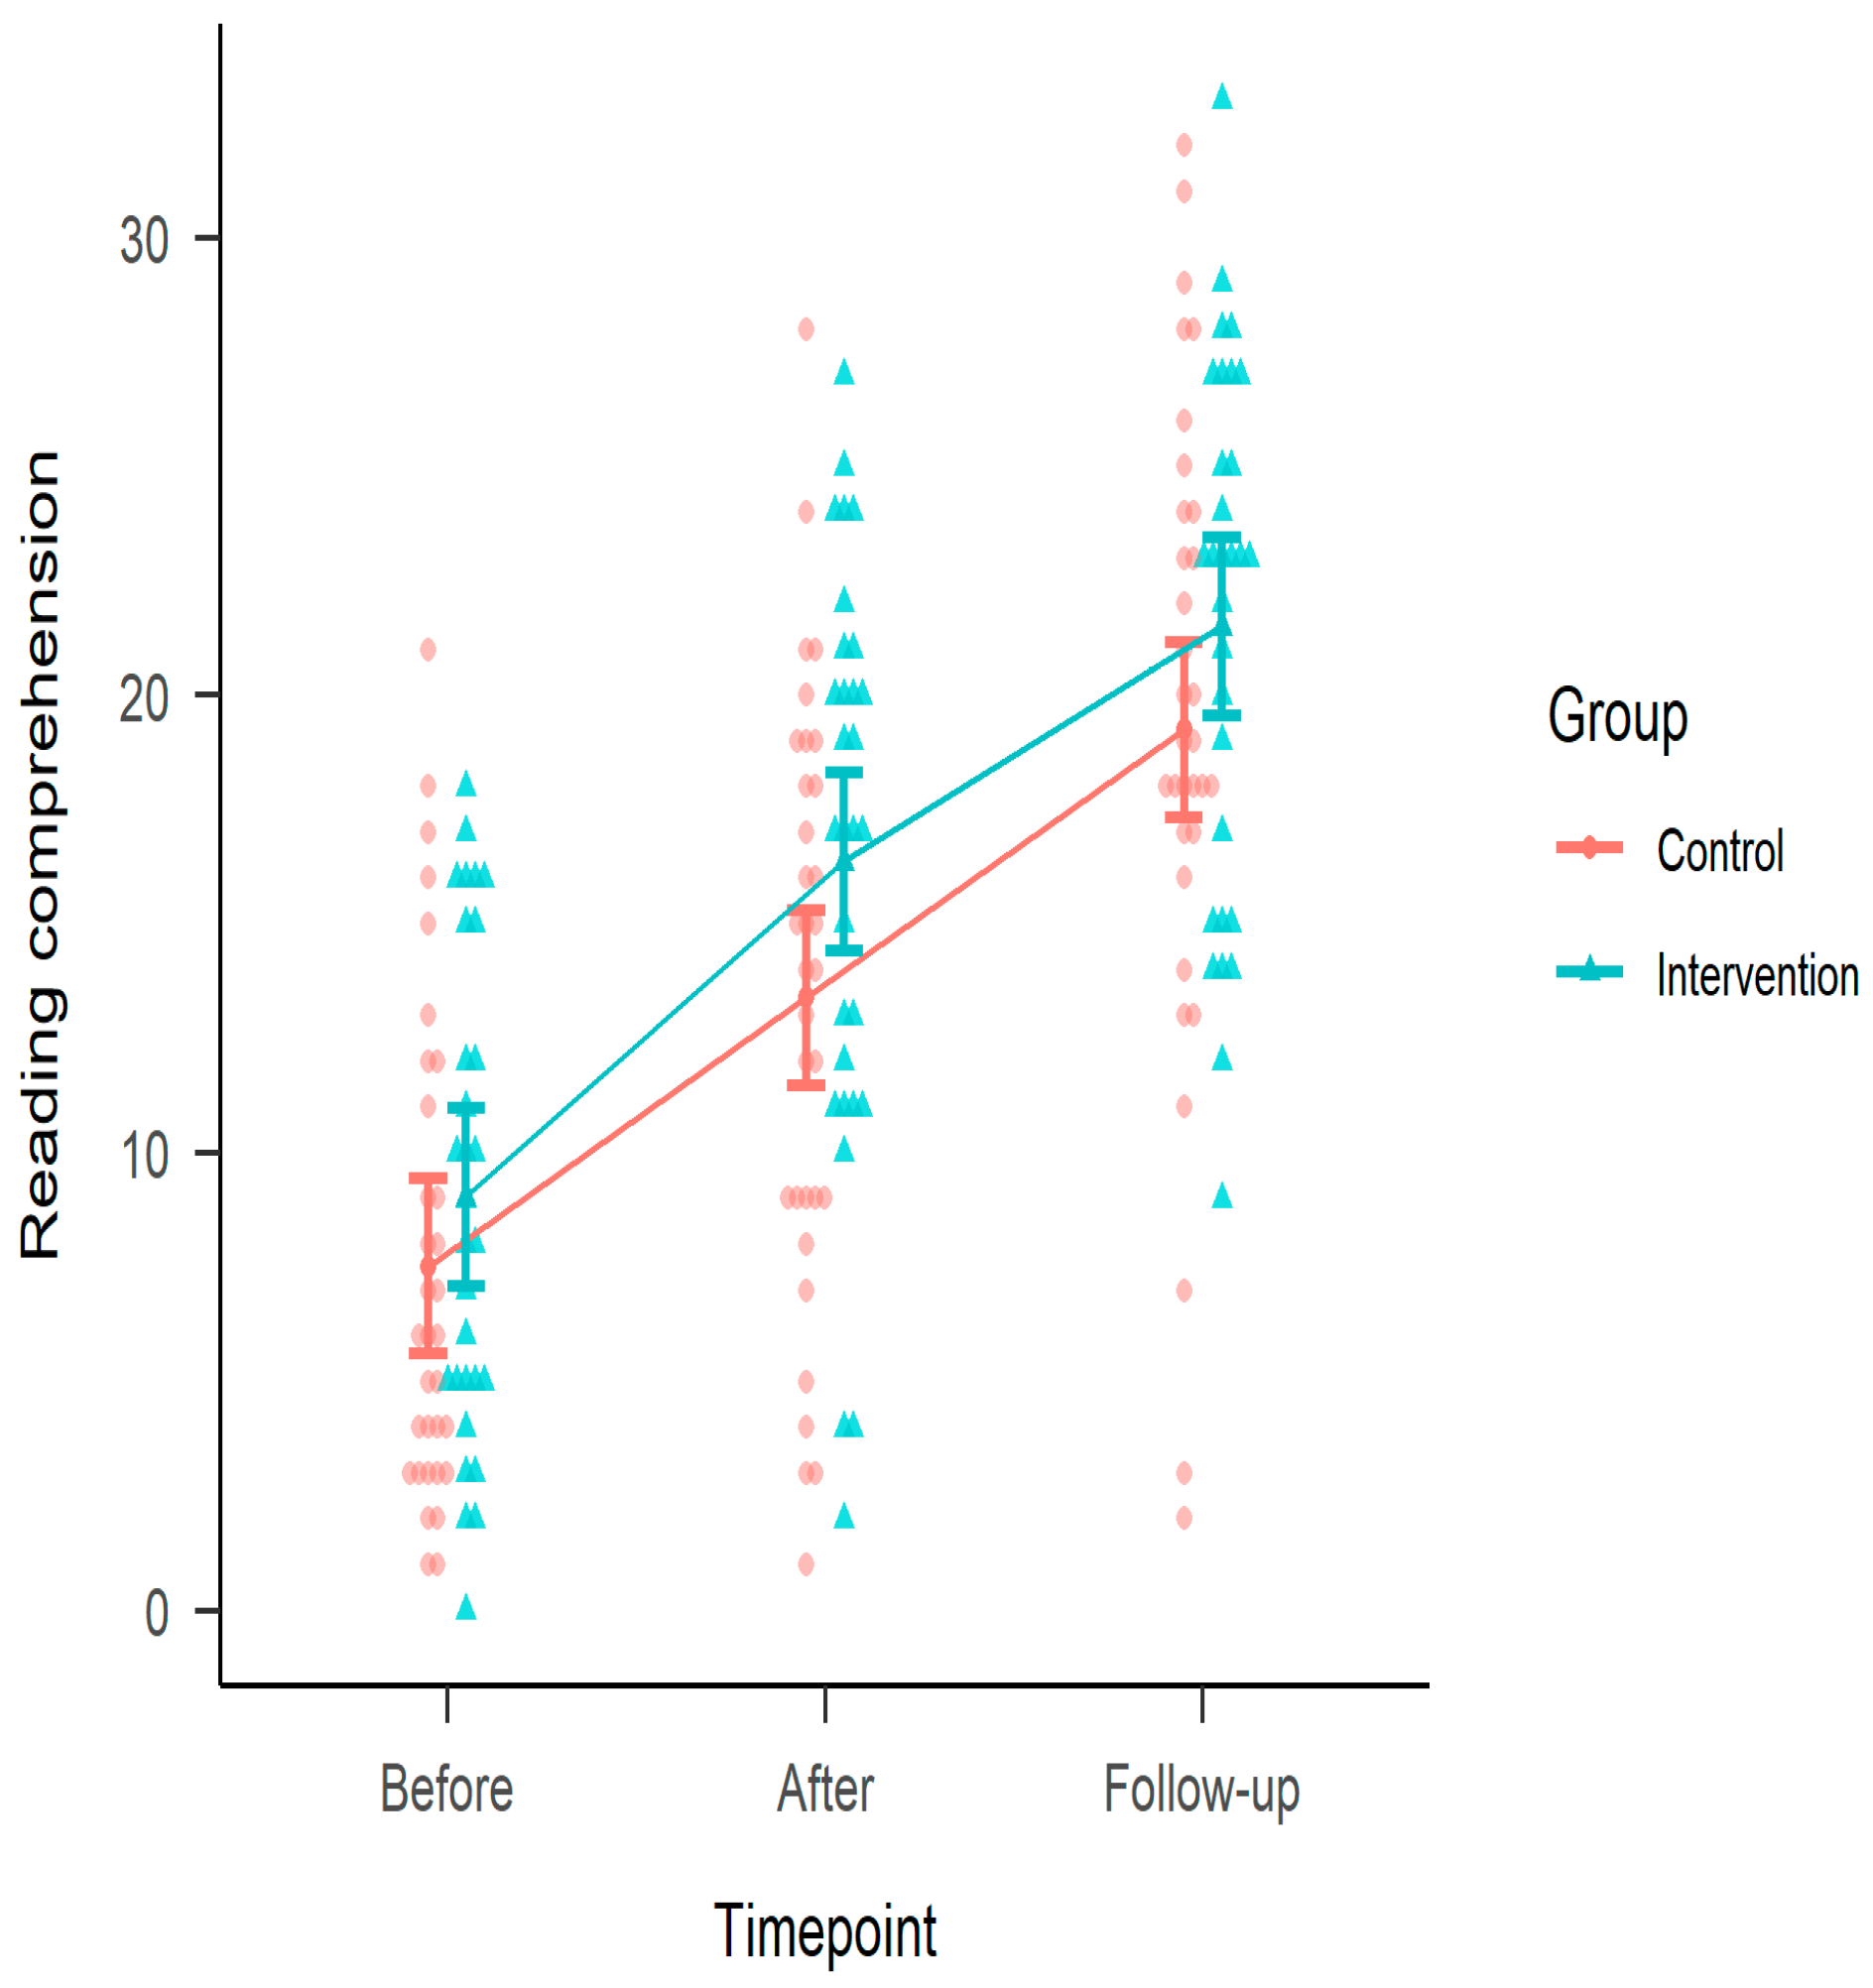
The planned contrast with the pre-test score as a covariate in a robust regression showed a difference between groups at follow-up for word decoding (Figure 2). ∆M = 2.98, 95% CI [−2.13, ∞], t(60) = 0.96, p = 0.17, Cohen’s d = 0.25, 95% CI [−0.18, ∞].
The planned contrast with the pre-test score as a covariate in a robust regression showed a difference between groups at follow-up for reading comprehension (Figure 3). ∆M = 1.26, 95% CI [−1.37, ∞], t(60) = 0.79, p = 0.22, Cohen’s d = 0.22, 95% CI [−0.24, ∞].
None of these effects above were significant, indicating that there were no differences between intervention and control groups one year after the intervention was finished.
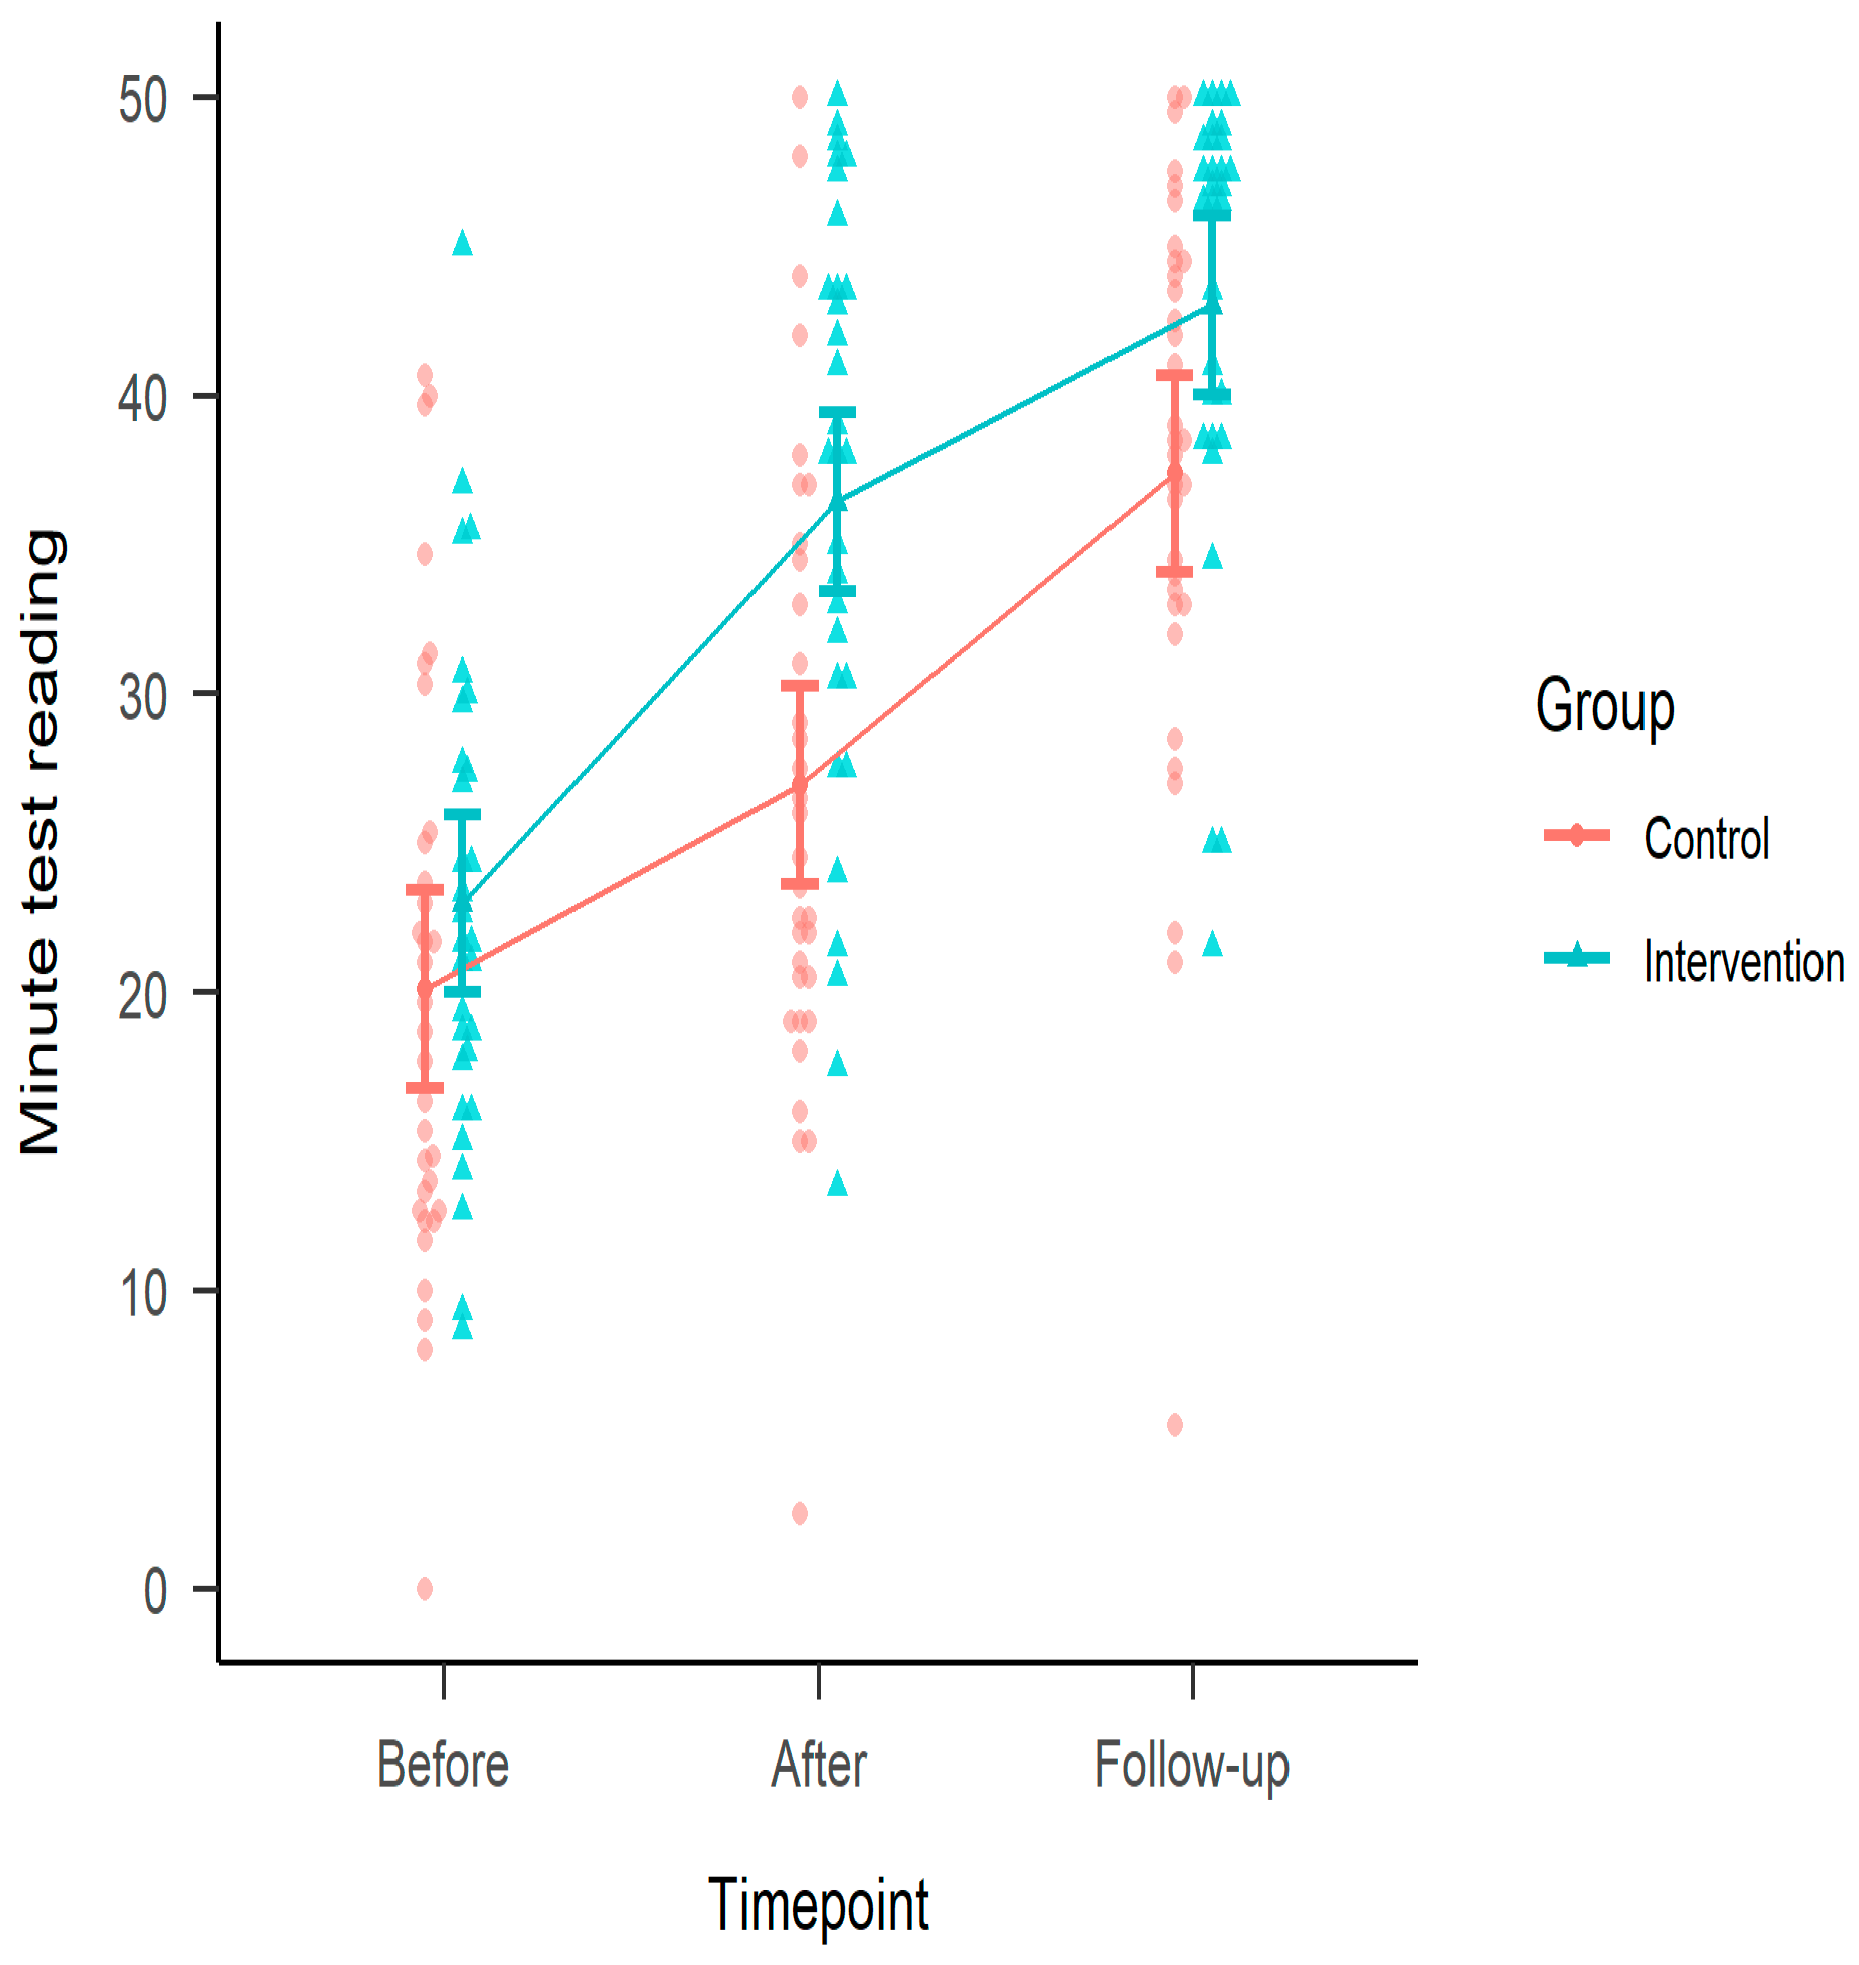
For the minute test reading (Figure 4), the planned contrast with the pre-test score as a covariate in a robust regression showed a significant difference between groups at follow-up. ∆M = 4.29, 95% CI [1.87, ∞], t(60) = 2.92, p = 0.00, Cohen’s d = 0.66, 95% CI [0.29, ∞].
Compared to the immediate intervention’s large to medium effects, which demonstrated a significant difference between intervention and control groups on all reading measures directly after the intervention (word recognition ∆M = 10.37, 95% CI [6.14, ∞], t(65) = 4.03, p = 0.00, Cohen’s d = 1.03, 95% CI [0.61, ∞]; word decoding ∆M = 4.89, 95% CI [1.65, ∞], t(65) = 2.49, p = 0.01, Cohen’s d = 0.56, 95% CI [0.19, ∞], reading comprehension ∆M = 10.37, 95% CI [6.14, ∞], t(65) = 4.03, p = 0.00, Cohen’s d = 1.03, 95% CI [0.61, ∞], and minute test reading ∆M = 6.73, 95% CI [4.65, ∞], t(65) = 5.32, p = 0.00, Cohen’s d = 1.27, 95% CI [0.88, ∞]), the effect sizes at follow-up were small to medium in magnitude following Cohen’s (1988) classification of effect sizes. The effects were reduced to approximately 40% in magnitude.

3.2. Mathematics Intervention Effects

Descriptive statistics of the two groups’ performance at the pre-, post-, and follow-up test along with intervention effects are shown in Table 2. As expected, the intervention group improved significantly on all measures from pre-test to follow-up (Cohen’s d range 0.80–1.63), as did the control group (Cohen’s d range 0.50–1.27); see Table 2 for details.
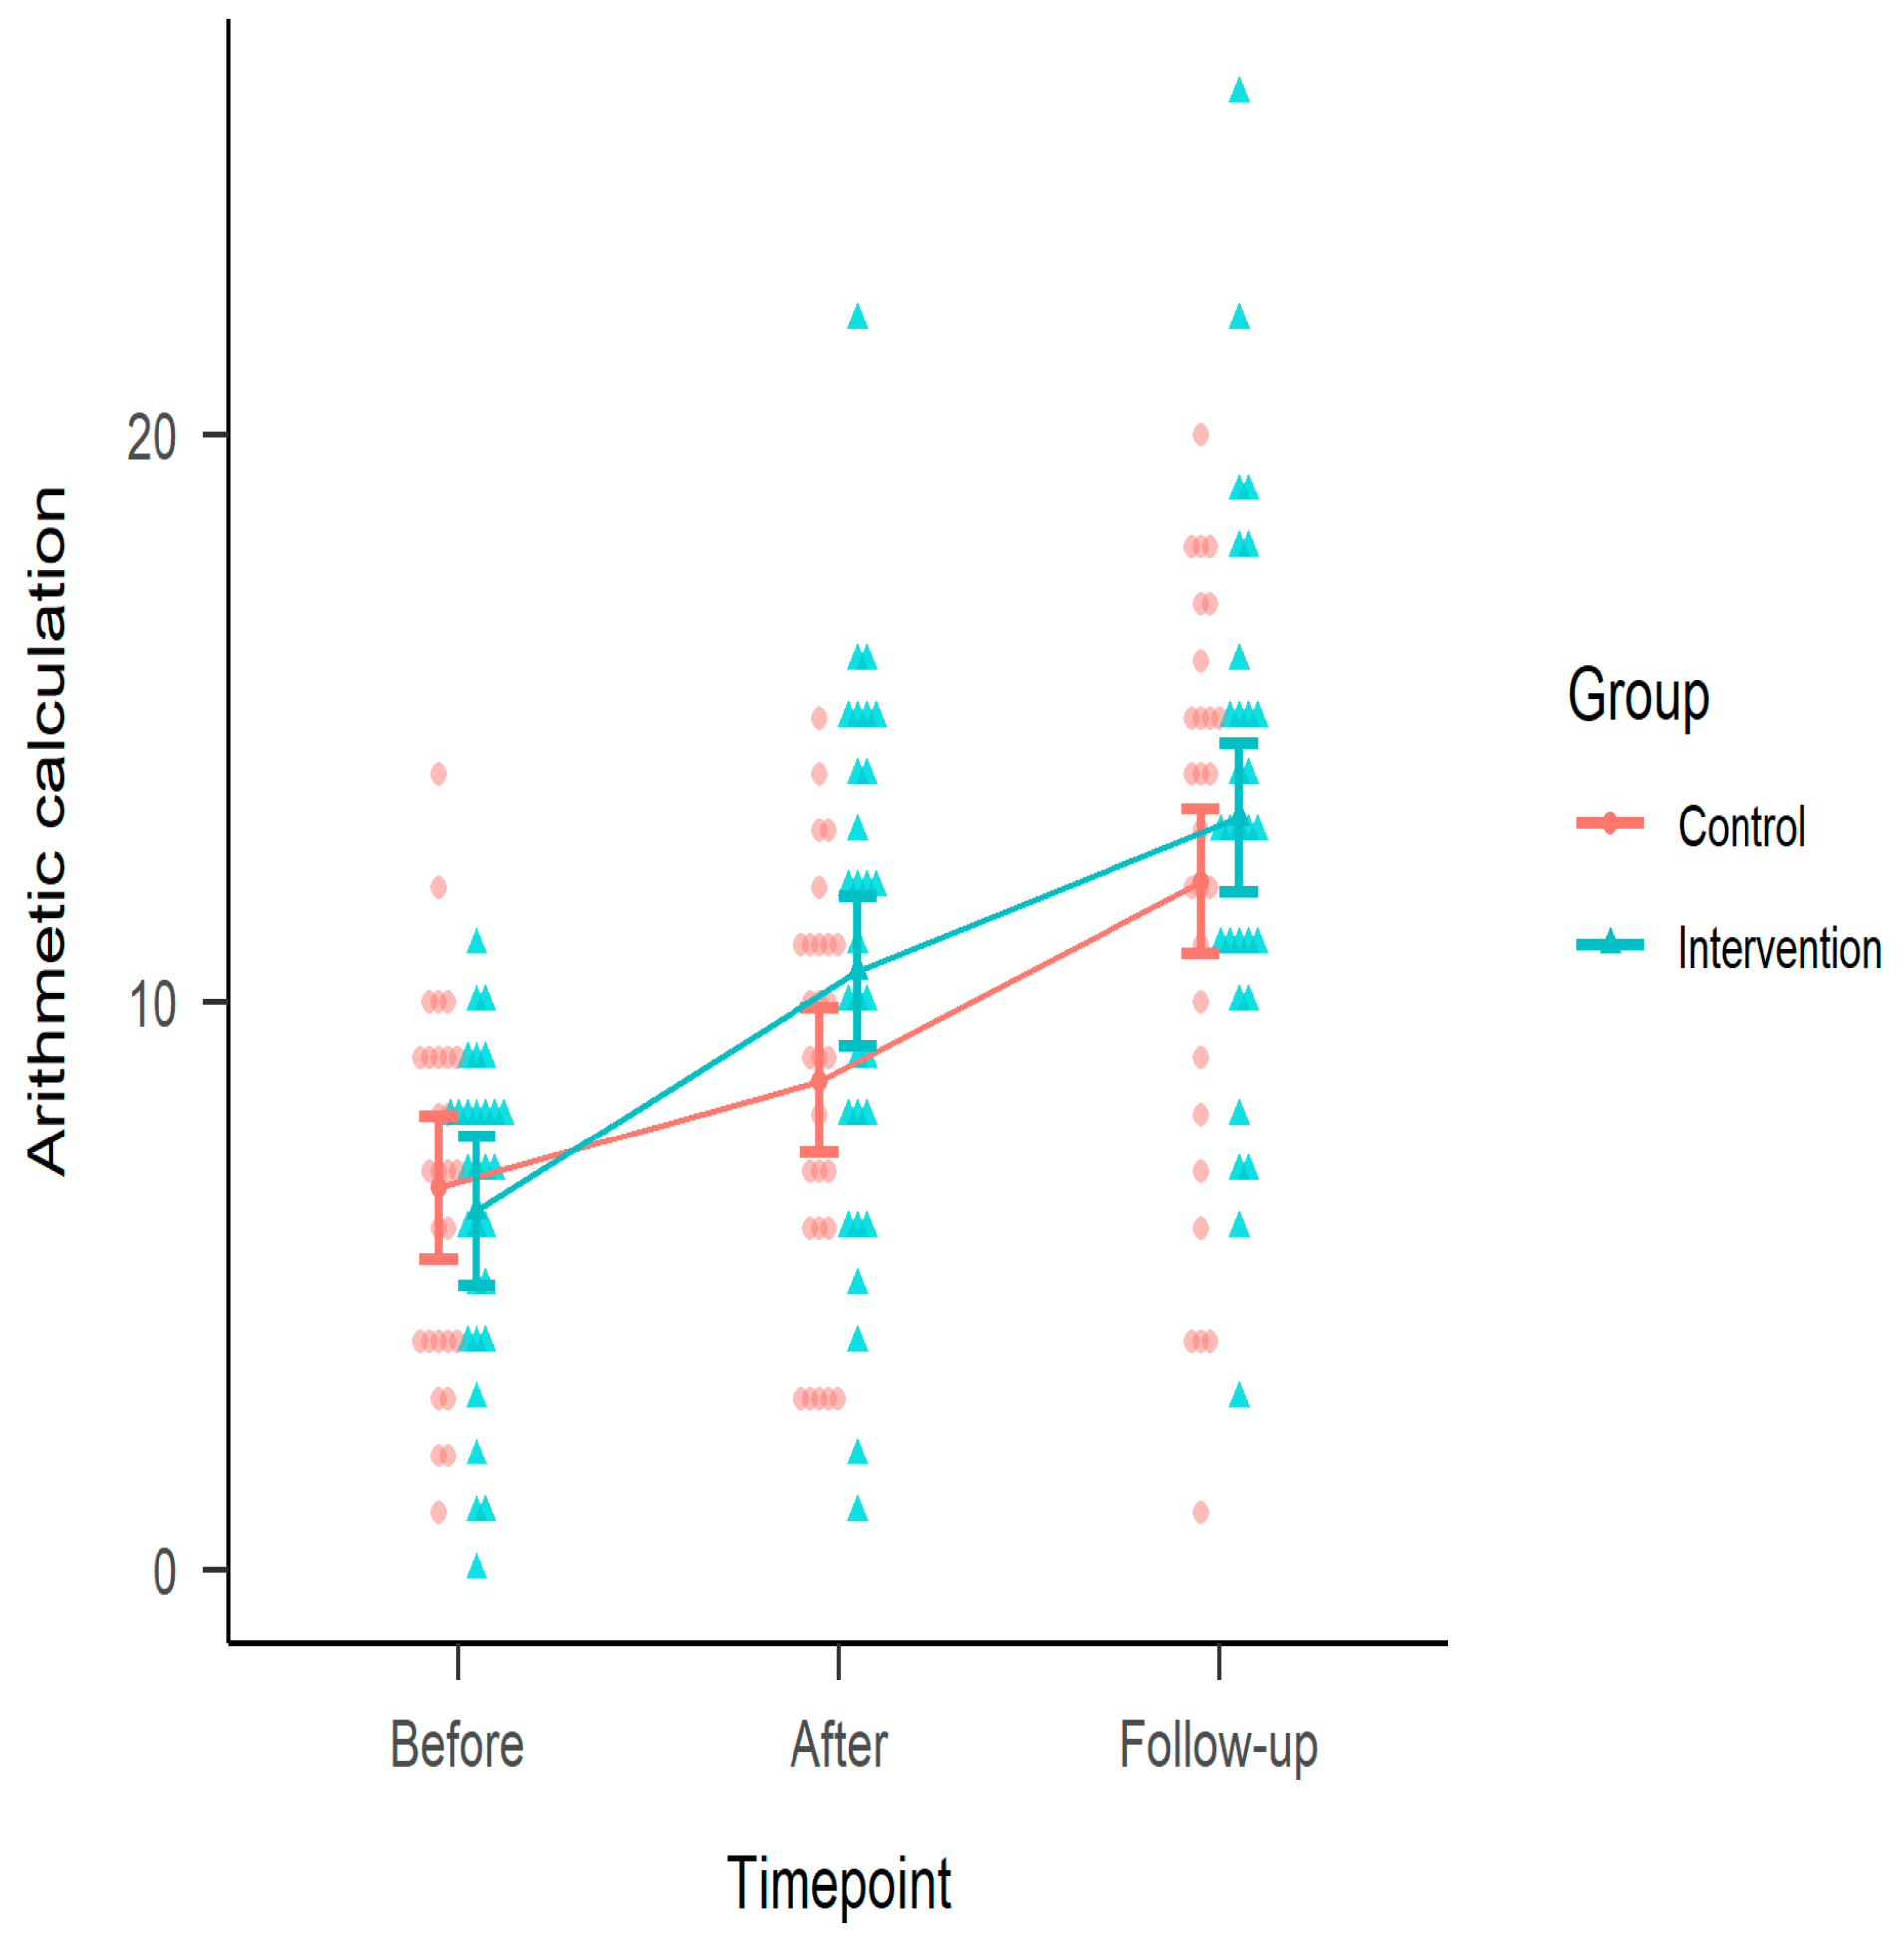
The planned contrast with the pre-test score as a covariate in a robust regression showed a difference between groups at follow-up for arithmetic calculation (Figure 5) ∆M = 0.86, 95% CI [−1.52, ∞], t(55) = 0.59, p = 0.28, Cohen’s d = 0.18, 95% CI [−0.32, ∞].
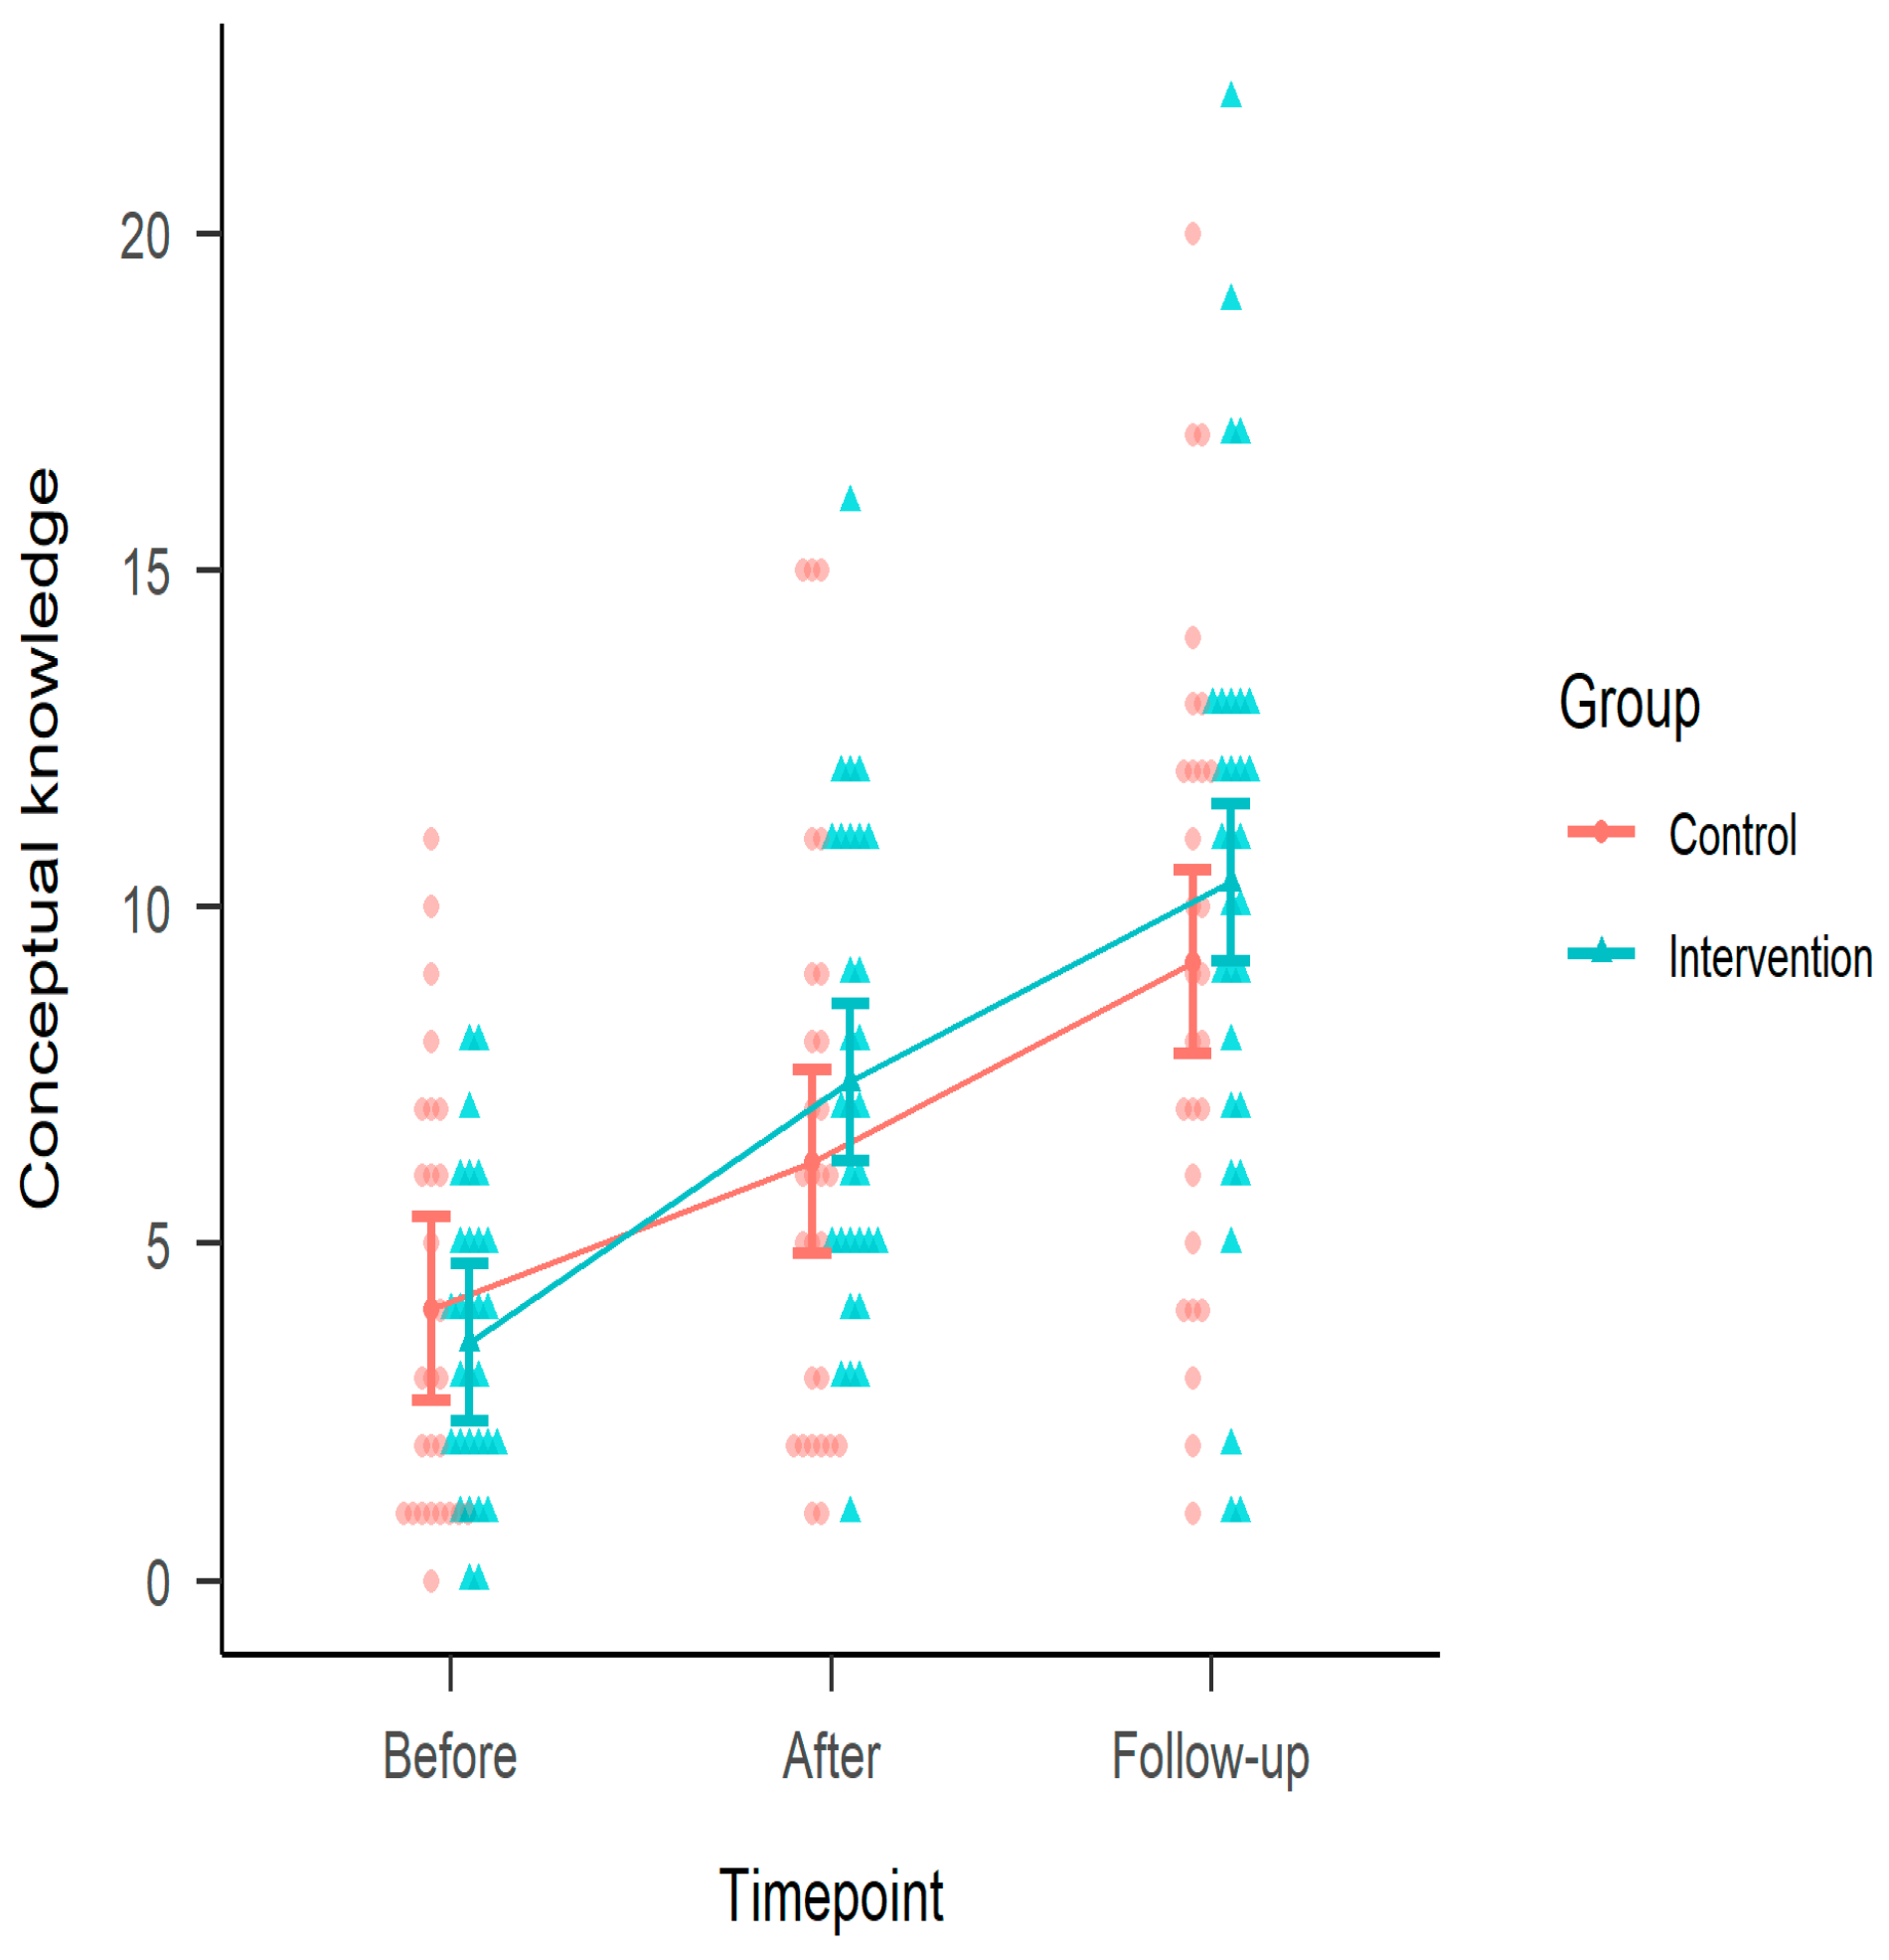
The planned contrast with the pre-test score as a covariate in a robust regression showed a significant difference between groups at follow-up for conceptual knowledge (Figure 6) ∆M = 1.95, 95% CI [0.31, ∞], t(55) = 1.96, p = 0.02, Cohen’s d = 0.49, 95% CI [0.08, ∞].
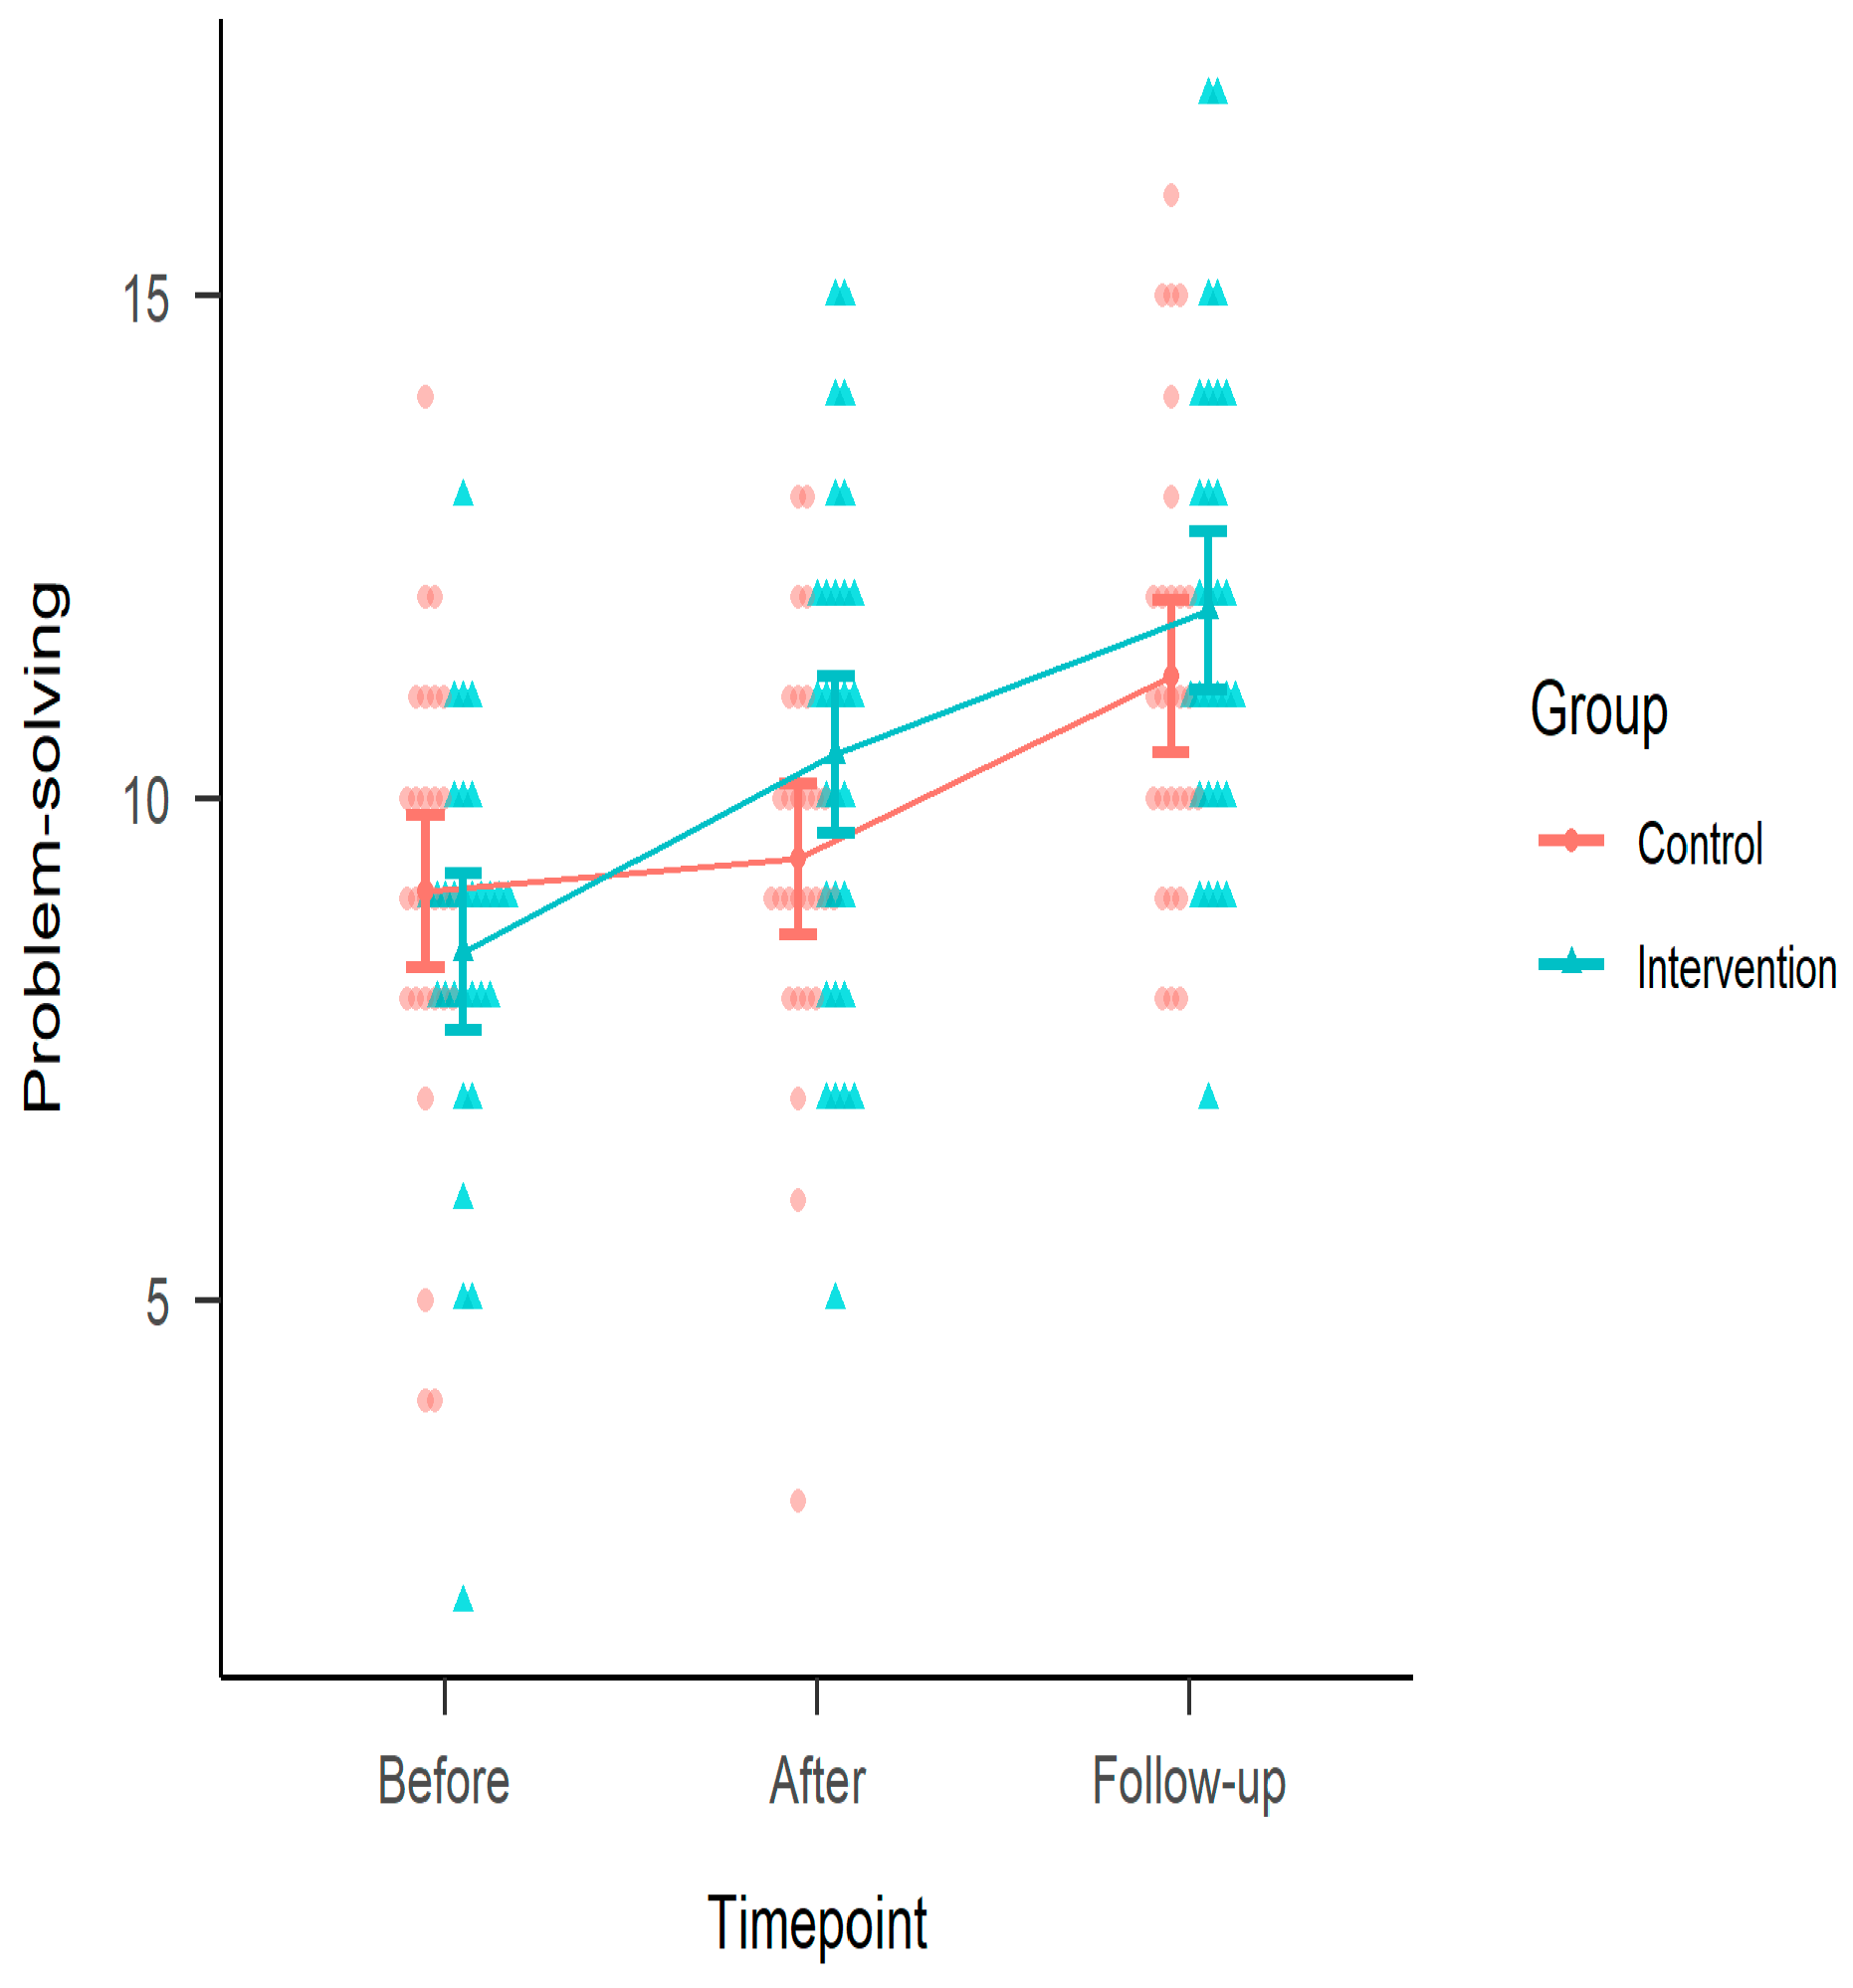
The planned contrast with the pre-test score as a covariate in a robust regression showed a difference between groups at follow-up for problem solving (Figure 7) ∆M = 0.77, 95% CI [−0.05, ∞], t(55) = 1.55, p = 0.06, Cohen’s d = 0.40, 95% CI [−0.02, ∞].
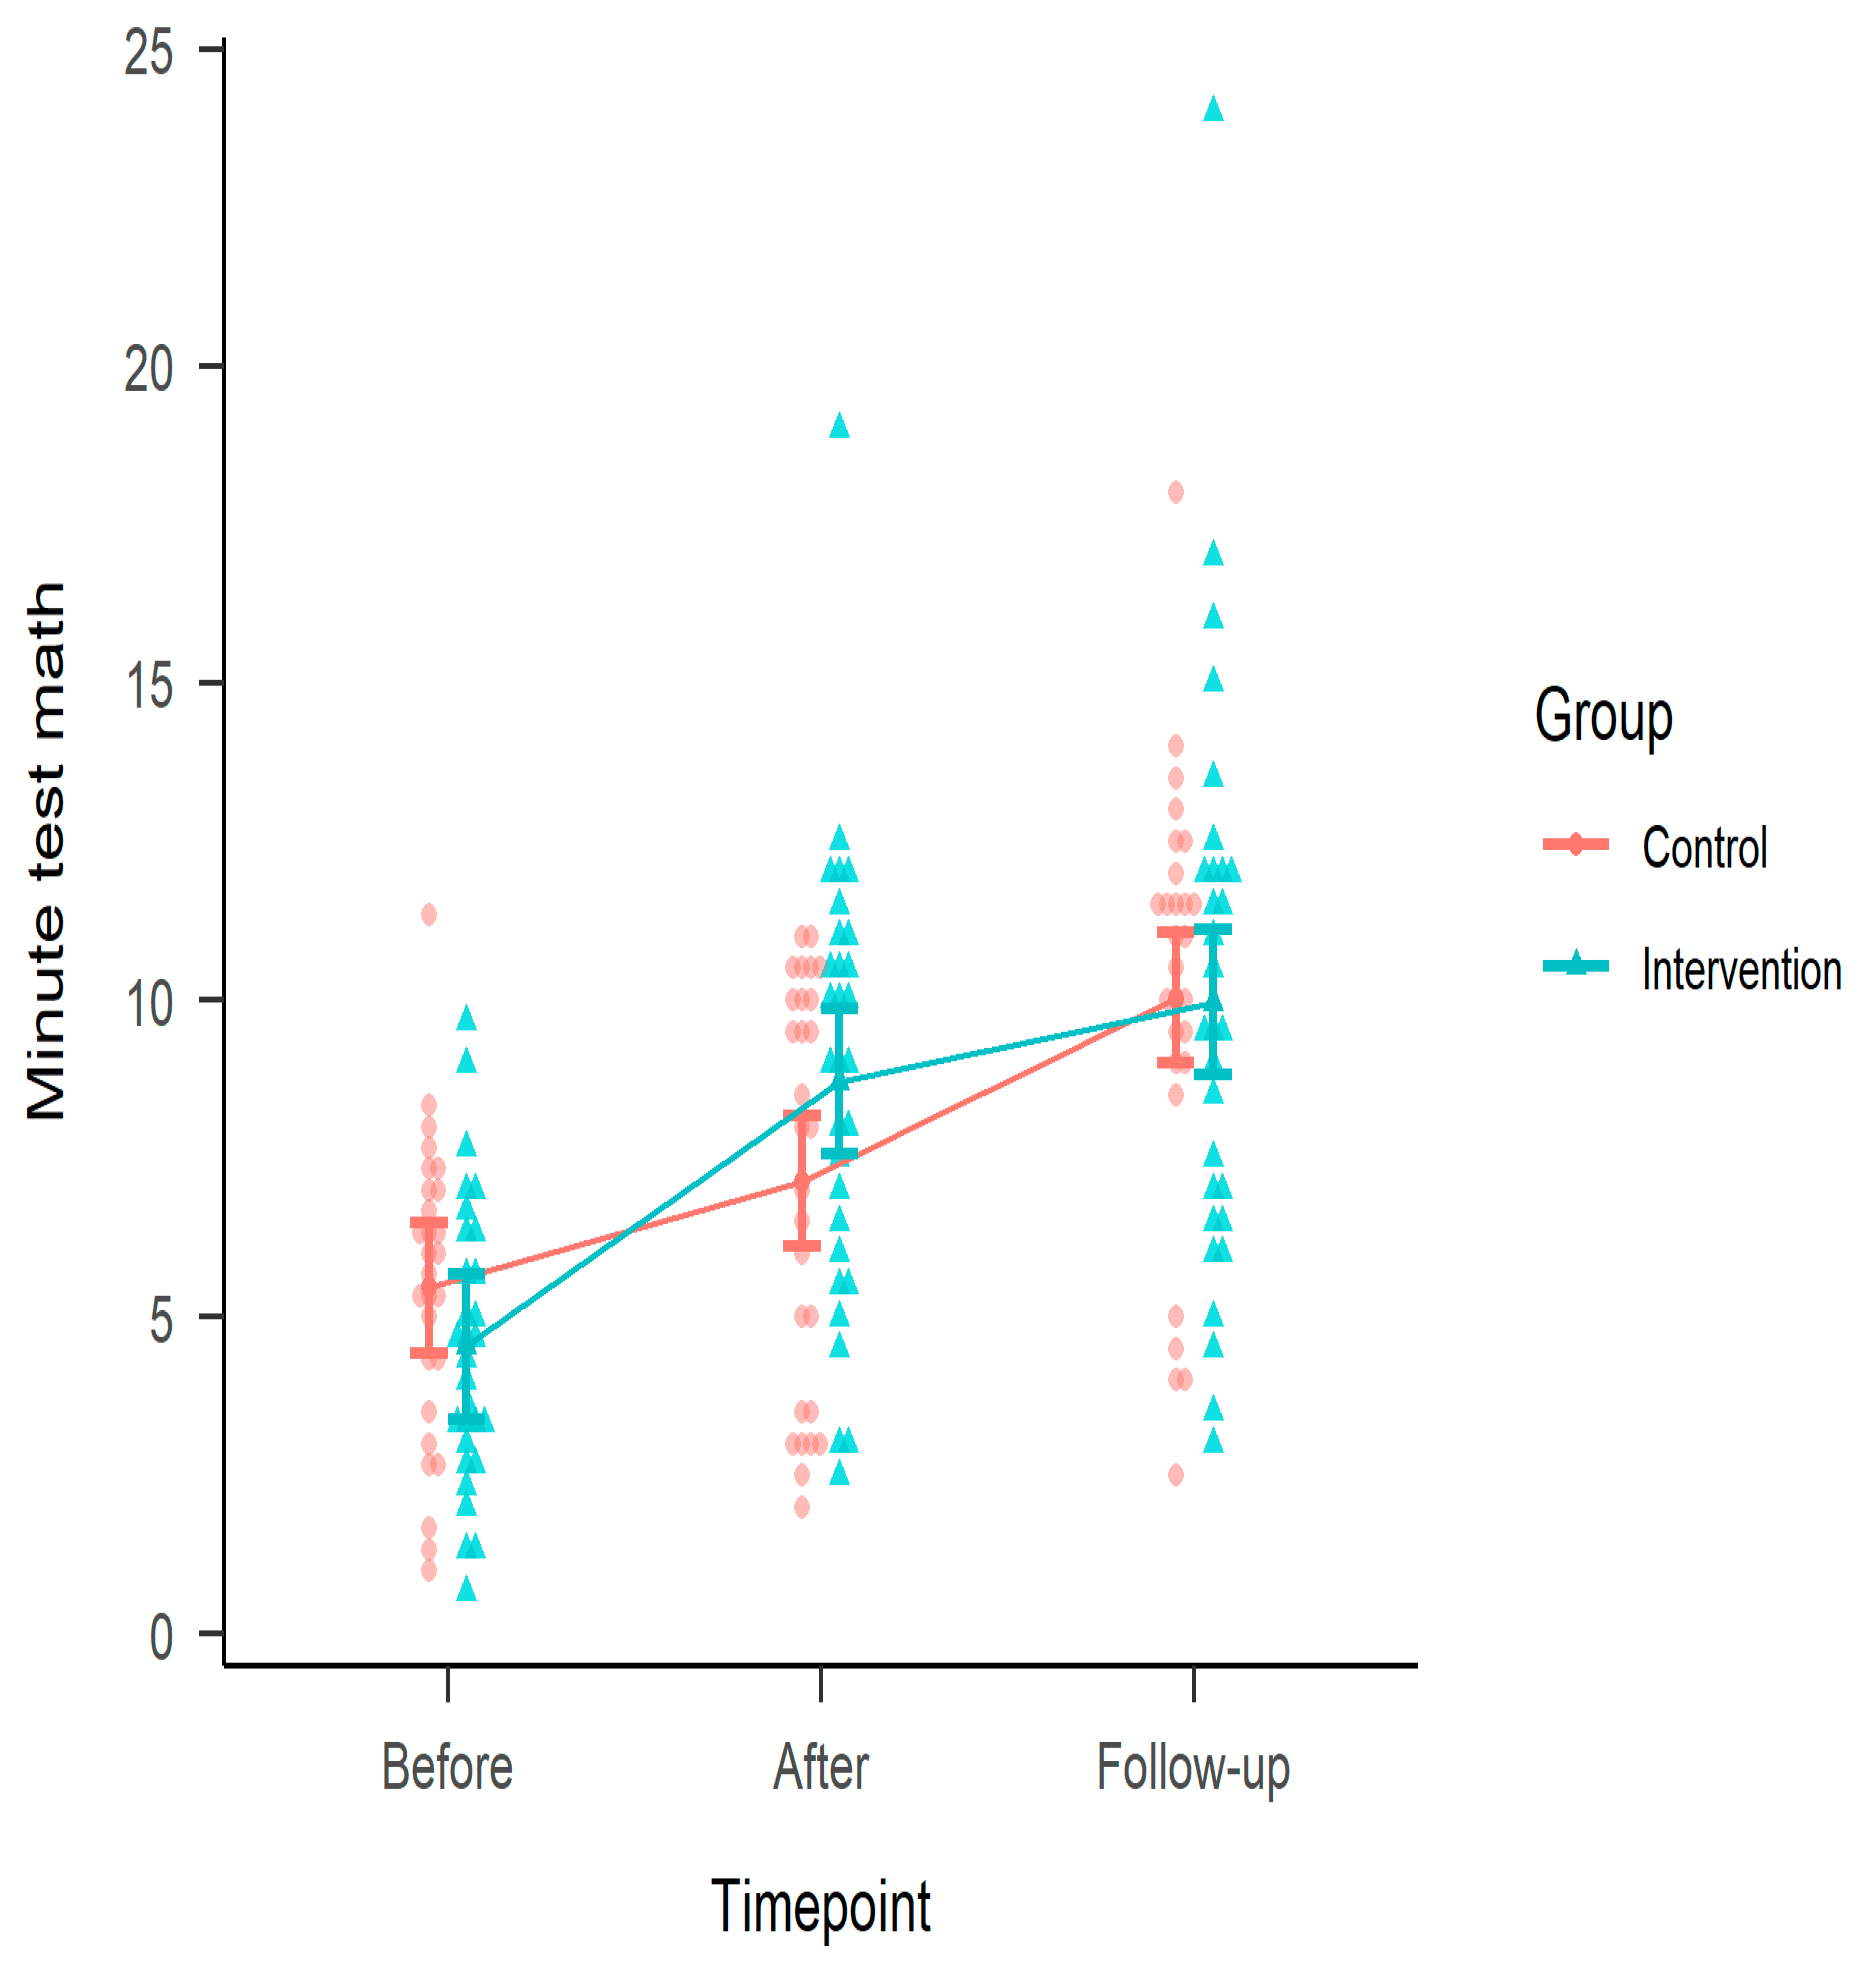
For the minute test mathematics (Figure 8), the planned contrast with the pre-test score as a covariate in a robust regression showed a difference between groups at follow-up ∆M = 0.57, 95% CI [−0.87, ∞], t(55) = 0.65, p = 0.26, Cohen’s d = 0.17, 95% CI [−0.27, ∞].
In all, only the effect for conceptual knowledge was significant at follow-up, even if problem solving was close (p = 0.06). Compared to the immediate intervention’s large to medium effects directly after the intervention (arithmetic calculation ∆M = 2.09, 95% CI [0.82, ∞], t(59) = 2.71, p = 0.00, Cohen’s d = 0.63, 95% CI [0.25, ∞], conceptual knowledge ∆M = 1.71, 95% CI [0.42, ∞], t(59) = 2.17, p = 0.02, Cohen’s d = 0.59, 95% CI [0.14, ∞], problem solving ∆M = 1.53, 95% CI [0.85, ∞], t(59) = 3.70, p = 0.00, Cohen’s d = 0.98, 95% CI [0.54, ∞], and the minute test math ∆M = 2.12, 95% CI [1.08, ∞], t(59) = 3.35, p = 0.00, Cohen’s d = 0.85, 95% CI [0.43, ∞]), the effect sizes at follow-up were approximately 40% in magnitude and, on average, small Cohen’s classification of effect sizes.

4. Discussion

Although well-planned and systematically implemented, reading and mathematics interventions may yield immediate positive effects; these gains often diminish or even disappear over time. This phenomenon is consistently supported by previous intervention studies and systematic reviews (Bailey et al., 2020; Dietrichson et al., 2021; Hassler Hallstedt et al., 2018; Suggate, 2016) and reflected in the present study. Evaluating educational intervention programs presents significant challenges, particularly when it comes to assessing their long-term impact through longitudinal follow-up studies. Our approach was designed to fulfill at least four key criteria for effective early reading and mathematics interventions (e.g., Clarke et al., 2015; Gersten et al., 2020). First, instruction was delivered intensively. Second, the studies applied randomized controlled trial designs to ensure internal validity and reliability of the findings. Third, the instructional content was grounded in contemporary theoretical frameworks guiding current research in reading and mathematics interventions. Finally, implementation across multiple schools, teachers, and counties reduced the risk of contamination and enhanced the generalizability of the results. We also adhered to Bailey et al.’s (2017) principles of choosing foundational skills as the interventions’ target. Given fading effects one year after initially successful interventions, our research raises the question of how to boost post-intervention gains and make these efforts sustainable in later grades.

4.1. The Reading Intervention

This study’s results are important in two ways. First, it contributes to the limited body of longitudinal, randomized controlled trials (RCTs) on supplemental reading programs for children at risk of early reading difficulties. In line with previous findings, our results suggest that the effects of such interventions often diminish within one year (Dietrichson et al., 2021; Suggate, 2016). While our findings indicate that intensive phonics instruction for at-risk children may yield short-term gains, they also suggest that these gains may not be sufficient to consolidate and maintain improvements beyond the immediate post-intervention period.
Notably, the intervention group significantly differed from controls on the 1-minute speeded reading fluency test. They did not show comparable sustainability at the norm-referenced word recognition outcome measure, which may be due to increased word length and complexity in the latter test, a restricting factor for word recognition (Barton et al., 2014). It shows that at the orthographic level of complexity of words trained in the intervention program, the students maintained and increased their fluency in word reading, outperforming controls with a medium effect size one year later. In semi-transparent orthographies, difficulty establishing sufficient speed is typically evident in struggling readers (Seymour et al., 2003). The systematic word decoding practice paired with repeated encounters with regularly spelled words seem to have supported fluency development, with no transfer to longer and irregular words where reading was comparable with controls.
The long-term outcome on the reading comprehension test should be viewed in relation to the intervention content, which did not explicitly target reading comprehension. However, even exclusively code-oriented instruction effectively enhances early reading comprehension (Denton et al., 2022). The intensive intervention’s immediate effect was indicative of such an early impact.
Second, the study highlights the importance of moving beyond traditional pre–post designs that focus exclusively on instructional content and methods of the intervention to also consider the scope and procedures of classroom reading instruction. Following Bailey et al.’s (2017) recommendations for sustainable interventions, our program targeted foundational skills that are amenable to instruction. However, the necessity of the intervention for achieving efficient word reading remains ambiguous, as its supplemental nature meant that its content closely mirrored that of core classroom instruction.
Some research suggests that when supplemental reading interventions are well-aligned with classroom instruction, students derive greater benefit (Wonder-McDowell et al., 2011). During the first and second years of reading instruction, the intervention content closely resembled the alphabetic skills taught in mainstream classrooms (Swedish National Agency for Education, 2022), which may have contributed to the substantial acceleration in code-based reading skills observed immediately after the intervention. By second grade, however, most learners of Swedish—a semi-transparent orthography—have typically mastered basic word reading with accuracy and fluency (Furnes & Samuelsson, 2011; Seymour et al., 2003). At this stage, general instruction increasingly emphasizes text fluency and reading comprehension. It is therefore plausible that the alignment between the intervention and classroom instruction diminished during the follow-up year, reducing opportunities for rehearsal and maintenance of previously acquired skills. This misalignment is a known factor contributing to the fading of intervention effects (Bailey, 2019).
We followed students through the autumn of third grade, a period in Sweden that typically does not involve changes in classroom teachers or peer groups compared to first grade. Thus, internal, and external changes due to maturation and continued instruction at more advanced curriculum levels were expected, and reading progress in both groups was anticipated during the post-intervention year. The improvement observed in the control group is therefore interpreted as a catch-up effect, relative to the continued progress in the intervention group.
To enhance the sustainability of intervention effects, incorporating an additional booster period with weekly sessions appears promising. Such an approach—focused on repetition and application of learned content—has shown positive outcomes for students with reading difficulties (P. M. Nelson et al., 2021). We tentatively interpret our mixed results as indicative of a divergence between the content delivered during the intervention and the literacy demands encountered in third-grade classrooms. Even intensive interventions may struggle to compete with the cumulative impact of daily classroom instruction, particularly when that instruction overlaps with early literacy content critical for sustaining intervention gains.

4.2. The Mathematics Intervention

At follow-up, students in the intervention group continued to outperform the program controls across all three outcome measures, although the differences in arithmetic calculation and problem-solving were no longer statistically significant. Conceptual knowledge was the single area where intervention participants significantly differed from controls at follow-up. These skills are important as the understanding of number relations and procedures is an integral part of arithmetic competency and problem-solving (Geary, 2004; Rittle-Johnson & Koedinger, 2009). While we aimed to adhere to the criteria outlined by Bailey et al. (2017) for sustainable intervention design—namely, targeting malleable skills that are unlikely to develop spontaneously in the control condition—the results suggest that the intervention group developed a robust understanding of numerical concepts. This conceptual knowledge of early numeracy not only resisted decline or convergence with the control group but continued to progress at an elevated level.
The outcome observed for arithmetic calculation was plausible, given that the composition and decomposition of number combinations constitute core instructional content in second grade (Swedish National Agency for Education, 2022). Consequently, all students—regardless of intervention status—would have received classroom instruction emphasizing foundational number operations, which likely attenuated group differences. The primary distinction between the intervention and control groups during the training period was probably the intensity of practice, particularly the provision of immediate teacher feedback and the structured, repeated engagement with number combinations.
A straightforward interpretation of the findings on word problem-solving is that this domain represents a complex area to target (Xin & Jitendra, 1999). Another interpretation is that a noticeable discrepancy emerged between the relatively simple word problems practiced during the intervention and the more complex tasks included in the outcome assessment, particularly evident at follow-up. The assessment required a higher level of expertise in both conceptualizing the mathematical content and selecting appropriate problem-solving strategies than what were emphasized during the intervention. In the program, word problems primarily relied on the application of number combination sentences that had been routinely practiced during lessons. It is well established that alignment between the content of an intervention and the outcome measures typically results in higher effect sizes (Slavin & Madden, 2011).
Alignment with classroom instruction is known to enhance the effectiveness of supplemental mathematics instruction (Fuchs et al., 2012). For comparison, it has been suggested that mathematics learning and development are more dependent on teacher instruction than reading. Remediation in early mathematics is moreover inherently more complex due to the nature of mathematical development, which—unlike reading—features both sequential and parallel progression across various domains (Alexander et al., 2001; Fuchs et al., 2012). The potential alignment between core classroom instruction and the content of the present intervention, particularly in problem-solving, may have been limited both during the intervention period and, more critically, in the subsequent school year.
Bailey et al. (2014) argued that longitudinal studies examining the relationship between early and later mathematics achievements often fail to account for stable individual factors that influence mathematical learning, such as working memory, attention, and motivation. This oversight may lead to inflated expectations regarding the long-term impact of early interventions. While there is substantial evidence supporting the timely implementation of interventions, our findings underscore the importance of monitoring students’ ongoing progress and providing sustained support.

4.3. Continuous Support

Both interventions were initiated and conducted during the COVID-19 pandemic (2020–2022), which hindered our ability to systematically monitor fidelity of implementation. The study involved 21 schools, over 40 classroom teachers, and 13 special education teachers. Regularly assessing teaching practices and their impact on student learning in reading and mathematics twelve months after the intervention is important yet remains a challenge beyond our full control. These limitations are valid and must be acknowledged, as they reflect the inherent difficulties of conducting large-scale intervention research with young students in mainstream schools. Thus, why immediate intervention effects gradually diminished over time cannot be fully accounted for in this study.
The extent to which elements of the intervention programs were reintegrated into educational support within participating schools remains unknown. Special education teachers were not blinded to group assignments and were involved in both classroom instruction and small-group teaching, including teaching some control group students (following ethical principles outlined by the Swedish Ethical Review Authority). It is therefore plausible that instructional techniques and materials from the intervention were sustained during the follow-up year in special education provision. Notably, approximately 20% of participating schools had students from both intervention cohorts (Cohorts 1 and 2), potentially increasing the likelihood of informal dissemination of intervention practices. Such diffusion, often referred to as contamination in intervention research, may have contributed to learning gains among control group students (Dowker, 2016; Lemons et al., 2014).
For individual students, the nature and focus of classroom instruction in mathematics and reading following an intensive intervention are critical. Schools should be encouraged to align supplemental support with ongoing classroom instruction (Bailey et al., 2020; P. M. Nelson et al., 2021; Wonder-McDowell et al., 2011). This seems to be important considering instructional content and less so considering teaching materials (Foorman et al., 2018). However, this alignment is complex, as general classroom instruction is not uniform and may not adequately address the diverse needs of students who, by the end of early elementary school, can differ by several grades in achievement (Rambo-Hernandez et al., 2022). In addition, continuous support must be sensitive to acknowledging what students have learned to avoid merely repeating but extending their knowledge and skills post-intervention (Bailey et al., 2020). While classroom observations could have provided insight into instructional strategies used with both intervention and control students during second and third grade, no validated observation instruments specific to mathematics or reading currently exist in Sweden. Documenting the nature of supplemental instruction received by control group students—including any educational support—would help classify the counterfactual condition more accurately, distinguishing it from a true “business-as-usual” scenario (Denton et al., 2014; Lemons et al., 2014). This, in turn, would enhance the interpretation of differences and similarities in instructional exposure across groups.
To sustain the gains achieved through intervention, continued progress monitoring after program completion is recommended. Such monitoring can help identify students who require ongoing support and assess the durability of intervention effects (G. Nelson & Powell, 2018; P. M. Nelson et al., 2021). This approach aligns with the Response to Intervention (RTI) framework, which emphasizes cycles of intensified support based on students’ responsiveness to instruction and systematic progress monitoring (Mellard et al., 2010). However, RTI has not been fully implemented in Scandinavian contexts (Nilvius et al., 2021), and the use of structured intervention programs, data-driven monitoring, and curriculum-based assessments varies considerably across Swedish municipalities (Nilvius & Svensson, 2022). Given the importance of instructional continuity, teachers should be actively involved in planning for post-intervention support. In tiered support systems, supplemental instruction is intended to help students reach a level where they can benefit from core instruction (Fuchs et al., 2017). However, in the context of intervention studies, it is also important to consider the general rate of academic progress between second and third grade. In a North American context, average annual gains during this period have been reported as 0.60 for reading and 0.89 (Hedges’ g) for mathematics on standardized assessments (Bloom et al., 2008).

4.4. To Sum Up

Our findings raise important questions relevant to the field of intervention research and special education practitioners about what constitutes an adequate response to intervention, how its impact should be interpreted considering general developmental benchmarks, and whether conventional effect size thresholds are appropriate for educational interventions (Kraft, 2020). Specifically, a call for continuous monitoring and support seems warranted on completion of extensive intervention efforts. A theoretical implication from the one-year follow up is the need for subgroup analyses (Peng et al., 2020) to explore potential moderating factors influencing intervention outcomes. A further proposition is a wider research focus on environmental and implementation factors in longitudinal reading and mathematics intervention studies, expanding data collection beyond academic outcome measures. In future studies, we aim to incorporate both quantitative and qualitative fidelity assessments to better understand the implementation conditions under which interventions are most effective. Specifically, we propose the addition of intensive booster sessions 4–6 months post-intervention, which may help mitigate fade-out effects by reintroducing core content in alignment with grade-level curriculum.

Author Contributions

Conceptualization, H.L.-S., H.D., Å.E., J.S. and S.S.; Methodology, H.L.-S., H.D., Å.E., J.S. and S.S.; Formal analysis, H.D.; Investigation, H.L.-S., H.D., Å.E., J.S. and S.S.; Data curation, H.D.; Writing—original draft, H.L.-S., H.D. and S.S.; Writing—review & editing, H.L.-S., H.D., Å.E., J.S. and S.S.; Visualization, H.D.; Supervision, H.D., Å.E., J.S. and S.S.; Project administration, H.L.-S., Å.E., J.S. and S.S.; Funding acquisition, H.D., Å.E., J.S. and S.S. All authors have read and agreed to the published version of the manuscript.

Funding

This research was funded by The Swedish Research Council, grant number 2019-03873.

Institutional Review Board Statement

The study was conducted in accordance with the Declaration of Helsinki and approved by the Swedish National Research Ethics Committee (protocol code: 2019-04084; date of approval: 21 October 2019).

Informed Consent Statement

Informed consent was obtained from all subjects involved in the study.

Data Availability Statement

The original data presented in the study are openly available in OSF at https://osf.io/gkhc2/ (accessed on 29 August 2025).

Conflicts of Interest

The authors declare no conflicts of interest. The funders had no role in the design of the study; in the collection, analyses, or interpretation of data; in the writing of the manuscript; or in the decision to publish the results.

Abbreviations

The following abbreviations are used in this manuscript:
RCTRandomized controlled trial
RTIResponse to intervention

Appendix A

Figure A1. Adapted CONSORT diagram illustrating the flow of participants through each stage of the intervention studies.
Education 15 01678 g0a1

References

  1. Alexander, K. L., Entwisle, D. R., & Olson, L. S. (2001). Schools, achievement, and inequality: A seasonal perspective. Educational Evaluation and Policy Analysis, 23(2), 171–191. [Google Scholar] [CrossRef]
  2. Aust, F., & Barth, M. (2020). papaja: Create APA manuscripts with R Markdown [Manual]. Available online: https://github.com/crsh/papaja (accessed on 8 December 2025).
  3. Bailey, D. (2019). Explanations and implications of diminishing intervention impacts across time. In D. Geary, K. Koepke, & D. Berch (Eds.), Cognitive foundations for improving mathematical learning (pp. 321–346). Academic Press. [Google Scholar] [CrossRef]
  4. Bailey, D., Duncan, G., Odgers, C., & Yu, W. (2017). Persistence and fadeout in the impacts of child and adolescent interventions. Journal of Research on Educational Effectiveness, 10(1), 7–39. [Google Scholar] [CrossRef]
  5. Bailey, D., Fuchs, L., Gilbert, J., Geary, D., & Fuchs, D. (2020). Prevention: Necessary but insufficient? A 2-year follow-up of an effective first-grade mathematics intervention. Child Development, 91(2), 382–400. [Google Scholar] [CrossRef]
  6. Bailey, D., Nguyen, T., Jenkins, J. M., Domina, T., Clements, D. H., & Sarama, J. S. (2016). Fadeout in an early mathematics intervention: Constraining content or preexisting differences? Developmental Psychology, 52(9), 1457–1469. [Google Scholar] [CrossRef]
  7. Bailey, D., Watts, T., Littlefield, A., & Geary, D. (2014). State and trait effects on individual differences in children’s mathematical development. Psychological Science, 25(11), 2017–2026. [Google Scholar] [CrossRef]
  8. Barton, J. J. S., Hanif, H. M., Eklinder Björnström, L., & Hills, C. (2014). The word-length effect in reading: A review. Cognitive Neuropsychology, 31(5–6), 378–412. [Google Scholar] [CrossRef]
  9. Blachman, B., Schatschneider, C., Fletcher, J., Francis, D., Clonan, S., Shaywitz, B., & Shaywitz, S. (2004). Effects of intensive reading remediation for second and third graders and a 1-year follow-up. Journal of Educational Psychology, 96(3), 444–461. [Google Scholar] [CrossRef]
  10. Blachman, B., Schatschneider, C., Fletcher, J., Murray, M., Munger, K., & Vaughn, M. (2014). Intensive reading remediation in grade 2 or 3: Are there effects a decade later? Journal of Educational Psychology, 106(1), 46–57. [Google Scholar] [CrossRef]
  11. Bloom, H. S., Hill, C. J., Black, A. R., & Lipsey, M. W. (2008). Performance trajectories and performance gaps as achievement effect-size benchmarks for educational interventions. Journal of Research on Educational Effectiveness, 1(4), 289–328. [Google Scholar] [CrossRef]
  12. Clarke, B., Doabler, C. T., Nelson, N. J., & Shanley, C. (2015). Effective instructional strategies for kindergarten and first-grade students at risk in mathematics. Intervention in School and Clinic, 50(5), 257–265. [Google Scholar] [CrossRef]
  13. Cohen, J. (1988). Statistical power analysis for the behavioral sciences (2nd ed.). Laurence Erlbaum Associates. [Google Scholar]
  14. Daniel, J., Capin, P., & Steinle, P. (2021). A synthesis of the sustainability of remedial reading intervention effects for struggling adolescent readers. Journal of Learning Disabilities, 54(3), 170–186. [Google Scholar] [CrossRef]
  15. Denton, C. A., Fletcher, J. M., Taylor, W. P., Barth, A. E., & Vaughn, S. (2014). An experimental evaluation of guided reading and explicit interventions for primary-grade students at-risk for reading difficulties. Journal of Research on Educational Effectiveness, 7(3), 268–293. [Google Scholar] [CrossRef]
  16. Denton, C. A., Hall, C., Cho, E., Cannon, G., Scammacca, N., & Wanzek, J. (2022). A meta-analysis of the effects of foundational skills and multicomponent reading interventions on reading comprehension for primary-grade students. Learning and Individual Differences, 93, 102062. [Google Scholar] [CrossRef]
  17. Dietrichson, J., Filges, T., Seerup, J. K., Klokker, R. H., Viinholt, B. C. A., Bøg, M., & Eiberg, M. (2021). Targeted school-based interventions for improving reading and mathematics for students with or at risk of academic difficulties in Grades K-6: A systematic review. Campbell Systematic Reviews, 17(2), e1152. [Google Scholar] [CrossRef] [PubMed]
  18. Dowker, A. (2016). Factors that influence improvement in numeracy, reading, and comprehension in the context of a numeracy intervention. Frontiers in Psychology, 7, 1929. [Google Scholar] [CrossRef] [PubMed]
  19. Elwér, Å., Fridolfsson, I., Samuelsson, S., & Wiklund, C. (2016). Läst. Hogrefe. [Google Scholar]
  20. Foorman, B. R., Herrera, S., & Dombek, J. (2018). The relative impact of aligning Tier 2 intervention materials with classroom core reading materials in grades K–2. The Elementary School Journal, 118(3), 477–504. [Google Scholar] [CrossRef]
  21. Foster, W. A., & Miller, M. (2007). Development of the literacy achievement gap: A longitudinal study of kindergarten through third grade. Language, Speech, and Hearing Services in Schools, 38(3), 173–181. [Google Scholar] [CrossRef]
  22. Fuchs, L. S., Fuchs, D., & Compton, D. L. (2012). The early prevention of mathematics difficulty: Its power and limitations. Journal of Learning Disabilities, 45(3), 257–269. [Google Scholar] [CrossRef]
  23. Fuchs, L. S., Fuchs, D., & Malone, A. S. (2017). The taxonomy of intervention intensity. Teaching Exceptional Children, 50(1), 35–43. [Google Scholar] [CrossRef]
  24. Furnes, B., & Samuelsson, S. (2011). Phonological awareness and rapid automatized naming predicting early development in reading and spelling: Results from a cross-linguistic longitudinal study. Learning and Individual Differences, 21(1), 85–95. [Google Scholar] [CrossRef]
  25. Geary, D. C. (2004). Mathematics and learning disabilities. Journal of Learning Disabilities, 37(1), 4–15. [Google Scholar] [CrossRef] [PubMed]
  26. Gersten, R., Haymond, K., Newman-Gonchar, R., Dimino, J., & Jayanthi, M. (2020). Meta-analysis of the impact of reading interventions for students in the primary grades. Journal of Research on Educational Effectiveness, 13(2), 401–427. [Google Scholar] [CrossRef]
  27. Hall, C., Dahl-Leonard, K., Cho, E., Solari, E. J., Capin, P., Conner, C. L., Henry, A. R., Cook, L., Hayes, L., Vargas, I., & Richmond, C. L. (2022). Forty years of reading intervention research for elementary students with or at risk for dyslexia: A systematic review and meta-analysis. Reading Research Quarterly, 58(2), 285–312. [Google Scholar] [CrossRef]
  28. Hassler Hallstedt, M., Klingberg, T., & Ghaderi, A. (2018). Short and long-term effects of a mathematics tablet intervention for low performing second graders. Journal of Educational Psychology, 110, 1127–1148. [Google Scholar] [CrossRef]
  29. Hulme, C., West, G., Rios Diaz, M., Hearne, S., Korell, C., Duta, M., & Snowling, M. J. (2025). The Nuffield Early Language Intervention (NELI) programme is associated with lasting improvements in children’s language and reading skills. Journal of Child Psychology and Psychiatry. Epub ahead of print. [Google Scholar] [CrossRef] [PubMed]
  30. Kang, C., Duncan, G., Clements, D., Sarama, J., & Bailey, D. (2019). The roles of transfer of learning and forgetting in the persistence and fadeout of early childhood mathematics interventions. Journal of Educational Psychology, 111(4), 590–603. [Google Scholar] [CrossRef] [PubMed]
  31. Kraft, M. A. (2020). Interpreting effect sizes of education interventions. Educational Researcher, 49(4), 241–253. [Google Scholar] [CrossRef]
  32. Lemons, C. J., Fuchs, D., Gilbert, J. K., & Fuchs, L. S. (2014). Evidence-based practices in a changing world: Reconsidering the counterfactual in education research. Educational Researcher, 43(5), 242–252. [Google Scholar] [CrossRef]
  33. Lenth, R. V. (2021). Emmeans: Estimated marginal means, aka least-squares means [manual]. Available online: https://CRAN.R-project.org/package=emmeans (accessed on 8 December 2025).
  34. Lindström-Sandahl, H., Elwér, Å., Samuelsson, S., & Danielsson, H. (2023). Effects of a phonics intervention in a randomized controlled study in Swedish second-grade students at risk of reading difficulties. Dyslexia, 29(4), 290–311. [Google Scholar] [CrossRef]
  35. Lindström-Sandahl, H., Samuelsson, J., Danielsson, H., Samuelsson, S., & Elwér, Å. (2024). A randomized controlled study of a second grade numeracy intervention with Swedish students at-risk of mathematics difficulties. British Journal of Educational Psychology, 94, 1052–1071. [Google Scholar] [CrossRef] [PubMed]
  36. McIntosh, A. (2008). Förstå och använda tal—En handbok [Understand and use numbers—A handbook]. Göteborgs Universitet, Nationellt Centrum för Matematikundervisning (NCM). [Google Scholar]
  37. Mellard, D., McKnight, M., & Jordan, J. (2010). RTI tier structures and instructional intensity. Learning Disabilities Research & Practice, 25(4), 217–225. [Google Scholar] [CrossRef]
  38. Neitzel, A., Lake, C., Pellegrini, M., & Slavin, R. (2021). A synthesis of quantitative research on programs for struggling readers in elementary schools. Reading Research Quarterly, 57(1), 149–179. [Google Scholar] [CrossRef]
  39. Nelson, G., & Powell, S. R. (2018). A systematic review of longitudinal studies of mathematics difficulty. Journal of Learning Disabilities, 51(6), 523–539. [Google Scholar] [CrossRef]
  40. Nelson, P. M., Klingbeil, D. A., Van Norman, E. R., & Parker, D. C. (2021). A cluster randomized controlled trial of brief follow-up practice sessions on intervention maintenance. Journal of School Psychology, 88, 31–46. [Google Scholar] [CrossRef]
  41. Nilvius, C., Carlsson, R., Fälth, L., & Nordström, T. (2021). Tier 2 interventions within the RtI-model for developing students’ word decoding—A systematic review and meta-analysis. Cogent Education, 8(1), 1994105. [Google Scholar] [CrossRef]
  42. Nilvius, C., & Svensson, I. (2022). Efficacy evaluation of a full scale response to intervention program for enhancing student reading abilities in a Swedish school context. Reading and Writing, 35(5), 1239–1264. [Google Scholar] [CrossRef]
  43. Peng, P., Fuchs, D., Fuchs, L. S., Cho, E., Elleman, A. M., Kearns, D. M., Patton, S., III, & Compton, D. L. (2020). Is “response/no response” too simple a notion for RTI frameworks? Exploring multiple response types with latent profile analysis. Journal of Learning Disabilities, 53(6), 454–468. [Google Scholar] [CrossRef]
  44. Pontoppidan, M., Keilow, M., Dietrichson, J., Solheim, O. J., Opheim, V., Gustafson, S., & Andersen, S. C. (2018). Randomised controlled trials in Scandinavian educational research. Educational Research, 60(3), 311–335. [Google Scholar] [CrossRef]
  45. Powell, S. R., Berry, K. A., Fall, A. M., Roberts, G., Barnes, M. A., Fuchs, L. S., Martinez-Lincoln, A., Forsyth, S. R., Vinsonhaler, R. K., Benz, S. A., & Zaparolli, B. L. (2022). Does word-problem performance maintain? Follow-up one year after implementation of a word-problem intervention. Journal of Research on Educational Effectiveness, 15(1), 52–77. [Google Scholar] [CrossRef]
  46. Rambo-Hernandez, K., Makel, M., Peters, S., & Worley, C. (2022). Differential return on investment: Academic growth in mathematics and reading based on initial performance. British Journal of Educational Psychology, 92(3), 817–842. [Google Scholar] [CrossRef]
  47. R Core Team. (2021). R: A language and environment for statistical computing [Manual]. R Foundation for Statistical Computing. Available online: https://www.R-project.org/ (accessed on 8 December 2025).
  48. Rittle-Johnson, B., & Koedinger, K. (2009). Iterating between lessons on concepts and procedures can improve mathematics knowledge. British Journal of Educational Psychology, 79, 483–500. [Google Scholar] [CrossRef] [PubMed]
  49. RStudio Team. (2022). RStudio: Integrated development environment for R [Manual]. RStudio, PBC. Available online: http://www.rstudio.com/ (accessed on 8 December 2025).
  50. Schneider, B., & Bradford, L. (2020). What we are learning about fade-out of intervention effects: A commentary. Psychological Science in the Public Interest, 21(2), 50–54. [Google Scholar] [CrossRef]
  51. Seymour, P. H. K., Aro, M., Erskine, J. M., & Collaboration with COST Action A8 Network. (2003). Foundation literacy acquisition in European orthographies. British Journal of Psychology, 94(2), 143–174. [Google Scholar] [CrossRef]
  52. SFS. (2010). Skollagen 2010:800 [Education Act]. Available online: https://www.riksdagen.se/sv/dokument-lagar/dokument/svensk-forfattningssamling/skollag-2010800_sfs-2010-800 (accessed on 8 December 2025).
  53. Singmann, H., Bolker, B., Westfall, J., Aust, F., & Ben-Shachar, M. S. (2021). Afex: Analysis of factorial experiments [Manual]. Available online: https://CRAN.R-project.org/package=afex (accessed on 8 December 2025).
  54. Slavin, R., & Madden, N. (2011). Measures inherent to treatments in program effectiveness reviews. Journal of Research on Educational Effectiveness, 4(4), 370–380. [Google Scholar] [CrossRef]
  55. Suggate, S. P. (2016). A meta-analysis of the long-term effects of phonemic awareness, phonics, fluency, and reading comprehension interventions. Journal of Learning Disabilities, 49(1), 77–96. [Google Scholar] [CrossRef]
  56. Swedish National Agency for Education. (2022). Läroplan för grundskolan, förskoleklassen och fritidshemmet 2022 [Curriculum for the compulsory school, preschool class and the leisure-time centre 2022]. Skolverket. [Google Scholar]
  57. Vadasy, P., Sanders, E., & Abbott, R. (2008). Effects of supplemental early reading intervention at 2-year follow up: Reading skill growth patterns and predictors. Scientific Studies of Reading, 12(1), 51–89. [Google Scholar] [CrossRef]
  58. van Buuren, S., & Groothuis-Oudshoorn, K. (2011). mice: Multivariate imputation by chained equations in R. Journal of Statistical Software, 45(3), 1–67. Available online: https://www.jstatsoft.org/v45/i03/ (accessed on 8 December 2025). [CrossRef]
  59. Vaughn, S., Linan-Thompson, S., & Hickman, P. (2003). Response to instruction as a means of identifying students with reading/learning disabilities. Exceptional Children, 69(4), 391–409. [Google Scholar] [CrossRef]
  60. Venables, W. N., & Ripley, B. D. (2002). Modern applied statistics with S (4th ed.). Springer. Available online: https://www.stats.ox.ac.uk/pub/MASS4/ (accessed on 8 December 2025).
  61. Vukovic, R., & Siegel, L. (2010). Academic and cognitive characteristics of persistent mathematics difficulty from first through fourth grade. Learning Disabilities Research & Practice, 25(1), 25–38. [Google Scholar] [CrossRef]
  62. Wanzek, J., & Vaughn, S. (2008). Response to varying amounts of time in reading intervention for students with low response to intervention. Journal of Learning Disabilities, 41(2), 126–142. [Google Scholar] [CrossRef] [PubMed]
  63. Wanzek, J., Vaughn, S., Scammacca, N., Gatlin, B., Walker, M., & Capin, P. (2016). Meta-analyses of the effects of tier 2 type reading interventions in grades k-3. Educational Psychology Review, 28, 551–576. [Google Scholar] [CrossRef] [PubMed]
  64. Watts, T., Bailey, D., & Li, C. (2019). Aiming further: Addressing the need for high-quality longitudinal research in education. Journal of Research on Educational Effectiveness, 12(4), 648–658. [Google Scholar] [CrossRef]
  65. Wickham, H., Averick, M., Bryan, J., Chang, W., McGowan, L. D. A., François, R., Grolemund, G., Hayes, A., Henry, L., Hester, J., & Kuhn, M. (2019). Welcome to the tidyverse. Journal of Open Source Software, 4(43), 1686. [Google Scholar] [CrossRef]
  66. Wilkinson, G. S., & Robertson, G. J. (2006). Wide range achievement test 4. Psychological Assessment Resources. [Google Scholar]
  67. Williams, R., Citkowicz, M., Miller, D., Lindsay, J., & Walters, K. (2022). Heterogeneity in mathematics intervention effects: Evidence from a meta-analysis of 191 randomized experiments. Journal of Research on Educational Effectiveness, 15(3), 584–634. [Google Scholar] [CrossRef]
  68. Wolff, U. (2011). Effects of a randomised reading intervention study: An application of structural equation modelling. Dyslexia, 17(4), 298–311. [Google Scholar] [CrossRef]
  69. Wonder-McDowell, C., Reutzel, D. R., & Smith, J. A. (2011). Does instructional alignment matter? The Elementary School Journal, 112(2), 259–279. [Google Scholar] [CrossRef]
  70. Woodcock, R. N. (1987). Woodcock reading mastery tests—Revised examiners’ manual. American Guidance Service. [Google Scholar]
  71. Xin, Y. P., & Jitendra, A. K. (1999). The effects of instruction in solving mathematical word problems for students with learning problems: A meta-analysis. The Journal of Special Education, 32(4), 207–225. [Google Scholar] [CrossRef]
Figure 1. A plot on Word recognition at the 3 timepoints before the intervention, directly after the intervention and at the 1-year follow-up, for the intervention and the control group. Error bars represent 95% between-subject confidence intervals and dots show scores for individual participants.
Education 15 01678 g001
Figure 2. A plot on Word decoding at the 3 timepoints before the intervention, directly after the intervention and at the 1-year follow-up, for the intervention and the control group. Error bars represent 95% between-subject confidence intervals and dots show scores for individual participants.
Education 15 01678 g002
Figure 3. A plot on Reading comprehension at the 3 timepoints before the intervention, directly after the intervention and at the 1-year follow-up, for the intervention and the control group. Error bars represent 95% between-subject confidence intervals and dots show scores for individual participants.
Education 15 01678 g003
Figure 4. A plot on the Minute-test in reading at the 3 timepoints before the intervention, directly after the intervention and at the 1-year follow-up, for the intervention and the control group. Error bars represent 95% between-subject confidence intervals and dots show scores for individual participants.
Education 15 01678 g004
Figure 5. A plot on Arithmetic calculation at the 3 timepoints before the intervention, directly after the intervention and at the 1-year follow-up, for the intervention and the control group. Error bars represent 95% between-subject confidence intervals and dots show scores for individual participants.
Education 15 01678 g005
Figure 6. A plot on Conceptual knowledge at the 3 timepoints before the intervention, directly after the intervention and at the 1-year follow-up, for the intervention and the control group. Error bars represent 95% between-subject confidence intervals and dots show scores for individual participants.
Education 15 01678 g006
Figure 7. A plot on Problem-solving at the 3 timepoints before the intervention, directly after the intervention and at the 1-year follow-up, for the intervention and the control group. Error bars represent 95% between-subject confidence intervals and dots show scores for individual participants.
Education 15 01678 g007
Figure 8. A plot on the Minute-test in mathematics at the 3 timepoints before the intervention, directly after the intervention and at the 1-year follow-up, for the intervention and the control group. Error bars represent 95% between-subject confidence intervals and dots show scores for individual participants.
Education 15 01678 g008
Table 1. Median, mean, SD, and Cohen’s d for the reading tests for each group and timepoint. In addition, the improvement is also presented.
TestGroupBeforeAfterFollow-UpImprovement AfterImprovement Follow-Up
nMdnMSDnMdnMSDnMdnMSDMdnMSDMdnMSD
Minute test readingControls3419.1720.349.833425.2527.3710.573238.2537.349.776.087.030.7519.0817.011.80
Minute test readingIntervention3421.0021.629.013438.0035.3510.802946.5042.887.9717.0013.731.4625.5021.262.26
Reading comprehensionControls346.007.565.273414.0013.186.533319.0019.247.138.005.621.0613.0011.682.21
Reading comprehensionIntervention347.508.355.313417.0015.686.413023.0021.505.909.507.321.3815.5013.152.49
Word decodingControls3424.0024.4410.163431.5036.0914.453345.0047.7916.447.5011.651.1521.0023.352.31
Word decodingIntervention3425.5026.9410.063443.0042.4111.473056.0056.3016.8517.5015.471.5330.5029.362.90
Word recognitionControls3433.0037.0919.713350.0054.7625.833381.0084.2127.3817.0017.671.0148.0047.122.69
Word recognitionIntervention3437.0037.6215.063468.0065.0318.593089.0094.1724.2931.0027.411.5652.0056.553.22
Table 2. Median, mean, SD, and Cohen’s d for the mathematics tests for each group and timepoint. In addition, the improvement is also presented.
TestGroupBeforeAfterFollow-UpImprovement AfterImprovement Follow-Up
nMdnMSDnMdnMSDnMdnMSDMdnMSDMdnMSD
Arithmetic calculationControls287.006.753.23289.008.753.362813.5012.115.062.002.000.666.505.361.75
Arithmetic calculationIntervention317.006.192.873210.0010.384.572813.0013.325.003.004.181.376.007.132.33
Conceptual knowledgeControls303.003.803.18296.005.863.87289.009.184.753.002.060.766.005.381.97
Conceptual knowledgeIntervention323.003.472.18326.507.253.513011.0010.374.883.503.781.398.006.902.53
Minut test mathControls305.835.532.31298.007.313.022810.7510.043.442.171.780.794.924.512.00
Minut test mathIntervention324.174.462.19329.008.613.44299.5010.104.484.834.151.845.335.642.51
Problem-solvingControls309.009.072.20299.009.281.982811.0011.212.230.000.210.102.002.151.00
Problem-solvingIntervention329.008.342.093210.5010.342.553011.5011.872.421.502.000.932.503.521.64
Disclaimer/Publisher’s Note: The statements, opinions and data contained in all publications are solely those of the individual author(s) and contributor(s) and not of MDPI and/or the editor(s). MDPI and/or the editor(s) disclaim responsibility for any injury to people or property resulting from any ideas, methods, instructions or products referred to in the content.