


Abstract
According to the Movement Disorder Society Unified Parkinson’s Disease Rating Scale (MDS-UPDRS), Parkinson’s disease (PD) is the second most prevalent neurodegenerative disorder among older adults, surpassed only by Alzheimer’s disease. PD is characterized by a heterogeneous combination of motor and non-motor symptoms, with involuntary movements constituting a central clinical defining feature. The prodromal phase presents substantial diagnostic challenges, as early symptoms are often mild, nonspecific, and commonly misinterpreted because overt motor signs are absent. Significantly, these early alterations can precede formal diagnosis by up to two decades, highlighting the urgent need for effective early detection strategies. In this work, we propose a functional Magnetic Resonance Imaging (fMRI)-based image-processing and machine learning framework for early detection of PD. Statistical features are extracted to train a set of 25 machine learning kernels, from which the most accurate model is selected. We then apply the Minimum Redundancy Maximum Relevance (mRMR) algorithm to identify the most descriptive fMRI frames for each subject. We introduce a hierarchical classification strategy: an initial binary classification to distinguish control subjects from prodromal + PD cases, followed by a second binary classification to discriminate between Prodromal and PD. The experimental results demonstrate a maximum precision of % with 16 axial slices and % with a single slice, indicating the effectiveness of the preprocessing strategy and its potential as a non-invasive biomarker for early PD detection, even with reduced input data. These findings suggest that high classification performance can be achieved with a limited number of fMRI slices, facilitating data acquisition and reducing subject burden in clinical studies.
1. Introduction
Parkinson’s disease (PD) is the second most prevalent neurodegenerative disorder among older adults, after Alzheimer’s disease. Recent studies have pointed out a crucial factor in PD development: the early and progressive degeneration of dopaminergic neurons in the Substantia Nigra Pars compacta (SNc) [1]. This disease is part of a broader spectrum of neurodegenerative disorders, including Huntington’s disease, multiple sclerosis, and dementia with Lewy bodies. The main symptom of PD is an involuntary motor response. According to the Movement Disorder Society’s Unified Parkinson’s Disease Rating Scale (MDS-UPDRS) [2], PD is classified based on its stages of progression: Non-motor experiences of daily living (premotor), Motor experiences of daily living, Motor examination, and Motor complications. During the premotor phase , early detection is particularly challenging, as initial symptoms such as depression, insomnia, fatigue, and constipation are non-specific and often mistaken for other medical conditions [3,4]. Progression is closely linked to degeneration of dopaminergic neurons in the substantia nigra. Previous research indicates that by the onset of motor symptoms, ≊60% of these neural cell bodies are lost and striatal dopamine levels are reduced by ≊80% [5]. Although PD currently has no cure, early detection and appropriate treatment can significantly delay its progression and improve patients’ quality of life. PD diagnosis is based on clinical evaluation of the patient’s symptoms and a detailed neurological examination by a specialist [6]. Despite the lack of a specific diagnostic test, neuroimaging techniques such as Magnetic Resonance Imaging (MRI) and transcranial sonography have become valuable non-invasive tools. Both allow observation of physiological alterations in brain activity, improving precision and enabling earlier diagnosis. The current literature focuses on identifying the prodromal stage and early detection, suggesting that pathology can begin up to two decades before motor symptoms appear [7]. Traditionally, PD was believed to have no significant genetic basis. However, recent research has shown that various genetic factors increase the risk of developing PD [8]. Genetic biomarkers, such as -synuclein and interfering Ribonucleic Acid (RNA), in combination with other markers, have been fundamental in elucidating the neurodegenerative pathogenesis of PD [5,9], as well as in identifying prodromal symptoms, including REM sleep disorders [10,11]. Furthermore, it has been observed that abnormal microRNAs reflect the progression of PD from its prodromal stage to the motor phase [12]. In this context, the Parkinson’s Progression Markers Initiative (PPMI) is a significant effort to advance understanding of PD [13]. The PPMI aims to establish longitudinal cohorts of PD patients to investigate markers of its progression. Several preprocessing methods have been proposed for the PPMI dataset. For example, Ref. [14] applied an rs-fMRI pipeline that included motion correction, normalization, and temporal filtering to extract ReHo and fALFF metrics. Using these features and clinical data, they classified patients into high- and low-severity groups, with predictive values approaching 80%. Similarly, Ref. [15] incorporated motion correction, normalization, and physiological noise regression into rs-fMRI preprocessing, then applied topological analysis to build a classifier with % accuracy in distinguishing Parkinson’s patients from controls. Although limitations persist in PD detection, interest in neuroimaging has grown significantly in the scientific community, mainly because quantitative analyses of disease progression using fMRI can improve diagnostic accuracy [16]. This work presents a strategy for early detection of PD using fMRI data and machine learning.
The Census Transform (CT) estimates similarity between brain regions and precisely defines Regions of Interest (ROIs). Its modified version (CTM) enables comparison of neuronal activity patterns and highlights the most representative areas for diagnosis. Integrating this method with subgroup analysis techniques and machine learning models could significantly improve PD prediction and early diagnosis [17,18,19], providing a more robust and detailed interpretation of fMRI data. Recent studies have shown the potential of machine learning to detect EP using neuroimaging data and biomarkers. Yang et al. [20] proposed a multimodal fusion approach based on structural magnetic resonance imaging and genetic data, achieving a balanced accuracy of 95.36% in differentiating between healthy subjects and diagnosed patients, although without considering the prodromal phase. In contrast, López-Limas et al. [21] developed an rs-fMRI-based method that uses functional connectivity, autoencoders, and Graph Convolutional Networks to achieve a tricategorical classification among healthy subjects, prodromal patients, and patients with PD with 90.66% accuracy, representing a significant advance toward early detection. Similarly, Quattrone et al. [22] used multivariate statistical models to distinguish among these three clinical stages, achieving an accuracy of %, confirming the feasibility of multiclass analysis for characterizing disease progression.
As noted above, this project proposes an early-detection classification based on an extensive repository of fMRI, clinical data, and biological samples, enabling classification of the three main PD stages of progression. Highlights suggest that the methodology is structured as follows: (1) premotor detection proves to be highly efficient, demonstrating that PD can be identified using a single fMRI slice, achieving an accuracy of and highlighting the effectiveness of a computationally lightweight approach; (2) multislices analysis does not provide substantial improvements, as increasing the number of slices only slightly enhances accuracy while sensitivity remains low, with minimal differences observed between analyzing 8 and 16 slices; and (3) the analysis using 8 slices offers the best balance, achieving an accuracy close to without increasing processing complexity, thereby optimizing the overall performance of the method. This initiative aims to identify biomarkers that help understand the course of PD and promote early detection. The following sections present the methodology, numerical classification results, highlights, and the conclusion of this framework.
2. Proposed Methodology
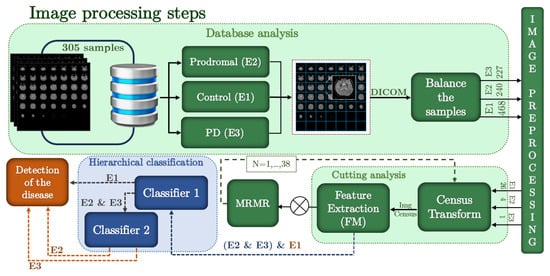
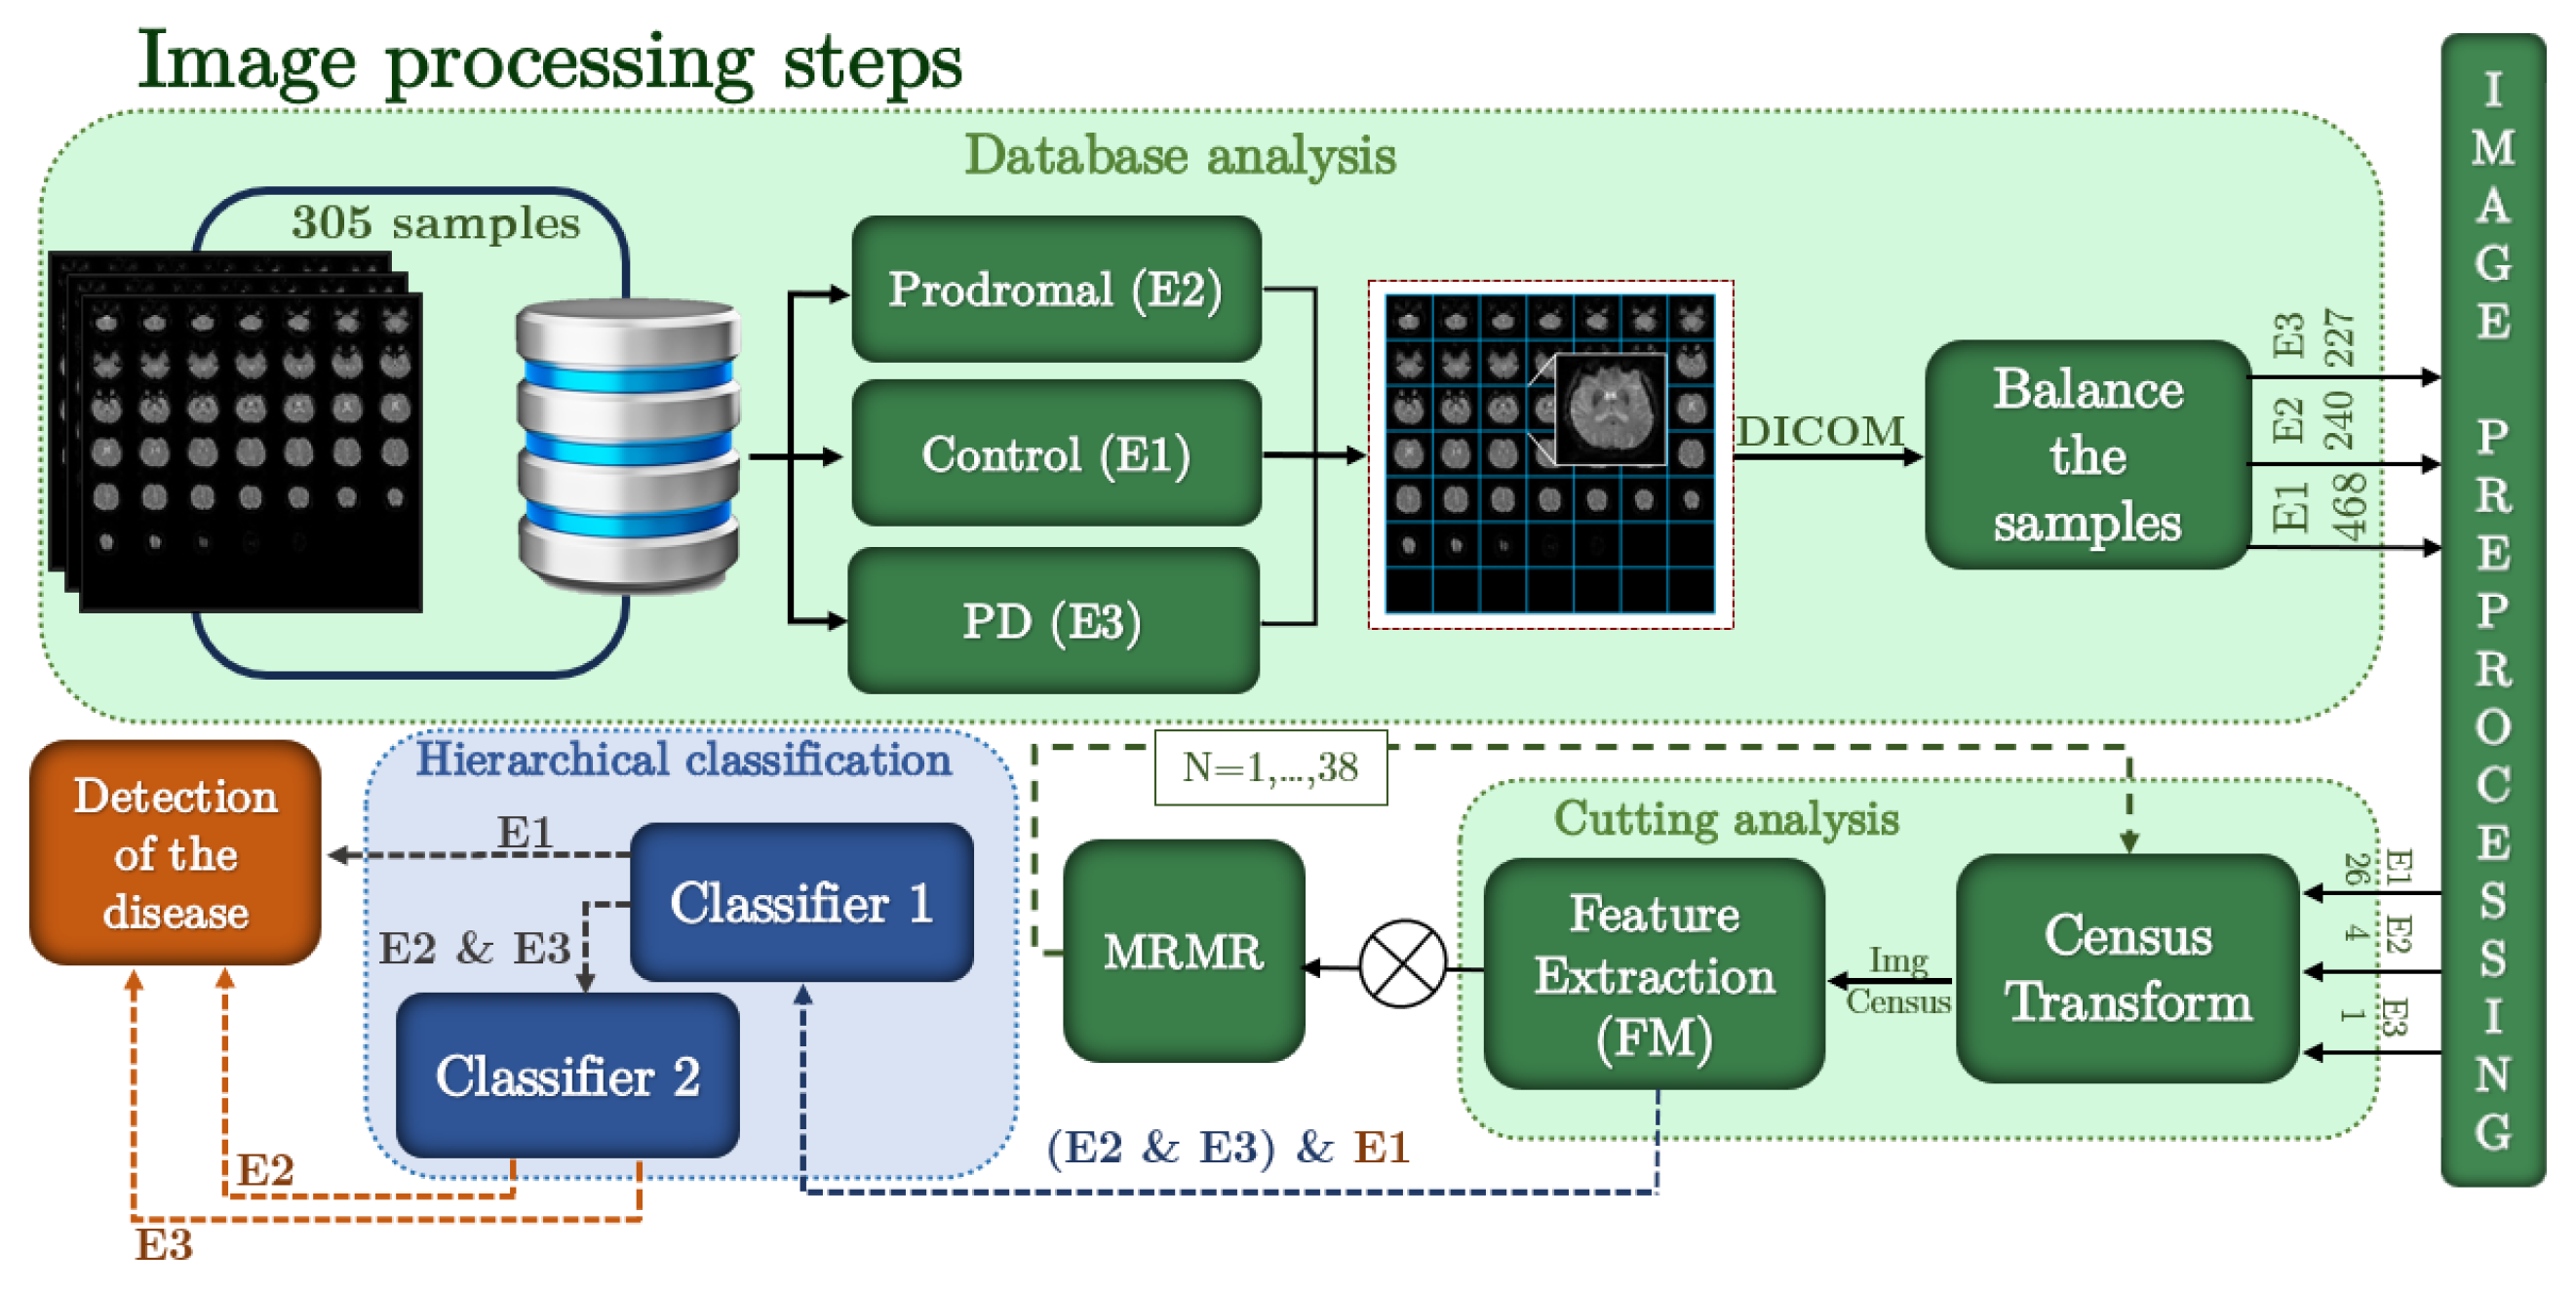
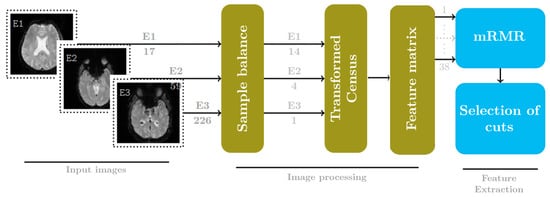
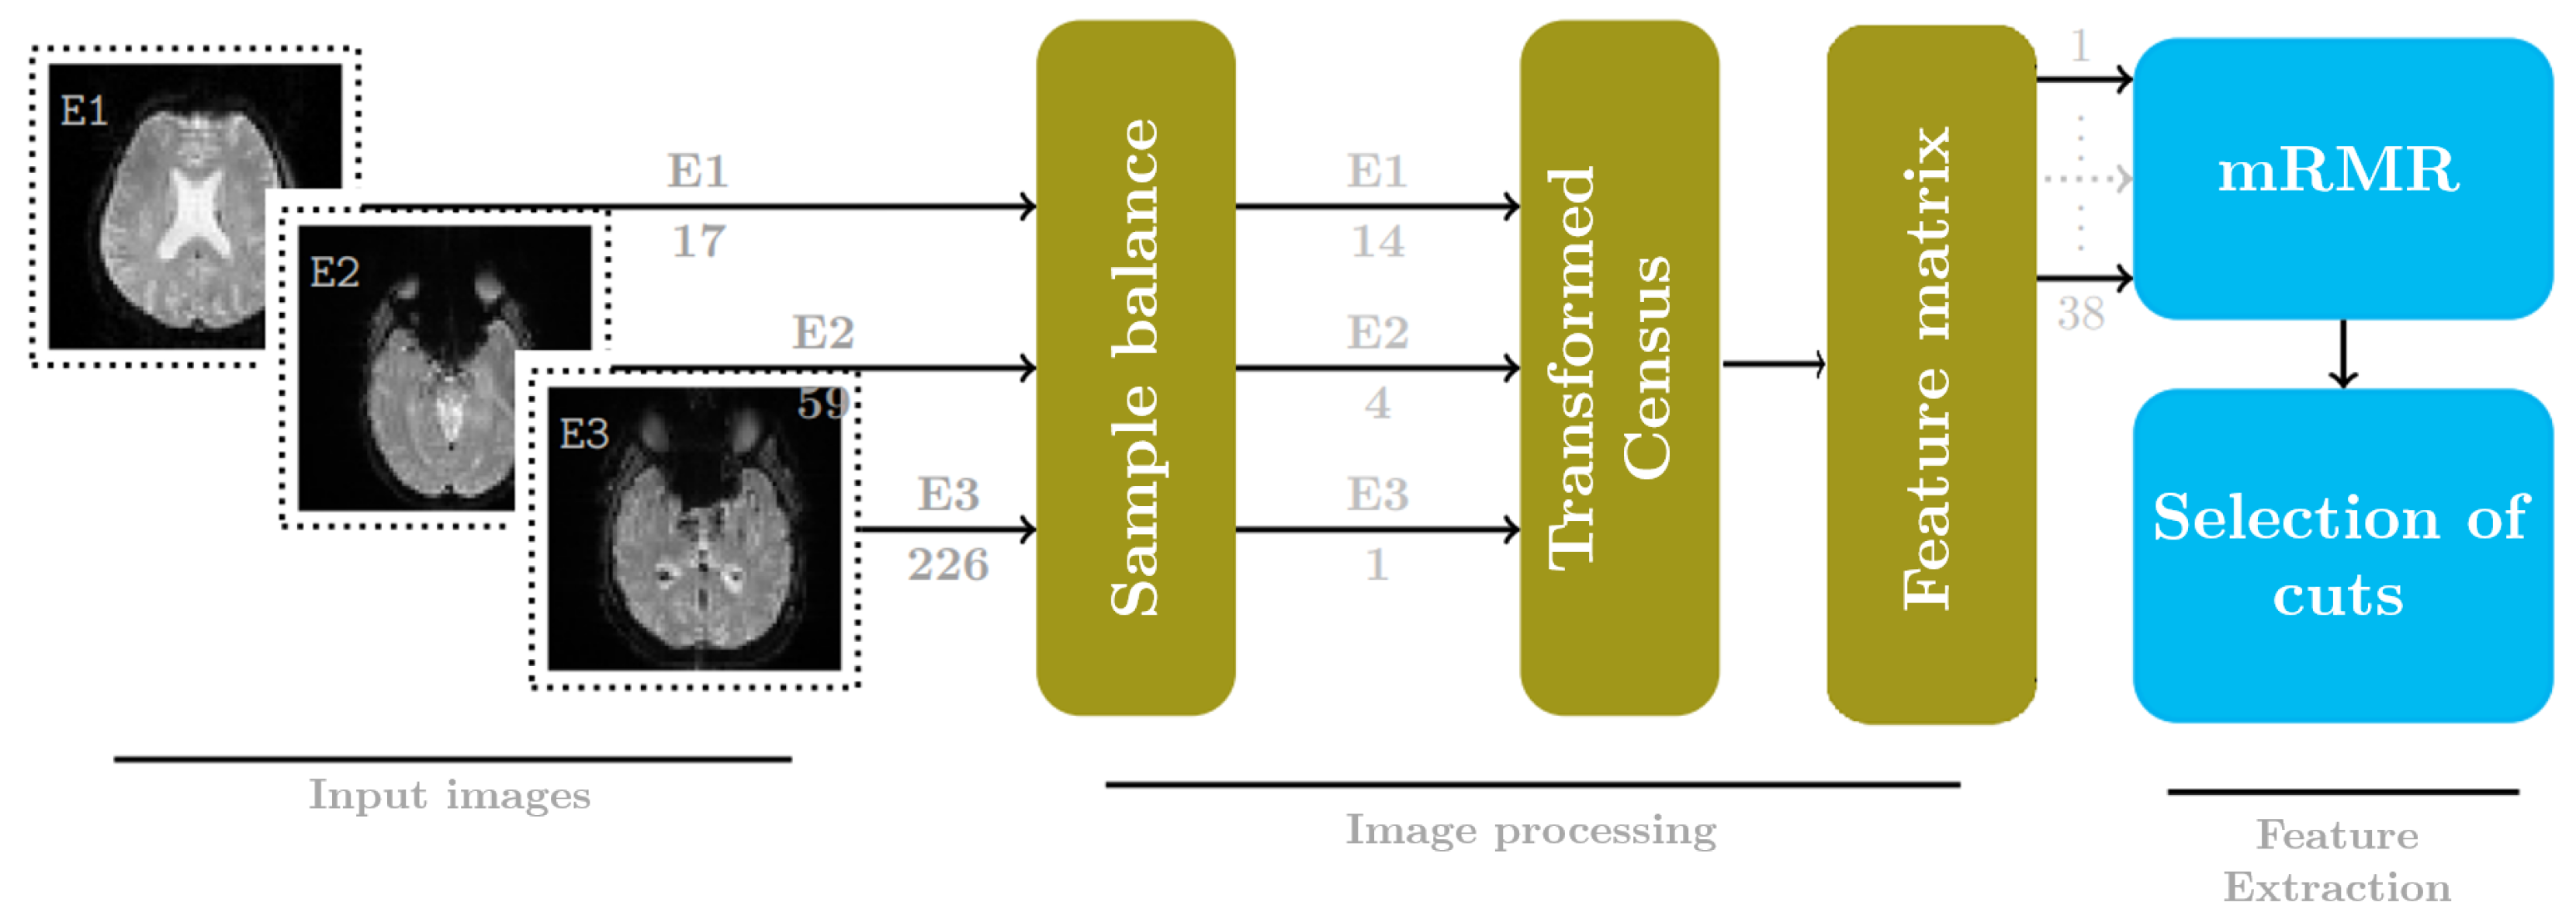
PD has been studied to assess understanding of the human brain and the consequences this disease has for people. However, the gap between research and PD exploration is narrowing, with a growing focus on the premotor phase (E2). This study uses fMRI data from the PPMI dataset to evaluate several ML algorithms for identifying premotor and motor phases in PD. Our proposed methodology, illustrated in Figure 1, begins by analyzing the dataset to select images that represent each phase: healthy control subjects (E1), individuals in the prodromal phase (E2), and patients diagnosed with the disease (E3). This step is crucial for reducing classification gaps and highlighting the textural and structural nuances in brain images associated with each PD phase.
Figure 1.
Proposed methodology.
After applying CTM, we perform statistical feature extraction. We conducted this process iteratively for each fMRI slice, creating a comprehensive matrix that appends all slices’ statistical descriptors for the following classification. Here, the mRMR algorithm plays a pivotal role, sifting through the slice matrix to identify the slices that best reflect the disease’s characteristics. Using the selected mRMR slices, we refine our sample set and apply a hierarchical classification framework comprising 25 classifiers. This multi-tiered approach enables nuanced differentiation among PD stages by leveraging the strengths of multiple classifiers to achieve superior diagnostic precision.
This methodology not only underscores the potential of advanced image processing and ML techniques for early PD detection and characterization but also sets the stage for future research to refine diagnostic and prognostic models for neurodegenerative diseases.
2.1. Image Acquisition
This study used fMRI sequences from the PPMI database, which includes a total of frames per subject
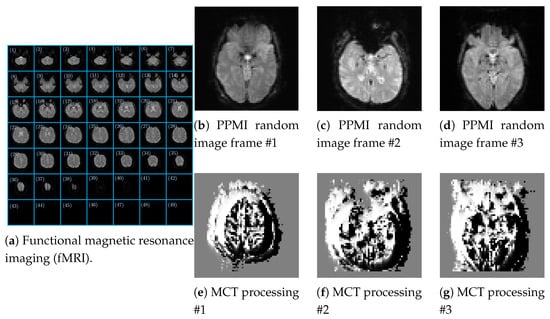
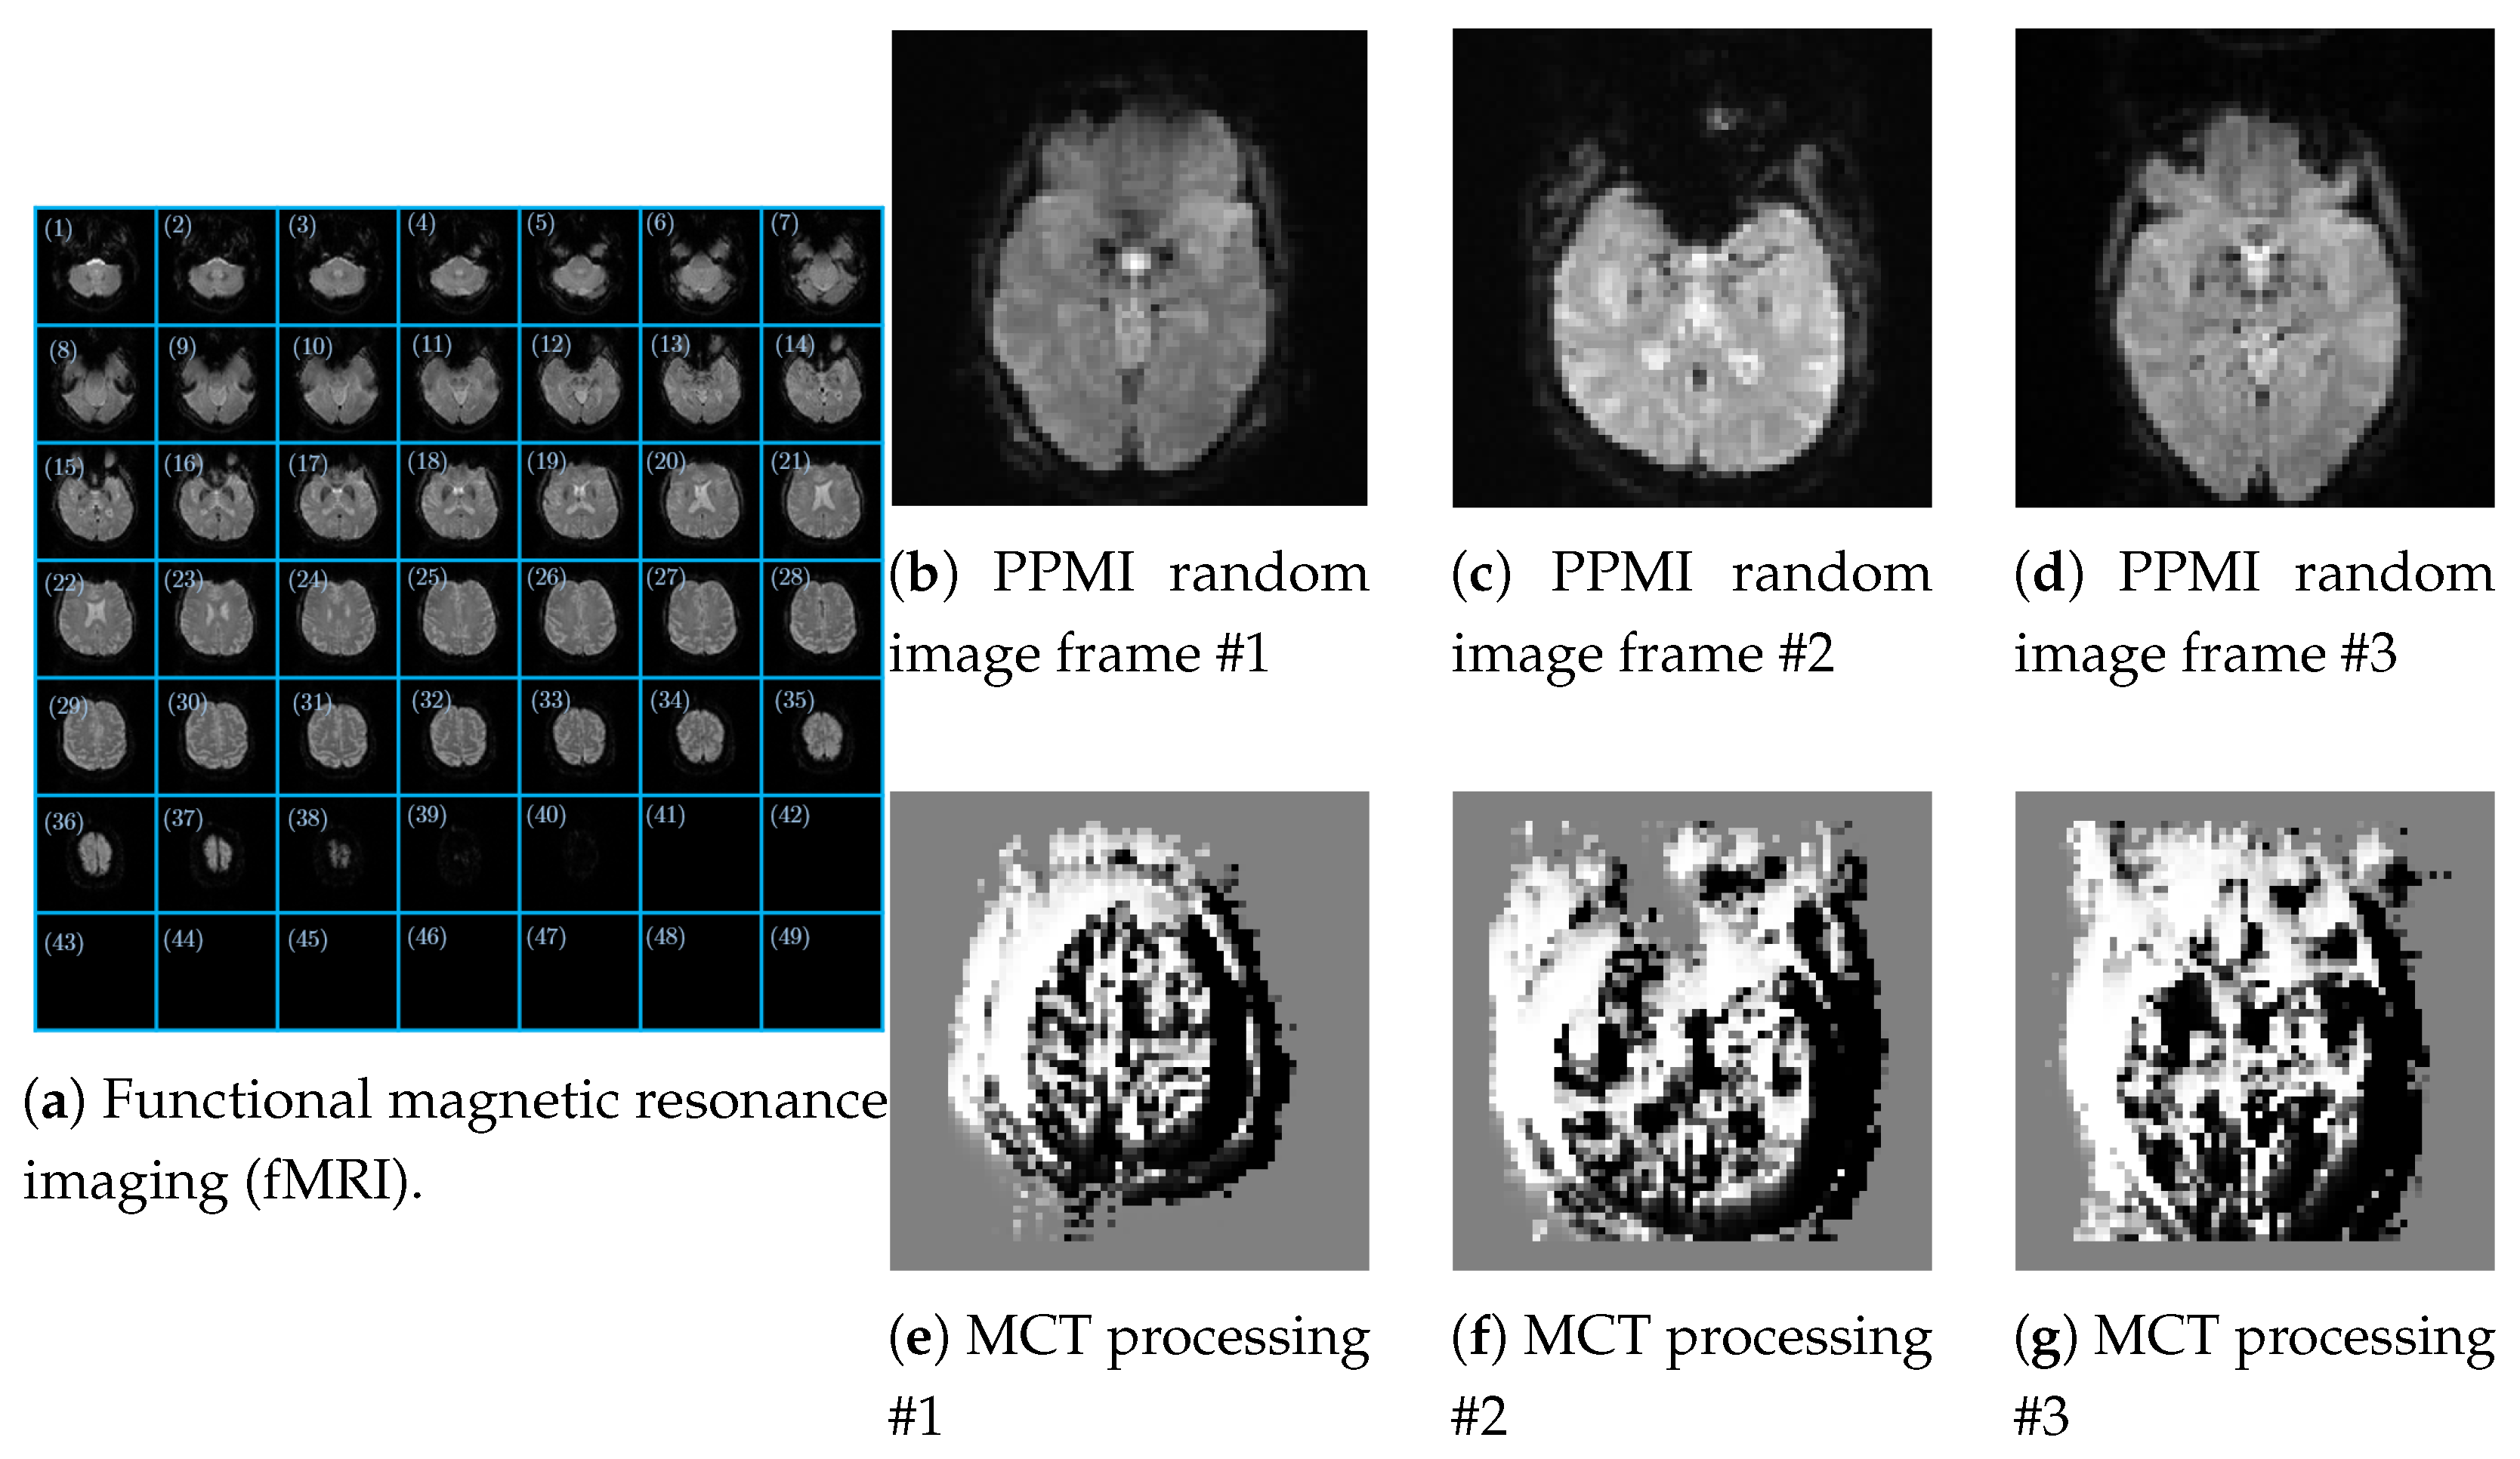
each with a spatial resolution of pixels and stored in DICOM format. Each frame is composed of 49 successive brain slices in the axial plane, as shown in Figure 2a, which illustrates the general structure of an fMRI acquisition. The images correspond to subjects (samples) at different clinical stages of PD: E1, E2, E3, respectively, represented in Figure 2b–d. To avoid the unbalanced data, we equilibrate the data by selecting the same number of frames in the larger class of data for all three classes, . Where represents the cardinality of each target and n is the number of frames per class to balance the data. We then apply the Modified Census Transform (MCT) to each image in the fMRI input data.
Figure 2.
(a) PPMI original DICOM image, (b–d) frames of the PPMI, and (e–g) resulting Census transform image processing.
Although each frame includes approximately 49 slices, not all provide meaningful information for the brain regions associated with PD. A qualitative analysis found that only approximately 38 slices show a clear anatomical representation in the axial plane. However, even within this subset, relevance varies considerably by slice position in the sequence. To address this variation, we proposed a reduction strategy based on a pairs-of-slices criterion defined as , with , enabling the selection of representative slices while preserving structural diversity without introducing unnecessary redundancy. From the set of 16 axial slices selected using the mRMR method, subsets were generated without repetition and while maintaining their ascending anatomical order. The number of possible combinations of k slices was determined using the binomial coefficient , where . In particular, we evaluated combinations of 2, 4, and 8 slices. For , each slice was analyzed independently to assess its discriminative capability. In contrast, for , the complete set of 16 slices obtained from the mRMR ranking was considered and arranged in ascending anatomical order. Because of the large number of combinations, we selected a balanced random subset and chose the best-performing combinations based on classification performance. To further refine this selection, we integrated the mRMR algorithm, assigning each slice a probability-based vector score that measures its contribution to classification. This step was crucial for identifying slices with the greatest diagnostic value and discarding those that contained little or highly redundant information.
We then trained a hierarchical classifier on the refined dataset, achieving accurate detection of patterns associated with different disease stages. The results were highly satisfactory, demonstrating that combining sample selection strategies and slices significantly optimizes the proposed model’s performance.
2.2. Minimum Redundancy Maximum Relevance
mRMR plays a crucial role in the fMRI slice selection stage, serving as the methodological cornerstone for constructing a highly informative and clinically relevant input configuration for the classification model. This algorithm not only optimizes the model’s ability to identify a meaningful feature subset but also preserves the data’s essential diagnostic structure while reducing dimensionality. This selective reduction retains only brain regions with high discriminative capacity between patient states, improving the classifier’s computational efficiency and accuracy. To generate the feature matrix for mRMR evaluation, we used a census-based approach, complemented by statistical descriptors capturing relevant structural and intensity properties of the data. This combination enabled us to construct a representation matrix comprising 38 previously defined slices, which the mRMR algorithm evaluates. As a result, only sections with scores above the average are selected for consideration in subsequent phases of the classification process, thereby eliminating noise and reducing information redundancy. This formulation is based on an evaluation metric that balances both criteria, the mathematical expression of which is presented below [23]:
criteria, where denotes the joint probability distribution, and and refer to the marginal probabilities of each feature within the matrix S. As a result, the mRMR criterion is computed as:
where denotes a feature under evaluation, and h represents the target class label (e.g., healthy or diseased). The set S contains the already selected features, with denoting its cardinality. Relevance is quantified by the mutual information between the feature under evaluation i and the target h. At the same time, redundancy is measured through , which evaluates the dependency between the feature under evaluation i and each feature j in S. The average redundancy is expressed as .
2.3. Modified Census Transform
Before introducing the MCT, we review the classical CT [24], a non-parametric approach for encoding local spatial information in grayscale images that is particularly effective for texture analysis and is typically encoded as 8-bit integers. A binary pattern is computed by assigning ‘1’ if the neighboring pixel intensity is greater than the central pixel’s intensity and ‘0’ otherwise. We convert this 8-bit binary blockchain to decimal via a dot product and use it as a feature descriptor. This process is formalized in (4):
where denotes the coordinates within a windowing analysis; u and v are the coordinates of the central pixel (reference) of the window, and this central pixel is used as a threshold. The ⊗ operator in (4) denotes the appending operation of the achieved binary pattern that represents the computed CT at the coordinate.
This binary encoding effectively captures the relative spatial distribution of pixel intensities. Therefore, a key advantage of CT is the invariance to monotonic changes in illumination. This property enables effective thresholding of ROIs in fMRI images, thereby simplifying feature extraction. By ordering pixel intensities, CT enables robust characterization of brain textures associated with PD, enhancing the potential for early disease detection and monitoring.
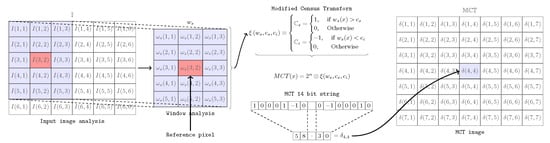
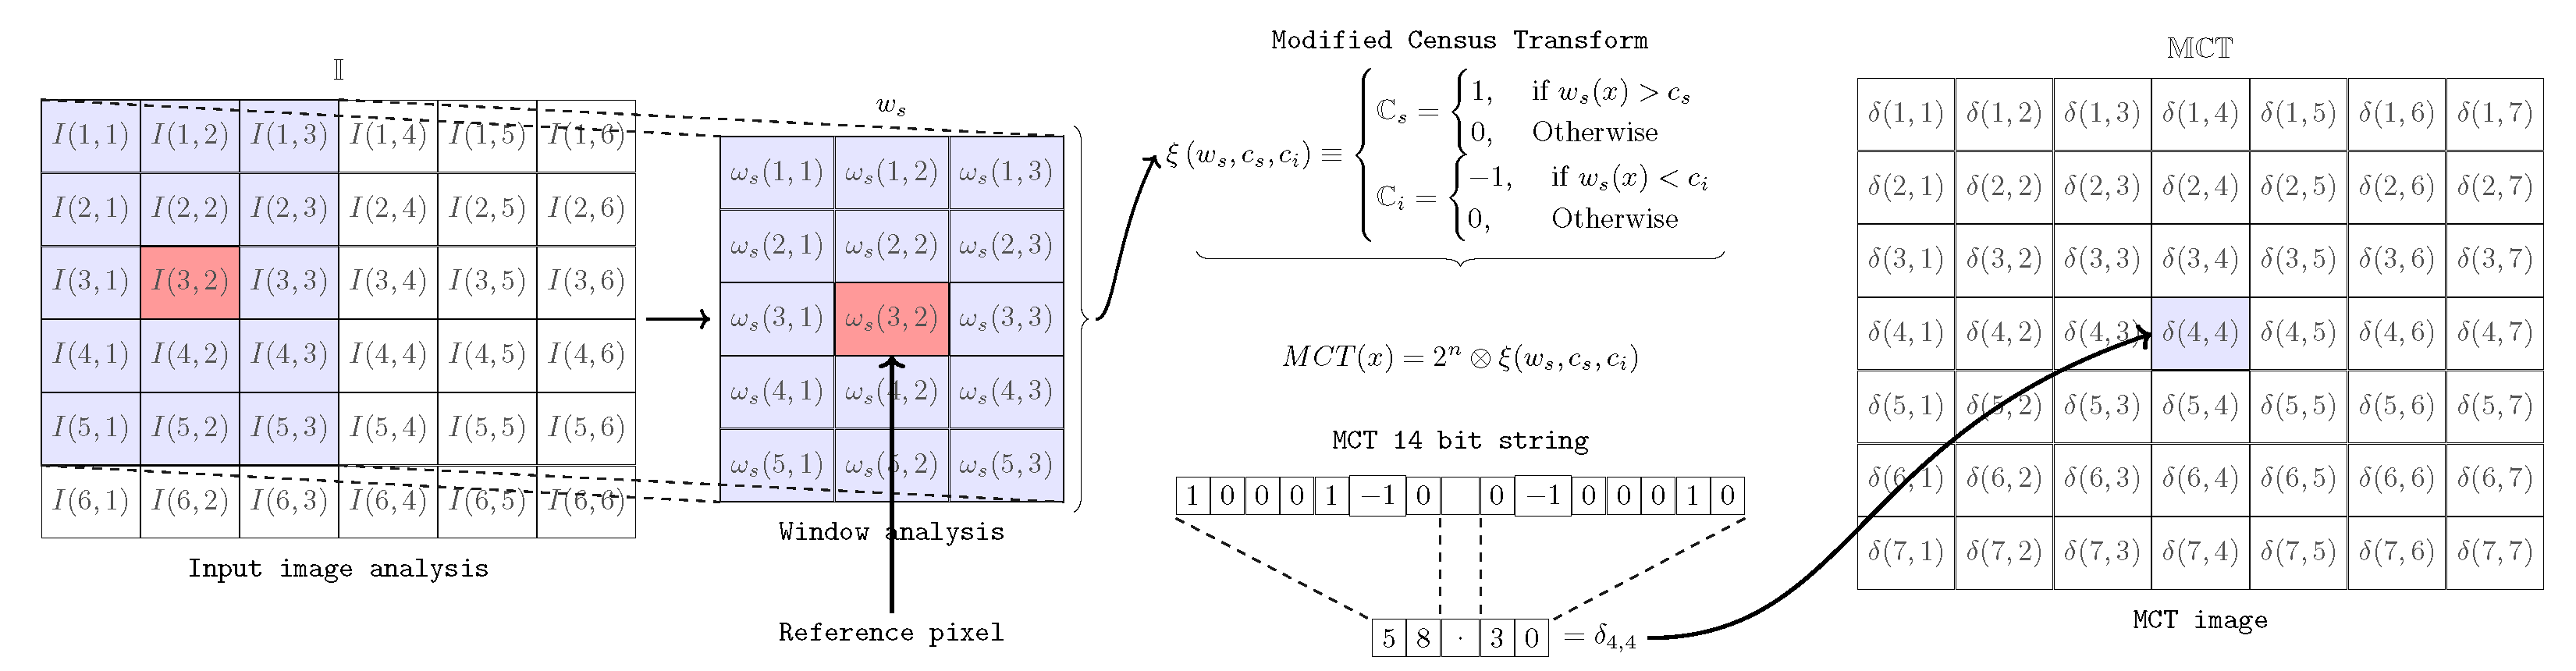
However, we propose a Modified Census Transform [25] to increase the resolution of classical CT. Here, we propose a windowing analysis using a window , where r and c are the number of rows and columns, respectively, taken from the input image to achieve a local . To describe the procedure, an analysis window of [3 × 5] pixels is considered, as illustrated in Figure 3, where and . First, obtain and designate the central pixel as the reference . Under this framework, we evaluate 15 total values. By assigning one pixel as the reference, the remaining 14 pixels construct the ternary product, with the reference pixel as the operator’s fixed point. In addition, two scalars are computed to serve as thresholders based on the and criteria. Then, the MCT outperforms a ternary pattern by comparing each element of the input by following the criteria in (5)
where is the produced ternary -bits block chain (14-bits following the example of Figure 3). Finally, is obtained using a -dimensional weight vector that enables local observation of image-intensity variations via fixed-point conversion. This process is executed after generating the ternary chain derived from the comparison between the central pixel and its neighbors, considering the tolerance threshold within the analysis window, where , as
describes, where the ⊗ operator indicates the point product of the produced block chain. As a result, the MCT produced a modified input image, as shown in Figure 2e–g.
Figure 3.
Modified Census Transform.
2.4. Slices Configuration
As described previously, we used fMRI analysis to identify the most informative brain slices for assessing patients’ neurological status. The proposed methodology, illustrated in Figure 1, was developed using fMRI sequences from the PPMI database. In this study, the classification process was performed at the sample level rather than the subject level. Each sample corresponded to a subject and was represented by a single fMRI sequence. The final dataset comprised 305 samples distributed across three clinical stages: 18 E1 samples, 60 E2 samples, and 227 E3 samples.
Each sample contained a complete fMRI acquisition consisting of 210 functional frames stored in DICOM format. Each frame had a spatial resolution of pixels and contained 49 consecutive axial brain slices, each with a resolution of pixels. Therefore, each sample provided both temporal and spatial information describing the subject’s brain activity. To reduce variability across acquisition protocols, we included only studies acquired with a Siemens Magnetom Trio 3T scanner. We selected this scanner because it provided the largest number of available samples and substantial representation of the E2 stage, the primary focus of this research. The acquisition protocol used repetition times (TR) ranging from to s, allowing approximately 7 to min of spontaneous brain activity to be recorded.
Because of the pronounced class imbalance in the original dataset, we implemented two independent balancing schemes. We applied the first balancing strategy during the slice-selection stage and for the multiclass classification analysis. Expansion factors of 13, 4, and 1 were applied to classes E1, E2, and E3, respectively. As a result, the balanced dataset contained 234 E1 samples, 240 E2 samples, and 227 E3 samples, for a total of 701 samples. We then used this balanced dataset to select the most relevant brain slices with the mRMR algorithm and to train and evaluate the multiclass classification models. This procedure prevented the feature-selection stage from being biased toward the majority class.
This strategy addresses a widely recognized challenge in medical image analysis: the limited availability of labeled samples. Qiao et al. [26] note that medical image annotation is a costly and time-consuming process, often resulting in datasets with scarce and unevenly distributed labeled information across the categories of interest. Consequently, models may become biased toward the most represented patterns, reducing their ability to learn discriminative features associated with underrepresented groups. To address this limitation, the authors propose a semi-supervised learning framework that leverages additional information from unlabeled data. Similarly, in the present study, we implemented a balancing strategy before feature selection to compensate for the unequal distribution of samples across classes E1, E2, and E3. This allowed the mRMR algorithm to identify relevant brain slices based on a more balanced representation of disease stages, promoting the selection of features with greater discriminative power while reducing the bias introduced by the unequal availability of labeled samples.
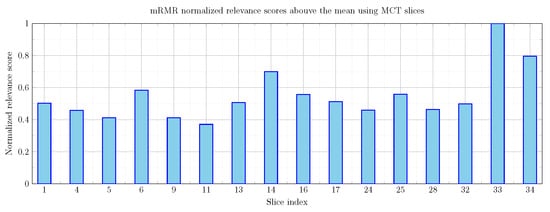
Following an initial qualitative assessment of the 49 available axial slices, 38 slices containing relevant anatomical and functional information were identified. We then vectorized each slice and organized the information into a feature matrix. This matrix served as input to the mRMR algorithm, which identified the slices with the highest relevance and the lowest redundancy. As a result, 16 slices with relevance scores above the mean were selected for subsequent analysis.
Feature extraction was performed using the MCT descriptor with the following window configurations:
These configurations enabled analysis of the BOLD signal across multiple spatial scales and helped identify the most representative local patterns associated with PD. The window sizes were selected to preserve sensitivity to local spatial variations within the axial slices, allowing the MCT to characterize intensity transitions between neighboring pixels effectively. We did not consider larger windows because they could reduce the descriptor’s ability to capture fine-grained local structural information around the reference pixel.
We implemented a second balancing strategy specifically for the hierarchical classifier. We applied expansion factors of 26, 4, and 1 to classes E1, E2, and E3, respectively. Consequently, we trained the first stage of the hierarchical classifier on 468 E1 samples and 467 samples from the combined E2 + E3 group (240 E2 and 227 E3). This configuration allowed the first stage to operate under nearly balanced conditions while distinguishing healthy subjects (E1) from those exhibiting prodromal or diagnosed Parkinsonian characteristics (E2 + E3).
In the second stage of the hierarchical classifier, we considered only samples from classes E2 and E3. This stage distinguished E2 from clinically diagnosed E3.
Finally, the 16 selected slices were evaluated using various subset-based combinations.
to determine the optimal spatial configuration for classification; features extracted using MCT formed the same input dataset for all evaluated classifiers. Furthermore, we trained and validated all classifiers using the same data partitions in each experimental repetition, ensuring an objective comparison free from methodological bias.
2.5. Feature Extraction
Feature extraction is a pivotal step in machine learning for classification. One of the principal tasks in our experimental protocol is to identify the slice, or set of slices, that yields the most accurate ML model.
After applying MCT to each window-and-slice configuration, we vectorized the processed images. Then, we computed statistical features for each vectorized MCT image. We propose first-order statistical features because the approach operates on fMRI data at the individual slice level, unlike biomarkers such as ReHo and fALFF, which depend on the temporal dynamics of the complete fMRI time series. In this context, these features enable efficient characterization of the intensity distribution and structural patterns in each slice. Specifically, for each vectorized MCT image, a set of statistical features was computed, including: (1) mean, (2) median, (3) variance, (4) first and (5) third quartiles, (6) minimum value, (7) maximum value, and (8) an estimate of the mode. In combination with the features, we evaluated seven different window sizes. As a result, a feature matrix was obtained. Here, 935 corresponds to the total number of balanced vectorized MCT images (227 for E1, 240 for E2, and 468 for E3), and 896 corresponds to the number of extracted attributes (8), per window size (7), and per relevant slices obtained using mRMR (16). Figure 4 encompasses the described methodology.
Figure 4.
Cut selection.
3. Numerical Results
Machine learning techniques provide a comprehensive way to characterize fMRI data, which reflect Blood Oxygen Level-Dependent (BOLD) signal fluctuations. Both methods have been proven effective in identifying neural alterations associated with disorders like Alzheimer’s [27], autism spectrum disorder [28], and Parkinson’s [14], among others. This project aims to identify PD across three distinct states, with a particular focus on detecting state E2. The results reflect changes in the spatial patterns of brain activity derived from fMRI images. The MCT is computed through local structural analysis across multiple evaluation windows, enabling characterization of transitions between distinct brain activity patterns. By capturing local variations in BOLD signal intensity and comparing regional neuronal activity patterns, the MCT identifies the most discriminative brain regions for classification and supports a more accurate assessment of the clinical condition associated with PD. Although the proposed approach does not directly quantify functional connectivity, the extracted spatial and statistical features may reflect indirect manifestations of connectivity alterations and underlying neurophysiological changes associated with PD, thereby providing complementary information for diagnostic support [29]. Given the inherent variability in resting-state brain activity, we propose a hierarchical classification approach to simplify the analysis. First, we categorize subjects’ data as healthy (E1) or diagnosed with or at risk of neurological disorders (E2 + E3). A subsequent binary analysis distinguishes between patients in the diagnosed and premotor phases to accomplish the hierarchical task.
We processed the data and performed numerical analyses using MATLAB R2020b and the Machine Learning Toolbox. In this study, the feature matrix , described in Section 2.4, was used as input to a set of 25 machine learning (ML) classifiers. This matrix contains the statistical features extracted using the proposed analysis methodology and provides the quantitative representation of each subject used during the classification stage. Each of the 25 models independently evaluated the feature matrix , enabling the assessment of the discriminative capability of these features across different classification approaches, including Decision Trees, Support Vector Machines (SVM), k-Nearest Neighbors (kNN), and other classifiers based on different kernel functions.
This broad set of kernels helps determine which MCT-based classifiers provide accurate early detection of PD. Additionally, using multiple classification kernels enhances the reliability and robustness of our method.
In this section, we evaluate the fMRI slices and classifiers that achieve the highest classification accuracy. In addition, slice discrimination outperformed the mRMR approach, yielding a subset of relevant slices that are superior to the mean relevance score shown in Figure 5.
Figure 5.
mRMR normalized relevance scores using the MCT images.
As introduced in the previous section, we outperform an arrangement of subsets of slices when evaluating the hierarchical classifier across 25 classifiers.
To conduct the tests, we analyzed 305 samples. We applied a balancing procedure based on the number of available instances per state, using E3 as the reference class because of its larger sample size. From this distribution, we set adjustment factors of 26 for E1 and 4 for E2 to equalize the number of samples included in the analysis. These values are illustrated in the corresponding Figure 4. In the first stage of the classification, we feed the ML model with a reduced feature matrix as , which determines whether a patient belongs to the healthy group (E1) or the diseased group (E2 and E3), considering eight statistical features extracted from a single window and a single slice.
The dimension of corresponds to the first stage of the classifier, where 935 samples are included (468 from E1 and 467 from E2+E3: 240 from E2 and 227 from E3), enabling a balanced classification between E1 and E2+E3.
In the second stage, the matrix is used, which includes 467 samples (240 from E2 and 227 from E3) to differentiate between these two classes. The dimension 9 corresponds to the extracted statistical features, including the class label.
We partitioned the dataset at the sample level using the information provided in the CSV files supplied by the PPMI. We preserved the class distribution when assigning samples to the training and testing subsets, ensuring each partition was representative.
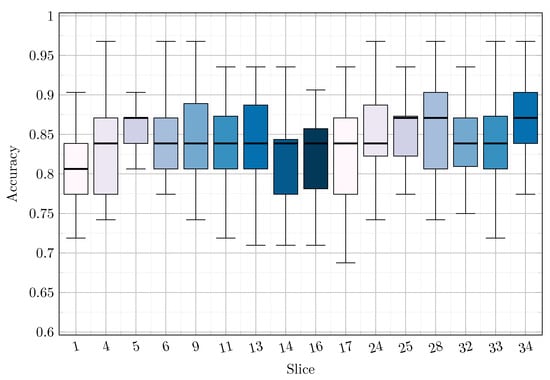
We evaluated the experiment using a hold-out scheme based on Monte Carlo resampling. To this end, we generated 30 independent random partitions while maintaining the original class proportions in each case. We used each partition to train and validate the full model. Subsequently, we calculated the performance metrics as the mean and standard deviation across the 30 independent executions. This procedure, illustrated in Figure 6, also enabled the evaluation of different combinations of brain slices.
Figure 6.
Performance across all slices.
We applied the same validation scheme for multiclass classification. Before training, we implemented a balancing process based on expansion factors to minimize the impact of class imbalance. Furthermore, we trained and validated all evaluated classifiers using the same features, samples, and experimental partitions, ensuring equivalent conditions for performance comparison. Additionally, we performed Leave-One-Subject-Out (LOSO) validation, reserving a single subject for testing in each iteration. The remaining subjects were used for training. The LOSO evaluation included 156 unique subjects (16 from E1, 34 from E2, and 106 from E3), resulting in 156 independent iterations and ensuring that each subject was evaluated exactly once. This scheme enabled the assessment of the model’s generalization capability on completely unseen individuals while preventing subject-level information leakage between the training and testing sets.
Subject-independent validation is especially important in medical imaging studies, where labeled data are often scarce, and class distributions are imbalanced. In this regard, Qiao et al. [30] highlighted that these conditions can undermine model generalization and promote learning patterns associated with dominant classes. Similarly, in the present study, LOSO validation complements the balancing and mRMR-based feature selection stages by more rigorously assessing the model’s ability to identify patterns across PD stages.
Furthermore, the LOSO results were lower than those obtained with the proposed MCT-based methodology, which can be attributed, at least in part, to the pronounced class imbalance (16 subjects in E1, 34 in E2, and 106 in E3). In this scenario, limited minority-class representation makes it harder to learn robust discriminative patterns, ultimately degrading the model’s generalization performance.
Finally, we compared the proposed Modified Census Transform (MCT), the conventional Census Transform (CT), and the LOSO scheme under identical experimental conditions. We also examined how different combinations of axial slices affect classification performance and the associated computational cost.
3.1. Hierarchical Classification Results
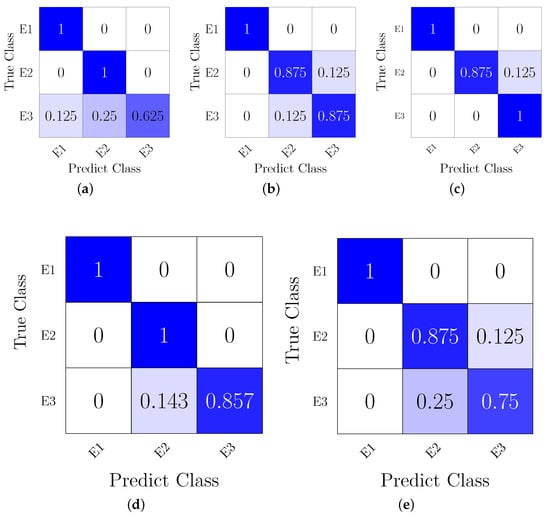
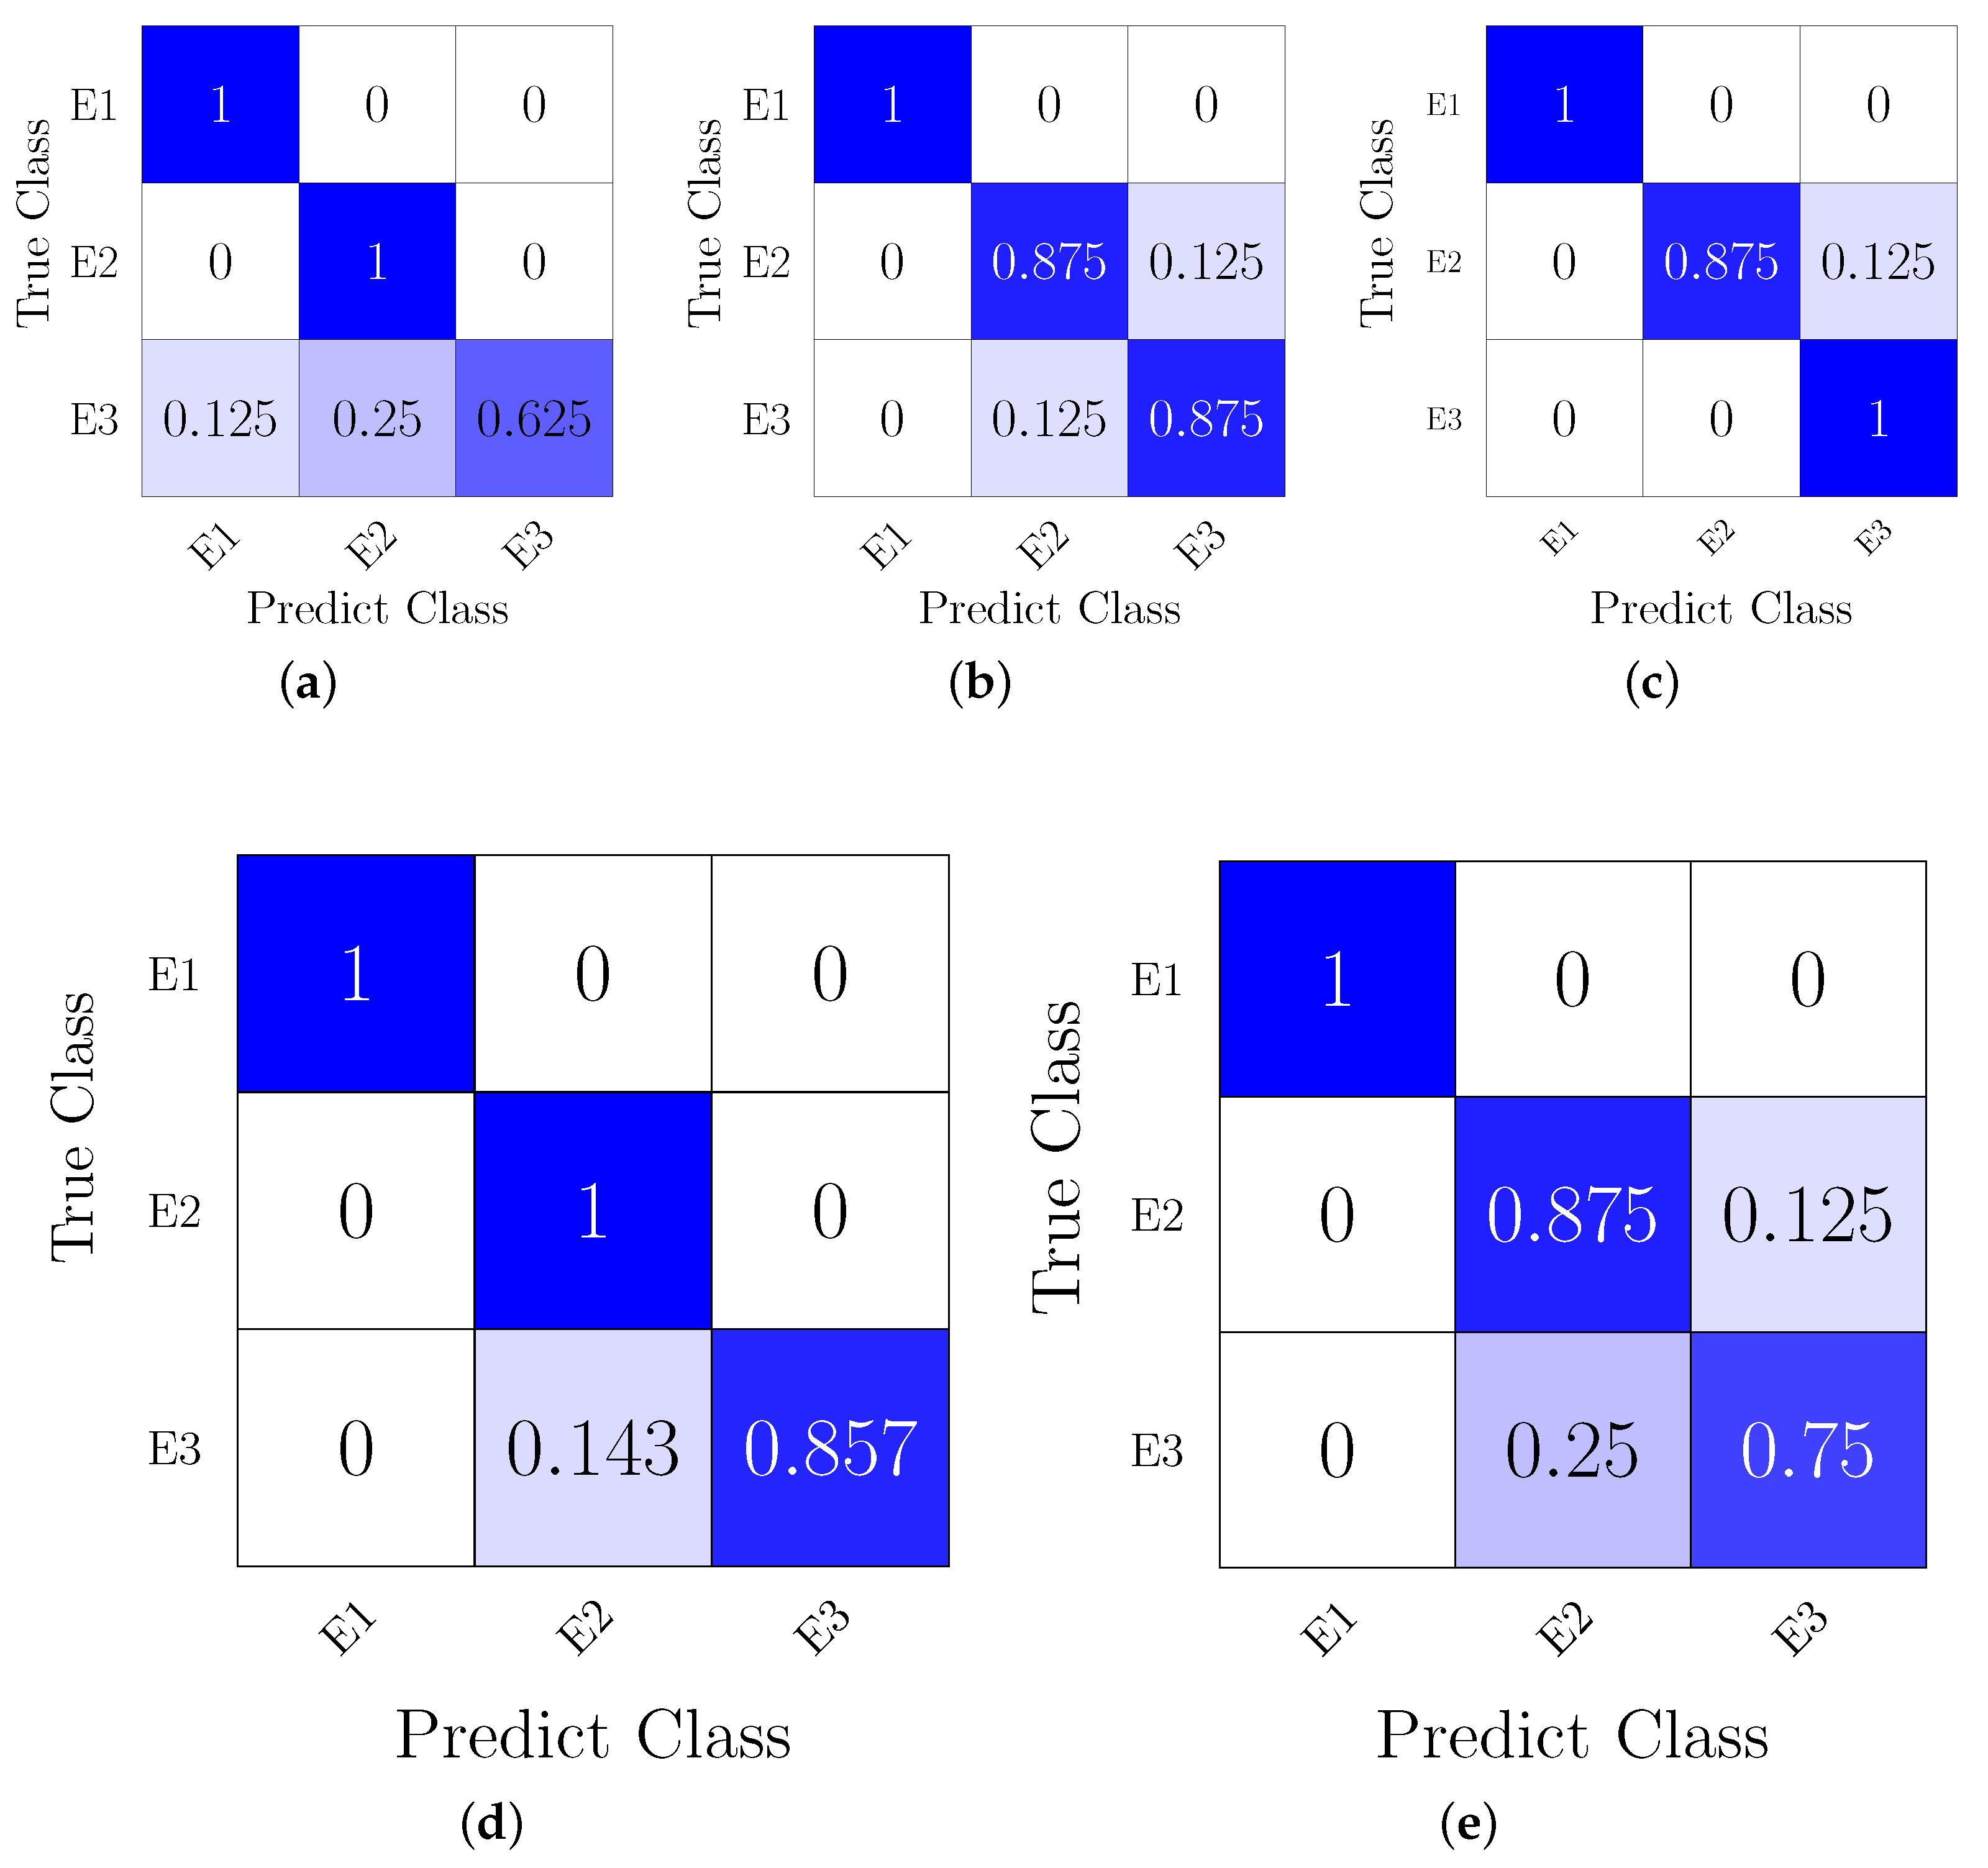
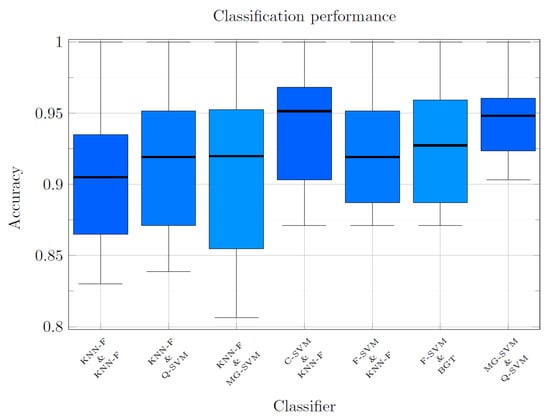
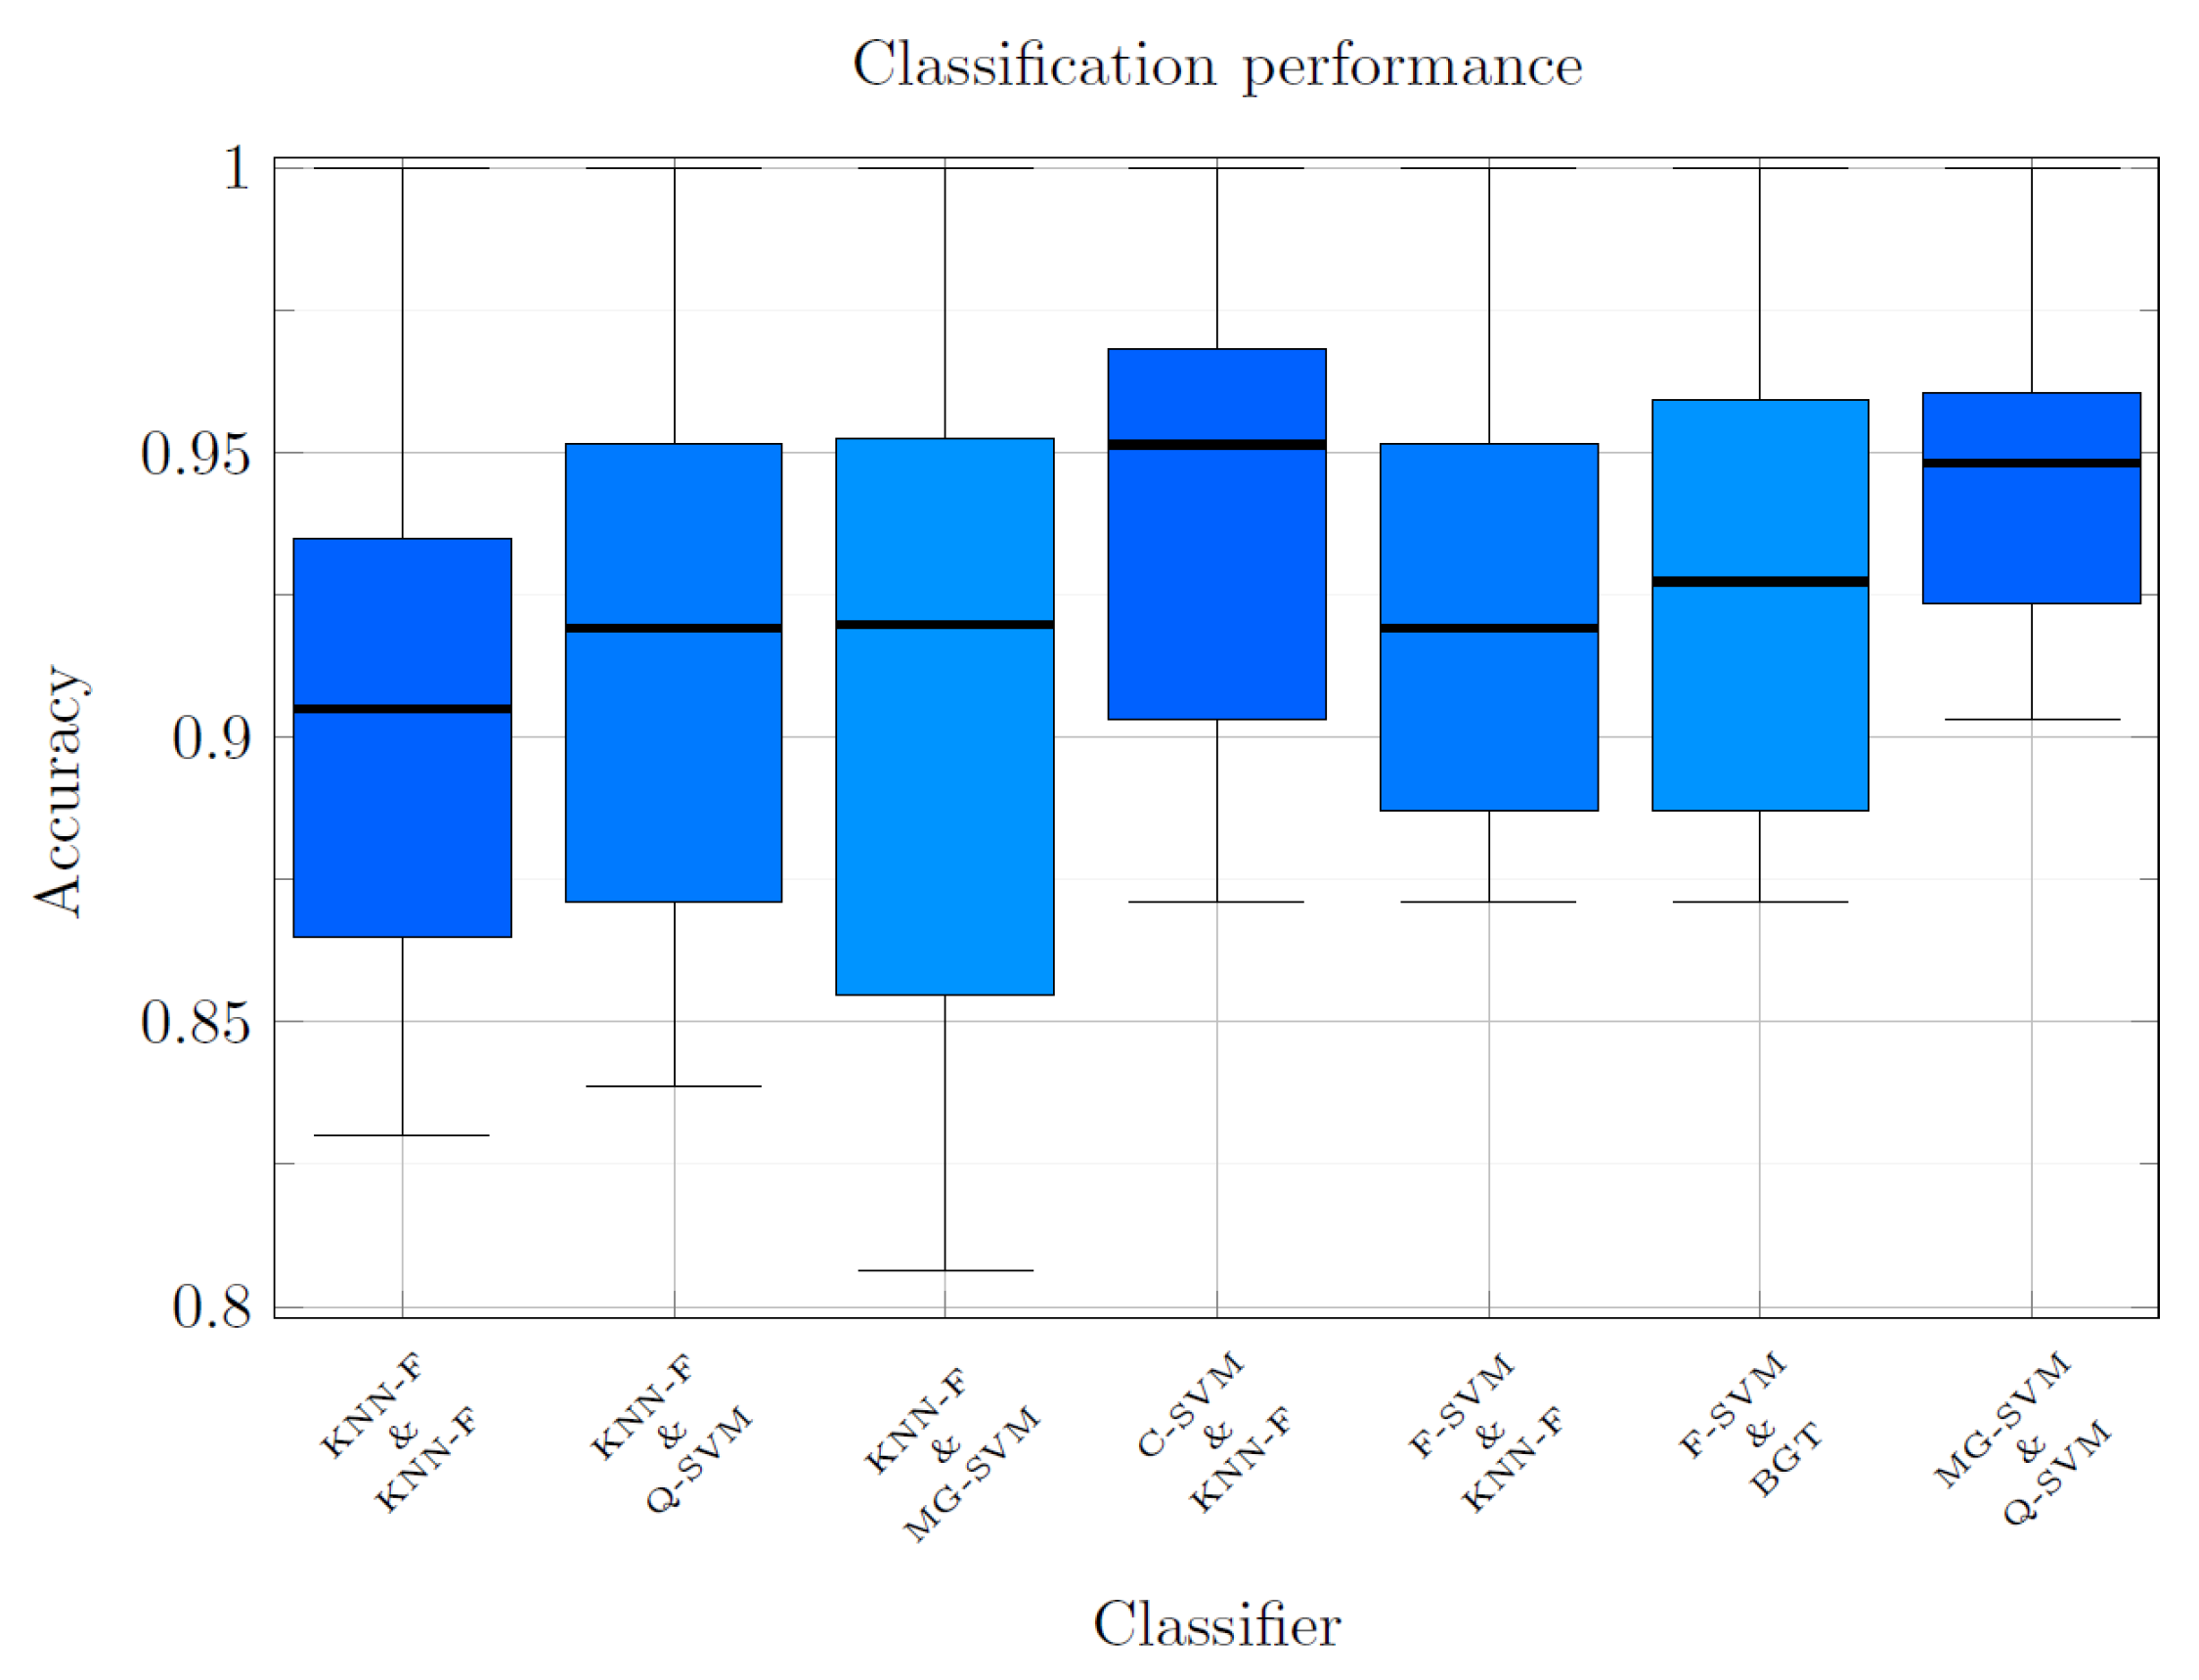
As noted above, the aim of building a hierarchical classification model is to break down the complex task of detecting three PD conditions. To improve robustness, we complete a set of 25 ML kernels to increase the study’s reliability and identify the optimal classification kernel. In this order of ideas, Table 1 shows the mean and standard deviation performances of 25 classifiers available in the MATLAB 2022 Toolbox. For the slice tests, only the best results were considered. The results for 8 and 16 Slices show average accuracies of and , respectively. Consequently, the difference in accuracy is , which is not particularly significant given the amount of information analyzed. Here, the model’s performance indicates that, depending on the classes used to train the classifier, it is more difficult to detect a sick patient in either the or phase. A comparative evaluation of the hierarchical and multiclass schemes demonstrates the hierarchical strategy’s clear superiority in overall accuracy, as shown in Table 1. The proposed hierarchical classifier achieves a maximum accuracy of , exceeding the multiclass model’s highest performance (). Moreover, this trend holds across all evaluated slice combinations, with the multiclass configuration consistently showing lower accuracy. Furthermore, Figure 7 presents the confusion tables for each test section, confirming that the classifier finds it harder to identify sick patients, as indicated by the precision values shown in the table. Likewise, Figure 8 illustrates classification performance (vertical axis) versus model predictive capacity (horizontal axis), evaluated using the 16 optimal slices selected by the mRMR algorithm. The results highlight hierarchical architectures that achieve an average accuracy exceeding in the simultaneous analysis of the three diagnostic classes. These architectures correspond to the best-performing combinations among the 625 classifier pairs evaluated. We assessed all classifiers using predefined MATLAB hyperparameter configurations (Fine, Medium, and Coarse variants), without additional hyperparameter optimization, and trained and evaluated them using the same feature sets, data partitions, and Monte Carlo validation conditions. The confusion matrices in Figure 7 correspond to a single representative repetition of the Monte Carlo validation procedure and are included to illustrate the qualitative structure of the classification errors among the three clinical stages. However, the expected performance values of the model are reported as the mean and standard deviation across the 30 independent repetitions and are presented in Table 1 and in Figure 6.
Table 1.
Classification performance across different slice combinations and classifiers. C1 and C2 denote the first and second classifiers in the hierarchical classification, respectively. Accuracy is reported as mean ± standard deviation, and precision is provided for each class (E1, E2, and E3). We also report classifier and multiclass performance. Bold values indicate the highest accuracy for each slice configuration.
Figure 7.
Confusion matrices for one representative Monte Carlo repetition: (a) BGT & KNN-F (one slice). (b) FG-SVM & FG-SVM (two slices) (c) Q-SVM & FG-SVM (four slices). (d) C-SVM & C-SVM (eight slices). (e) MG-SVM & F-SVM (sixteen slices). Cell shading encodes the row-normalized value shown in each cell, ranging from white (0) to saturated blue (1). Darker cells therefore indicate a larger proportion of samples assigned to the corresponding predicted class. The color scale conveys no information beyond the printed numerical values. Values are row-normalized for a single test partition and illustrate the error structure among classes. Aggregate results over the 30 repetitions are reported in Table 1 and Figure 6.
Figure 8.
Diagram of hierarchical classifier results.
Table 2 compares the proposed approach with previous research. The second column lists the project’s development methods, while the third column identifies the PD stages the project detects. The fourth column shows the database used in the study, the fifth column shows the classification method used, and the sixth column shows the accuracy obtained.
Table 2.
Selection of Slices: Results.
3.2. Discussion
The main purpose of this study was to identify PD at E2, using fMRI sequences as a non-invasive biomarker in the premotor phase. From a neurological perspective, timely detection of PD is critical, as motor symptoms typically manifest when approximately 80% of the dopaminergic neurons involved in movement control have already been lost. Consequently, an early diagnosis would enable more effective therapeutic strategies that could slow disease progression and improve patients’ quality of life. In this context, we propose an image-processing-based methodology that uses mRMR and Census to select and preprocess fMRI slices, respectively. Finally, we classify the patient’s clinical state using a hierarchical classifier, achieving promising results in differentiating disease stages. To achieve high accuracy, we designed a sequence of methodological steps; the results are presented below.
- Slice selection: In the initial phase of the study, 38 slices obtained from fMRI sequences were evaluated using the mRMR algorithm to identify and discard those slices that did not provide relevant information for the classification process. This mRMR-based selection strategy optimized dataset quality by prioritizing regions with greater discriminative relevance and reducing redundancy across slices. The relevance scores of each slice were calculated, and only those that exceeded the overall mean value were selected, as shown in Figure 5. From the resulting subset, we constructed different combinations for subsequent classification analysis, with slices restricted to , where .
- One slice: One of the main objectives when generating multiple combinations from the set of slices detailed in Table 1 was to identify the individual slice or set of slices that would yield the highest classification accuracy. In this configuration, we evaluated a single axial slice of the brain at rest with a spatial resolution of pixels. The best performances were achieved with slice 34 () and slice 5 (). Furthermore, as shown in the confusion matrix in Figure 7, state poses the greatest challenge among the evaluated classes.
- Two slices: In this analysis, considering the simultaneous evaluation of two slices, the input image resolution was adjusted to pixels. A notable increase in classification accuracy was observed in this scenario, rising from when analyzing a single slice to when incorporating two slices, as detailed in Table 1. This suggests that including multiple slices improves the model’s discriminatory capacity. However, as Figure 7 shows, classification errors persist, particularly in states E2 and E3, indicating that these classes overlap more in the feature space.
- Four slices: In the configuration considering the joint analysis of four axial slices, the input configuration was set to pixels. At this stage, classification accuracy increased slightly, from with two slices to . This behavior suggests that although including multiple sections tends to increase accuracy, the benefit decreases progressively as more sections are added. Furthermore, as Figure 7 shows, state E3 continues to present the greatest classification challenge, demonstrating greater overlap between classes than the other evaluated states.
- Eight slices: With the addition of eight axial slices, the input resolution was expanded to pixels. Under this configuration, we obtained an average classification accuracy of 0.947, improving over previous scenarios. However, this result also suggests a possible saturation in the model’s performance as the number of slices increases. Likewise, Figure 7 shows that state E3 continues to be the most complex to identify correctly.
- Sixteen slices: Finally, the mRMR-selected sixteen slices achieved a classification accuracy of , the highest value obtained in the experiments. However, the increase in accuracy between the four-, eight-, and sixteen-slice configurations is not significant, suggesting that the model’s performance stabilizes as more slices are added. Despite this improvement, the hierarchical classifier still struggles to distinguish between patients in states E2 and E3, indicating high similarity in their functional patterns.
We developed the proposed system to discriminate among three PD-associated states (E1, E2, and E3) using the MCT. The method achieved an average classification accuracy of , demonstrating its ability to capture discriminative patterns in fMRI images across disease progression.
We evaluated different spatial configurations to analyze the relationship between classification performance and computational cost. Using all 49 available axial slices, the MCT achieved an accuracy of , whereas the qualitative selection of 38 slices increased the performance to . However, the 16 slices selected using the mRMR algorithm provided the best trade-off between classification accuracy and computational efficiency, achieving accuracy while substantially reducing the amount of processed information.
To ensure an objective comparison, we trained and evaluated all classifiers using the same feature sets, data partitions, balancing strategies, slice combinations, and classification architectures. Under these identical experimental conditions, MCT (Table 1) consistently outperformed CT (Table 3), achieving an accuracy of 0.866 when a single axial slice was analyzed, compared with for conventional CT. Additionally, we performed Leave-One-Subject-Out (LOSO) validation to evaluate the model’s generalization capability at the subject level, as shown in Table 4. Because of the database’s inherent class imbalance, this scenario represented a considerably more challenging classification problem. Under this evaluation scheme, the multiclass classifier achieved accuracies of and with the 38-slice and 16-slice configurations, respectively. The corresponding Kappa coefficients were and , indicating substantial agreement between the predicted and actual classes. Overall, the results indicate that increasing the available anatomical information tends to improve classification performance, though it increases computational cost, as quantified in Table 5. However, the MCT achieved an excellent balance between accuracy and efficiency using only 16 slices selected via mRMR, highlighting its potential as a computer-aided diagnosis tool for early PD detection.
Table 3.
Classification performance comparison across slice configurations using traditional CT feature extraction.
Table 4.
LOSO Evaluation of Different Slice Configurations: Accuracy, Cohen’s Kappa, Class-Wise Precision, and Best Classifier. Bold values indicate the best-performing slice configuration.
Table 5.
Average computational cost as a function of the number of slices.
The class-wise analysis underlines the relevance of these results, particularly for class E2. Classifying E2 against healthy controls (E1) and advanced stages (E3) represents a complex diagnostic challenge, as E2 lies at an intermediate point between neurological normality and established pathological patterns, causing an overlap in its feature thresholds relative to adjacent classes. Despite this boundary ambiguity, the model achieved high precision in E2, ranging from to in the highlighted schemes and peaking at in optimized SVMs, as shown in Table 1 in the class precision section. This high precision is crucial in clinical practice, as it prevents false diagnoses and unnecessary interventions, allowing timely neuroprotective therapies to begin before irreversible deterioration occurs. Complementary metrics for each clinical stage, including sensitivity, specificity, F1-score, and false alarm rate, are presented in Table 6.
Table 6.
Comparative Performance Metrics of the Hierarchical Classifier Across Different fMRI Slice Sets.
However, these works perform a binary classification between healthy and diagnosed patients. For example, in Castillo et al. [32], the authors propose a computer-aided diagnosis (CAD) method that combines structural imaging data and achieves accuracy with a support vector machine (SVM) classifier.
4. Conclusions
This study proposed a non-invasive approach to PD detection using fMRI sequences, with particular emphasis on the premotor phase (E2), given the clinical importance of early diagnosis. The methodology integrates processing and machine learning algorithms to optimize the classification system’s performance. These include slice selection using the mRMR algorithm, CT-based preprocessing, and a hierarchical classification architecture comprising 25 classifiers, with the SVM classifier performing best in most experiments.
We evaluated configurations with 1 to 16 axial slices. The results show that although classification accuracy increases as more slices are incorporated, rising from with a single slice to with sixteen slices, the performance gain diminishes as additional information is included. To assess these differences statistically, we applied the Wilcoxon signed-rank test, and we present the results in Table 7. Pairwise comparisons were performed between consecutive configurations (16 vs. 8, 8 vs. 4, 4 vs. 2, and 2 vs. 1 slices). The results indicated that no statistically significant differences exist between the 16- and 8-slice configurations (), the 8- and 4-slice configurations (), or the 4- and 2-slice configurations (). In contrast, a statistically significant difference was observed only between the 2- and 1-slice configurations (). Furthermore, the 95% confidence intervals for the 16-slice ([, ]) and 8-slice ([, ]) configurations substantially overlap, indicating comparable performance despite the reduction in the amount of information analyzed. Overall, these findings suggest that an eight-slice configuration is sufficient to achieve high classification accuracy while reducing computational cost and problem dimensionality without significantly compromising model performance.
Table 7.
Wilcoxon signed-rank test results for consecutive slice configurations. Mean performance, 95% confidence intervals, medians, and statistical significance are reported.
Although spatio-temporal fMRI descriptors provide a more comprehensive representation, they entail higher computational complexity, memory consumption, and feature dimensionality. Therefore, in this study, we selected the Census transform as a low-cost spatial descriptor because its local binary comparisons extract discriminative information without relying on voxel-wise temporal modeling. This approach reduces the analysis to a lighter, more feasible encoding while preserving the structural heterogeneity required for classification. Overall, the results confirm the proposed method’s effectiveness in automatically detecting PD stages E1, E2, and E3; moreover, it achieves acceptable accuracy, reinforcing its applicability in clinical contexts where acquisition and processing resources may be limited. Finally, compared with previous work, the presented methodology achieves competitive results, particularly in detecting the premotor phase, thereby significantly contributing to the development of early diagnostic tools for neurodegenerative diseases.
Author Contributions
Conceptualization, M.-A.I.-M. and D.-L.A.-O.; methodology, M.-A.I.-M. and V.H.-R.; software, M.-A.I.-M. and V.H.-R.; validation, D.-L.A.-O. and I.G.; formal analysis, V.H.-R. and O.A.-C.; investigation, V.H.-R. and A.O.-G.; resources, D.-L.A.-O. and I.G.; data curation, V.H.-R. and A.O.-G.; writing—original draft preparation, V.H.-R., O.A.-C. and A.O.-G.; writing—review and editing, D.-L.A.-O., I.G. and M.-A.I.-M.; visualization, V.H.-R., D.-L.A.-O. and O.A.-C.; supervision, D.-L.A.-O., I.G. and M.-A.I.-M.; project administration, D.-L.A.-O. and M.-A.I.-M.; funding acquisition, D.-L.A.-O., I.G. and M.-A.I.-M. All authors have read and agreed to the published version of the manuscript.
Funding
This research was funded by the Secretaría de Ciencias, Humanidades, Tecnología e Innovación (SECIHTI), CVU Nos. 738317 and 957701, and by the University of Guanajuato.
Institutional Review Board Statement
This study is a secondary analysis of de-identified, publicly available data from the Parkinson’s Progression Markers Initiative (PPMI). The PPMI study was conducted in accordance with the Declaration of Helsinki and approved by the institutional review board (IRB) or an independent ethics committee at each participating clinical site. Because this work used only anonymized data and did not involve interaction with human subjects or access to identifiable private information, no additional ethical approval was required. Data were accessed and used under the terms of the signed PPMI Data Use Agreement.
Informed Consent Statement
Written informed consent was obtained from all participants at the time of enrollment in the PPMI study at each participating clinical site. No additional consent was required for this secondary analysis of de-identified data.
Data Availability Statement
The data used in this study are openly available from the Parkinson’s Progression Markers Initiative (PPMI) database (https://www.ppmi-info.org/access-data-specimens/download-data, accessed on 12 February 2024). Access to PPMI data requires registration and execution of the PPMI Data Use Agreement. For up-to-date information on the study, visit https://www.ppmi-info.org. The source code developed for this study is available from the corresponding author upon reasonable request. PPMI—a public-private partnership—is funded by the Michael J. Fox Foundation for Parkinson’s Research and funding partners, including AbbVie, AcureX, Alamar, Aligning Science Across Parkinson’s (ASAP), Arrowhead, Arvinas, AskBio, BIAL, BioArctic, Biohaven, BlueRock, Bristol Myers Squibb, Calico Labs, Capsida Biotherapeutics, Critical Path Institute, DaCapo Brainscience, Denali, Edmond J. Safra Foundation, Gain Therapeutics, GE HealthCare, Genentech, GSK, Insitro, Johnson & Johnson Innovative Medicine, Eli Lilly, Lundbeck, Merck, Neumora, Neuron23, Novartis, Olink, Regeneron, Roche, Sanofi, Tenvie, UCB, Vanqua Bio, Voyager Therapeutics, and the Weston Family Foundation.
Acknowledgments
This work was partially supported by the Secretaría de Ciencias, Humanidades, Tecnología e Innovación (SECIHTI), CVU No. 738317 and 957701, and by the University of Guanajuato. The authors acknowledge the members of the Electronics Engineering Department and the Multidisciplinary Studies Department at the University of Guanajuato, Mexico, for their valuable support and collaboration (e-mails: v.hernandez.ramirez@ugto.mx (V.H.-R.); dora.almanza@ugto.mx (D.-L.A.-O.); o.almanzaconejo@ugto.mx (O.A.-C.); a.ortegagonzalez@ugto.mx (A.O.-G.); guryev@ugto.mx (I.G.); ibarram@ugto.mx (M.-A.I.-M.).
Conflicts of Interest
The authors declare no conflict of interest. The funders also had no role in the study’s design, data collection, analysis, or interpretation; manuscript writing; or the decision to publish the results.
References
- Vivar-Estudillo, G.; Hajari, N.; Ibarra-Manzano, M.A.; Cheng, I. Parkinson’s Disease Detection and Diagnosis from fMRI: A Literature Review. In International Conference on Human-Computer Interaction; Springer: Cham, Switzerland, 2021; pp. 630–638. [Google Scholar] [CrossRef] [Scilit]
- Goetz, C.G.; Tilley, B.C.; Shaftman, S.R.; Stebbins, G.T.; Fahn, S.; Martinez-Martin, P.; Poewe, W.; Sampaio, C.; Stern, M.B.; Dodel, R.; et al. Movement Disorder Society-Sponsored Revision of the Unified Parkinson’s Disease Rating Scale (MDS-UPDRS). Mov. Disord. 2008, 23, 2129–2170. [Google Scholar] [CrossRef] [Scilit]
- Goetz, C.G.; Fahn, S.; Martinez-Martin, P.; Poewe, W.; Sampaio, C.; Stebbins, G.T.; Stern, M.B.; Tilley, B.C.; Dodel, R.; Dubois, B.; et al. MDS-UPDRS: Official Movement Disorder Society Translation and Update; International Parkinson and Movement Disorder Society: Milwaukee, WI, USA, 2021. [Google Scholar]
- Hathaliya, J.; Modi, H.; Gupta, R.; Tanwar, S.; Alqahtani, F.; Elghatwary, M.; Raboaca, M.S. Stacked Model-Based Classification of Parkinson’s Disease Patients Using Imaging Biomarker Data. Biosensors 2022, 12, 579. [Google Scholar] [CrossRef] [Scilit]
- Titze-de-Almeida, R.; Titze-de-Almeida, S.S.; Ferreira, G.; Silva, A.P.B.; de Paula Brando, P.R.; Oertel, W.H.; Rodrigues, R.N.D. MicroRNA Signatures in Prodromal REM Sleep Behavior Disorder and Early Parkinson’s Disease as Noninvasive Biomarkers. Sleep Med. 2021, 78, 160–168. [Google Scholar] [CrossRef] [Scilit]
- Rizzo, G.; Copetti, M.; Arcuti, S.; Martino, D.; Fontana, A.; Logroscino, G. Accuracy of Clinical Diagnosis of Parkinson’s Disease: A Systematic Review and Meta-analysis. Neurology 2016, 86, 566–576. [Google Scholar] [CrossRef] [Scilit]
- Savica, R.; Rocca, W.A.; Ahlskog, J.E. When Does Parkinson Disease Start? Arch. Neurol. 2010, 67, 798–801. [Google Scholar] [CrossRef] [Scilit]
- Wu, S.; Xue, Q.; Qin, X.; Wu, X.; Kim, P.; Chyr, J.; Huang, L. The Potential Regulation of A-to-I RNA Editing on Genes in Parkinson’s Disease. Genes 2023, 14, 919. [Google Scholar] [CrossRef] [Scilit]
- Marsal-García, L.; Urbizu, A.; Arnaldo, L.; Campdelacreu, J.; Vilas, D.; Ispierto, L.; Beyer, K. Expression Levels of an Alpha-Synuclein Transcript in Blood May Distinguish Early Dementia with Lewy Bodies and Parkinson’s Disease. Int. J. Mol. Sci. 2021, 22, 725. [Google Scholar] [CrossRef] [Scilit]
- Rahayel, S.; Tremblay, C.; Vo, A.; Zheng, Y.Q.; Lehéricy, S.; Arnulf, I.; Dagher, A. Brain Atrophy in Prodromal Synucleinopathy Is Shaped by Structural Connectivity and Gene Expression. Brain 2022, 145, 3162–3178. [Google Scholar] [CrossRef] [Scilit]
- Ye, G.; Li, Y.; Zhou, L.; Zhang, Y.; Zhu, L.; Zhao, A.; Liu, J. Predictors of Conversion to Alpha-Synucleinopathy Diseases in Idiopathic REM Sleep Behavior Disorder. J. Park. Dis. 2020, 10, 1443–1455. [Google Scholar] [CrossRef] [Scilit]
- Lu, J.; Xu, Y.; Quan, Z.; Chen, Z.; Sun, Z.; Qing, H. Dysregulated MicroRNAs in Neural System: Implication in Pathogenesis and Biomarker Development in Parkinson’s Disease. Neuroscience 2017, 365, 70–82. [Google Scholar] [CrossRef] [Scilit]
- Marek, K.; Chowdhury, S.; Siderowf, A.; Lasch, S.; Coffey, C.S.; Caspell-Garcia, C.; Larsen, L. The Parkinson’s Progression Markers Initiative (PPMI): Establishing a PD Biomarker Cohort. Ann. Clin. Transl. Neurol. 2018, 5, 1460–1477. [Google Scholar] [CrossRef] [Scilit]
- Nguyen, K.P.; Raval, V.; Treacher, A.; Mellema, C.; Yu, F.F.; Pinho, M.C.; Montillo, A.A. Predicting Parkinson’s Disease Trajectory Using Clinical and Neuroimaging Baseline Measures. Park. Relat. Disord. 2021, 85, 44–51. [Google Scholar] [CrossRef] [Scilit]
- Xu, N.; Zhou, Y.; Patel, A.; Zhang, N.; Liu, Y. Parkinson’s Disease Diagnosis Using Topological Machine Learning of Resting-State fMRI. Neuroscience 2023, 509, 43–50. [Google Scholar] [CrossRef] [Scilit]
- Heim, B.; Krismer, F.; De Marzi, R.; Seppi, K. MRI for the Diagnosis of Parkinson’s Disease. J. Neural Transm. 2017, 124, 915–964. [Google Scholar] [CrossRef] [Scilit]
- Neehal, A.H.; Azam, M.N.; Islam, M.S.; Hossain, M.I.; Parvez, M.Z. Prediction of Parkinson’s Disease by Analyzing fMRI Data Using Supervised Learning. In IEEE Region 10 Symposium (TENSYMP); IEEE: Piscataway, NJ, USA, 2020; pp. 362–365. [Google Scholar] [CrossRef] [Scilit]
- Solana-Lavalle, G.; Rosas-Romero, R. Classification of PPMI MRI Scans with Voxel-Based Morphometry and Machine Learning. Comput. Methods Programs Biomed. 2021, 198, 105793. [Google Scholar] [CrossRef] [Scilit]
- van der Voort, S.R.; Smits, M.; Klein, S. DeepDicomSort: Automatic Sorting Algorithm for Brain MRI Data. Neuroinformatics 2021, 19, 159–184. [Google Scholar] [CrossRef] [Scilit]
- Yang, Y.; Hu, L.; Chen, Y.; Gu, W.; Lin, G.; Xie, Y.; Nie, S. Identification of Parkinson’s Disease Using MRI and Genetic Data from the PPMI Cohort: An Improved Machine Learning Fusion Approach. Front. Aging Neurosci. 2025, 17, 1510192. [Google Scholar] [CrossRef] [Scilit]
- López Limas, L.; Manian, V. Early Parkinson’s Disease Prediction Using rS-fMRI Functional Connectivity and Autoencoder Graph Convolutional Network. IEEE Access 2025, 13, 178862–178875. [Google Scholar] [CrossRef] [Scilit]
- Quattrone, A.; Antonini, A.; Vaillancourt, D.E.; Seppi, K.; Ceravolo, R.; Strafella, A.P.; Quattrone, A. MRI Measure to Differentiate PSP from Parkinson’s Disease. Mov. Disord. 2021, 36, 681–689. [Google Scholar] [CrossRef] [Scilit]
- Peng, H.; Long, F.; Ding, C. Feature Selection Based on Mutual Information: Max-Dependency, Max-Relevance, and Min-Redundancy. IEEE Trans. Pattern Anal. Mach. Intell. 2005, 27, 1226–1238. [Google Scholar] [CrossRef] [Scilit]
- Zabih, R.; Woodfill, J. Non-Parametric Local Transforms for Computing Visual Correspondence. In European Conference on Computer Vision; Springer: Berlin/Heidelberg, Germany, 1994; pp. 151–158. [Google Scholar]
- Fröba, B.; Ernst, A. Face Detection with the Modified Census Transform. In Sixth IEEE International Conference on Automatic Face and Gesture Recognition; IEEE: Piscataway, NJ, USA, 2004; pp. 91–96. [Google Scholar]
- Qiao, S.; Liu, H.; Huang, M.; Guo, Q.; Wang, M.; Zhao, Z.; Liu, C.; Prajapat, S.; Ghayvat, H. Semi-Supervised Medical Image Segmentation with Dual-View Differential Feature Reinjection. IEEE J. Biomed. Health Inform. 2026, 1–9. [Google Scholar] [CrossRef] [Scilit]
- Waschkies, K.F.; Soch, J.; Darna, M.; Richter, A.; Altenstein, S.; Beyle, A.; Kizilirmak, J.M. Machine Learning Classification of Alzheimer’s Disease Using Personality Traits, Anxiety, Depression. Int. J. Geriatr. Psychiatry 2023, 38, e6007. [Google Scholar] [CrossRef] [Scilit]
- Liu, M.; Li, B.; Hu, D. Autism Spectrum Disorder Studies Using fMRI and Machine Learning: A Review. Front. Neurosci. 2021, 15, 697870. [Google Scholar] [CrossRef] [Scilit]
- Su, D.; Cui, Y.; Liu, Z.; Chen, H.; Fang, J.; Ma, H.; Zhou, J.; Feng, T. Altered Brain Activity in Depression of Parkinson’s Disease: A Meta-Analysis and Validation Study. Front. Aging Neurosci. 2022, 14, 806054. [Google Scholar] [CrossRef] [Scilit]
- Qiao, S.; Gao, J.; Wang, M.; Guo, Q.; Liu, C.; Wang, S.; Prajapat, S.; Shabaz, M. Liquid-Sequencer: A Lightweight Liquid Neural Network for Real-Time Fetal Congenital Heart Disease Diagnosis. IEEE J. Biomed. Health Inform. 2026, 1–10. [Google Scholar] [CrossRef] [Scilit]
- Vijayakumari, A.A.; Fernandez, H.H.; Walter, B.L. MRI-Based Multivariate Gray Matter Volumetric Distance for Predicting Symptom Progression. Sci. Rep. 2023, 13, 17704. [Google Scholar] [CrossRef] [Scilit]
- Castillo Barnes, D.; Martínez Murcia, F.J.; Jiménez Mesa, C.; Salas González, D.; Ramírez Pérez de Inestrosa, J.; Gorriz Sáez, J.M. Nonlinear Weighting Ensemble Learning Model to Diagnose Parkinson’s Disease Using Multimodal Data. Int. J. Neural Syst. 2023, 33, 2350041. [Google Scholar] [CrossRef] [Scilit]

Disclaimer/Publisher’s Note: The statements, opinions and data contained in all publications are solely those of the individual author(s) and contributor(s) and not of MDPI and/or the editor(s). MDPI and/or the editor(s) disclaim responsibility for any injury to people or property resulting from any ideas, methods, instructions or products referred to in the content. |
© 2026 by the authors. Licensee MDPI, Basel, Switzerland. This article is an open access article distributed under the terms and conditions of the Creative Commons Attribution (CC BY) license.