Abstract
The Internet of Things (IoT) enables smart devices to connect, share and exchange data with each other through the internet. Since an IoT environment is open and dynamic, IoT participants may need to collaborate with unknown entities with no proven track record. To ensure successful collaboration among these entities, it is important to establish a mechanism that ensures all entities operate in a trustworthy manner. We present a trust and reputation model that can be used to select the best service provider in an IoT environment. Our proposed model, IoT-CADM (Comprehensive Agent-based Decision-making Model for IoT) is an agent-based decentralised trust and reputation model that can be used to select the best service provider for a particular service based on multi-context quality of service. IoT-CADM is developed using a smart multi-agent IoT environment where information about entities is collected and evaluated using a trust and reputation algorithm. We evaluated the performance of the proposed model against some other well-known models in a simulated smart factory supply chain system. Our experimental results showed that the proposed IoT-CADM achieved the best performance.
1. Introduction
The Internet of Things (IoT) is a network of inter-connected devices that enables communication and sharing of data with one another. It offers effective real-time solutions for both simple and complex systems [1,2]. IoT encompasses a wide array of connected devices equipped with sensors such as radio frequency identification (RFID) tags, personal digital assistants (PDAs), sensors, actuators, smart mobiles, refrigerators, medical devices and security systems. IoT also includes virtual objects, such as data and virtual desktops in the cloud. Due to its characteristics, IoT appeals to a wide variety of intelligent applications. To address distinct market sectors and use cases, sub-categories of IoT have been created to assist individuals in making more informed decisions, resulting in savings of both money and time [3,4]. The Industrial Internet of Things (IIoT) is one of these categories. IIoT is specifically tailored to devices designed for use in industrial settings. Smart Factories and Industry 4.0 leverage IIoT and other computing technologies to enhance automation.
The increased utilisation of IIoT and the prevalence of automatic and autonomous behaviour necessitates specific mechanisms for assessing the trustworthiness of data from external sources and identifying misbehaving actors within the system, whether caused by misconfiguration, failure, or malicious intent. In addition, the need to evaluate trustworthiness when collaborating with other entities is becoming more urgent, especially in dynamic open environments [5,6,7]. This is accomplished through the development of Trust Management systems.
Current trust management systems predominantly rely on physical attributes, including factors like memory error rates, radio signal strength, number of packets received/forwarded, repetition rate, delay factors, and energy consumption, to gauge and assess trustworthiness [1,7]. However, relying solely on physical characteristics is insufficient for measuring trustworthiness, especially when these devices become increasingly intelligent and IoT environments become more decentralised, dynamic, and inter-connected. Trust management systems that depend on non-physical parameters have also been established but they often encounter challenges, such as collecting essential information about the entities, storing information, scoring and ranking, and selecting entities. There is also a need to address how these systems can tackle various IoT challenges, including integrity, heterogeneity, scalability, openness, security, and data storage. Additionally, these systems must also address how to handle misbehaving entities or those delivering inferior or unsatisfactory services.
Trust Management systems are important in internet and social computing systems to assess the level of confidence and trustworthiness that should be attributed to other parties before initiating cooperation and interaction [1,7,8,9,10]. This enables IoT devices to contact a predefined service provider to determine how, when and with whom to establish connections without jeopardising their objectives. In this context, the central research question of this study is: “How to select the best service provider in a dynamic smart IoT environment (such as IIoT) based on the trust and reputation of the service provider?”.
To address this question, we introduce an IoT agent-based decentralised trust and reputation model known as IoT-CADM (Comprehensive Agent-based Decision-making Model for IoT). This model selects the most trustworthy and dependable service providers for specific services based on multi-context service quality. IoT-CADM collects data from various entities and employs a trust and reputation algorithm to guarantee that service consumers are serviced by the best service providers in the IoT environment, thereby enhancing service consumers’ satisfaction. The trust score is calculated by taking into account the direct experience, the indirect experience and the market value of each agent. The direct and indirect experiences are calculated based on the quality of the service provided (QoS) for the service required and the quality of the service provider (QoP) in providing other services other than the service required. As the objective of this study is to select the best service provider for a particular service, we have included market value in the calculation of the trust score to ensure that only agents with a good track record are selected. The use of multi-context QoS and QoP in evaluating the direct experience and indirect experience in combination with the market value to calculate the trust score differentiates our approach from other existing models. In addition, it also allows new entrants to be considered in the absence of information on direct experience and indirect experience. Our model can also deal with malicious agents.
This study employs quantitative research methodology combined with a case study approach. To evaluate the performance of the proposed model against other existing models (ReGreT [11], SIoT [8], and R-D-C [12]), we simulated a smart factory based on the SIPOC-Supply-Chain approach (SIPOC stands for suppliers, inputs, process, outputs, and customers.). This smart factory was developed using a multi-agent framework, JADE (JAVA Agent Development Framework). The proposed scenario was intended to mirror the anticipated requirements of agent-based smart factories in the future. We evaluated the models using the multi-criteria decision analysis technique known as TOPSIS (Technique for Order of Preference by Similarity to Ideal Solution) [13]. This evaluation was based on a selection of distinct parameters carefully chosen to ensure a fair and equitable comparison.
The remainder of this paper is structured as follows. Background information and the current state of the art is discussed in Section 2. Section 3 provides a detailed discussion of the IoT-CADM model. Section 4 reports the evaluation results of the model in environments populated by honest and dishonest agents and compares its performance with other trust and reputation models. Section 5 concludes and outlines avenues for further work.
2. Related Work
Trust can be defined as the subjective likelihood that an individual A anticipates another individual B to execute a specific action upon which the well-being of A relies [14]. In their definition, ref. [14] incorporated the notion of dependence on the trusted party, and the perceived reliability (probability) of the trusted party from the perspective of the trusting party. However, trust can be more complex. For example, having high trust in a person in general is not sufficient to determine whether one should become reliant on that individual in a specific situation. Trust is important in business activities because it forms the foundations for healthy and productive relationships between individuals and organisations. The concept of trust is also introduced in social science to depict a scenario in which a community member called the trustor relies on the actions of another community member known as the trustee [15,16]. On the other hand, reputation often relies on third-party ratings and recommendations. According to [4,14,15,17], reputation is the perception people hold about someone or something, formed through past experiences following direct or indirect interactions with that entity. Both trust and reputation are used to support data and service management and to boost entities’ collaboration in IoT environments.
Trust is represented using a single value with many properties. Ruan and Duressi [18], Yu et al. [7] and Jøsang et al. [14] used the term dimension to denote a number of parameters; separated distrust, time stamp, context-aware and confidence. Firstly, separated distrust (which is the complement of trust) can be used as a representation of trust. A high value of separated distrust represents a high level of trustworthiness, and a low value represents a low level of trustworthiness (untrustworthiness). Secondly, a time stamp is incorporated in the trust value to address the dynamicity of trust. This time stamp can be updated and is used to handle malicious attacks. Thirdly, trust is context-dependent, whereby a trustee may exhibit different trust degrees based on various contexts. Finally, confidence is used to measure the extent to which the trustor is certain about the trust assessment.
Trust can be derived from three sources [18,19,20]: attitude, experience and behaviour. Attitude represents the trustor’s opinion towards the trustee. With experience, the trustor evaluates the trustee’s performance based on previous interactions or transactions with the trustee. Trust can also be evaluated based on similarity, social or physical behaviours.
Alhandi et al. [21] classified trust models based on trust characteristics, trust architecture, trust distribution, trust aggregation technique, trust model type and attack type. Two types of trust attributes can be found in IoT environments: non-social trust and QoS and social trust. Non-social trust deals with high quality services in response to service requests and social trust deals with the owners of the IoT devices. Trust architecture can be centralised, distributed or decentralised, while trust distribution can be direct, indirect and hybrid. Hybrid is the most common source of trust and combines direct trust and indirect trust.
Trust Management Systems (TMSs) play an important role on the Internet and social computing systems. Applications are designed to help users make better decisions based on trust information. TMSs can be divided into three parts [1,7,18,22]. Firstly, trust modelling deals with how to represent trust relationships in computational models. Secondly, trust management describes how to collect evidence and perform risk evaluation. Finally, decision making allows TMSs to work more intelligently and efficiently.
TMSs have been developed as a mechanism for open and dynamic environments, where unknown parties can interact with the purpose of acquiring or offering services; this mechanism allows parties to decide which requesters are qualified to gain access to the resource, and which server is trusted to provide the requested resource, based on the certified statements provided by the interacting parties [22].
To date, research on data sensitivity and privacy has primarily concentrated on assessing trustworthiness with the aim of optimising satisfaction and performance in IoT applications, particularly those involving decision-making and partner-selection [5,6,7,23]. In addition, work on trust management has focused on distributed wireless networks [24], applications of trust techniques in IoT domains, including the use of an intelligent agent [25], as well as wireless sensor networks and RFIDs [21]. The literature on trust and reputation models can be broadly categorised into three types: trust and reputation in IoT, trust and reputation in a Multi-Agent System (MAS) and the combination of IoT and agent-based trust and reputation.
2.1. Trust and Reputation in IoT
IoT can be viewed as a peer-to-peer, owner-centric community, comprising of a vast array of devices (or things) that either request or offer services on behalf of their owners. Given that conventional IoT systems are typically sensitive to information security and privacy concerns [5,6,7], it is important to assess trustworthiness for two primary reasons. Firstly, it enhances the satisfaction and performance of IoT applications. Secondly, it is crucial to maintain effective collaboration among the nodes deployed within the network and to guarantee trustworthy operation of these nodes [5,6,7]. The rationale for providing a trust management system for IoT systems is to safeguard against misbehaving devices (or owners) conducting discriminatory attacks and to ensure that the IoT ecosystem remains secure and fair [1,4,12,26].
In Public Reputation Systems (PRSs), users rate each other to establish trust by means of reputation. This kind of reputation system relies on a central unit (server), which collects and consolidates all feedback following each event. Four models based on a centralised model have been proposed. These are IoTrust [27], HAMS (Health/Accessibility Monitoring Service) [23], IoT-TM (IoT-Trust Management) [5], and Hierarchical Zones [1]. IoTrust is a centralised trust architecture comprising of five layers: the nodes layer, software defined network layer, the organization layer, and the reputation management layer [27]. The goal of the model is to identify reliable and trustworthy partners. The reputation management layer evaluates the behaviour-based organisation reputation for all organisations and nodes engaged in the collaborative activities. This is intended to prevent a malicious node (or organisation) from gaining access to the tags in the objects layer and potentially initiating various attacks that could severely damage the network. In a similar context, Shayesteh et al. introduced the HAMS model [23]. HAMS serves as a centralised service that gathers real-time observations from peers, assesses their contributions and calculates trust scores for users (entities) using Bayesian learning-based procedure. IoT-TM is a cluster-based approach designed to tackle IoT trust management issues, including countering bad-mouthing attacks and memory-efficient trust computation [5]. The architecture of IoT-TM comprises cluster nodes, master nodes, clusters and a super node. These IoT nodes are organised into clusters according to their trustworthiness. The trust values of these nodes may fluctuate (rise or fall) depending on the interactions with others within the same cluster. A hierarchical network concept for intrusion detection by partitioning IoT nodes into distinct zones or clusters was introduced by [1]. The trusted base station manages these zones, ensures the security of data transmission, and identifies and removes any malicious nodes that are attempting to spy on others. Each node must evaluate the trustworthiness of a peer node that wishes to communicate with it based on physical network parameters, such as received radio power, noise, and number of received packets.
Utilising a centralised reputation system like PRS carries inherent risks which may result in single points of failure. These include physical and logical network failures and security attacks. To mitigate these risks, a range of decentralised trust and reputation systems and mechanisms have been developed. A smart trust management method was introduced by [3] to diminish the influence of On–Off attackers. Using machine learning and an adaptable sliding window technique, this model evaluates the trustworthiness of IoT resources by categorising the data into classes and flexibly adjusting the window size according to these classes. Only values that are within the presumed trust range (values between the lower and upper bounds of the elastic sliding window) are acceptable. Otherwise, out-of-range values are considered as outliers. The Social Internet of Things (SIoT) is a trust management scheme [8]. SIoT operates within an edge computing environment, which requires each active node (person) to use a handheld device (mini-edge servers) to handle traffic forwarding and computational functions. SIoT calculates the trustworthiness of any entity keen to collaborate with its peers. The trust score is calculated by adding the scores for direct observations, indirect recommendations, centrality, energy and service. Since all devices in SIoT are low-powered and use less energy, energy consumption is used to identify if a node is involved in an attack.
An innovative three values (3v) trust model was introduced by [28] for IoT-ad hoc systems with the purpose of mitigating the presence of misbehaving entities within IoT-ad hoc network-based applications. The model uses a novel logic called 3v-TCTLC to reason about commitments in uncertain environments regarding trust. The proposed model was validated using smart health monitoring and smart home systems.
Recent research on trust management in IoT systems includes an adaptive trust model based on recommendation filtering algorithms for IoT systems [29], tackling the uncertainty of trust by introducing a new trust method using behavioural similarity between sensor nodes [30], and the development of a hybrid trust management approach using Probabilistic Neighbourhood Overlap in combination with a mix of a dynamic and static approach [31]. Another study proposed a context-dependent trust management technique (ConTrust) for job selection and allocation in a SIoT environment [32], while [33] proposed a decentralised trust measurement model that combines edge computing and blockchain technology. Other works on trust models focused on mobile edge computing [34,35,36], resource sharing [37], mobile vehicle networks [19,38], intrusion detection [39,40,41] and fog computing [42,43,44].
2.2. Trust and Reputation in MAS
Trust and reputation mechanisms are one of the key elements in designing multi-agent systems (MASs). In distributed environments, agents have no prior information about the behaviour of their potential partners. As such, these agents have no choice but to rely on trust and reputation mechanisms to assess this behaviour. In this context, trust and reputation mechanisms are employed to manage interactions among the agents and to safeguard good agents from fraudulent ones [45].
Marsh, in 1994 [46], presented a formalism approach for a trust and reputation mechanism in MAS. The proposed mechanism can be employed by an agent to determine whether it is advantageous to collaborate with another agent by relying on their prior direct interactions. This model describes three types of trust: basic trust, general trust, and situational trust. Basic trust is the general disposition to trust irrespective of who is the agent in question and is calculated from past experiences for all situations. General trust represents the general trust between the agent (x) and another agent (y) without reference to any particular situation. Situational trust is used to compute the degree of trust that one agent holds for another agent in a specific situation. In this model, the trust value ranges from −1 to + 1, where −1 denotes a negative trust (distrust), 0 indicates no trust, and +1 signals a strong positive trust.
Context-aware Bernoulli Neural Network-based Reputation Assessment (COBRA) [47] is a framework that accurately predicts the trustworthiness of a target agent. In this model, an agent attempts to predict the conditional probability p to determine the trustworthiness of the other agent for a given context. This approach does not make any assumptions about the presence of stereotypical or socio-cognitive information. In MAS, computational trust and reputation models have traditionally considered two types of information sources: the direct interactions among agents, and information provided by society members about their past experiences. The Comprehensive Reputation Model (CRM) [17] is a probabilistic-based reputation model with the goal of securing multi-agent systems by mitigating the influence of self-interested agents. In the online evaluation, agents assess the trustworthiness of other relatively unknown agents by collecting relevant information. This data is collected from their own previous direct interactions or other trustworthy agents, who can offer recommendations in the form of ratings (indirect interactions). In the offline evaluation, the trustor agents are expected to update the consulting agents with their information about the trustee agent after a variable period of direct interactions. This is to minimise the estimation error, which improves the accuracy of the system.
The R-D-C model [12] calculates trust by combining the scores for “Reputation-Disrepute-Conflict” for all other parties in the environment. Disrepute describes negative opinions, while conflict captures the consistency of the agent behaviours. Reputation represents positive opinions and is used to improve the selection process for a trustworthy provider in a multi-agent system. In this model, the agent calculates the R-D-C value for each provider and picks the most trustworthy provider using a decision matrix.
The ReGreT system [11] uses social relations as a third source of information, apart from the information obtained from direct and indirect interactions. ReGreT bolsters the agent’s abilities to handle trust and reputation. The main goal is to enhance the agent’s performance in a complex e-commerce environment and assist consumers in making rational decisions. ReGreT takes into account direct experiences, information from third-party agents (indirect experiences), and social structures to compute trust, reputation, and credibility values. The result of experiments indicated that a dynamic method to collect and combine the different sources of information is the preferred method.
2.3. Agent-Based Trust and Reputation in IoT
The concept of multiple agents working together and collaborating with each other in an IoT environment is very appealing. A new generation of IoT devices have the potential to work autonomously, make rational decisions and negotiate with other IoT devices to achieve a specific goal. In this environment, IoT applications will have the ability to solve complex problems and, in turn, maximise their performance.
Trustworthy Agent Execution Chip (TAEC) is an autonomic-agent-trust model for IoT systems [48], implemented on a physical chip to improve security in dynamic IoT environments. The Trustable Agent comprises the task entity, the attributes and a security and reliability protection module. These agents are embedded in the sensor nodes and it is assumed that each sensor node must install a TAEC. These agents run in containers, which are managed by agencies. Agencies provide services, such as communication, registration, management, migration, persistence and security and reliability protection.
In a similar work, a centralised Trust Management System (TMS) manages security procedures by monitoring previous interactions in the network to identify malicious attacks and self-serving behaviour in the context of IoT [9]. In this model, the TMS obtains information about the trustworthiness of the available proxies and service providers. After the evaluation process and service provision, the node is required to submit an evaluation report (feedback with values −1, 0 and 1) to the TMS. This report is used in the subsequent trustworthiness evaluation by other nodes and is accessible to any node needing to interact with available proxies.
Privacy-preserving and reputation in the distributed Machine-to-Machine (M2M-REP) environment was proposed by [49]. M2M-REP detects infected and malicious machines that compromise the network integrity. The presence of these malicious machines reduces data security and increases financial losses. M2M-REP evaluates the global reputation scores for any machine by aggregating the direct trust scores from other machines it interacted with. This process is carried out using a directed weighted graph, which represents the human–machine or machine–machine network.
A study on the development of a trust estimation model as part of a decision-making framework was conducted by [50]. The model empirically computes and evaluates the trustworthiness of agents in MAS. In this setting, an agent can choose to cooperate and collaborate with trustworthy agents only. The evaluation model used in this work is adapted from reinforcement learning and Markov Games. The result of the experiments showed that the trust estimation model performed better than other existing trust models.
An efficient and effective technique for organising ad hoc teams of free moving vehicles, sensors and smart devices (known as Automated Guided Vehicles (AGV)) within a smart factory environment was proposed by [51]. This work defined a trust measure based on the reliability and reputation of AGVs, which are computed based on the feedback released for the AGVs’ activities in the factory. Additionally, they designed a trust framework that utilises the trust measure to support the formation of virtual, temporary and trust-based teams of mobile intelligent devices. The trustworthiness of a single AGV is calculated based on effectiveness and efficiency. Effectiveness is defined as customer satisfaction with respect to the job performed by the AGV. This can be thought of as the reputation of the AGV in the customer community. Efficiency is defined as the capability of the AGV in complying with the assembly constraints (such as time) during the product assembly process. In this work, it was assumed that there are no malicious agents in the smart factory. This work was evaluated through a set of experimental results and showed that the proposed trust framework can improve workshop performance in terms of effectiveness and efficiency.
In summary, IoT devices will become more intelligent in the future, and will have the ability to communicate and cooperate with other entities that are not predefined. These agents should be able to decide “how”, “when” and “with whom” to engage in collaboration, negotiation and operations on behalf of their owner and should take into account multi-context Quality of Service (QoS). The majority of existing models rely on physical properties to determine trust and reputation over metrics that measure actual performance. On the other hand, existing trust management systems, which rely on non-physical parameters, have not fully considered how information about entities can be collected, stored, scored and ranked. In addition, limited work has been carried out on how malicious entities are dealt with. To address these gaps, we developed a trust and reputation model (IoT-CADM).
3. IoT-CADM Design
IoT-CADM is a decentralised agent-based decision-making model with the primary objective of avoiding the drawbacks associated with centralised reputation systems. These drawbacks include issues such as dishonest agents trying to manipulate overall ratings to their advantage. These agents may use various tactics, such as self-promotion attacks, bad-mouthing attacks, and ballot-stuffing attacks. IoT-CADM is also a context-aware agent-based framework, as it can handle multiple contexts in its trust evaluation. It calculates the trustworthiness and degree of confidence of other agents using IoT-TESM (IoT-CADM Trust Evaluation and Selection model). This trust score is calculated by aggregating the trust scores for information from multiple sources. IoT-TESM uses a dynamic technique called ASW (Auto-Scale Weight) to dynamically adapt the weights of the different trust scores. The adaptation of these weights is based on the prevailing conditions with the objective of generating an accurate representation of the overall trust score.
3.1. IoT-CADM Trust Evaluation and Selection Model (IoT-TESM)
Within IoT-CADM, a service consumer agent uses IoT-TESM to calculate the trust scores of provider agents that offer the required service. By computing and assessing the trust score of each provider agent, this service consumer agent can decide how, when and whom to collaborate with. The trust score is calculated based on multi-context quality of service (QoS). In this setting, QoS is defined as the measure of the agent’s overall performance in the provision of a specific service. IoT-CADM proposes two approaches to measure the quality of service: the quality of service provided (QoS) and the quality of the service provider (QoP). The inclusion of QoP provides more opportunities for new service providers to be considered and decreases the effect of bad-mouthing (negative ratings) and ballot-stuffers (fake ratings). There are seven parameters for QoS as shown in Table 1. In more detail, to consider a specific service offered by a service provider, the service consumer needs to access information related to the service, which includes the service lead time (duration between the initiation of the service and the execution of the service), the service similarity (how similar is the service to the specific service being requested), the description accuracy of the service (how similar is the service description to the specific service being requested), the service guarantee (what guarantee is provided by the service), service satisfaction (customer ratings of the service), service cost (the cost of the service) and over request (whether there add-on values provided by the service).

Table 1.
Evaluation properties (multi-context QoS).
Similarly, the multi-context QoP contains the seven parameters in Table 1 for other services (apart from the service being offered) provided by the same service provider. Qualitative values, such as service similarity, description accuracy and service guarantee, are converted to a numeric value and normalised so that these can be used to calculate the trust score.
IoT-TESM evaluates the trustworthiness of an agent by combining information collected from different sources. These sources are Direct experiences (), Indirect experiences (), and Market Evaluation (), as shown in Figure 1. The service consumer agent (aSC) selects a service provider agent (aSP) by evaluating the trust score calculated using IoT-TESM for every service provider aSP who provides a particular service .
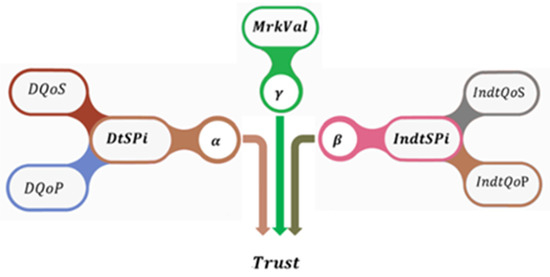
Figure 1.
Evaluation parameters.
IoT-TESM computes the trust score using Equation (1), where the aSP with the highest score will be selected to perform the service.
In Equation (1), , and are weights, and . The values of these weights can be set manually by the system’s users, or automatically using the proposed ASW (Auto-Scale Weights) method discussed in the next section. The use of ASW provides a balanced and fair value of the weights based on the current situation so that a more accurate trust score can be obtained.
Direct experience () is the main source of information, which comprises all the previous transactions between the aSC and aSP. The value of is calculated by evaluating the and of the service using Equation (2).
where . is calculated using Equation (3) based on the seven parameters described in Table 1.
where is the weight of the properties, is a and is the individual property (in Table 1).
is calculated using Equation (4) to evaluate the behaviour of aSP in providing other services apart from .
where is a and .
The second source of the information that is used in this model is the indirect experience (), which generally reflects the experience and relation between the same aSP with the others, and how others think about the aSP. is calculated by evaluating the of the service and using Equation (5).
where x + y = 1, and the value of and are calculated using Equations (6) and (7), respectively, for the service based on the parameters described in Table 1. is a list of all the requests from the other parties who responded.
Again, the is the weight of the properties, is the properties, and is a and .
Finally, the market evaluation () is used to increase the evaluation accuracy and reduce the risk of the having to deal with a new service provider. combines the value of the properties: (stock value), (annual net income), (number of branch), (number of customers), and (cash flow), and is calculated using Equation (8).
where the weights .
l is commonly used in the investment community to denote to the market capitalization of a publicly traded company. It is used to assess various exchange-traded instruments, such as stocks and futures. Moreover, it is a valuable indicator of how investors perceive a company business prospects. which can lead to a reduction in investment risks. This is because the dynamic nature of market value is dependent on many factors, such as physical operating conditions, economic conditions and the supply and demand. IoT-CADM leverages this point to gauge the performance indicators of the suppliers (companies or investors). This can reduce the selection risk and provide more opportunities for new service providers to be selected.
For all equations, the parameter is used to indicate the time effect, where recent transactions are more important than older ones. This is calculated using the time relevance function as shown in Equation (9)
where the variable is application-dependent and is the time difference between the current time and time at which interaction of type took place.
Taken together, in this evaluation mechanism, aSC selects the most trustworthy aSP (the one with the highest trust score) to provide the service.
3.2. The Auto-Scale Weights (ASW)
IoT-TESM is an evaluation technique to assess the trustworthiness of the IoT-CADM environments’ members, by combining the information collected from direct experience (DtSPi), indirect experience (IndtSPi), and market evaluation (MrkVal), as discussed earlier. Based on Equation (1), the values of the weights α, β and γ need to be set correctly and carefully. In this model, there are two ways to set these values: by giving the owner the ability to adjust them manually or by using the proposed ASW technique.
ASW is a dynamic technique which aims to calculate balanced and fair values of the weights to increase the overall performance. ASW calculates the values of , and based on Equations (10), (11) and (12), respectively.
where , , and are the scaled weights of the direct, indirect, and market value. These values are calculated using Equations (13)–(15), respectively. The scaled weights in ASW are calculated as the average of the highest three values () of aSPs for each of the , , and values, and is the time difference between the current time and the time at which interaction of type took place.
3.3. Detecting Dishonest Agents Using Principal Component Analysis (PCA)
IoT-CADM exploits Principal Component Analysis (PCA) [52] to analyse the information collected from different sources in order to detect dishonest agents. PCA is a dimensional reduction technique that uses statistical procedures (including the mean, variance, covariance, covariance matrix, eigenvectors, and eigenvalues) to identify patterns in data and express the data in such a way as to highlight their similarities and differences. To identify dishonest agents, seven parameters used for QoS (SLTPe, SSIM, SDAv, SGUR, SATv, SCOST, and SOvRq), discussed in Section 3.1, are collected from all agents who offered to provide the service requested. Then, a relationship between two selected parameters is identified. Next, PC1 and PC2 are calculated using mean, variance, covariance matrix, eigenvectors and eigenvalues. Dishonest agents are defined as agents that are located outside the predefined borders of Min PC1, Max PC1, Min PC2 and Max PC2. Figure 2 shows a relationship between the cost and quality of the service offered by the provider agents. In this example, the two red agents are considered as dishonest (ambiguous) agents as they are located outside the predefined boundaries. This process is then repeated for other parameters (e.g., SCOST vs. SLTPe, SATv vs. SLTPe). When detected, IoT-CADM can terminate, notify, or allow the agent to continue.
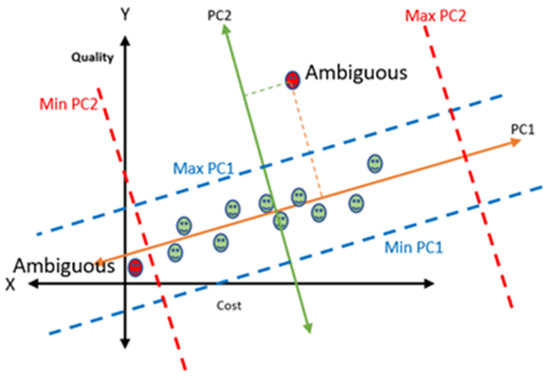
Figure 2.
PC1 and PC2 boundaries.
3.4. IoT-CADM Environment
IoT-CADM can be implemented for range of real-life applications, such as intelligent vehicular systems, intelligent surveillance for smart house, and intelligent health systems. As we are interested in investigating the application of IoT-CADM in an IIoT setting, we developed a simulated smart factory supply chain and used this environment to evaluate the behaviour of the IoT smart agents. These IoT smart agents assume the roles of buyers and sellers that are involved in the manufacturing and distribution of COVID-19 personal protective equipment products. In this simulated environment, it is assumed that the products being manufactured are medical masks, gloves, respirators, and oxygen concentrators. These are essential for the provision of clinical care and for the well-being of healthcare professionals. During the COVID-19 pandemic, the demand for these products was high due to supply chain disruption, the inability to fulfil supply, increased cost and workforce dislocation. In the context of supply chain, the additional challenge is for distributors to find trustworthy suppliers, who can deliver replacements for raw materials at the highest quality with the lowest cost.
We implemented this scenario using a multi-agent system to enable agents to make autonomous decisions based on the trust and reputation score. The simulated environment is shown in Figure 3. In stage Stg(i) (i is the stage number of the stage Stg), the smart factory (SF) has three roles: service consumer, service producer, and service provider. For example, SF(Y) utilises services provided by service provider (SF(X)) at stage Stg (i − 1) to manufacture products and/or services for onward distribution in the subsequent stage, Stg (i + 1), where it operates as service provider. In this scenario, SF(Y) acting as a service consumer needs to select one (or more) service providers to source services from SF(X) in the preceding cycle. These service providers might be unfamiliar to the service consumer. The service consumer needs to ascertain whether these unknown service providers can deliver superior (or satisfactory) service quality. Additionally, these newly established service providers must promote and offer their services to thrive in the competitive market. These service consumers, service producers and service providers are modelled as agents in the simulation, and they can interact and negotiate with one another.
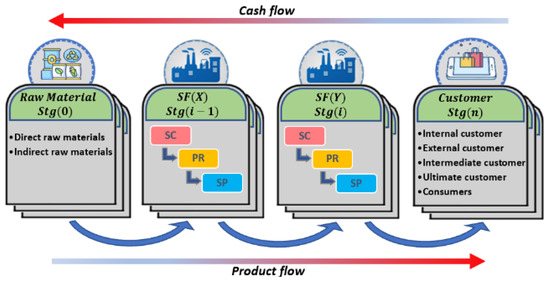
Figure 3.
The smart factory environment.
IoT-CADM consists of several components: Service Registry List (SRL), Market Value Registry List (MVL), aSP, and aSC (see Figure 4). All components are interlinked through an IoT network and monitored and controlled remotely by its owner using IoT technology. SRL is a database that contains current information about the services that are available in the environment. As such, all services are registered on start-up and deregistered on shutdown so that the SRL can maintain the latest information about all the available services. MVL contains the latest general information about the market value for all registered aSPs. aSPs can take the form of an agent-based organisation, a business entity or an individual who offers services to others within the IoT-CADM environment in exchange for payment or any equivalent form of compensation. aSPs offer various services depending on the knowledge, expertise, and the nature of the aSP itself. Finally, an aSC represents an agent-based organisation, a business entity or an individual that makes payment in exchange for consumption of goods and services provided. aSCs are supported by service providers within the IoT-CADM environment.
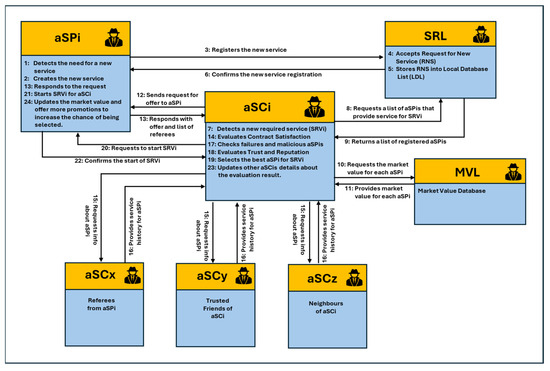
Figure 4.
IOT-CADM transactions.
As shown in Figure 4, every service provider (aSPi) needs to register their new services by submitting a Register New Service (RNS) request to the SRL. This action renders the service accessible to all aSCs. The service consumer aSCi monitors the environment for any newly needed services, whether they are physical or logical. Once the aSCi detects a new required service (SRi), it dispatches a Service Lookup (SLUi) to the SRL. This message contains the details of the service SRi and specifies the Minimum Similarity. Subsequently, SRL replies to aSCi by providing a list of aSPs that can supply the service Sri, or delivers a “NoResult” message if no aSPs are available. Once aSCi receives the list of aSPs from SRL, aSCi proceeds to establish contact with each aSP on the list. It then waits for their responses, which include accurate details about the service SRi and a list of referees that can be contacted by aSCi.
When aSCi receives responses from aSPs, it initiates two types of checks. The first, known as “Evaluate_Contract_Satisfaction”, is designed to sort and reduce the number of aSPs based on the contract satisfaction and similarity between the requested and the responded contracts. After that, aSCi proceeds by forwarding a request to the Referees (aSCx), Trusted Friends (aSCy), and the Neighbour Agents (aSCz) to inquire about aSPis (those that have successfully passed the initial check). The request does not specify the exact service, to minimise the messages that will be conveyed back to the requester. In this model, it is assumed that the referees, trusted friends and neighbour agents are willing to provide the requested information. After collecting all the required information from its database and from other parties for each aSPi, aSCi proceeds with the second check “Check_NHA_PCA”. The purpose of this is to detect dishonest agents using PCA. When aSCi requests this information, “Check_NHA_PCA” is performed. aSCi will then compute the trust and reputation score for all the filtered aSPs that have successfully cleared the second check. This computation is carried out using IoT-TESM and the provider with the highest trust score is selected. Finally, aSCi revises the details of all the participants involved in the evaluation process.
It should be noted that, to increase the chance of the unselected aSPs being selected in the future, aSPi must consider adapting its behaviour. This may involve increasing its market value and offering additional promotions and incentives to attract aSCs. This course of action is usually initiated after a certain number of unsuccessful selections (cα) by aSCs. The exact value of cα can be determined based on the behaviour of aSPi and the nature of the services it offers.
4. Experimental Evaluation
To evaluate the effectiveness of our proposed IoT-CADM model, we conducted a comparative analysis against three existing model: ReGreT [11], SIoT [8] and R-D-C [12].
ReGreT [11] is one of the pioneering models in multi-agent systems that incorporates reputation and trust management to improve the agent’s performance in an e-commerce environment. The trust value of this model is calculated using Equation (16), which combines the scores from direct experiences, indirect information and the social dimension.
SIoT [8] calculates the trust of a node j with respect to node i using Equation (17), where
is the direct trust of node with respect to node during direct contact, is the centrality of the object with respect to , is the community interest of nodes and , is the cooperativeness between nodes and , is the energy consumption of node and is the service score of node with respect to node .
In R-D-C [12], the requester calculates the reputation, disrepute, and conflict of each suggested provider using Equation (18).
where is based on the ratings for previous satisfying interactions, on the ratings for previous dissatisfying interactions and on the ratings for conflict in previous interactions.
We chose these models for comparison as they are similar to our proposed model and the calculation of the trust score is primarily based on direct and indirect experience. In addition, ReGreT and R-D-C are both agent-based trust and reputation models and SIoT is a trust and reputation model for IoT. There is no comparable model for a combination of agent-based and IoT trust and reputation.
4.1. Experimental Setup
IoT-CADM was developed and implemented using the JADE framework. In this environment, the following steps are performed: (1) detects new service, (2) collects information, (3) calculates the trust and reputation score, (4) selects service provider, and (5) finalises the contract agreement with the selected provider. This sequence of steps is defined as a transaction, which can be completed in one simulation tick. Each time tick is equal to 6 h. To replicate the real-world, we run the simulation for 10,000 time ticks, which is equivalent to seven years. By setting this to 10,000 time ticks, we allow ample time for the selection process to be repeated many times and the databases to be populated with historical data. Once the simulation begins, the agent logs the transaction in its database and continues until the simulation is completed. The Clearance Time is added as extra time to the simulation to allow ongoing transactions that are started before completion of the run time to be completed. Table 2 shows the main environment settings. A service is identified by a service ID, service name, start and end time. Examples of services in this simulation are face masks, hand sanitiser and goggles.
Table 2.
Main Environment Settings. * represent Multiplication sign (×).
When an agent needs a service, the first step is to collect information from its sources. In this instance, there are three possible scenarios that may occur during the evaluation and selection process:
- Starts the evaluation and selection process if there is at least one or more potential provider and responses have been received.
- Starts the evaluation and selection process if there is at least one or more potential provider and responses have been received after a certain waiting time.
- If no potential providers are available, the agent starts the Reordering process. This process may be repeated many times (ReO) for a particular service SRi. A waiting time is set before repeating the reordering process. The waiting time can be set to a constant value (Xct) or by multiplying the ReO value by Xct.
In this experiment, we assume that the environment is populated with varying number of honest and dishonest agents. Dishonest agents (or attackers) are generated randomly. These dishonest agents are assumed to use bad-mouthing and/or on–off attacks. In a bad-mouthing attack, a dishonest agent can ruin the trust level of honest agents by giving them bad recommendations. Consequently, their reputation is negatively affected and the chance of these honest agents being selected for service is reduced. With the on–off attack, dishonest agents can randomly perform a trustworthy service to hide their untrustworthy behaviour.
The values for the multi-context QoS and QoP (shown in Table 1) are randomised based on normal distribution and bounded between 0 and 100 to simulate the service providers’ overall performance in the provision of a specific service. This mimics the diversity of the service providers and the services being offered. In a real-world setting, it is expected that this data will need to be collected qualitatively and then converted to numeric values. For example, for a given Service X, Agent A has the following values: 80, 70, 70, 90, 80, 80, 80, while Agent B has the following values: 50, 60, 60, 70, 70, 60, 50. Based on these QoS parameters, it can be said that Agent A offers a better service for service X as it offers a better lead time and the service offered is more similar to Service X. Its description of the service is also more similar to Service X when compared to that of Agent B. In addition, Agent A offers a better service guarantee, service satisfaction, service cost, and over request. We have simplified this in our model so that we can focus on the trust evaluation and the selection of agents. We assume that the service consumer agent has access to these parameters.
There are five sets of agents’ distributions in this environment: 70, 110, 150, 190, and 230 agents. In addition, a different percentage (0%, 25%,50%, and 75%) of dishonest agents was used in different scenarios. We decided to limit the percentage of dishonest agent to 75% as, in the real world, it would be uncommon to have more than 75% dishonest agents in the environment. Based on this, there were a total of twenty sub-scenarios (SSR) used to study and evaluate the performance of all competing models comprehensively (Table 3). These agents are randomly positioned, and they start their activities based on an active time parameter. Figure 5 shows how agents are distributed in an environment that has 190 agents. The value of active time is generated randomly based on a normal distribution. These agents can operate all the time during the simulation as Full-time Agents or operate for a specific period as Part-time Agents. These distributions adhere to the supply chain concept, as previously discussed, with the first level (L1) representing the final service consumer, and the fourth level (L4) corresponding to the raw material providers. Between L1 and L4, agents in L2 and L3 both consume services from the lower level and offer services to the higher level.
Table 3.
Agents’ Distribution.
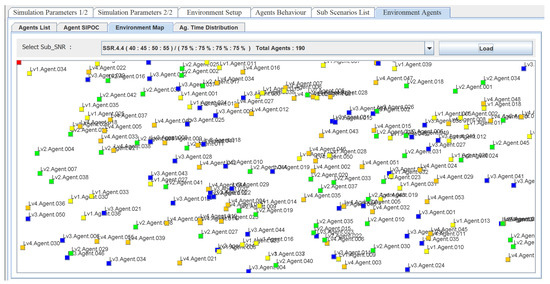
Figure 5.
Distribution of 190 agents in the environment.
We also implemented ReGreT, SIoT and R-D-C in the same environment with the necessary adjustments made to the calculation of their trust scores.
4.2. Performance Measures
IoT-CADM employed a set of performance metrics to measure and compare its results with the other three models. In this work, we evaluated the performance of the proposed model using the following metrics:
- Trustworthiness: the trust and reputation score of all trustees or other peers in the environments. A high trust score represents a higher level of trustworthiness.
- Cash utility (): the total cash gained by the individual agent and the model is determined by the amount of cash (won or lost) after a fixed number of rounds. Equation (19) is used to calculate the cash utility, (where PoT represents positive transactions, NgT denotes negative transactions, n is the total number of transactions, Tc is the completion time, Ts is the service starting time and Te is the expected agreed time to complete the service).
We also evaluated and ranked the performance of our model and the three existing models using the TOPSIS technique. TOPSIS is a widely adopted multi-criteria decision analysis method renowned for its simplicity and ease of comprehension. TOPSIS chooses the best solution by identifying the one with the shortest distance from the positive-ideal solution, and the furthest distance from the negative-ideal solution [13]. In addition to cash utility and trustworthiness, we included additional parameters. These parameters cover various performance measures related to physical measurements, accuracy and utility, and social measurements. These are context awareness (ability to understand and respond to requests), the quality of service, the quality of provider, the number of active agents, the number of completed transactions, the average evaluation and selection time, the average number of service providers per selection, the total number of communication messages through the network and the average number of communication messages per transaction. Each of these parameters is then given a weight to indicate its importance. A parameter can also be excluded in the TOPSIS ranking by setting its weight to 0. For example, if we are not interested in the physical measurements, we can set the weights for average evaluation and selection time, average number of service providers per selection, the total number of communication messages and the average number of communication messages per transaction to 0. In our experiment, all the parameters were considered with equal weights.
4.3. Results
In this section, we will discuss the results in two parts; an environment with no dishonest agents (0%) and an environment with up to 75% dishonest agents.
4.3.1. Honest Environment (0% Misbehaving Agents)
Figure 6 shows the trust scores for the four models with varying agent distributions (SRR1.1–SRR1.5). Initially, when the simulation starts, none of the agents have sufficient information in their database or from the witnesses about the environment. This means that aSCs have no alternative but to work with unfamiliar witnesses to choose a service provider. IoT-CADM has the highest trust scores for all scenarios when compared to the other models. It can be seen that, during the first quarter, ReGreT recorded the lowest trust scores. In contrast, SIoT and R-D-C recorded higher scores, as both models used physical information to avoid random selection. However, at time tick 5000, ReGreT outperformed SIoT and R-D-C, signalling the importance of incorporating social information within the environment after a certain period of time. By leveraging on the social information and employing the dynamic ASW method (with appropriately scaled weights), IoT-CADM maintains consistent performance at all times across all scenarios. We also computed the PDS (percentage of difference and superiority) for all models. PDS calculates the percentage of difference between two values to determine how close they are relative to the larger value. Based on these calculated values, IoT-CADM surpassed ReGreT by 38%, SIoT by 40%, and R-D-C by 41% in selecting the most trustworthy aSP.
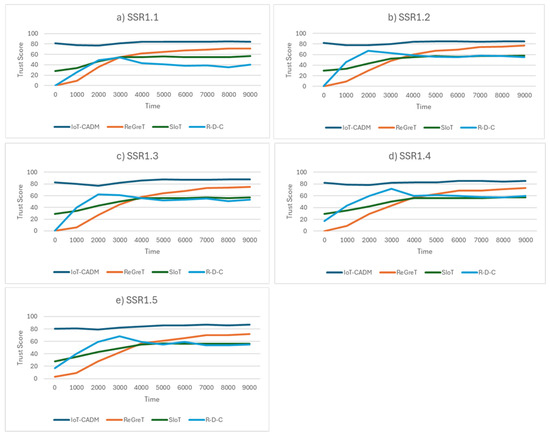
Figure 6.
Trust scores of agents in an honest environment for (a) 70 agents, (b) 110 agents, (c) 150 agents, (d) 190 agents and (e) 230 agents.
The total cash gained by each model from all successful transactions during the simulation is shown in Figure 7. It can be seen that the proposed model gained more cash than the other models for all scenarios. In the first sub-scenario (SSR1.1), the total cash gained by all the models is much lower compared to SSR1.2–SSR1.5. It should be noted that the number of agents in SSR1.1 is 70 and this number is gradually increased to 110 in SSR1.2 and eventually to 230 in SSR1.5 (see Table 3). This means that, as the number of agents in the environment increases, there are more service requests which, in turn results in more business transactions. An increase in the number of successful transactions leads to an increase in monetary gain. R-D-C recorded the lowest profit at the beginning of the simulation but eventually converged to a value similar to those of the ReGreT and SIoT models after time tick 2000. The performance of the three models (ReGreT, R-D-C and SIoT) is very similar across all scenarios. Even though the cash gained by the three models increased over time for all scenarios, their total cash gained is much lower than that for IoT-CADM.
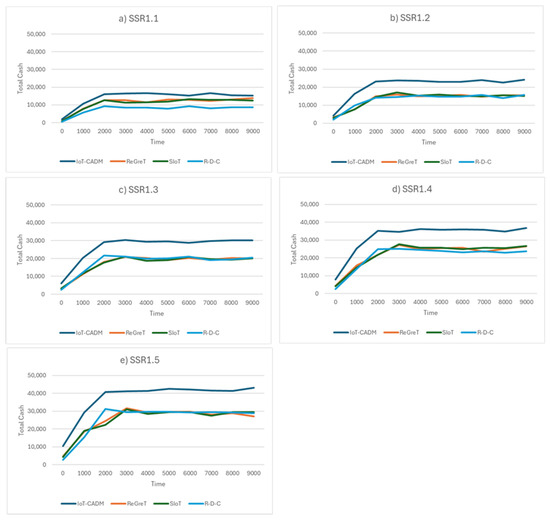
Figure 7.
Cash utility in an honest environment for (a) 70 agents, (b) 110 agents, (c) 150 agents, (d) 190 agents and (e) 230 agents.
In more detail, Figure 8 shows the total cash gained by each model, with IoT-CADM delivering the highest total cash gained to service consumers, followed by ReGreT, SIoT and R-D-C.
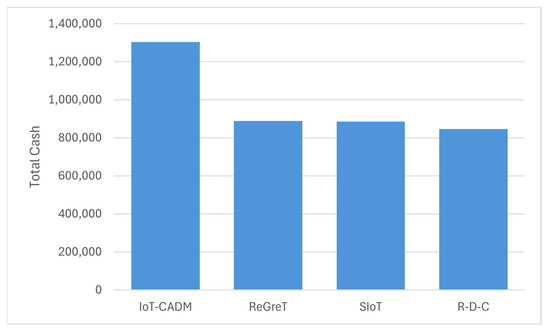
Figure 8.
Total cash utility gained in an honest environment.
Next, we applied the TOPSIS method to perform a mathematical comparison and ranking based on all the models’ performance. Table 4 shows that IoT-CADM achieves the highest performance when all the agents in the environment are honest. This is followed by SIoT, ReGreT and R-D-C. Furthermore, IoT-CADM also recorded the highest performance even when the weight (pw) for each parameter was altered. This suggests that IoT-CADM demonstrates more stability and adaptability for use in diverse environments and scenarios. This finding also indicates that IoT-CADM outperforms the other three existing models.
Table 4.
TOPSIS performance ranking in an honest environment. * represent Multiplication sign (×).
4.3.2. Dishonest Environment (0–75% Misbehaving Agents)
In this experiment, we ran all the models in four sub-scenarios in an environment populated with 230 agents only. This is because it was observed in Section 4.3.1 that the results obtained for 70, 110, 150, 190 and 230 agents were quite similar and consistent across the four models. An environment populated by up to 75% dishonest agents means that there is a high likelihood of potential attack.
The trust scores for IoT-CADM, ReGreT, SIoT, and R-D-C are shown in Figure 9. Here, SRR1.5 is a sub-scenario with no dishonest agents, SRR2.5 is a sub-scenario with 25% dishonest agents, SRR3.5 is a sub-scenario with 50% dishonest agents and SRR4.5 is a sub-scenario with 75% dishonest agents and the total number of agents in the simulation is 230. It can be observed that IoT-CADM has the highest trust score, which suggests that it has the most trustworthy aSPs for the aSCs compared with the other models. This demonstrates the ability of the model to detect malicious agents, thereby preventing them from being selected. As before, none of the agents have enough information in their database or from the witnesses about the environment at the start of the process, which forced aSCs to collaborate with unknown witnesses to select service providers. In this setting, ReGreT has the lowest trust scores in the first quarter, while the SIoT and R-D-C used physical information to avoid the random selection during this period. Once these agents have enough information, their performances converge. IoT_CADM was able to maintain a high trust score for all scenarios throughout the simulation, as it used the market evaluation as the main selection criteria in the absence of direct experience and indirect experience. In addition, new entrants (service providers) can increase their chance of being selected in the future by adapting their behaviour, such as by offering additional promotions and incentives to attract service consumers. Towards the end of the experiment at time tick 5000, IoT-CADM and ReGreT performed higher than SIoT and R-D-C, which signals the importance of using the social information in the environment after a certain period of time. The results also shows that the performance of the SIoT was affected more than the other models when the number of dishonest agents increased in the environment. This is because SIoT uses physical information, which does not contribute to the identification of dishonest agents. In contrast, the other models have superior methods for detecting malicious agents.
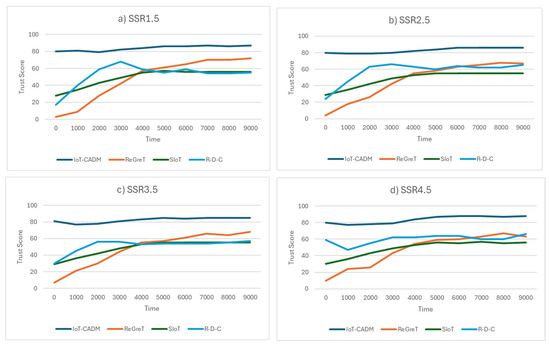
Figure 9.
Trust scores of agents in a dishonest environment (0–75%) for (a) 0% dishonest agents, (b) 25% dishonest agents, (c) 50% dishonest agents and (d) 75% dishonest agents.
The total cash gained by each model for each scenario is shown in Figure 10. It can be seen that the total cash gained by all the models decreases as the number of dishonest agents increases in the environment (see Figure 11a). The increase in the number of dishonest agents meant that more dishonest agents were successful in obtaining the contract to fulfil the service. However, these dishonest agents were not able to complete the service on time, which resulted in additional completion time and a reduction in the total cash gained. In all the sub-scenarios (SRR1.5–SRR4.5), IoT-CADM has the highest cash utility when compared to the three models. Figure 11a shows that cash utility decreases for all models as the number of dishonest agents increases in the environment. The lowest cash gained is recorded when there were 75% dishonest agents in the environment. Figure 11b shows that IoT-CADM gained the most cash followed by R-D-C, ReGreT and SIoT. This shows that IoT-CADM has a superior evaluation and selection method for service providers, and it was able to accurately detect malicious agents.
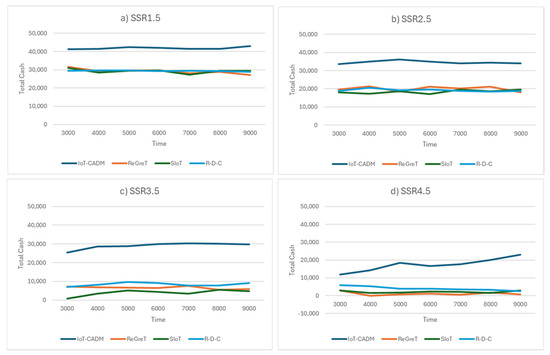
Figure 10.
Cash utility for a dishonest environment (0–75%) for (a) 0% dishonest agents, (b) 25% dishonest agents, (c) 50% dishonest agents and (d) 75% dishonest agents.
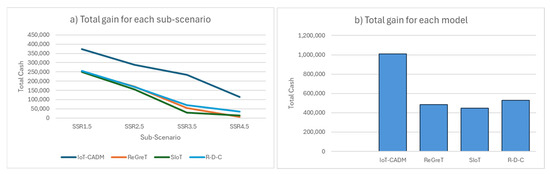
Figure 11.
Total Cash Gained in a Dishonest Environment (0–75%). (a) Total gain for each sub-scenario. (b) Total gain for each model.
Table 5 summarises the result of comparing these models using TOPSIS. It can be seen that the proposed model IoT-CADM still has the highest performance in an environment with a varying number of dishonest agents. The result also shows that IoT-CADM ranked higher than ReGreT, SIoT and R-D-C in dishonest environments.
Table 5.
TOPSIS performance ranking in a dishonest environment (0–75%). * represent Multiplication sign (×).
5. Conclusions and Future Work
In this paper, we described IoT-CADM, a trust and reputation model that can be used to select the best service provider in an IoT environment. IoT-CADM uses IoT-TESM to evaluate each service provider. IoT-TESM calculates the trust score of a service provider agent by considering its direct experience, indirect experience and market evaluation. Multi-context QoS and QoP are used in evaluating both direct experience and indirect experience. The inclusion of multi-context QoP provides more opportunities for new service providers to be considered and decreases the effect of negative ratings and fake ratings. Our approach differs from other existing works in two ways. Firstly, we consider multi-context QoS and QoP in evaluating direct and indirect experiences. Secondly, we included market valuation in the calculation of the trust score to solve the cold start problem, where none of the agents have complete information at the beginning of the simulation.
We demonstrated the superiority of our model against three existing models, ReGreT, R-D-C and SIoT, where IoT-CADM outperformed all three models in both performance measures for trustworthiness and cash utility in honest and dishonest environments. In addition, the TOPSIS technique was used to rank the competing models, and our model achieved the highest ranking. Our work advances the state of the art by providing a multi-agent framework than can be used evaluate the trust and reputation of service providers in an IoT setting capitalising on IoT-TESM, which uses multi-context QoS in evaluating direct experience and indirect experience and market evaluation.
There are several limitations to our work. In our simulation, we have randomised the values of all the QoS parameters. It would have been advantageous to implement various methods to convert qualitative data to quantitative data. We did not implement this, as the focus of this work is on the trust score evaluation and selection of agents. We also assumed that the referees, trusted friends and neighbour agents are willing share the information of a given service provider. We acknowledge that in the real-world, some parties may be unwilling to share this information due to privacy issues. The QoS parameters are also available to all the service consumer agents. Even though our model can detect malicious agents, it does not penalise these malicious agents. Honest agents are also not rewarded. As IoT-CADM is a flexible framework, these limitations can be addressed in future work building on the current implementation.
A further extension of this work would be to examine the impact of unsecured network connection on trust and reputation. In this study, it was assumed that the agents are transacting in a fully secured environment. It would be interesting to investigate the performance of our model in an unsecured environment. We are also keen to implement the proposed models in other smart environments with the aim of developing a universal trust and reputation model that can be applied in any IoT settings.
Author Contributions
Conceptualization, M.A.-S., P.A. and S.C.; methodology, M.A.-S., P.A. and S.C.; software, M.A.-S.; validation, M.A.-S.; formal analysis, M.A.-S.; investigation, M.A.-S.; resources, M.A.-S.; data curation, M.A.-S.; writing—original draft preparation, M.A.-S.; writing—review and editing, P.A. and S.C.; visualization, M.A.-S.; supervision, P.A. and S.C.; project administration, M.A.-S.; funding acquisition, P.A. All authors have read and agreed to the published version of the manuscript.
Funding
The APC was funded by the Lincoln University Open Access Fund.
Institutional Review Board Statement
Not applicable.
Informed Consent Statement
Not applicable.
Data Availability Statement
The raw data supporting the conclusions of this article will be made available by the authors on request.
Conflicts of Interest
The authors declare no conflicts of interest.
References
- Maddar, H.; Kammoun, W.; Youssef, H. Effective distributed trust management model for Internet of Things. Procedia Comput. Sci. 2018, 126, 321–334. [Google Scholar] [CrossRef]
- Abdul-Rahman, A.; Hailes, S. Supporting trust in virtual communities. In Proceedings of the 33rd Annual Hawaii International Conference on System Sciences, Maui, HI, USA, 4–7 January 2000. [Google Scholar]
- Caminha, J.; Perkusich, A.; Perkusich, M. A Smart Trust Management Method to Detect On-Off Attacks in the Internet of Things. Secur. Commun. Netw. 2018, 2018, 6063456. [Google Scholar] [CrossRef]
- Guo, J.; Chen, I.-R.; Tsai, J.J.P. A survey of trust computation models for service management in internet of things systems. Comput. Commun. 2017, 97, 1–14. [Google Scholar] [CrossRef]
- Alshehri, M.D.; Hussain, F.K.; Hussain, O.K. Clustering-Driven Intelligent Trust Management Methodology for the Internet of Things (CITM-IoT). Mob. Netw. Appl. 2018, 23, 419–431. [Google Scholar] [CrossRef]
- Sun, G.; Li, J.; Dai, J.; Song, Z.; Lang, F. Feature selection for IoT based on maximal information coefficient. Futur. Gener. Comput. Syst. 2018, 89, 606–616. [Google Scholar] [CrossRef]
- Yu, Y.; Jia, Z.; Tao, W.; Xue, B.; Lee, C. An Efficient Trust Evaluation Scheme for Node Behavior Detection in the Internet of Things. Wirel. Pers. Commun. 2017, 93, 571–587. [Google Scholar] [CrossRef]
- Kowshalya, A.M.; Valarmathi, M.L. Trust Management in the Social Internet of Things. Wirel. Pers. Commun. 2017, 96, 2681–2691. [Google Scholar] [CrossRef]
- Ben Saied, Y.; Olivereau, A.; Zeghlache, D.; Laurent, M. Trust management system design for the Internet of Things: A context-aware and multi-service approach. Comput. Secur. 2013, 39, 351–365. [Google Scholar] [CrossRef]
- Copigneaux, B. Semi-autonomous, context-aware, agent using behaviour modelling and reputation systems to authorize data operation in the Internet of Things. In Proceedings of the 2014 IEEE World Forum on Internet of Things (WF-IoT), Seoul, Republic of Korea, 6–8 March 2014; pp. 411–416. [Google Scholar]
- Sabater, J. EVALUATING THE ReGreT SYSTEM. Appl. Artif. Intell. 2004, 18, 797–813. [Google Scholar] [CrossRef]
- Majd, E.; Balakrishnan, V. A reputation-oriented trust model for multi-agent environments. Ind. Manag. Data Syst. 2016, 116, 1380–1396. [Google Scholar] [CrossRef]
- Hwang, C.-L.; Yoon, K. (Eds.) Methods for Multiple Attribute Decision Making. In Multiple Attribute Decision Making: Methods and Applications A State-of-the-Art Survey; Springer: Berlin/Heidelberg, Germany, 1981; pp. 58–191. [Google Scholar]
- Jøsang, A.; Ismail, R.; Boyd, C. A survey of trust and reputation systems for online service provision. Decis. Support Syst. 2007, 43, 618–644. [Google Scholar] [CrossRef]
- Ahmed, A.I.A.; Ab Hamid, S.H.; Gani, A.; Khan, S.; Khan, M.K. Trust and reputation for Internet of Things: Fundamentals, taxonomy, and open research challenges. J. Netw. Comput. Appl. 2019, 145, 102409. [Google Scholar] [CrossRef]
- Wu, F.; Li, H.-H.; Kuo, Y.-H. Reputation evaluation for choosing a trustworthy counterparty in C2C e-commerce. Electron. Commer. Res. Appl. 2011, 10, 428–436. [Google Scholar] [CrossRef]
- Khosravifar, B.; Bentahar, J.; Gomrokchi, M.; Alam, R. CRM: An efficient trust and reputation model for agent computing. Knowl.-Based Syst. 2012, 30, 1–16. [Google Scholar] [CrossRef]
- Ruan, Y.; Durresi, A.; Uslu, S. Trust Assessment for Internet of Things in Multi-access Edge Computing. In Proceedings of the 2018 IEEE 32nd International Conference on Advanced Information Networking and Applications (AINA), Krakow, Poland, 16–18 May 2018. [Google Scholar]
- Guo, J.; Wang, H.; Liu, W.; Huang, G.; Gui, J.; Zhang, S. A lightweight verifiable trust based data collection approach for sensor–cloud systems. J. Syst. Arch. 2021, 119, 102219. [Google Scholar] [CrossRef]
- Zhou, Z.; Wang, M.; Yang, C.-N.; Fu, Z.; Sun, X.; Wu, Q.J. Blockchain-based decentralized reputation system in E-commerce environment. Futur. Gener. Comput. Syst. 2021, 124, 155–167. [Google Scholar] [CrossRef]
- Alhandi, S.A.; Kamaludin, H.; Alduais, N.A.M. Trust Evaluation Model in IoT Environment: A Comprehensive Survey. IEEE Access 2023, 11, 11165–11182. [Google Scholar] [CrossRef]
- Ardagna, C.A.; Damiani, E.; De Capitani di Vimercati, S.; Samarati, P. Trust Management. In Security, Privacy, and Trust in Modern Data Management; Petković, M., Jonker, W., Eds.; Springer: Berlin/Heidelberg, Germany, 2007; pp. 103–117. [Google Scholar]
- Shayesteh, B.; Hakami, V.; Akbari, A. A trust management scheme for IoT-enabled environmental health/accessibility monitoring services. Int. J. Inf. Secur. 2020, 19, 93–110. [Google Scholar] [CrossRef]
- Lenard, T.; Collen, A.; Benyahya, M.; Nijdam, N.A.; Genge, B. Exploring Trust Modeling and Management Techniques in the Context of Distributed Wireless Networks: A Literature Review. IEEE Access 2023, 11, 106803–106832. [Google Scholar] [CrossRef]
- Fortino, G.; Fotia, L.; Messina, F.; Rosaci, D.; Sarne, G.M.L. Trust and Reputation in the Internet of Things: State-of-the-Art and Research Challenges. IEEE Access 2020, 8, 60117–60125. [Google Scholar] [CrossRef]
- Yan, Z.; Zhang, P.; Vasilakos, A.V. A survey on trust management for Internet of Things. J. Netw. Comput. Appl. 2014, 42, 120–134. [Google Scholar] [CrossRef]
- Chen, J.; Tian, Z.; Cui, X.; Yin, L.; Wang, X. Trust architecture and reputation evaluation for internet of things. J. Ambient. Intell. Humaniz. Comput. 2018, 10, 3099–3107. [Google Scholar] [CrossRef]
- Baharloo, N.; Bentahar, J.; Alwhishi, G.; Drawel, N.; Pedrycz, W. Verifying trust over IoT-ad hoc network-based applications under uncertainty. Ad. Hoc. Netw. 2024, 154, 103380. [Google Scholar] [CrossRef]
- Chen, G.; Zeng, F.; Zhang, J.; Lu, T.; Shen, J.; Shu, W. An adaptive trust model based on recommendation filtering algorithm for the Internet of Things systems. Comput. Netw. 2021, 190, 107952. [Google Scholar] [CrossRef]
- Saidi, A. Trust evaluation method for Wireless Sensor Networks based on behavioral similarity and similarity coefficient. In Proceedings of the 2021 International Conference on Networking and Advanced Systems (ICNAS), Annaba, Algeria, 27–28 October 2021; pp. 1–6. [Google Scholar]
- Narang, N.; Kar, S. A hybrid trust management framework for a multi-service social IoT network. Comput. Commun. 2021, 171, 61–79. [Google Scholar] [CrossRef]
- Latif, R. ConTrust: A Novel Context-Dependent Trust Management Model in Social Internet of Things. IEEE Access 2022, 10, 46526–46537. [Google Scholar] [CrossRef]
- Zhang, S.; Cao, D.; Ning, Z. A decentralized and reliable trust measurement for edge computing enabled Internet of Things. Concurr. Comput. Pract. Exp. 2022, 34, e7238. [Google Scholar] [CrossRef]
- Wang, T.; Luo, H.; Jia, W.; Liu, A.; Xie, M. MTES: An Intelligent Trust Evaluation Scheme in Sensor-Cloud-Enabled Industrial Internet of Things. IEEE Trans. Ind. Inform. 2019, 16, 2054–2062. [Google Scholar] [CrossRef]
- Tong, Z.; Ye, F.; Mei, J.; Liu, B.; Li, K. A novel task offloading algorithm based on an integrated trust mechanism in mobile edge computing. J. Parallel Distrib. Comput. 2022, 169, 185–198. [Google Scholar] [CrossRef]
- Altaf, A.; Abbas, H.; Iqbal, F.; Khan, F.A.; Rubab, S.; Derhab, A. Context-oriented trust computation model for industrial Internet of Things. Comput. Electr. Eng. 2021, 92, 107123. [Google Scholar] [CrossRef]
- Din, I.U.; Awan, K.A.; Almogren, A.; Kim, B.-S. ShareTrust: Centralized trust management mechanism for trustworthy resource sharing in industrial Internet of Things. Comput. Electr. Eng. 2022, 100, 108013. [Google Scholar] [CrossRef]
- Ouyang, Y.; Zeng, Z.; Li, X.; Wang, T.; Liu, X. A verifiable trust evaluation mechanism for ultra-reliable applications in 5G and beyond networks. Comput. Stand. Interfaces 2021, 77, 103519. [Google Scholar] [CrossRef]
- Bhor, H.N.; Kalla, M. TRUST-based features for detecting the intruders in the Internet of Things network using deep learning. Comput. Intell. 2021, 38, 438–462. [Google Scholar] [CrossRef]
- Awan, K.A.; Din, I.U.; Almogren, A.; Rodrigues, J.J. AutoTrust: A privacy-enhanced trust-based intrusion detection approach for internet of smart things. Futur. Gener. Comput. Syst. 2022, 137, 288–301. [Google Scholar] [CrossRef]
- Magdich, R.; Jemal, H.; Ben Ayed, M. A resilient Trust Management framework towards trust related attacks in the Social Internet of Things. Comput. Commun. 2022, 191, 92–107. [Google Scholar] [CrossRef]
- Jabeen, F.; Khan, Z.; Hamid, Z.; Rehman, Z.; Khan, A. Adaptive and survivable trust management for Internet of Things systems. IET Inf. Secur. 2021, 15, 375–394. [Google Scholar] [CrossRef]
- Shehada, D.; Gawanmeh, A.; Yeun, C.Y.; Zemerly, M.J. Fog-based distributed trust and reputation management system for internet of things. J. King Saud Univ. Comput. Inf. Sci. 2021, 34, 8637–8646. [Google Scholar] [CrossRef]
- Ren, J.; Qin, T. A novel multidimensional trust evaluation and fusion mechanism in fog-based Internet of Things. Comput. Networks 2022, 217, 109354. [Google Scholar] [CrossRef]
- Pinyol, I.; Sabater-Mir, J. Computational trust and reputation models for open multi-agent systems: A review. Artif. Intell. Rev. 2011, 40, 1–25. [Google Scholar] [CrossRef]
- Marsh, S. Formalising Trust as a Computational Concept. 1994. Available online: https://www.cs.stir.ac.uk/~kjt/techreps/pdf/TR133.pdf (accessed on 21 October 2024).
- Zeynalvand, L.; Luo, T.; Zhang, J. COBRA: Context-Aware Bernoulli Neural Networks for Reputation Assessment. arXiv 2019, arXiv:1912.08446. [Google Scholar] [CrossRef]
- Xu, X.; Bessis, N.; Cao, J. An Autonomic Agent Trust Model for IoT systems. Procedia Comput. Sci. 2013, 21, 107–113. [Google Scholar] [CrossRef]
- Azad, M.A.; Bag, S.; Hao, F.; Salah, K. M2M-REP: Reputation system for machines in the internet of things. Comput. Secur. 2018, 79, 1–16. [Google Scholar] [CrossRef]
- Ponnambalam, S.G.; Janardhanan, M.N.; Rishwaraj, G. Trust-based decision-making framework for multiagent system. Soft Comput. 2021, 25, 7559–7575. [Google Scholar] [CrossRef]
- Fortino, G.; Messina, F.; Rosaci, D.; Sarne, G.M.L.; Savaglio, C. A Trust-Based Team Formation Framework for Mobile Intelligence in Smart Factories. IEEE Trans. Ind. Inform. 2020, 16, 6133–6142. [Google Scholar] [CrossRef]
- Abdi, H.; Williams, L.J. Principal component analysis. WIREs Comput. Stat. 2010, 2, 433–459. [Google Scholar] [CrossRef]
Disclaimer/Publisher’s Note: The statements, opinions and data contained in all publications are solely those of the individual author(s) and contributor(s) and not of MDPI and/or the editor(s). MDPI and/or the editor(s) disclaim responsibility for any injury to people or property resulting from any ideas, methods, instructions or products referred to in the content. |
© 2024 by the authors. Licensee MDPI, Basel, Switzerland. This article is an open access article distributed under the terms and conditions of the Creative Commons Attribution (CC BY) license (https://creativecommons.org/licenses/by/4.0/).