


Abstract
Accurate prediction of separated flows remains a critical challenge for Reynolds-Averaged Navier–Stokes (RANS) simulations, primarily due to the tendency of standard turbulence models to overpredict separation. To address this limitation, this study develops and validates a helicity-augmented variant of Menter’s Shear Stress Transport (SST) model within a high-fidelity, data-guided framework. First, a scale-resolving database, capturing the physics of corner separation, is established via an improved Delayed Detached Eddy Simulation (DDES) of a linear compressor cascade. Insights from this database directly inform the integration of a normalized helicity parameter into the SST formulation, enabling dynamic modulation of the turbulent eddy viscosity to account for non-equilibrium turbulence and energy backscatter in three-dimensional (3D) vortical flows. The enhanced SST model is subsequently validated against experimental data for two benchmark aerodynamic configurations: ARA M100 wing–fuselage and DLR-F6 aircraft models. Results demonstrate that the proposed correction significantly improves the prediction of separation topology and aerodynamic coefficients, delays the predicted onset of stall, and achieves closer agreement with measurements. These findings confirm the DDES-guided helicity correction as an effective strategy for enhancing the predictive fidelity of RANS models in simulating the complex separated flows encountered in practical aeronautical applications.
1. Introduction
Accurately predicting separated flows, such as shock-induced boundary-layer separation and corner-flow separation, is paramount for the aerodynamic design, performance evaluation, and operational safety of modern aeronautical systems [1]. This challenge is ubiquitous, affecting aerodynamic configurations like wing–body assemblies and high-lift devices, as well as aeroengine components like compressors and turbines. Such separated flows are inherently complex, characterized by interactions between the pressure gradients, 3D vortical structures, and pronounced non-equilibrium turbulence. These phenomena critically influence key engineering parameters, including aerodynamic efficiency, drag polar, stall margin, buffet boundary, and overall operational stability [2,3].
In industrial design workflows, RANS continues to serve as the predominant computational fluid dynamics (CFD) tool for design analysis, owing to its favorable cost–accuracy balance. This makes RANS well-suited for extensive parametric studies and iterative design optimization [4]. Nevertheless, the widely used RANS turbulence models, such as SA [5] and Menter’s SST [6], are known to exhibit significant shortcomings in predicting the onset, extent, and structure of separated flows [7,8,9,10,11]. A key limitation is their systematic tendency to overpredict the size and severity of separation zones, which, in turn, adversely affects aerodynamic performance predictions and leads to overly conservative estimates of the stall onset.
This limitation stems from the inherent simplifications of linear eddy viscosity closures. These models are calibrated primarily for equilibrium or near-equilibrium boundary layers and are, therefore, poorly suited for the non-equilibrium physics of 3D separated and vortical flows. Specifically, they lack the mechanisms to model critical physical processes, such as turbulence energy backscatter (the inverse cascade of energy) or the modulation of turbulence energy transport, under intense strain/rotation [12,13]. Consequently, the misprediction of eddy viscosity in these models leads to excessive momentum diffusion, artificial shear-layer thickening, and, ultimately, an overprediction of separation zone.
Recent efforts to improve RANS modelling fidelity increasingly integrate data-informed and physics-guided principles [14,15]. This paradigm leverages insights from high-fidelity, scale-resolving simulations, such as Large Eddy Simulation (LES) or DDES [16,17,18], to develop targeted structural corrections to RANS closures. Among various physically meaningful flow parameters, helicity (denoted as h hereinafter), defined as the scalar product of velocity and vorticity vectors, has emerged as a promising candidate for characterizing coherent rotational structures and their interactions with turbulence. Incorporating h-based corrections offers a physics-grounded mechanism to modulate eddy viscosity, directly addressing the excessive turbulent diffusion typical of RANS models in vortical regions [19]. Despite its theoretical promise, the generalizable and robust integration of such physics-based corrections into RANS frameworks, followed by comprehensive validation across representative aeronautical configurations, remains an unresolved challenge. Addressing this necessitates a synergistic methodology that tightly couples credible high-fidelity data sources with systematic model calibration and validation procedures.
To address this gap, this study introduces and validates a physics-informed helicity correction for the SST model, developed under the guidance of an improved DDES framework [20]. The research implements a tightly coupled, two-phase methodology. First, an improved DDES is applied to a highly loaded compressor cascade. This scale-resolving simulation provides a high-fidelity dataset that captures the complex physics of corner separation—a challenging flow phenomenon commonly encountered in aeronautical applications. Second, insights from this dataset are used to calibrate and validate the helicity-corrected variant of the SST model, referred to as SST-Helicity. The correction is built around a helicity function , which dynamically modulates the turbulent eddy viscosity to account for the energy backscatter effects in 3D separated flows. This function takes the normalized helicity (h) as its primary input. Finally, the SST-Helicity model is validated against experiments of two benchmark configurations: the ARA M100 wing–fuselage and DLR-F6 aircraft models [21,22]. This validation quantitatively evaluates the model’s ability to improve predictions of the separation topology, key aerodynamic performance metrics, and the stall onset.
The remainder of this paper is organized as follows: Section 2 details the numerical methodology, including the improved DDES framework and the formulation of the helicity-corrected RANS model. Section 3 consists of two parts: first, a high-fidelity DDES-based analysis of corner separation flow physics is presented, establishing the mechanistic basis for the helicity correction through comparative assessment with RANS results; subsequently, the SST-Helicity model is comprehensively validated against two benchmark external aerodynamic configurations. Finally, Section 4 summarizes the principal conclusions drawn from this study and suggests promising avenues for future work.
2. Materials and Methods
2.1. Flow Solver
All numerical simulations were performed using the commercial CFD solver ANSYS Fluent 19.2. The proposed helicity corrections and the DDES-VTM-SST formulation were embedded via user-defined macros. Helicity-dependent modulation terms were integrated into the turbulence kinetic energy (TKE) transport equation, while the scale-adaptive dissipation term of the DDES-VTM-SST model was embedded into the TKE transport equation. A pressure-based pressure–velocity coupling algorithm was employed to solve the governing flow and turbulence equations in a fully coupled manner, improving numerical stability and convergence behavior.
For the RANS simulations, the convective terms in all transport equations were discretized using second-order upwind scheme. Cell-centered gradients were computed with the Least Squares Cell-Based method, and gradient limiting was applied via the TVD-Minmod function to suppress oscillations in the reconstructed solution at cell faces. The pseudo-transient formulation was activated to accelerate convergence while maintaining stability.
For the DDES simulation, a bounded central differencing (BCD) scheme was employed for the convective terms, instead of the second-order upwind scheme. This choice effectively minimized numerical dissipation in the LES-resolved regions, while preserving sufficient accuracy in the RANS zones and across the RANS-LES interfaces [23].
In terms of temporal discretization, the DDES simulation employed Fluent’s implicit dual-time stepping method, with a second-order backward Euler scheme for physical time advancement. The physical time step was determined based on the through-flow time, i.e., the time required for a fluid particle to traverse the LES-dominated region over one blade chord length c at the reference velocity Uref (taken as the inlet freestream velocity). It was calculated as , where N denotes the estimated number of cells along this trajectory. A CFL number of 0.5 was used to ensure sufficient temporal resolution within the LES zones. A maximum of 10 inner iterations per time step was permitted, which typically yielded a residual drop of at least three orders of magnitude for all governing flow and turbulence equations.
The DDES simulation was initialized from converged steady RANS solutions and advanced for 25 through-flow times to flush out the initial transients. Flow statistics were then collected and averaged over an additional 30 through-flow times. The computational cost per DDES simulation amounted to approximately 23,000 core-hours (equivalent to about 2 days of wall-clock time using 512 CPU cores), compared to roughly 24 core-hours (about 1 h based on 24 CPU cores) for a corresponding RANS simulation.
2.2. Baseline SST Model
This section introduces and discusses the original SST model. For conciseness, only the key variables and terms are described herein. The complete formulations of the baseline SST model are available in the referenced literature [6].
The Menter’s SST model used in this study is given as follows:
In Equations (1) and (2), the first three source terms represent the production, dissipation, and diffusion of TKE and specific dissipation rate , respectively. The fourth term in Equation (2) is the cross-diffusion term, which originates from transforming the model to its formulation. Here, is a blending function that combines the and models in the outer region of boundary layer.
The production of TKE is defined as:
where is Reynolds stress tensor, based on the Boussinesq assumption for the Reynolds stress–strain relation.
The dissipation of TKE is defined as:
The turbulent eddy viscosity is computed as:
When predicting boundary-layer flows, such as shock-induced boundary-layer separation, the original definition of eddy viscosity, , overpredicts turbulent viscosity in the region immediately downstream of shock, resulting in an underpredicted separation bubble. The second term inside the bracket acts as a stress limiter, which restricts the unphysically excessive growth of eddy viscosity in adverse-gradient boundary layers. This modification has been shown to yield improved predictions for many wall-bounded flows, particularly those involving adverse pressure gradients.
2.3. Enhanced DDES-VTM-SST Methodology
An improved DDES framework, referred to as DDES-VTM-SST, is employed in this study and is mathematically described by Equations (6)–(9). The key advancement of this method is the introduction of a Vortex Tilting Measure (VTM)-based dynamic filter width, which enables adaptive switching between RANS and LES modes. The governing equation for k is given by Equation (6), where is multiplied by the DDES switching function . This function, defined in Equation (7), compares the turbulent length scale with the DES filter width , ensuring RANS mode is maintained in attached boundary layers, while permitting LES resolution in separated regions. The filter width is dynamically determined via Equation (8): in LES-dominant regions (), it is scaled by VTM-based function , which varies between 0.1 and 1.0, whereas, in RANS-dominant regions, the maximum grid spacing is used. The VTM parameter in Equation (9) quantifies the three-dimensionality of vortical structures, with values near zero indicating underdeveloped, quasi-2D vortices, while values approaching 0.4 correspond to fully developed 3D turbulence.
Through this mechanism, the subgrid-scale eddy viscosity is sensitively adjusted to the local flow state. In the initial separation zone, a low VTM reduces the filter width to one-tenth of its standard value. This drastic reduction in subgrid-scale eddy viscosity allows direct resolution of Kelvin–Helmholtz instability waves and promotes a rapid transition to LES. As the flow develops downstream, and 3D turbulence intensifies, an increasing VTM restores the filter width to the conventional LES scale. This self-adapting formulation optimizes both predictive accuracy and computational efficiency in scale-resolving simulations of separated flows.
2.4. SST-Helicity Modification
The non-equilibrium modification of SST model, named SST-Helicity, is introduced. The initial motivation for constructing this model stems from the seminal finding by Liu et al. [12], which revealed that helicity plays a pivotal role in the evolution of vortex structures and can trigger energy backscatter mechanism, i.e., inverse energy cascade from smaller scales of turbulence to large scales. This implies that helicity serves not only as a key scalar quantity characterizing the topological intensity of vortical flows, but also, through its nonlinear coupling with vorticity and velocity fields, directly influences the TKE production mechanism. It is, thus, an essential physical factor governing the turbulent energy cascade and backscatter.
In this study, a helicity-based variant of SST model is proposed to account for the effect of turbulence energy backscatter on the TKE production. The constructed DDES-VTM-SST database serves to validate the rationale of the proposed SST-Helicity formulation. In the SST-Helicity model, the production term of TKE, , is augmented by a helicity-based TKE source term , defined as:
where is vorticity magnitude, and is the helicity function. Physically, represents the influence of turbulence energy backscatter on the TKE production. In regions where energy backscatter is pronounced (typically where ), increases by capturing inverse energy transfer from smaller to larger turbulent scales. Through this helicity-driven modulation, the correction provides a localized mechanism for adjusting turbulent eddy viscosity in vortical and separated flows, directly addressing a key limitation of the baseline SST model.
3. Results
This section presents this study’s findings, following a progressive validation framework from the flow analysis to engineering validation. The investigation began with a detailed analysis of the compressor cascade flow, where DDES-VTM-SST was employed to construct scale-resolving database that elucidates the corner separation physics. The insights derived from this high-fidelity benchmark directly informed a diagnostic assessment of the SST and SST-Helicity models. Subsequently, the predictive capability of the SST-Helicity model was validated against experimental data for two benchmark aerodynamic configurations: the ARA M100 wing–fuselage and the DLR-F6 aircraft models. This two-tiered approach enabled a comprehensive evaluation of the model’s performance, spanning from fundamental flow mechanisms to complex engineering applications.
3.1. High-Fidelity DDES Database
The Prescribed Velocity Distribution (PVD) cascade, specifically designed and experimentally investigated for corner separation studies in compressors, serves as the benchmark for DDES simulations and validation. It comprises five controlled-diffusion airfoils, representative of high-pressure compressor stators. Key geometric parameters, detailed experimental setup, and measurements are available in the reference literature by Gbadebo [24].
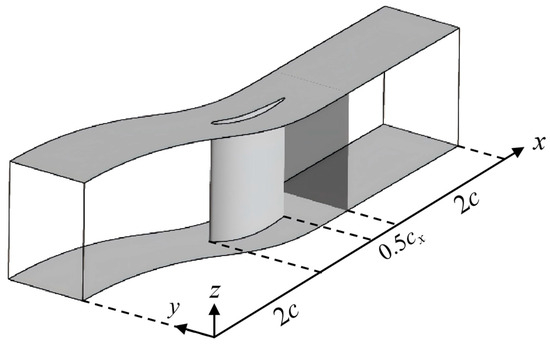
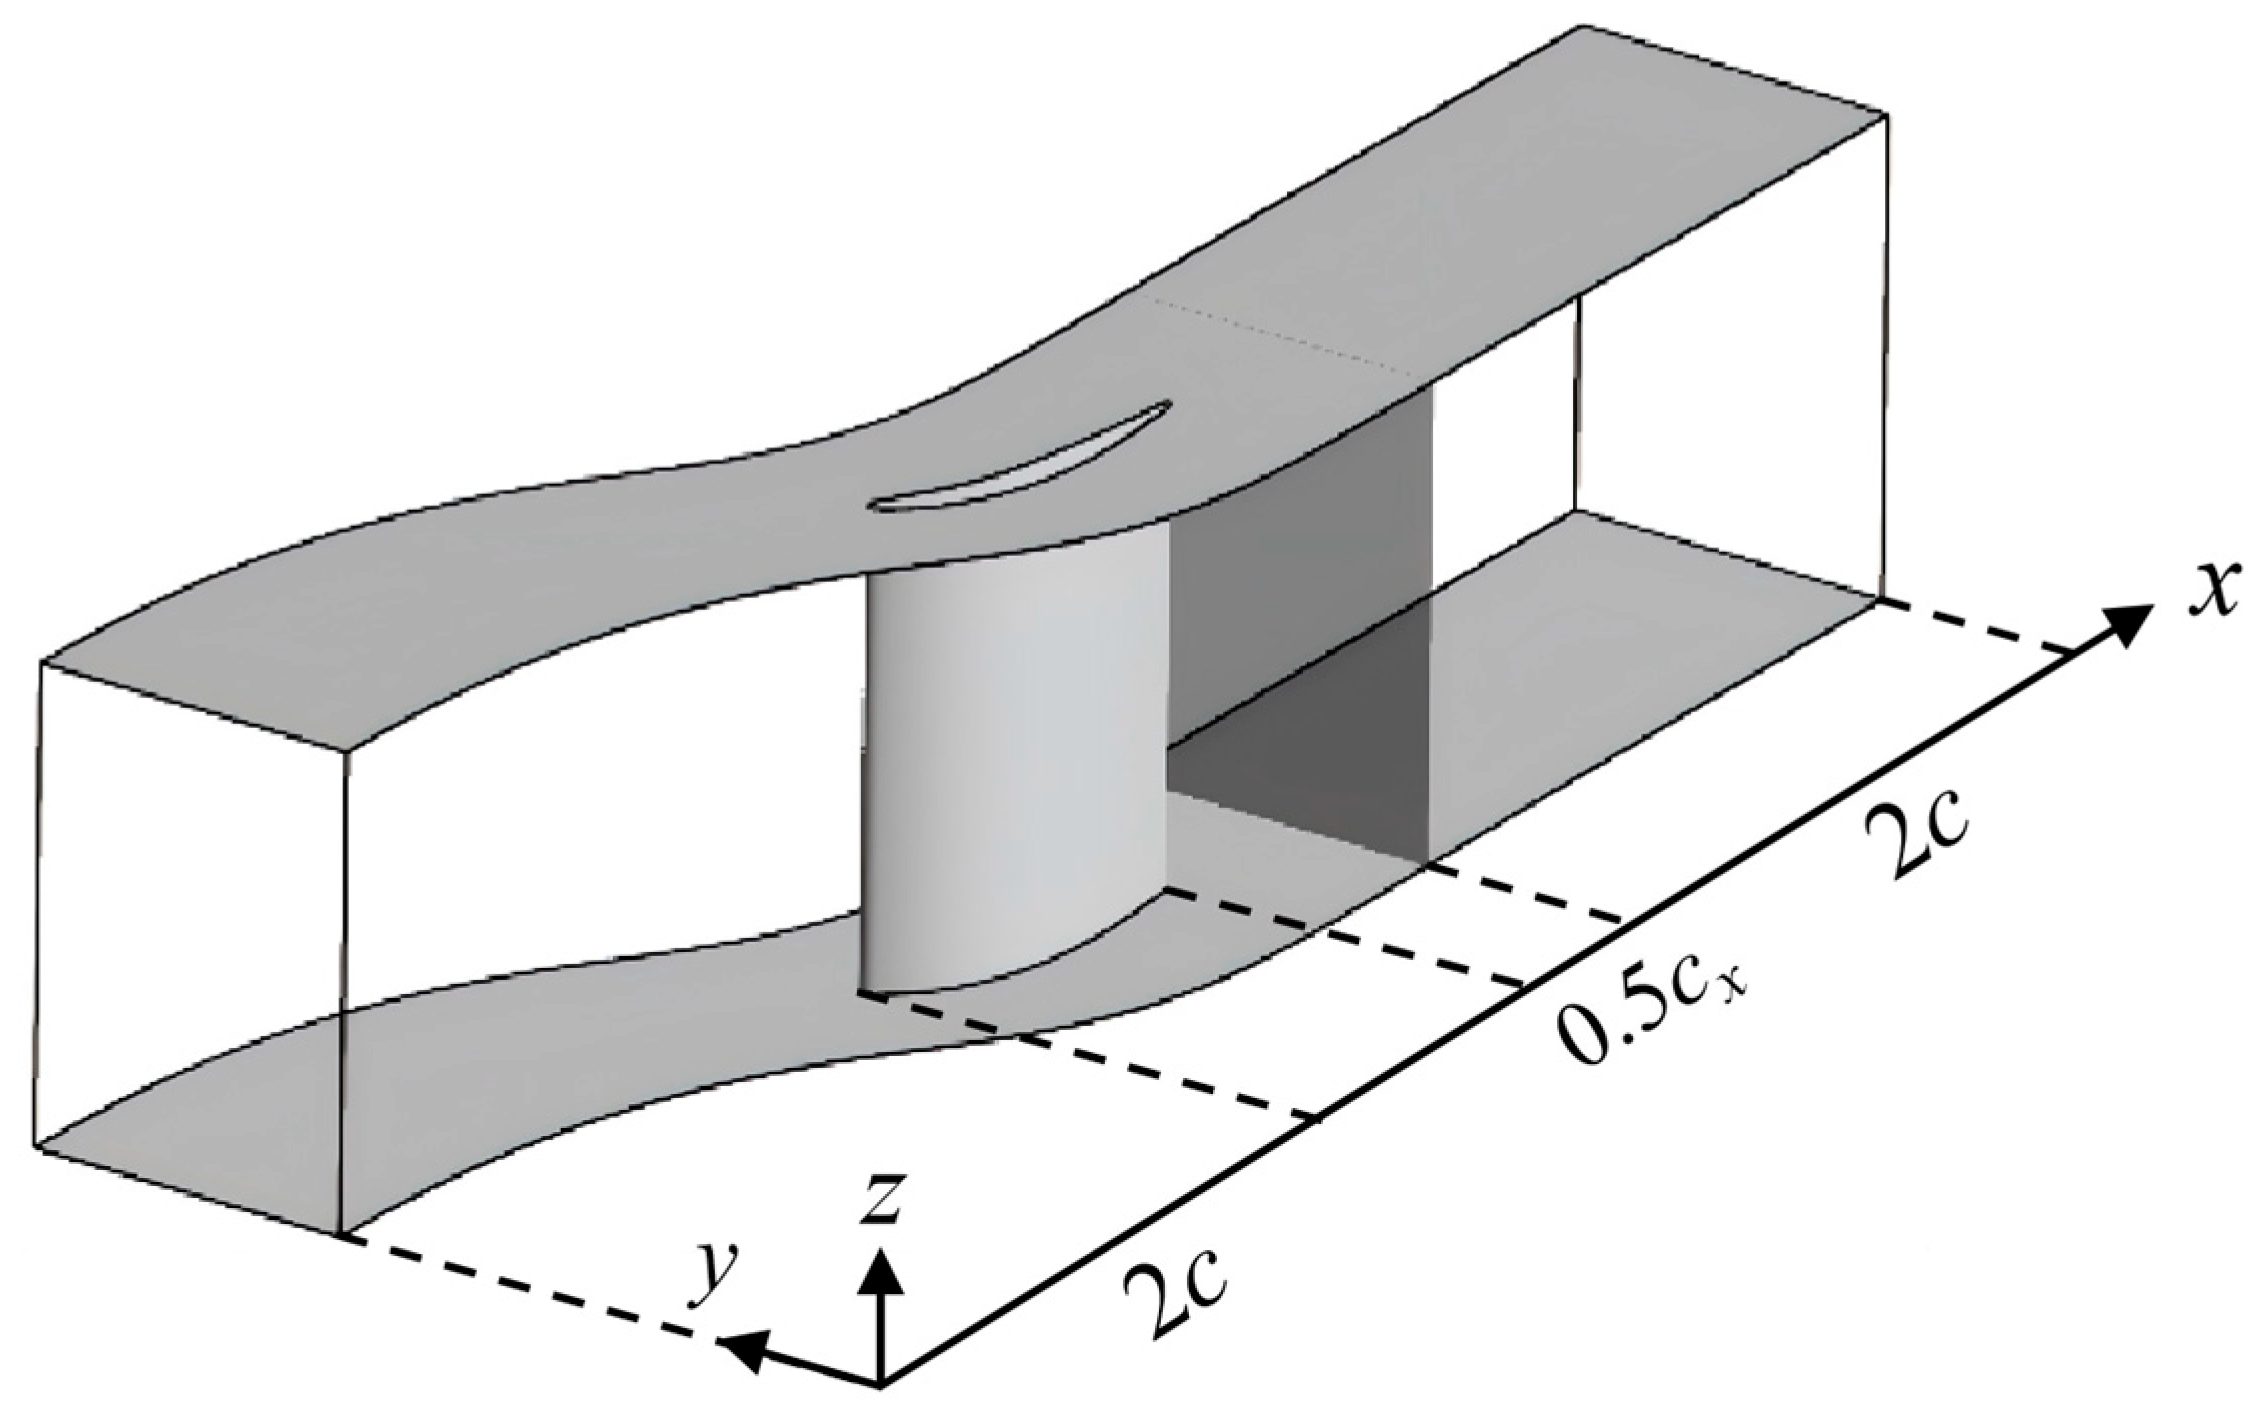
The computational domain is shown in Figure 1. The inlet boundary was positioned two chords upstream of the leading edge, aligning with the location of the hotwire anemometer in the experimental setup, while the outlet was placed two and a half chords downstream of the trailing edge to allow sufficient development of the corner vortex structure. Translational periodicity was applied in the pitch-wise direction. The measurement plane was located at half an axial chord downstream of the trailing edge, corresponding to the position of the five-hole probe in the experiments. Both RANS and DDES meshes were generated using Numeca AutoGridv6, employing an O4H topology.
Figure 1.
Flow domain for PVD compressor cascade.
For the RANS mesh, approximately 3 million hexahedral cells were used, with near-wall resolution ensuring and a grid expansion ratio of 1.1. A grid independence study was conducted using three systematically refined meshes (0.9 million, 1.6 million, 3 million). Key aerodynamic parameters, such as the blade loading distribution and total pressure loss at measurement plane, showed variations of less than 0.6% between the medium and fine grids, confirming that the selected mesh provides results independent of further refinement.
The DDES mesh was constructed in accordance with established hybrid RANS-LES guidelines [23]. Non-dimensional grid spacings, based on the inlet boundary-layer friction velocity , were specified as follows: on the blade surface, ; on the endwall, . In the separation region, the mesh was refined isotropically (aspect ratio < 2) to adequately resolve turbulent structures, resulting in a total of approximately 20 million cells.
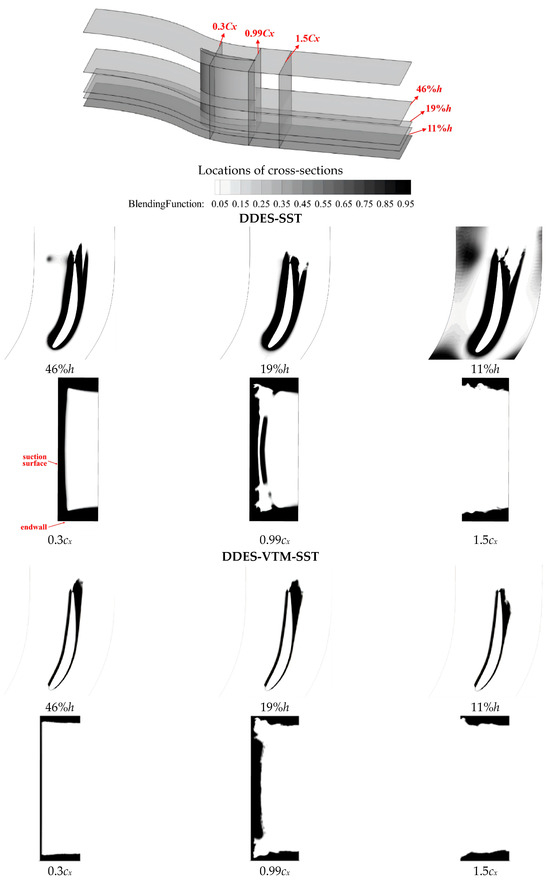
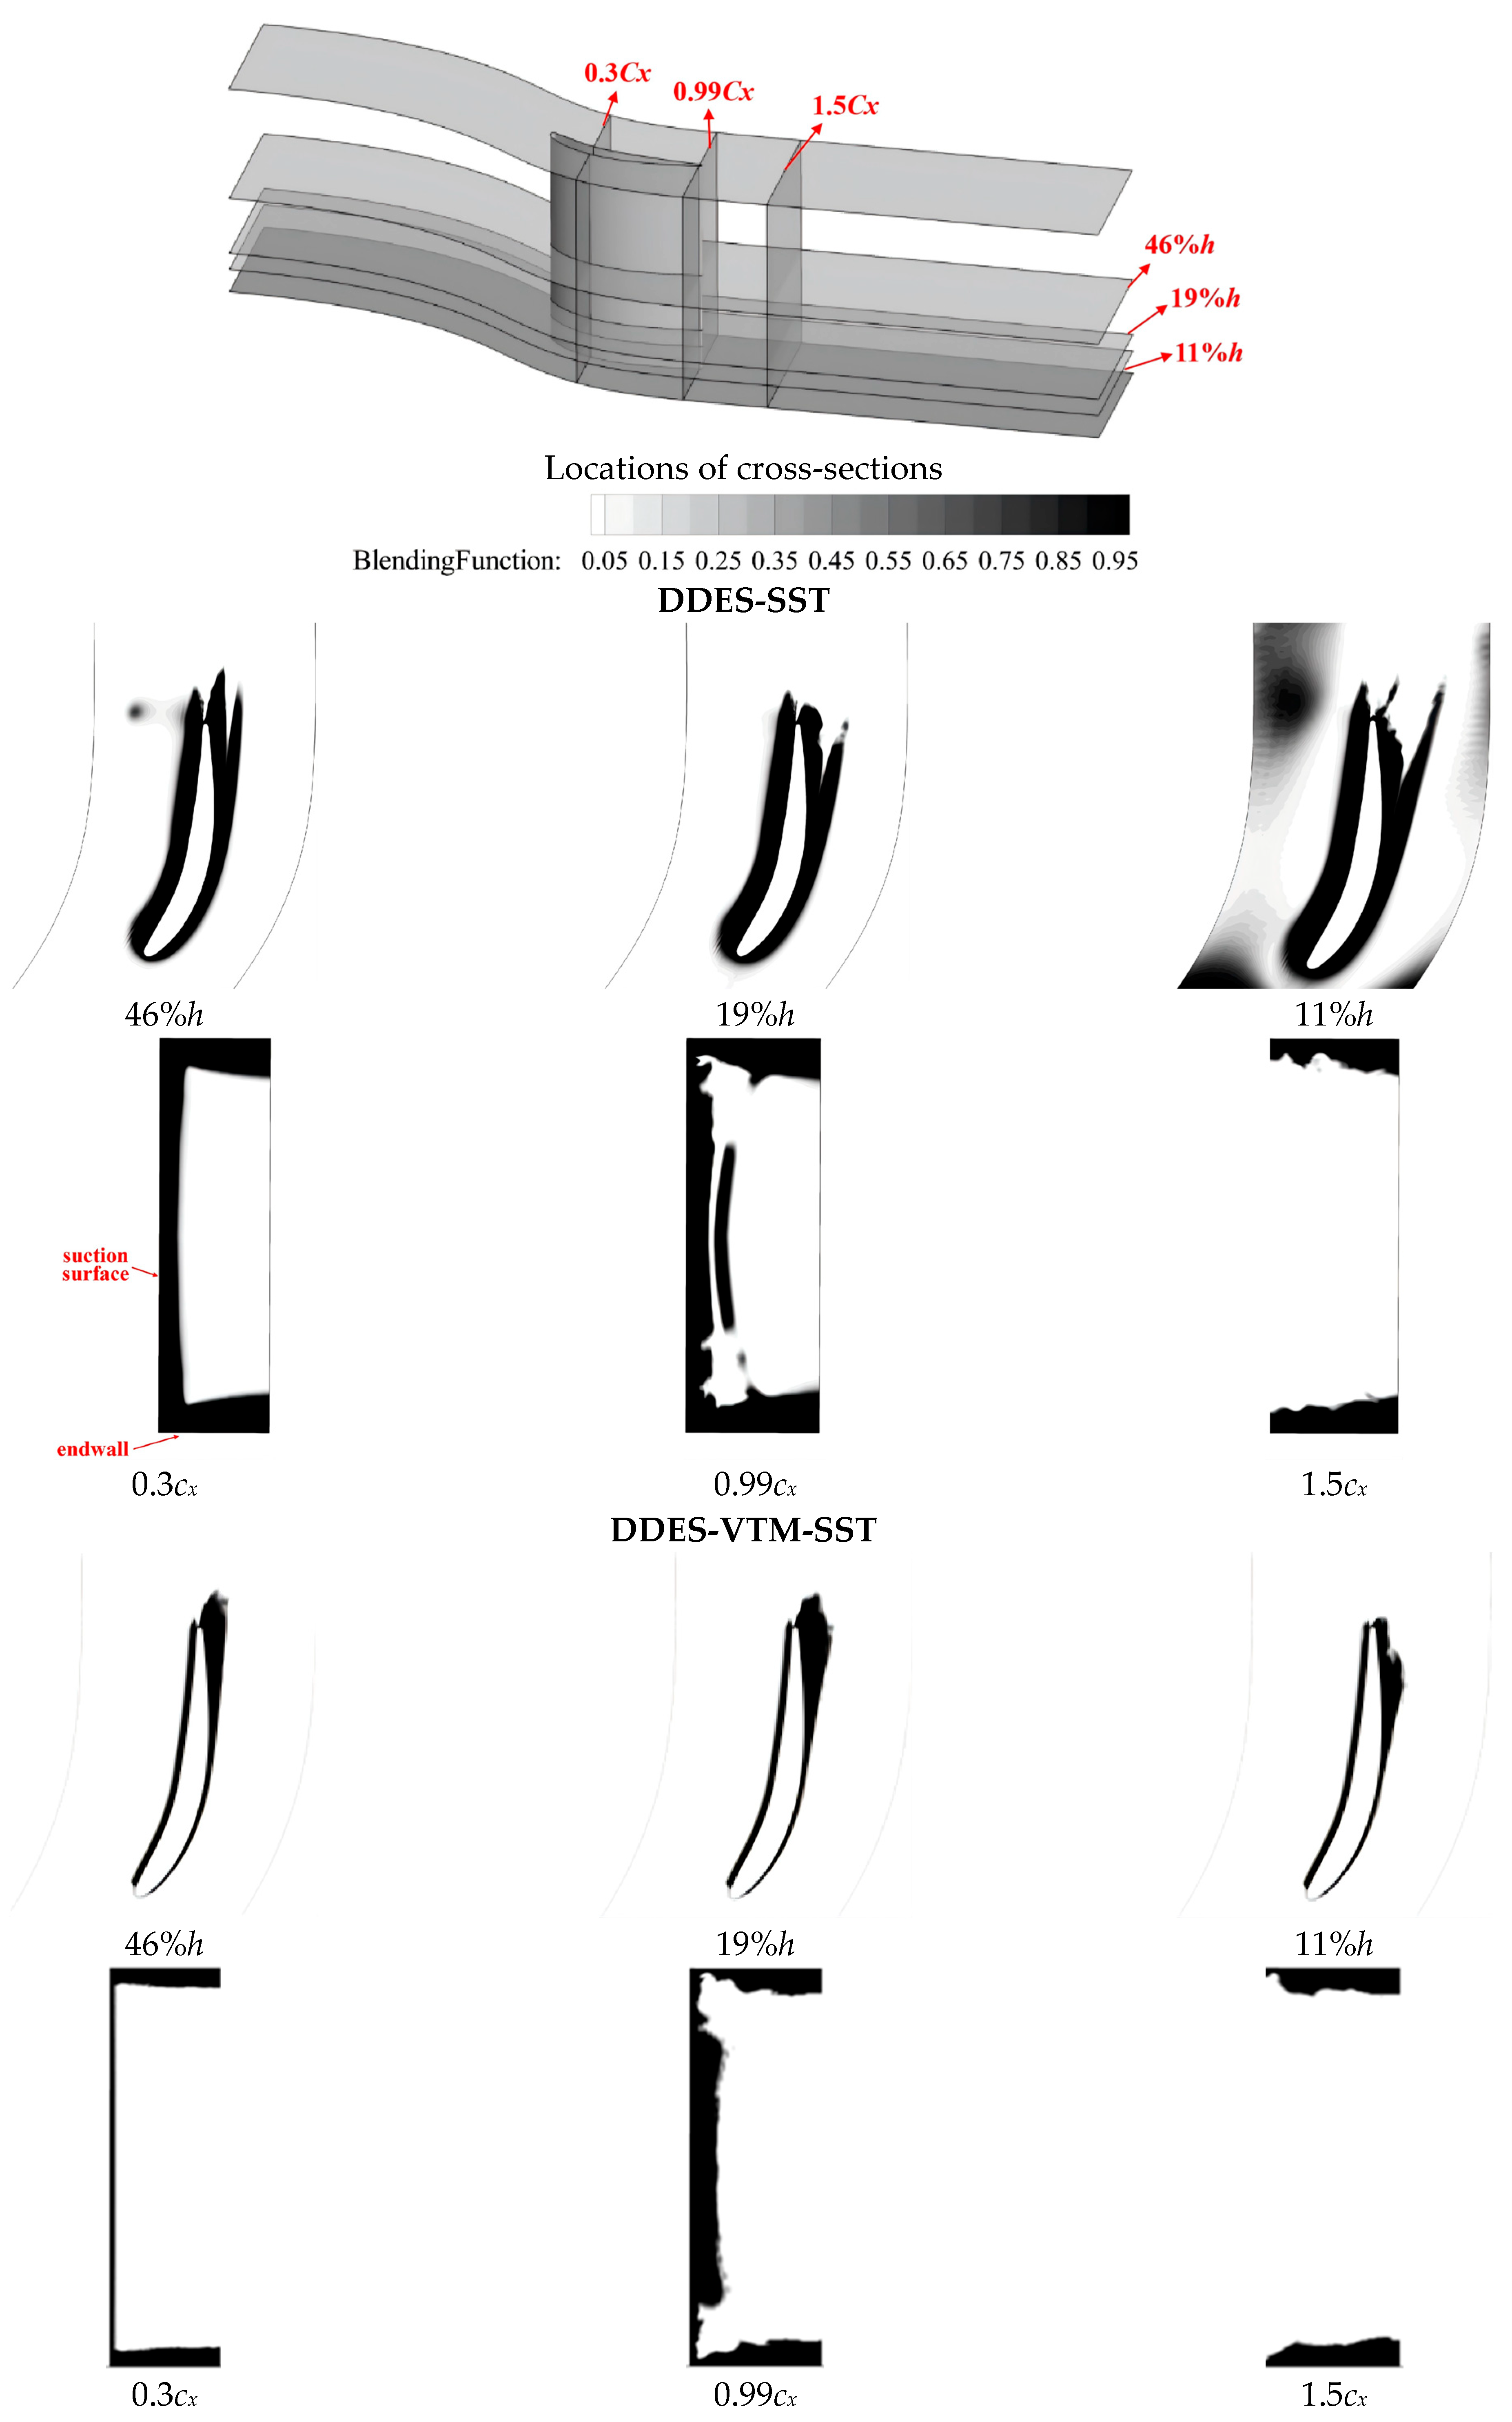
To evaluate the scale-resolving performance of the conventional DDES-SST model and its enhanced variant, DDES-VTM-SST, their respective blending functions () were examined across six representative cross-sectional planes: three spanwise-normal cuts (at 11%h, 19%h, 46%h) and three axial-normal cuts (at 0.3cx, 0.99cx, 1.5cx). As shown in Figure 2, both models successfully activate the LES mode within the 3D separated corner flow—visible as the gray/white region around the corner—which the RANS approach fails to capture accurately. A closer comparison reveals that the conventional DDES-SST tends to exhibit excessive shielding, retaining RANS mode in portions of the attached boundary layer and the adjacent freestream, whereas DDES-VTM-SST shows a more confined and physically consistent transition pattern, enabling a smoother and quicker switch to LES.
Figure 2.
Comparison of distributions between DDES-SST and DDES-VTM-SST models at selected cross-sections.
Furthermore, upstream of separation (0.3cx), the conventional DDES-SST tends to retain RANS mode, demonstrating a persistent “over-shielding” effect, while DDES-VTM-SST allows more rapid transition to LES, thereby reducing unnecessary RANS coverage in attached flow regions. Within the corner separation zone, DDES-VTM-SST resolves a larger portion of the unsteady vortical structures and delivers a more accurate representation of separation topology. Downstream of the trailing edge, the flow is predominantly resolved in LES mode, with RANS activity confined only to the immediate vicinity of the endwall.
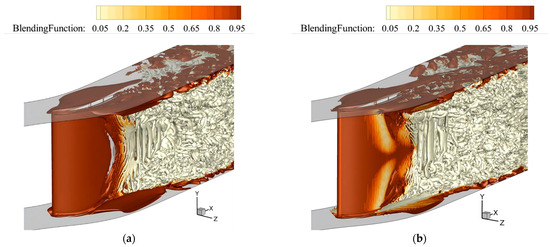
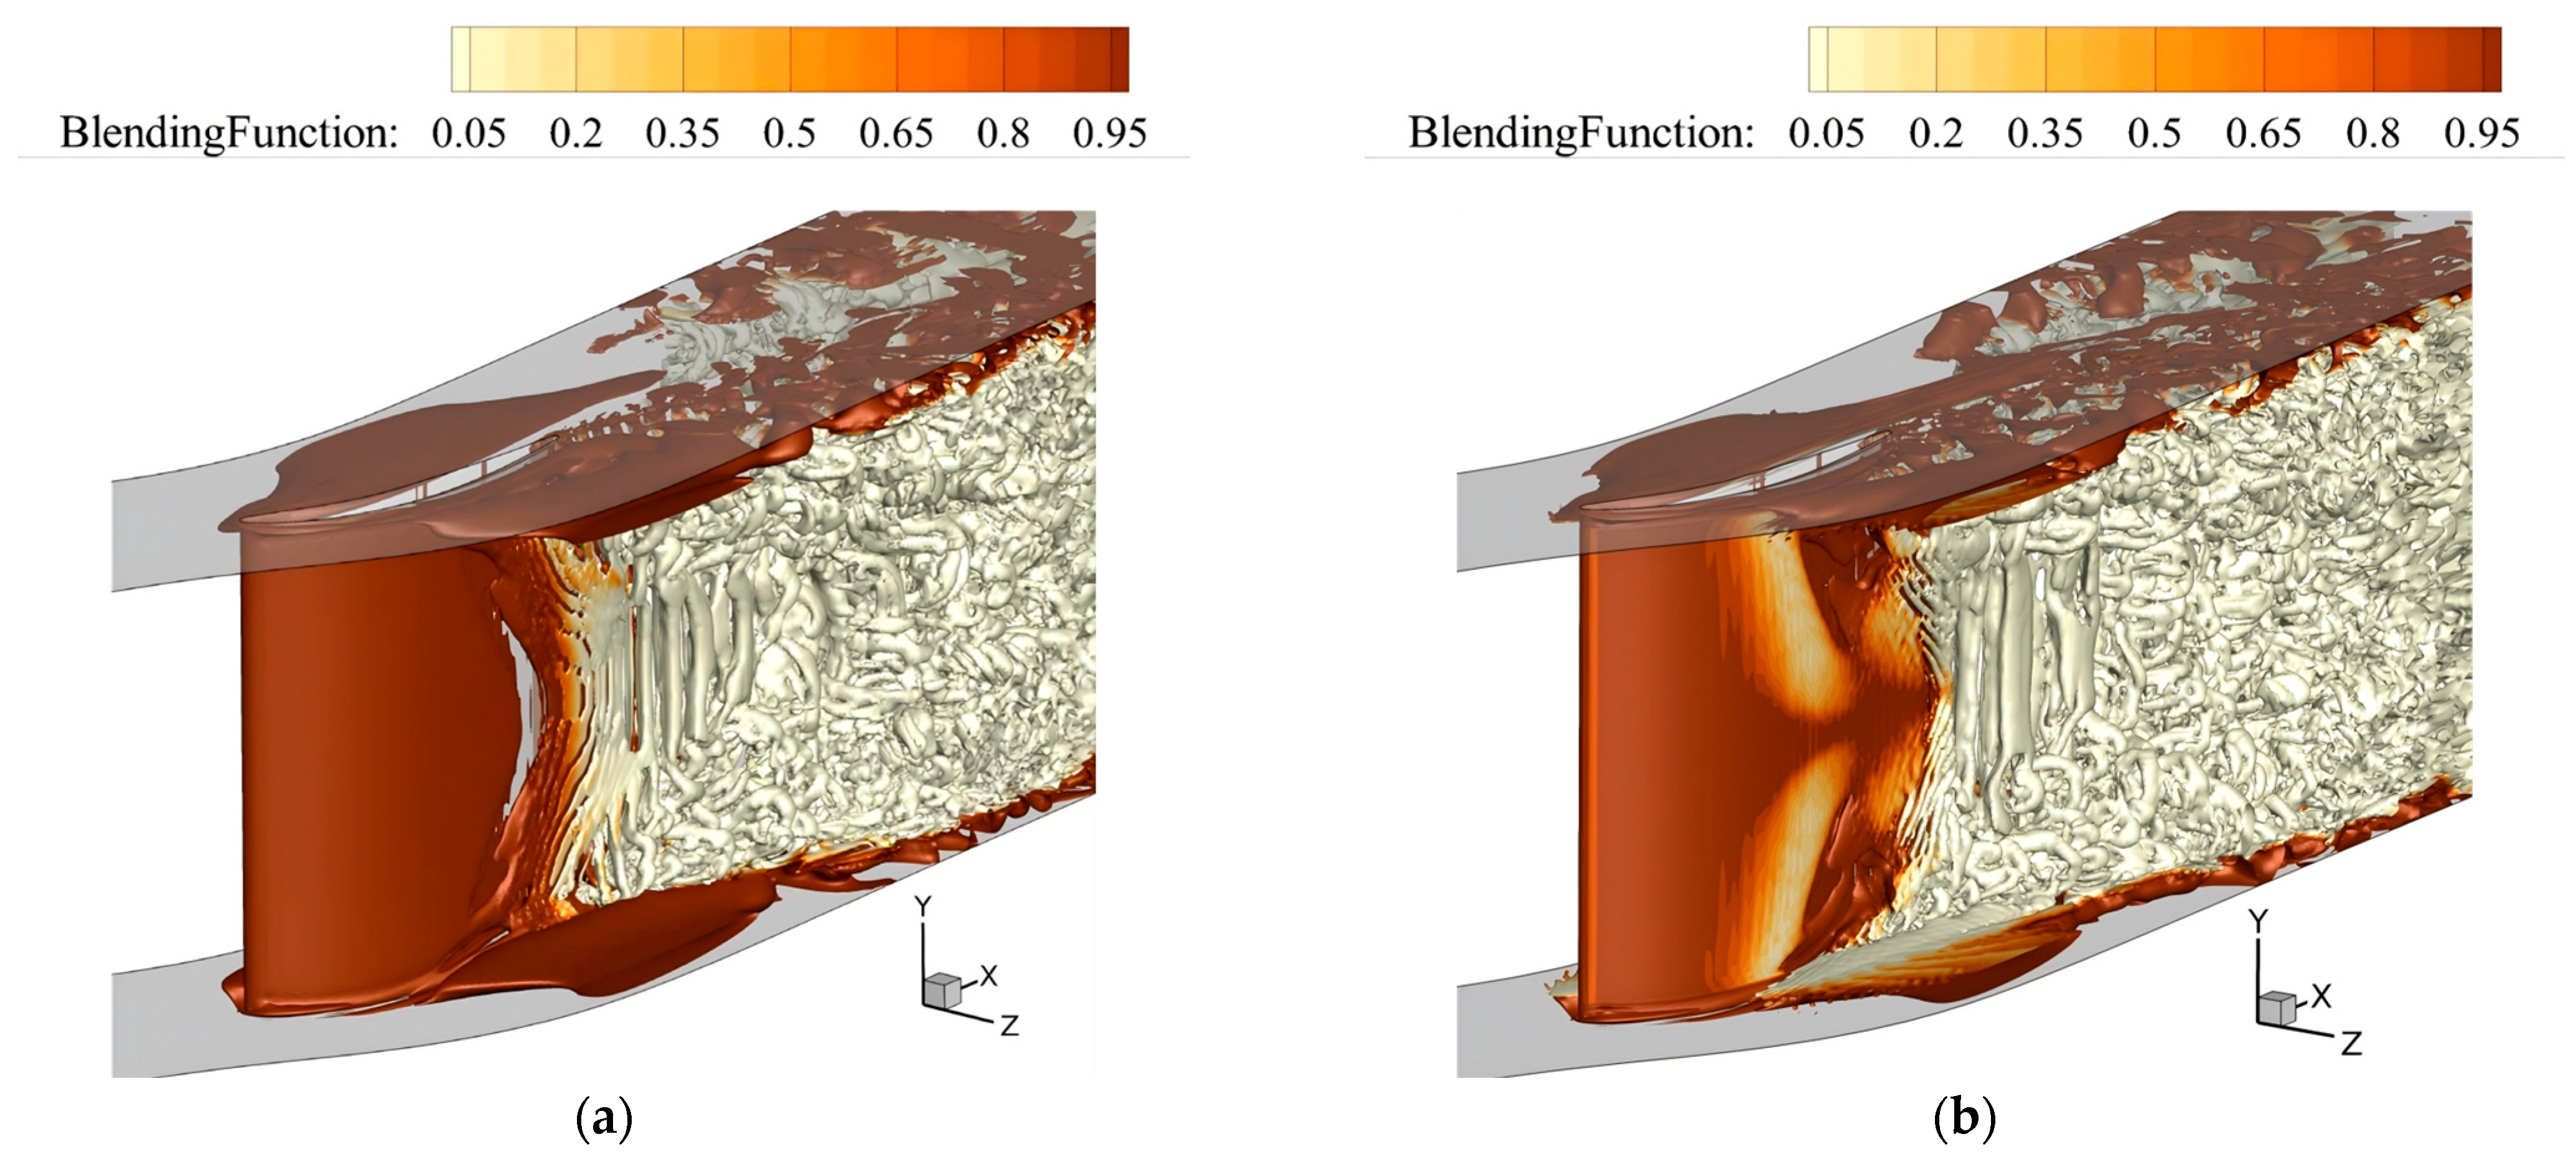
Figure 3 visualizes the corner vortex structures using the Q-criterion (), colored by the blending function (brown: RANS; light yellow: LES). Compared with the DDES-SST, the DDES-VTM-SST resolves more numerous and finer turbulent structures in the endwall and initial separation region, a result attributed to VTM function’s ability to adaptively sense and respond to vortex roll-up and 3D deformation.
Figure 3.
Iso-surfaces of Q-criterion colored by : (a) DDES-SST; (b) DDES-VTM-SST.
In summary, the DDES-VTM-SST outperforms the conventional DDES-SST by enabling a faster and more localized RANS-to-LES transition through its vortex-tilting-measure-based dynamic shielding. This refined transition mechanism reduces spurious RANS-mode persistence (“over-shielding”), leading to improved resolution of unsteady vortical structures and more accurate predictions of separation topology and its downstream development. Based on the validated high-fidelity DDES database, the performance of the helicity-corrected RANS models is subsequently evaluated.
3.2. Validation in Compressor Cascade Flow
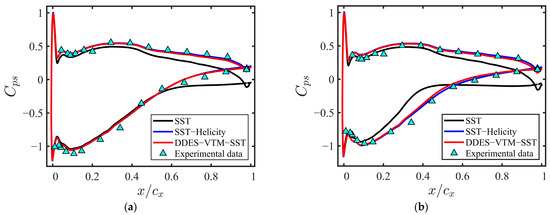
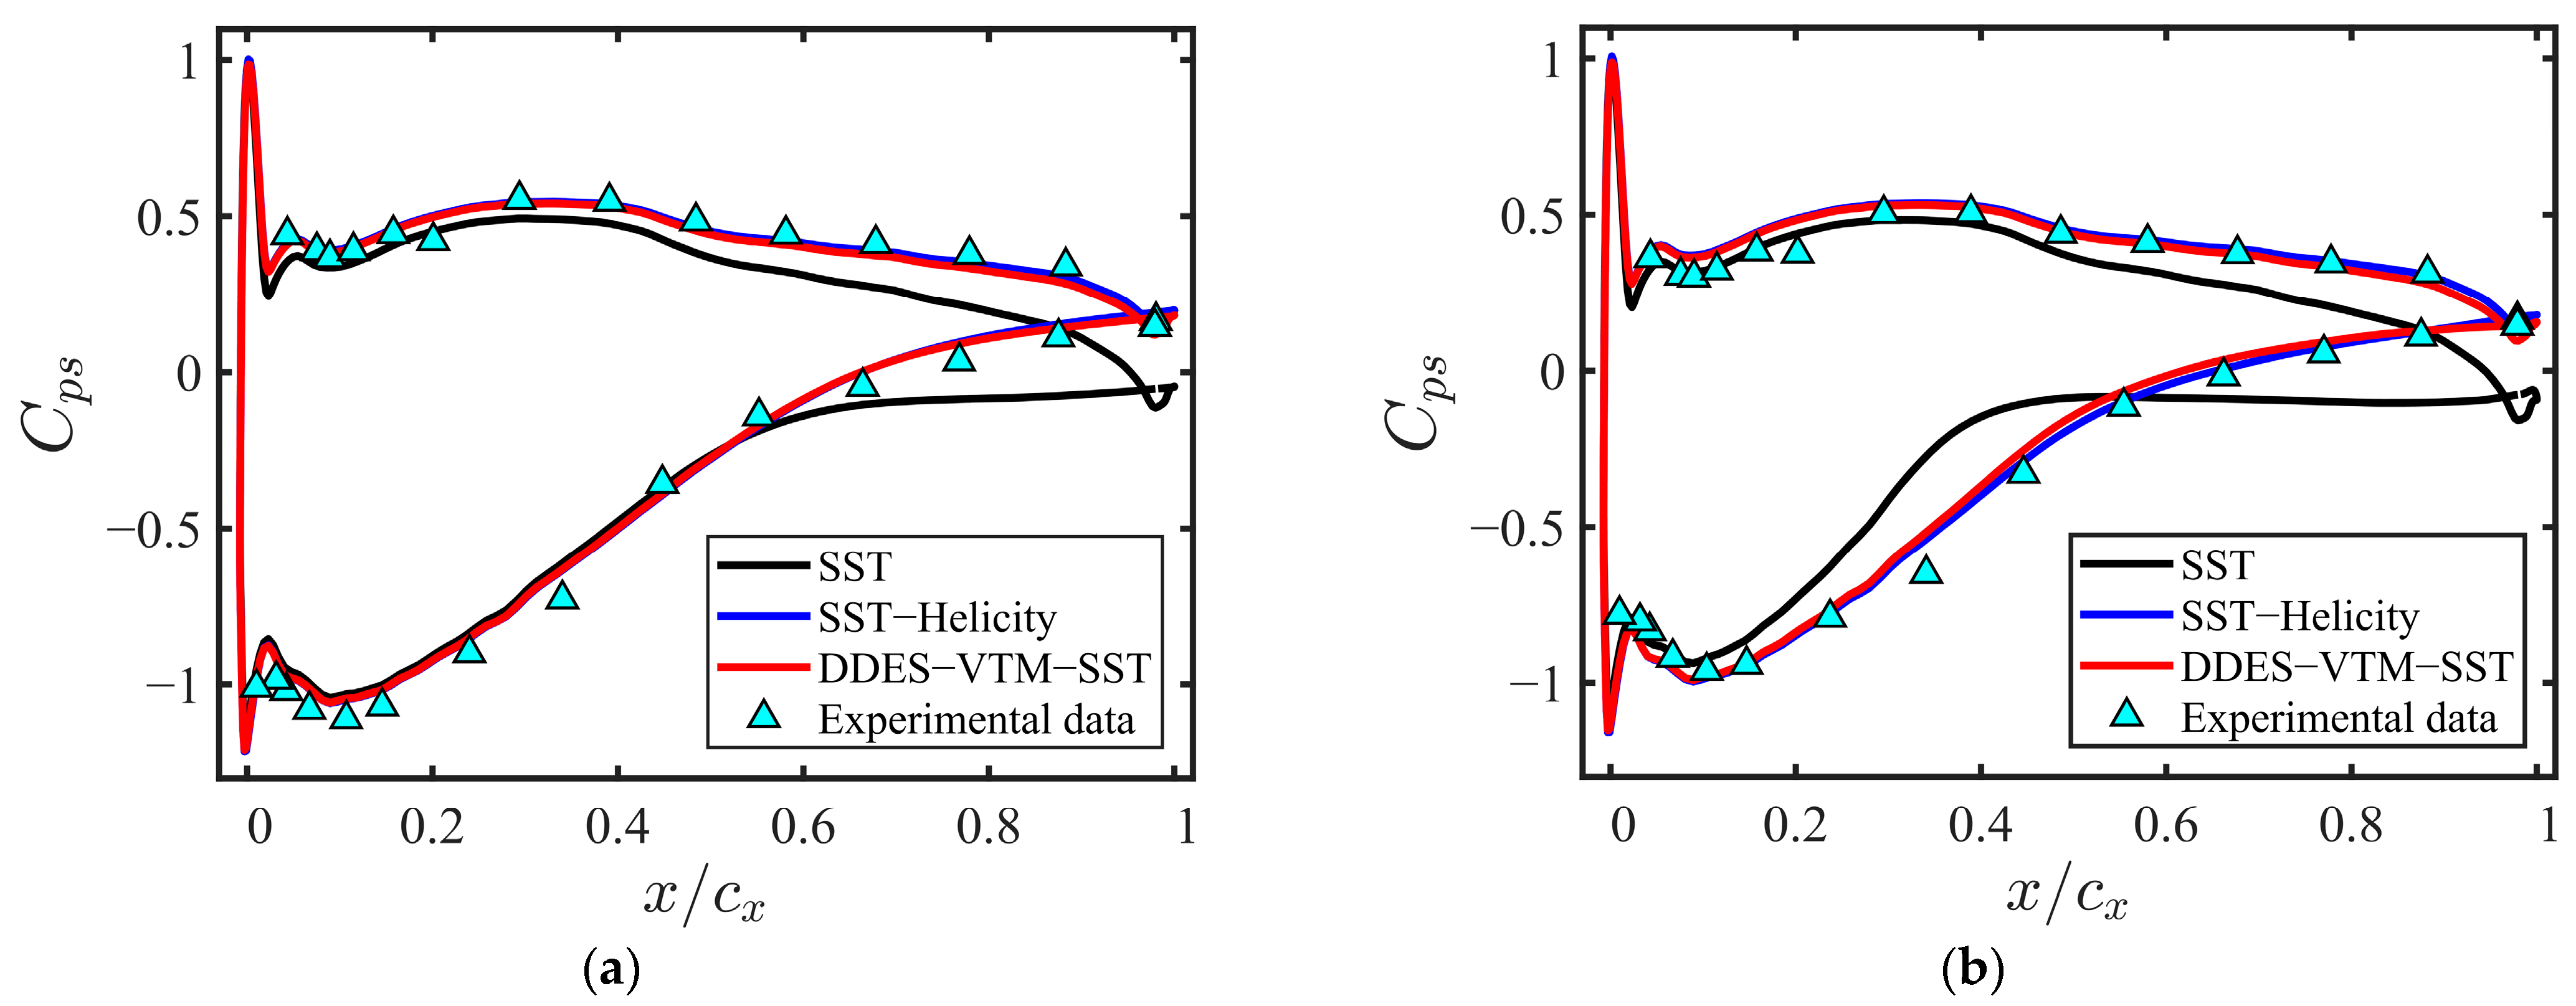
Figure 4 presents a comparison of the pressure coefficient () distributions at two distinct spanwise locations: near the midspan (46%h) and near the endwall (11%h). Overall, all three models generally capture the overall trend of the experimental data, characterized by a sharp suction peak near the leading edge, followed by pressure recovery toward the trailing edge. However, the SST model shows a significant deviation, exhibiting a broad, flat “pressure plateau” over the mid-chord region on the suction surface. This plateau is a clear indicator of an excessively large and sustained corner separation, which spans nearly the entire span. In contrast, both SST-Helicity and DDES-VTM-SST demonstrate remarkably improved agreement with experimental measurements. They successfully suppress this unphysical separation, providing a much more accurate prediction of the pressure recovery and the reattachment location. The discrepancy between the models and the experiment is more pronounced at 11%h, highlighting the increased modelling challenge in capturing the strong 3D and secondary flows near the endwall. Overall, the comparison validates the critical role of advanced turbulence modelling—via helicity correction or scale-resolving DDES—in accurately predicting corner separation.
Figure 4.
Pressure coefficient () distributions: (a) near midspan (46%h); (b) near endwall (11%h).
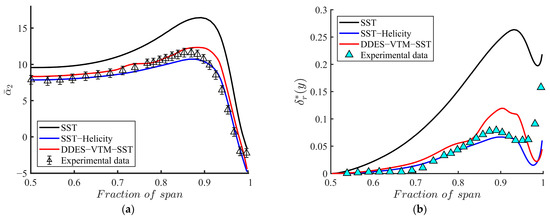
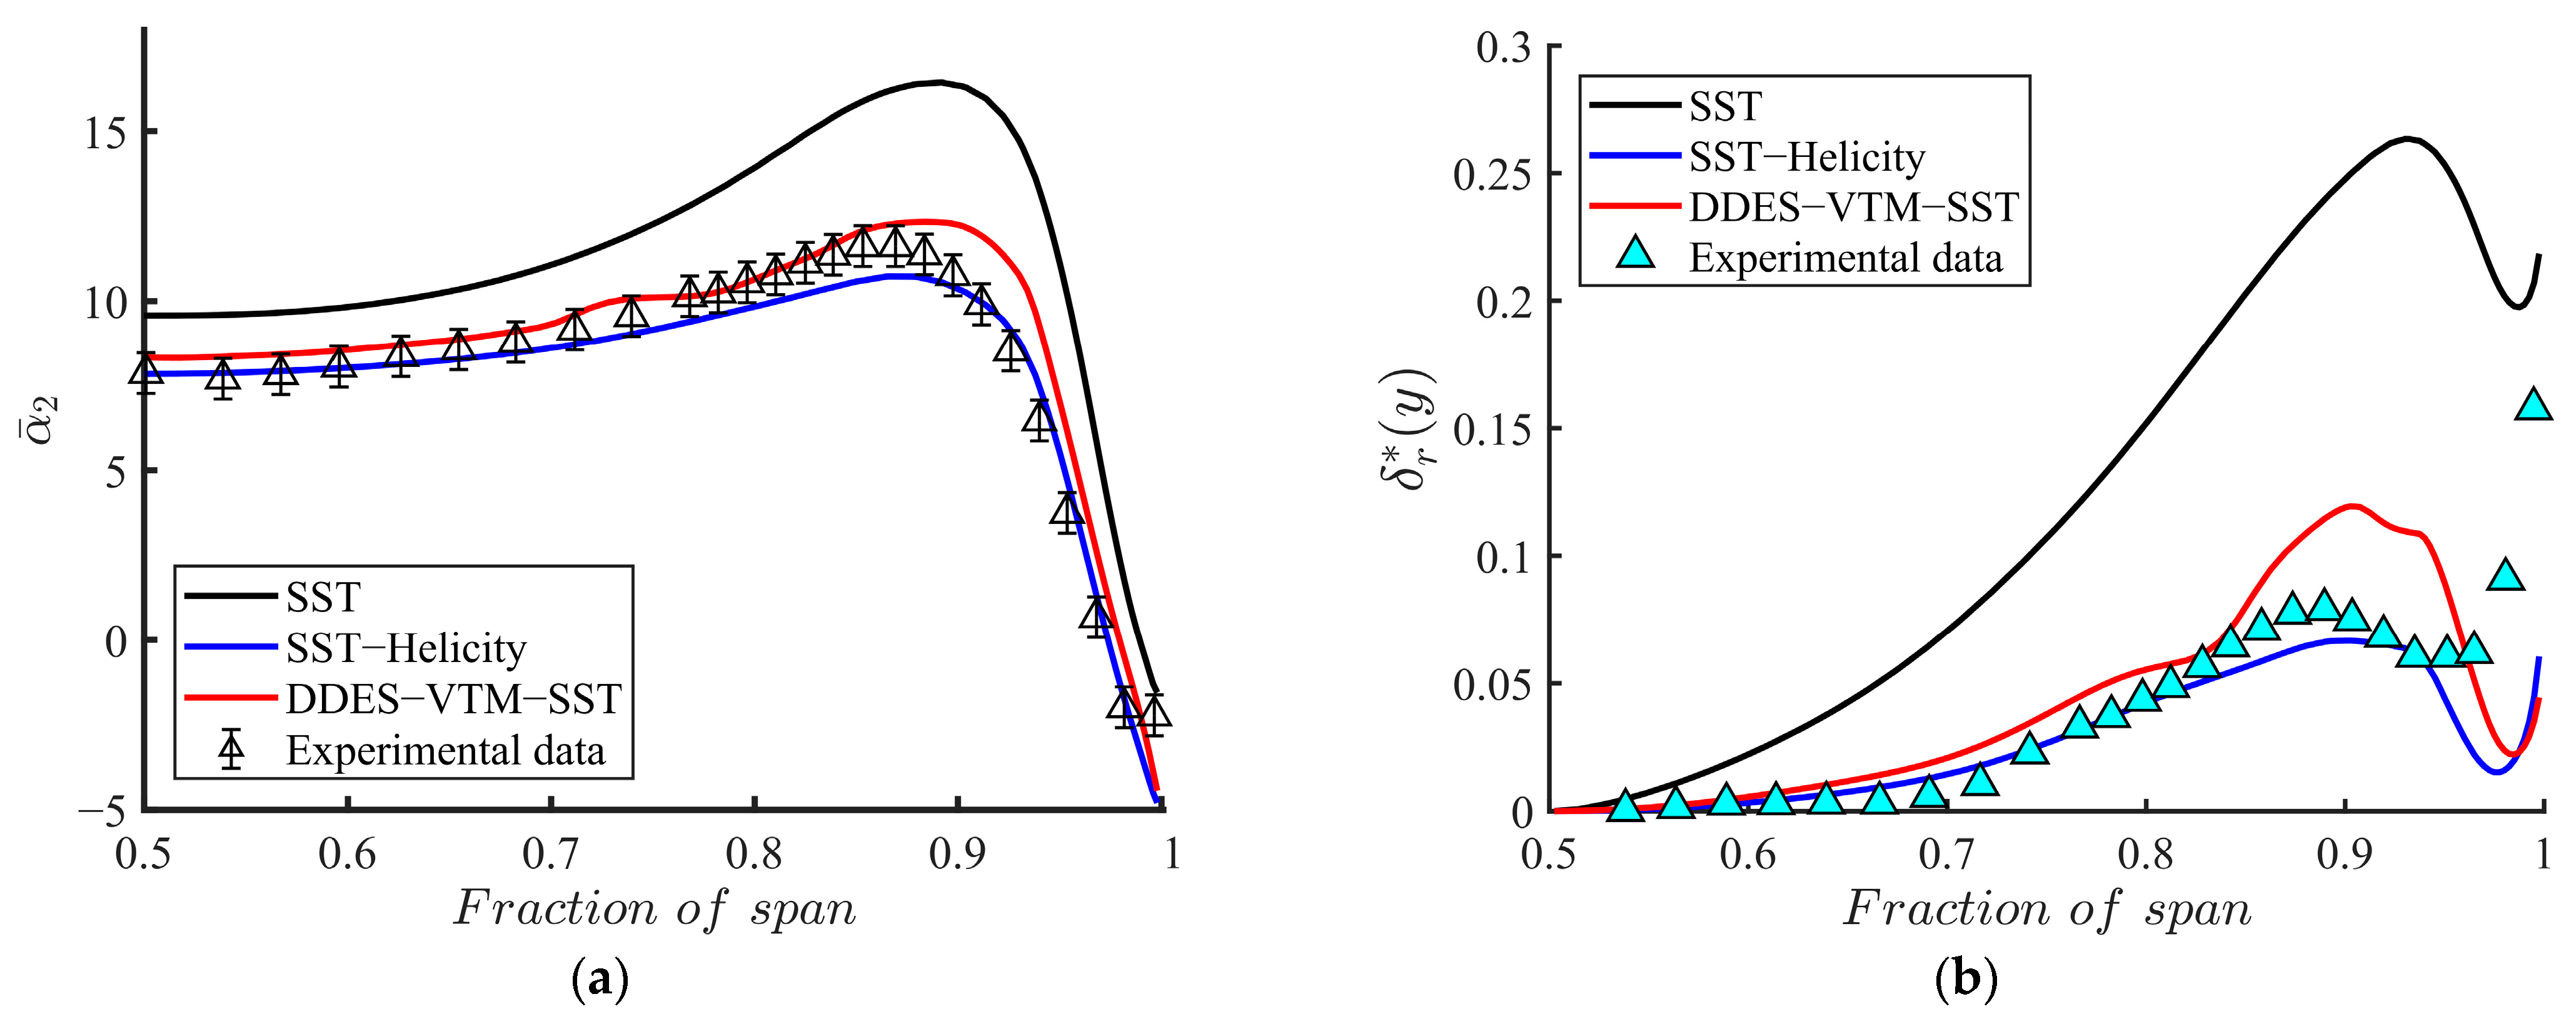
Figure 5 evaluates the performance of the SST, SST-Helicity, and DDES-VTM-SST models in predicting the corner separation characteristics by comparing their results with experimental data. Figure 5a shows the distribution of the circumferentially mass-averaged yaw angle at the measurement plane located downstream of the trailing edge (). All models capture the general trend of flow under-turning caused by the separation-induced blockage, with the DDES-VTM-SST demonstrating closest agreement to the experimental data across most of the span. The SST-Helicity model provides a notable improvement over the SST model, which shows the largest deviation due to separation predicted across the entire span. Furthermore, the SST-Helicity model predicts a relatively smaller extent of corner separation compared with DDES-VTM-SST. This difference in predicted separation size is quantitatively confirmed in Figure 5b, wherein the relative displacement thickness—a direct measure of the separated flow’s physical extent—at 0.99cx is plotted. Here, the SST model exhibits the highest values, significantly over-predicting the thickness and, thus, the separation size, consistent with its excessive flow turning deviation in Figure 5a. The SST-Helicity model successfully reduces this overprediction, bringing the profile closer to the experimental data. The DDES-VTM-SST model provides the most accurate match to the experimental thickness distribution, corroborating its superior performance in capturing the true scale of the corner separation. The supporting evidence is that, in the experiment, the hotwire probe cannot measure the reversed velocity, resulting in the displacement thickness being under-predicted. This experimental limitation implies that the physical separation is likely somewhat larger than the measured data suggests. In this context, the DDES-VTM-SST prediction, which lies just above the experimental points, may, in fact, represent the most accurate physical reality, while the SST-Helicity model, though a significant improvement, still appears to slightly underpredict the separation extent relative to the corrected benchmark.
Figure 5.
Evaluation of blockage due to corner separation: (a) mass-averaged yaw angle at 1.5cx cut plane; (b) relative displacement thickness at 0.99cx cut plane.
In summary, the results confirm helicity correction as a valuable enhancement to the RANS model. However, given experimental limitations—hotwire anemometry underpredicting reversed flow—the DDES-VTM-SST result, which aligns just above the experimental data, emerges as the most physically reliable benchmark. This underscores the superior fidelity of scale-resolving simulations in predicting complex separated flows.
3.3. Turbulence Physics Mechanism
While the analysis in Section 3.2 successfully validated the predictive improvement of the helicity-corrected model, it naturally prompts a deeper investigation into the underlying physical mechanism. This section, therefore, shifts the focus from the macroscopic validation to a diagnostic analysis of the turbulence kinetics. The objective is to explore why the standard SST model fails, and how the helicity correction rectifies this error, using the high-fidelity DDES-VTM-SST results as a benchmark.
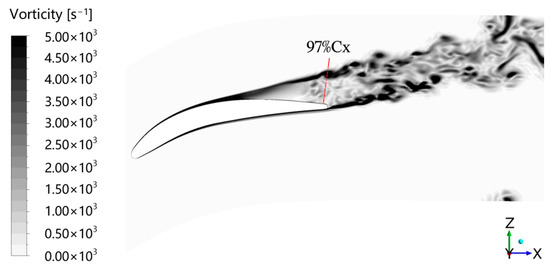
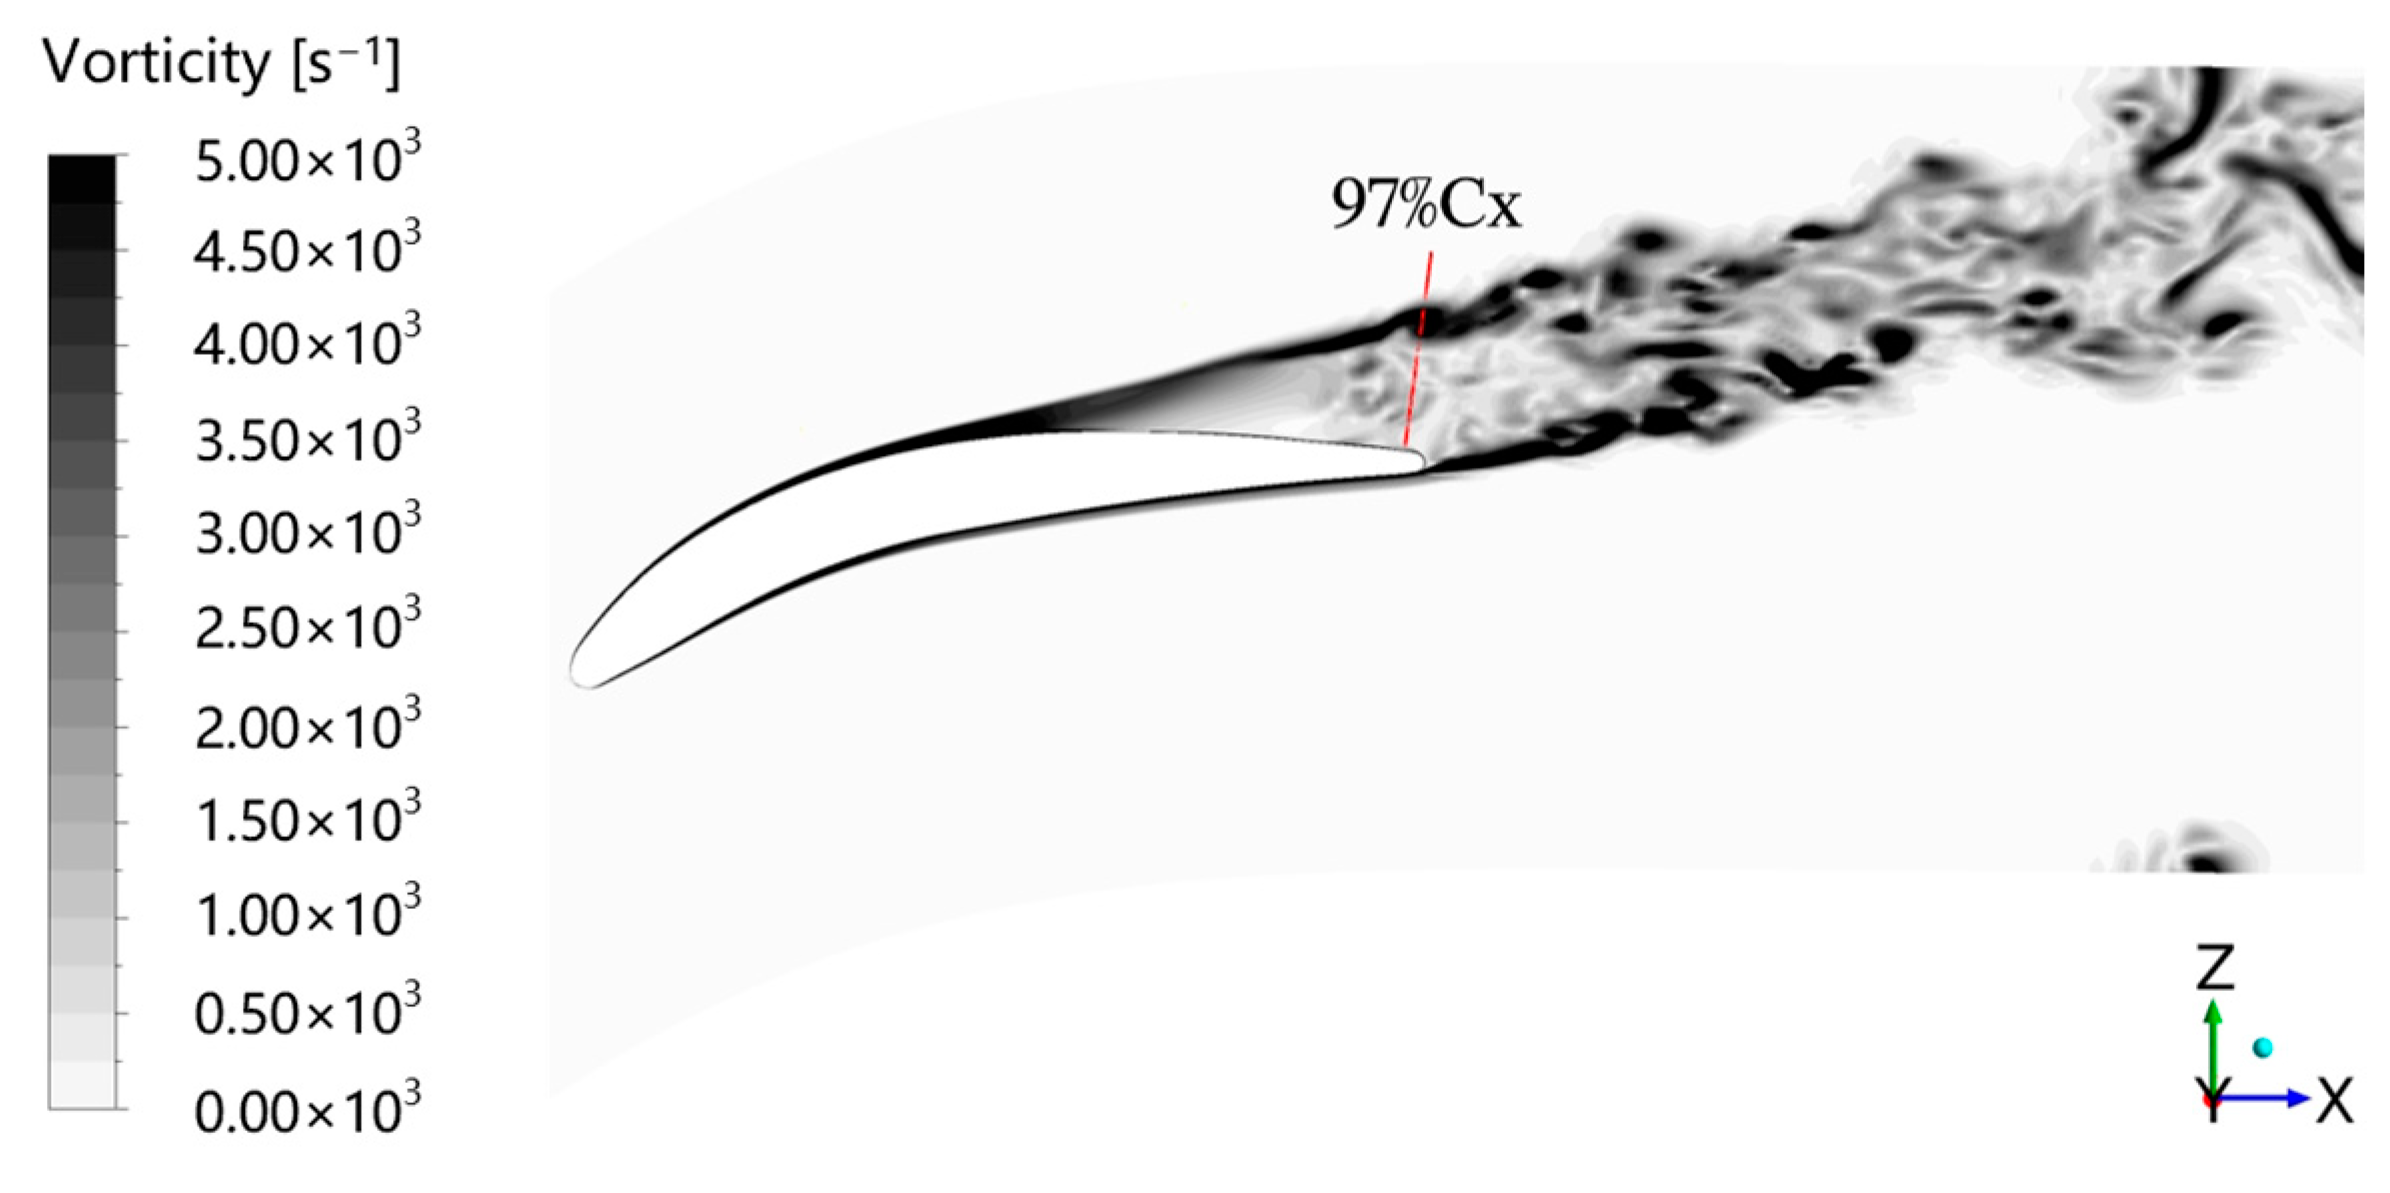
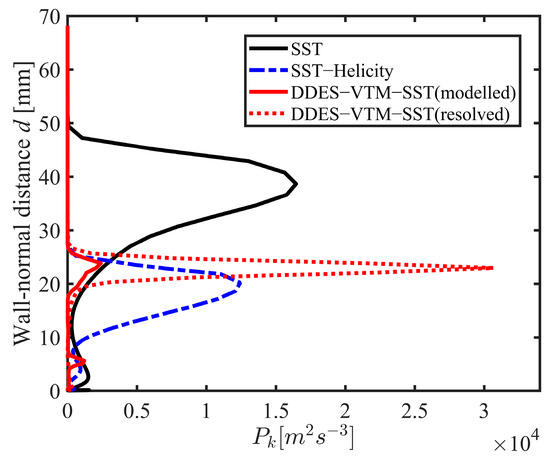
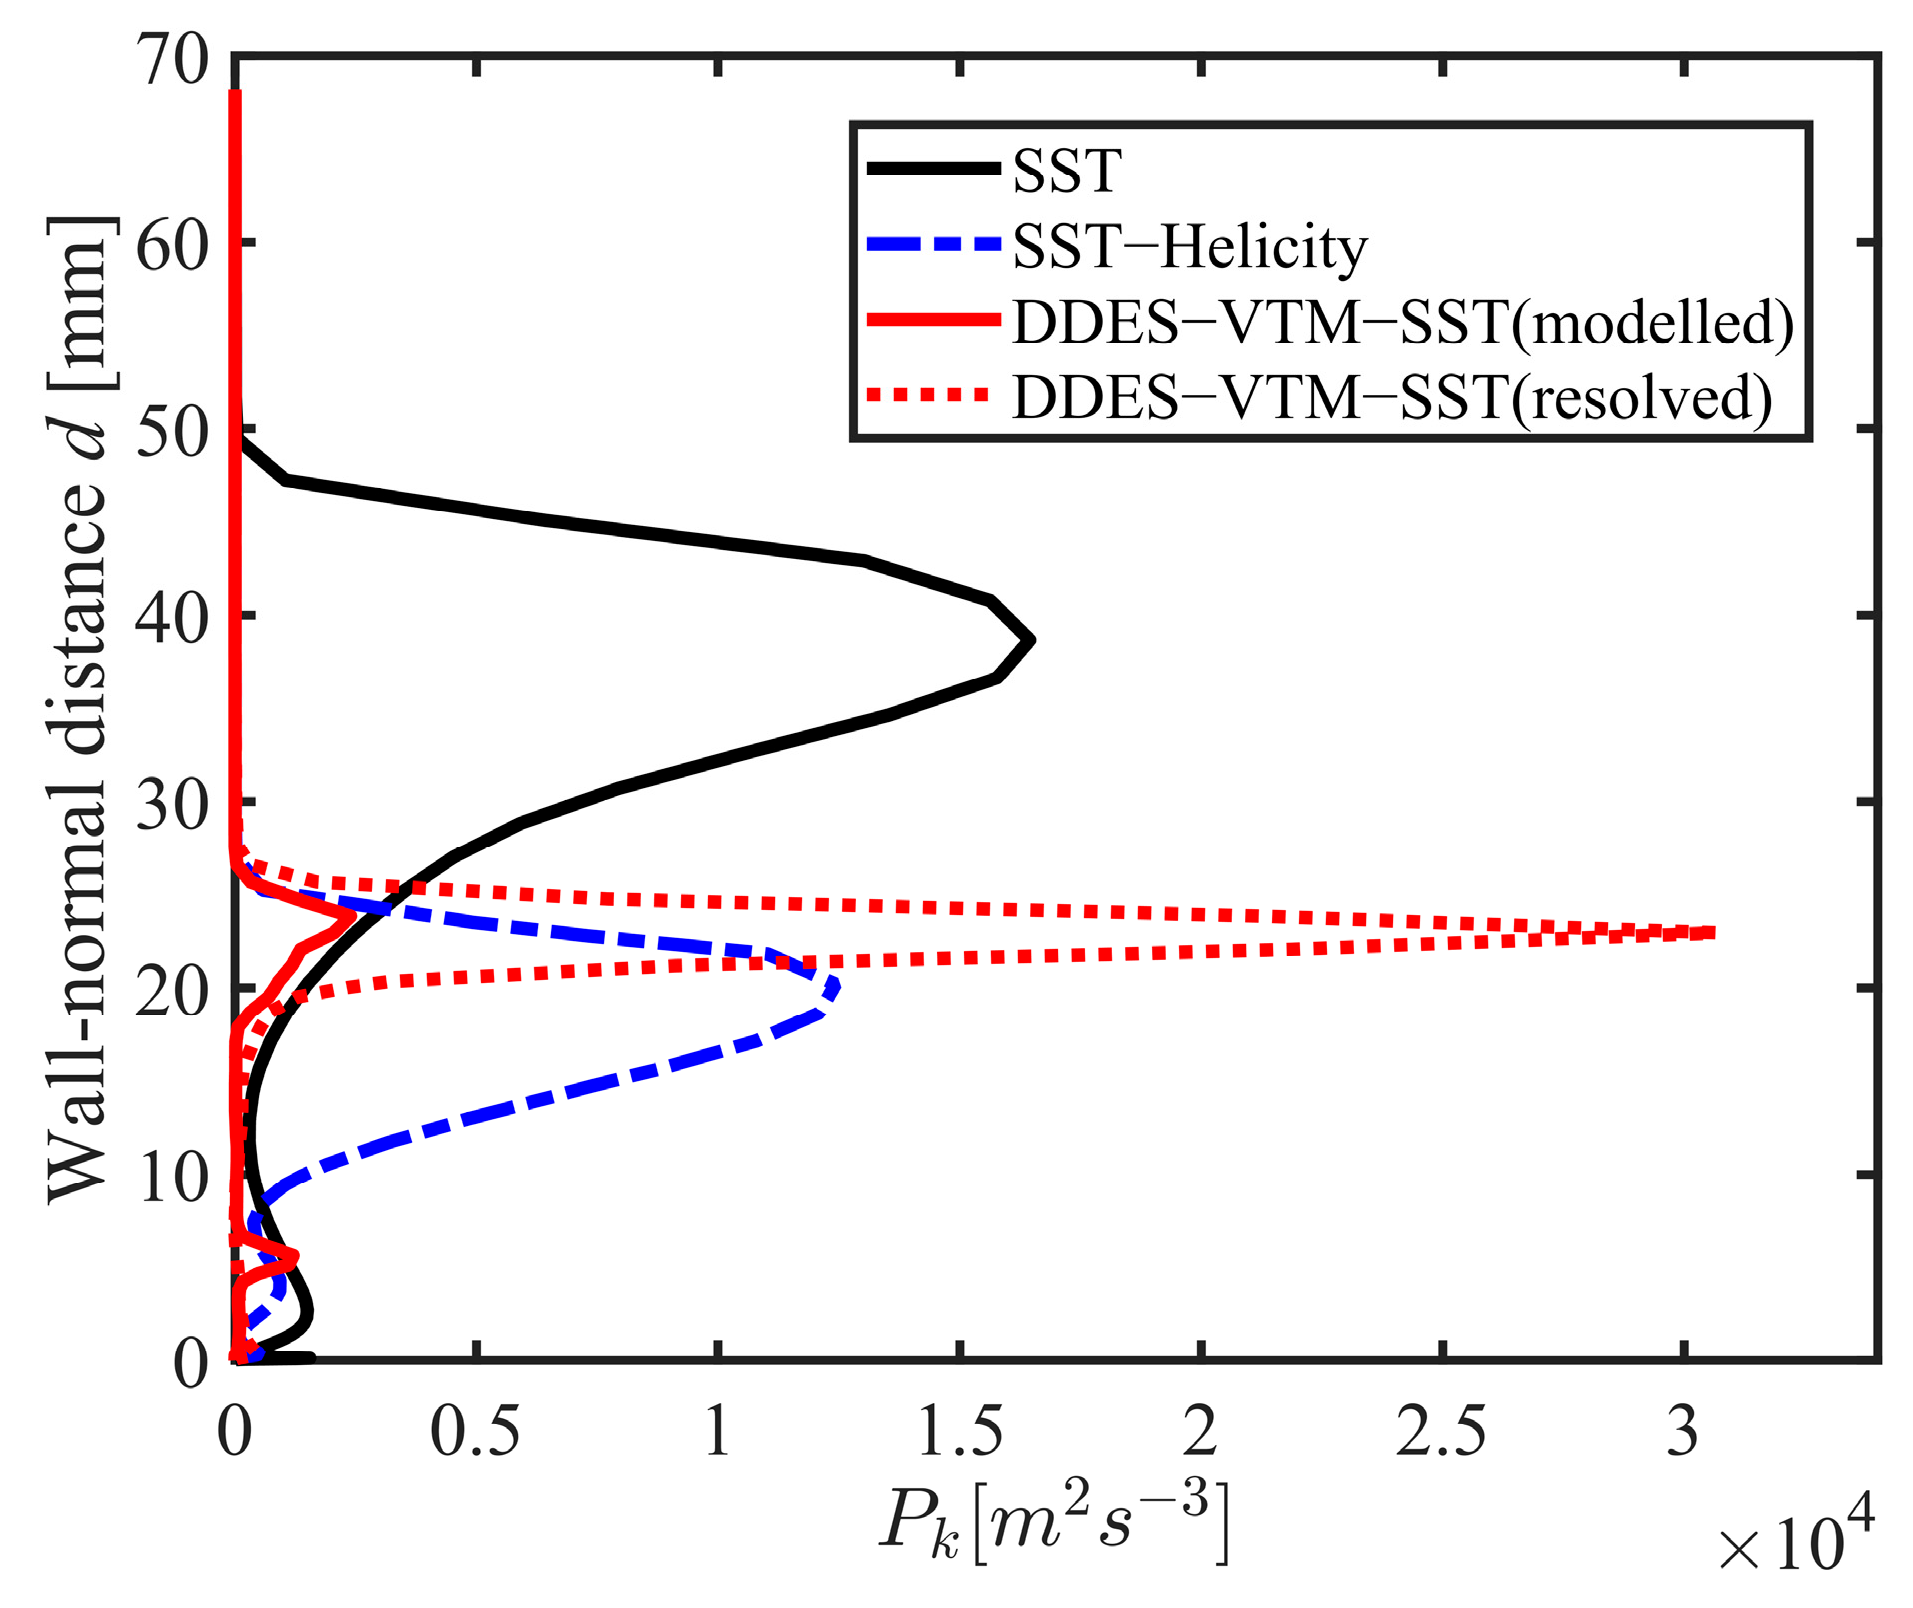
To uncover the physical mechanisms behind the improved predictions, the analysis focuses on the TKE production within the corner separation region. The investigation was conducted along a blade surface-normal cut line (see in Figure 6), the location of which is critical, as it passes through a zone of intense shear and rotational flow—a direct driver of turbulence generation. Figure 7 shows the distribution of TKE production () for the SST, SST-Helicity, and DDES-VTM-SST along the cut line shown in Figure 6. The TKE production of DDES-VTM-SST comprises two components: the modelled production, calculated analogously to a pure RANS or subgrid-scale model; and the resolved production, arising from the explicitly resolved turbulent scales shown in Figure 6. The modelled TKE production is given by the expression:
where denotes TKE production arising from the modelled component of the DDES simulation, and is the modelled eddy viscosity obtained from the DDES-VTM-SST transport equations. The resolved TKE production, , is defined by the scalar product of the resolved Reynolds stress tensor and resolved mean velocity gradient tensor, expressed as:
Figure 6.
Vorticity magnitude at 11%h (DDES-VTM-SST) with analysis line location (97%).
Figure 7.
Wall-normal profiles of TKE production rate along the analysis line.
The analysis reveals a fundamental flaw in the baseline SST model’s predictive capability: it exhibits an erroneously intense and outward-shifted peak in TKE production at approximately 40 mm from the blade surface. This misplaced concentration of turbulent activity projects the core of turbulent mixing too far into the outer region, creating an artificially thickened shear layer. This mechanistic error directly explains the model’s documented tendency to systematically overpredict the spatial extent of the separation zone in corner flow configurations.
In contrast to the SST model’s performance, the SST-Helicity formulation demonstrates significantly improved physical fidelity. Its TKE production profile aligns remarkably well with the high-fidelity benchmarks, both in terms of distribution shape and magnitude, between the modelled and resolved components of DDES. The helicity function effectively recalibrates the RANS model’s production term by introducing a dynamic modulation mechanism that responds to local flow organization. This helicity-based modulation successfully suppresses the excessive production peak characteristic of the SST model, thereby producing a more physically realistic representation of turbulence kinetics in separated flow regions.
The alignment between SST-Helicity and DDES-VTM-SST results validates the physical basis of the helicity correction. By addressing the core RANS turbulence model’s deficiency—specifically, the position of the TKE production peak at a greater distance to the blade wall—the correction shifts the predictive capability toward scale-resolving accuracy. This mechanistic improvement directly translates to the documented enhancement in macroscopic flow prediction, yielding a more confined and physically accurate representation of the separation zone that consistently outperforms the SST model across validation metrics.
3.4. Extension to Engineering Applications
Building upon the foundational validation in a compressor cascade environment, this study now strategically extends its scope to more complex, industry-relevant aerodynamic configurations. This progression enables assessment of the SST-Helicity model’s robustness and generalizability, while, in the meantime, evaluating its practical engineering utility.
3.4.1. ARA M100 Wing–Fuselage
The ARA M100 wing–fuselage, a canonical test model developed by the UK’s Aircraft Research Association (ARA), serves as a benchmark for studying shock-induced separated flow and 3D turbulence on a realistic geometry. Designed to provide high-quality experimental data, this test case combines a realistic wing–body configuration with challenging transonic flow physics for the validation of CFD codes.
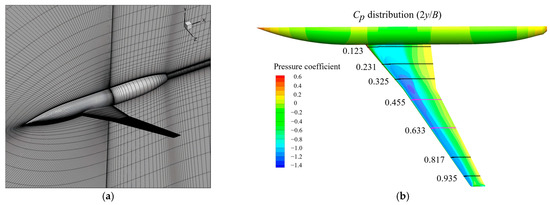
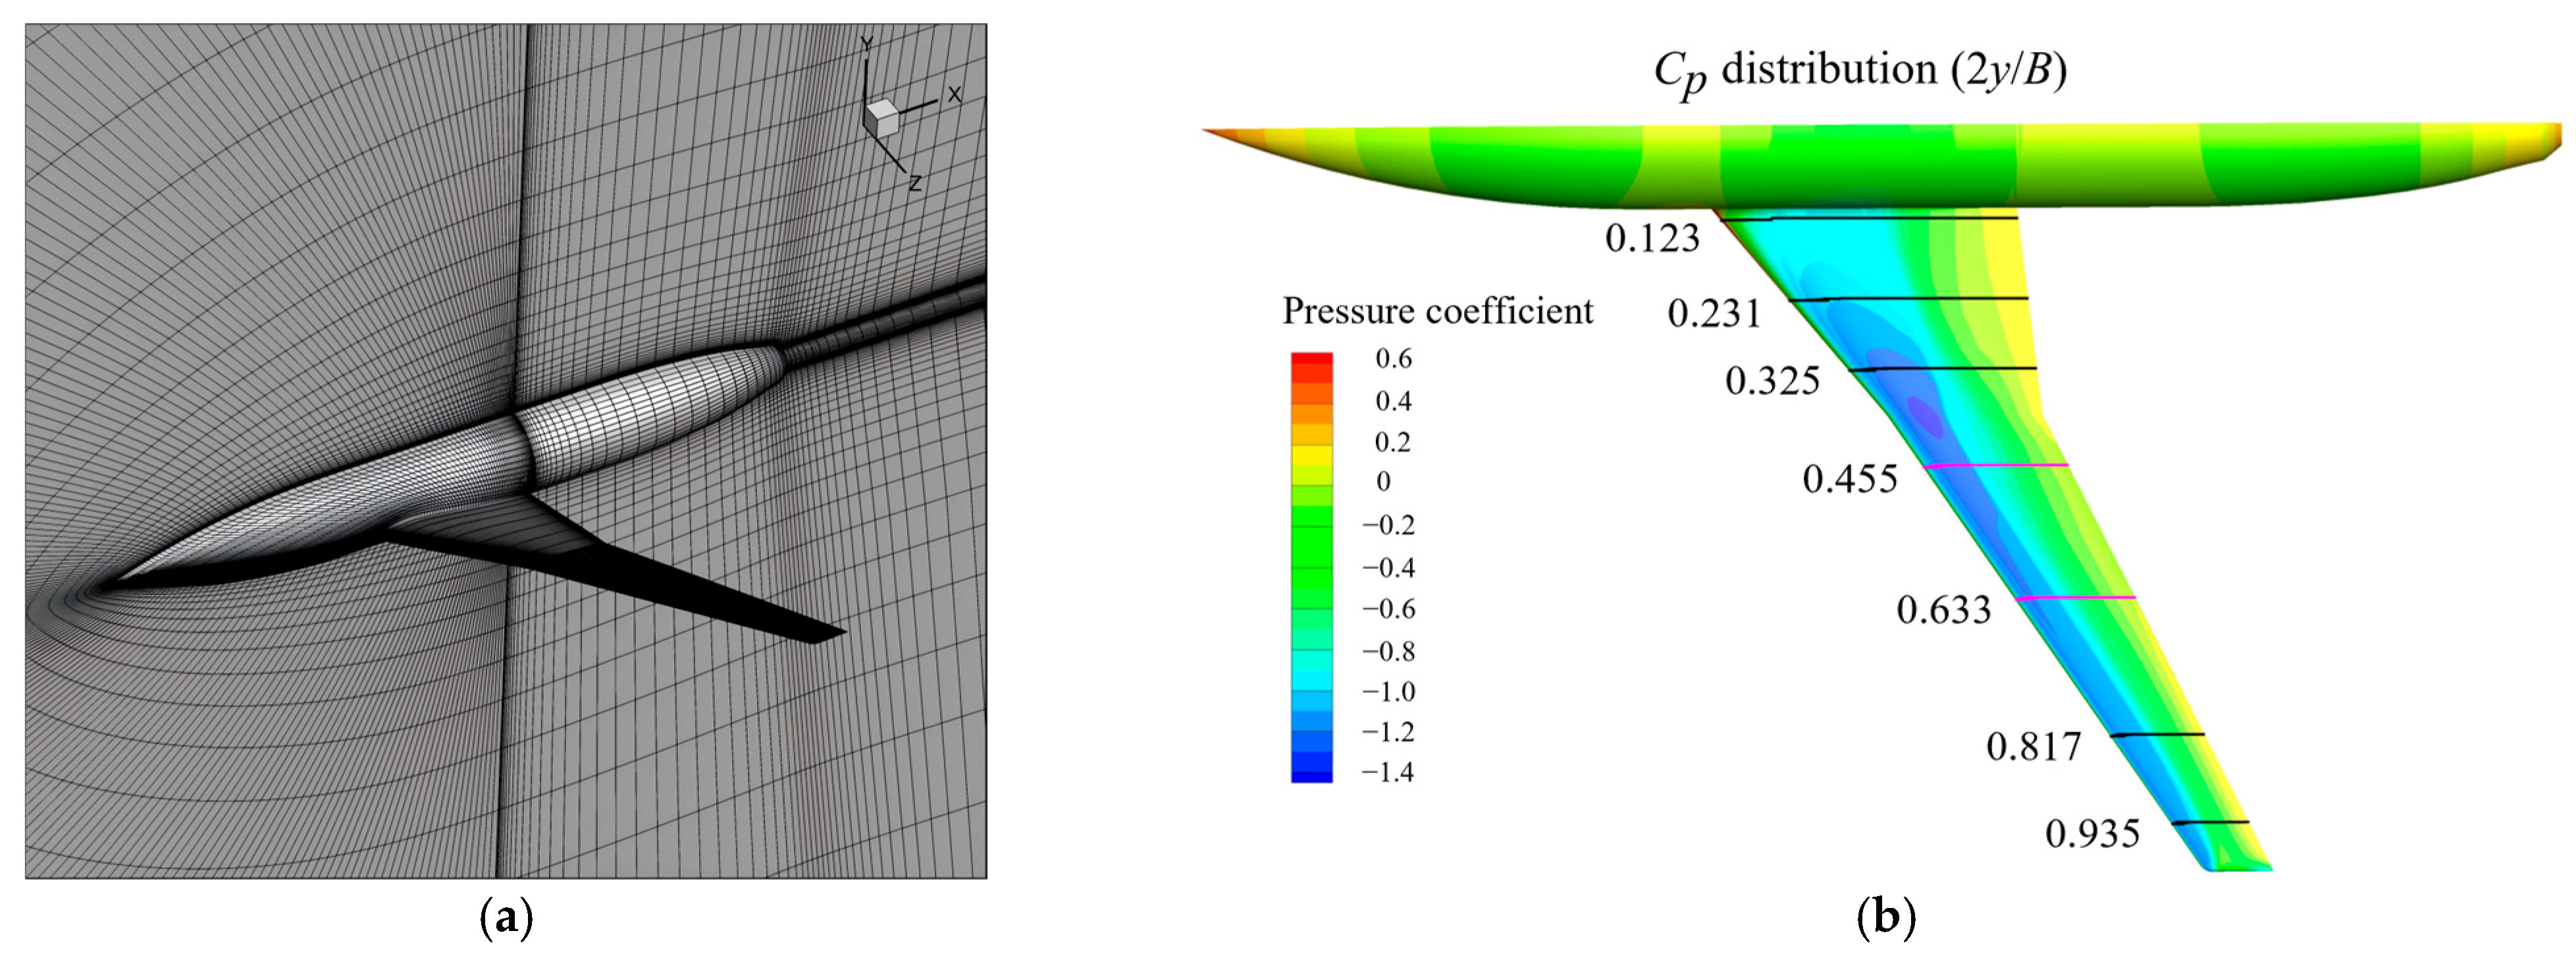
The simulation was conducted at its typical cruise condition, with freestream static temperature of 255.56 K, angle of attack () of , Mach number () of , and unit-length Reynolds number () of . The computational mesh is a structured, multi-block C-O type grid, with dimensions of 321 (streamwise), 57 (wall-normal), and 49 nodes (spanwise). Particular attention was paid to near-wall resolution, with the grid designed to maintain an average non-dimensional wall distance of on the wing and on the fuselage, ensuring adequate resolution of the viscous sublayer for capturing shock/boundary-layer interaction and turbulent separation. The mesh configuration, including the computational domain, boundary conditions, and experimental data, is adopted from the publicly available CFD Version 6 database [21]. The geometry and the surface pressure coefficient () contour are shown in Figure 8, with selected spanwise locations () marked for pressure measurement and analysis.
Figure 8.
Configuration of ARA M100 wing–fuselage: (a) 3D mesh view; (b) pressure coefficient contour.
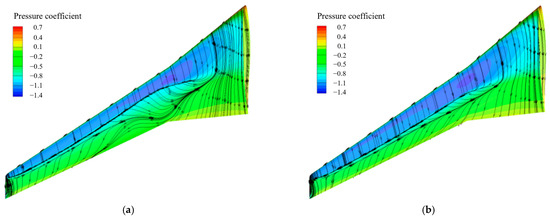
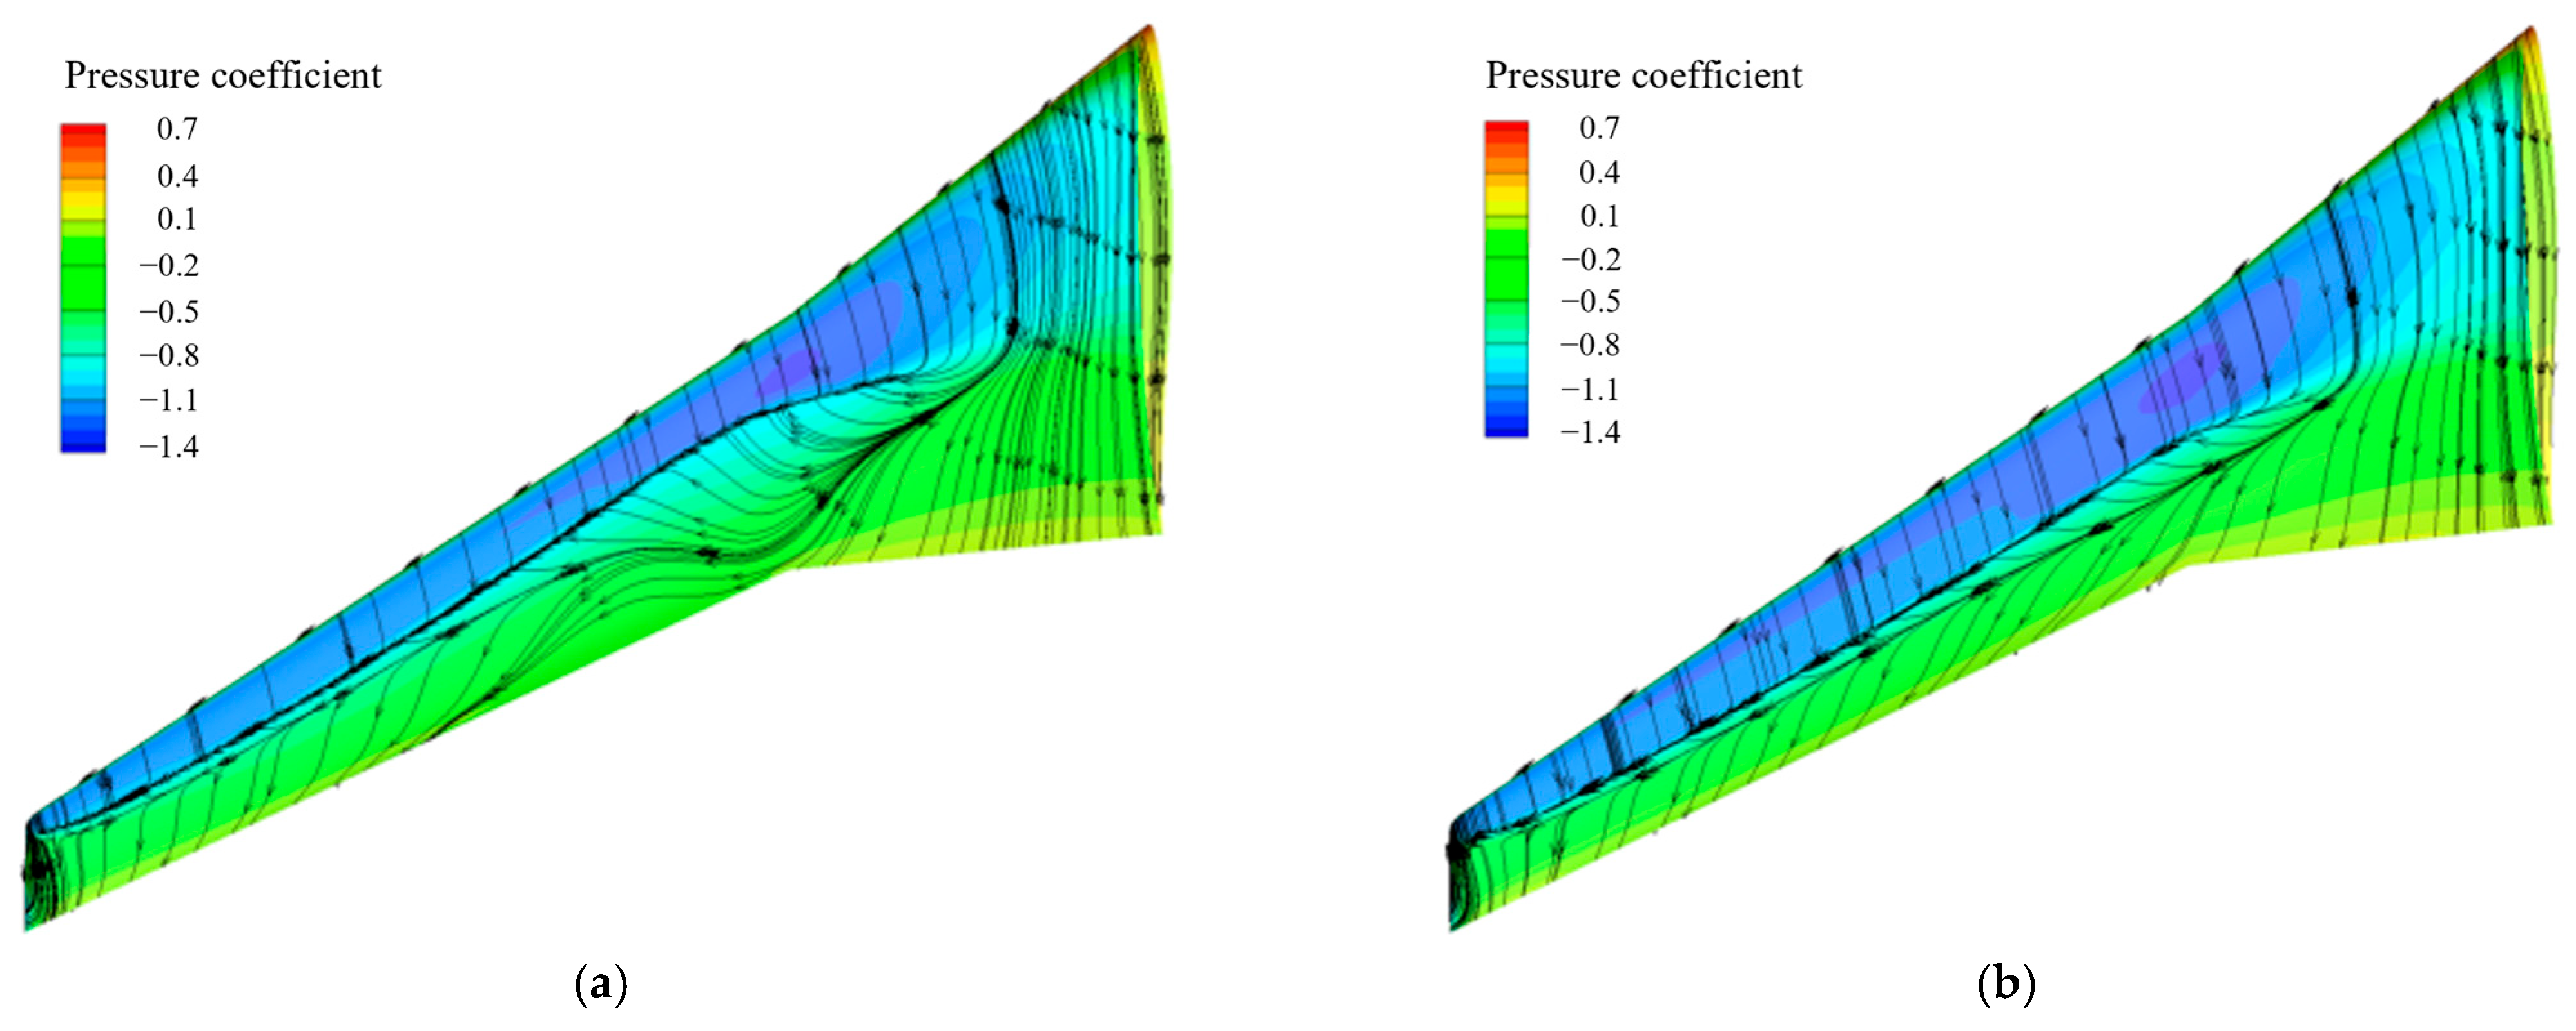
Figure 9 presents a comparative analysis of surface pressure coefficient and streamline patterns on upper wing surface, as predicted by the SST and SST-Helicity models. The SST model predicts extensive flow separation immediately aft of the shock, as indicated by disordered and diverging streamlines, resulting in a large 3D recirculation zone that signifies considerable aerodynamic loss. In stark contrast, the SST-Helicity model predicts a markedly more stable and attached flow. The recirculation region is noticeably reduced, and the pressure recovery appears more coherent, indicating a significantly stabilized boundary layer.
Figure 9.
Comparison of surface pressure and streamline patterns: (a) SST; (b) SST-Helicity.
This substantial improvement originates from the helicity correction inherent to the SST-Helicity model. Unlike the standard model, which relies on an equilibrium boundary-layer assumption, the helicity correction accounts for energy backscatter within separation region under adverse pressure gradients. This yields a more physically consistent representation of energy cascade, mitigating excessive dissipation, and enables the boundary layer to retain more momentum. As a result, the model’s refined physical basis allows it to correctly capture the flow’s inherent resistance to separation, effectively representing the stabilizing influence of complex vortical structures.
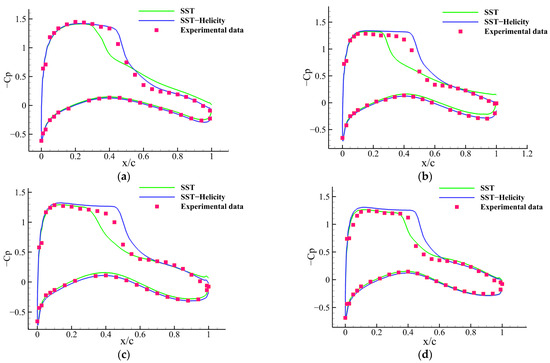
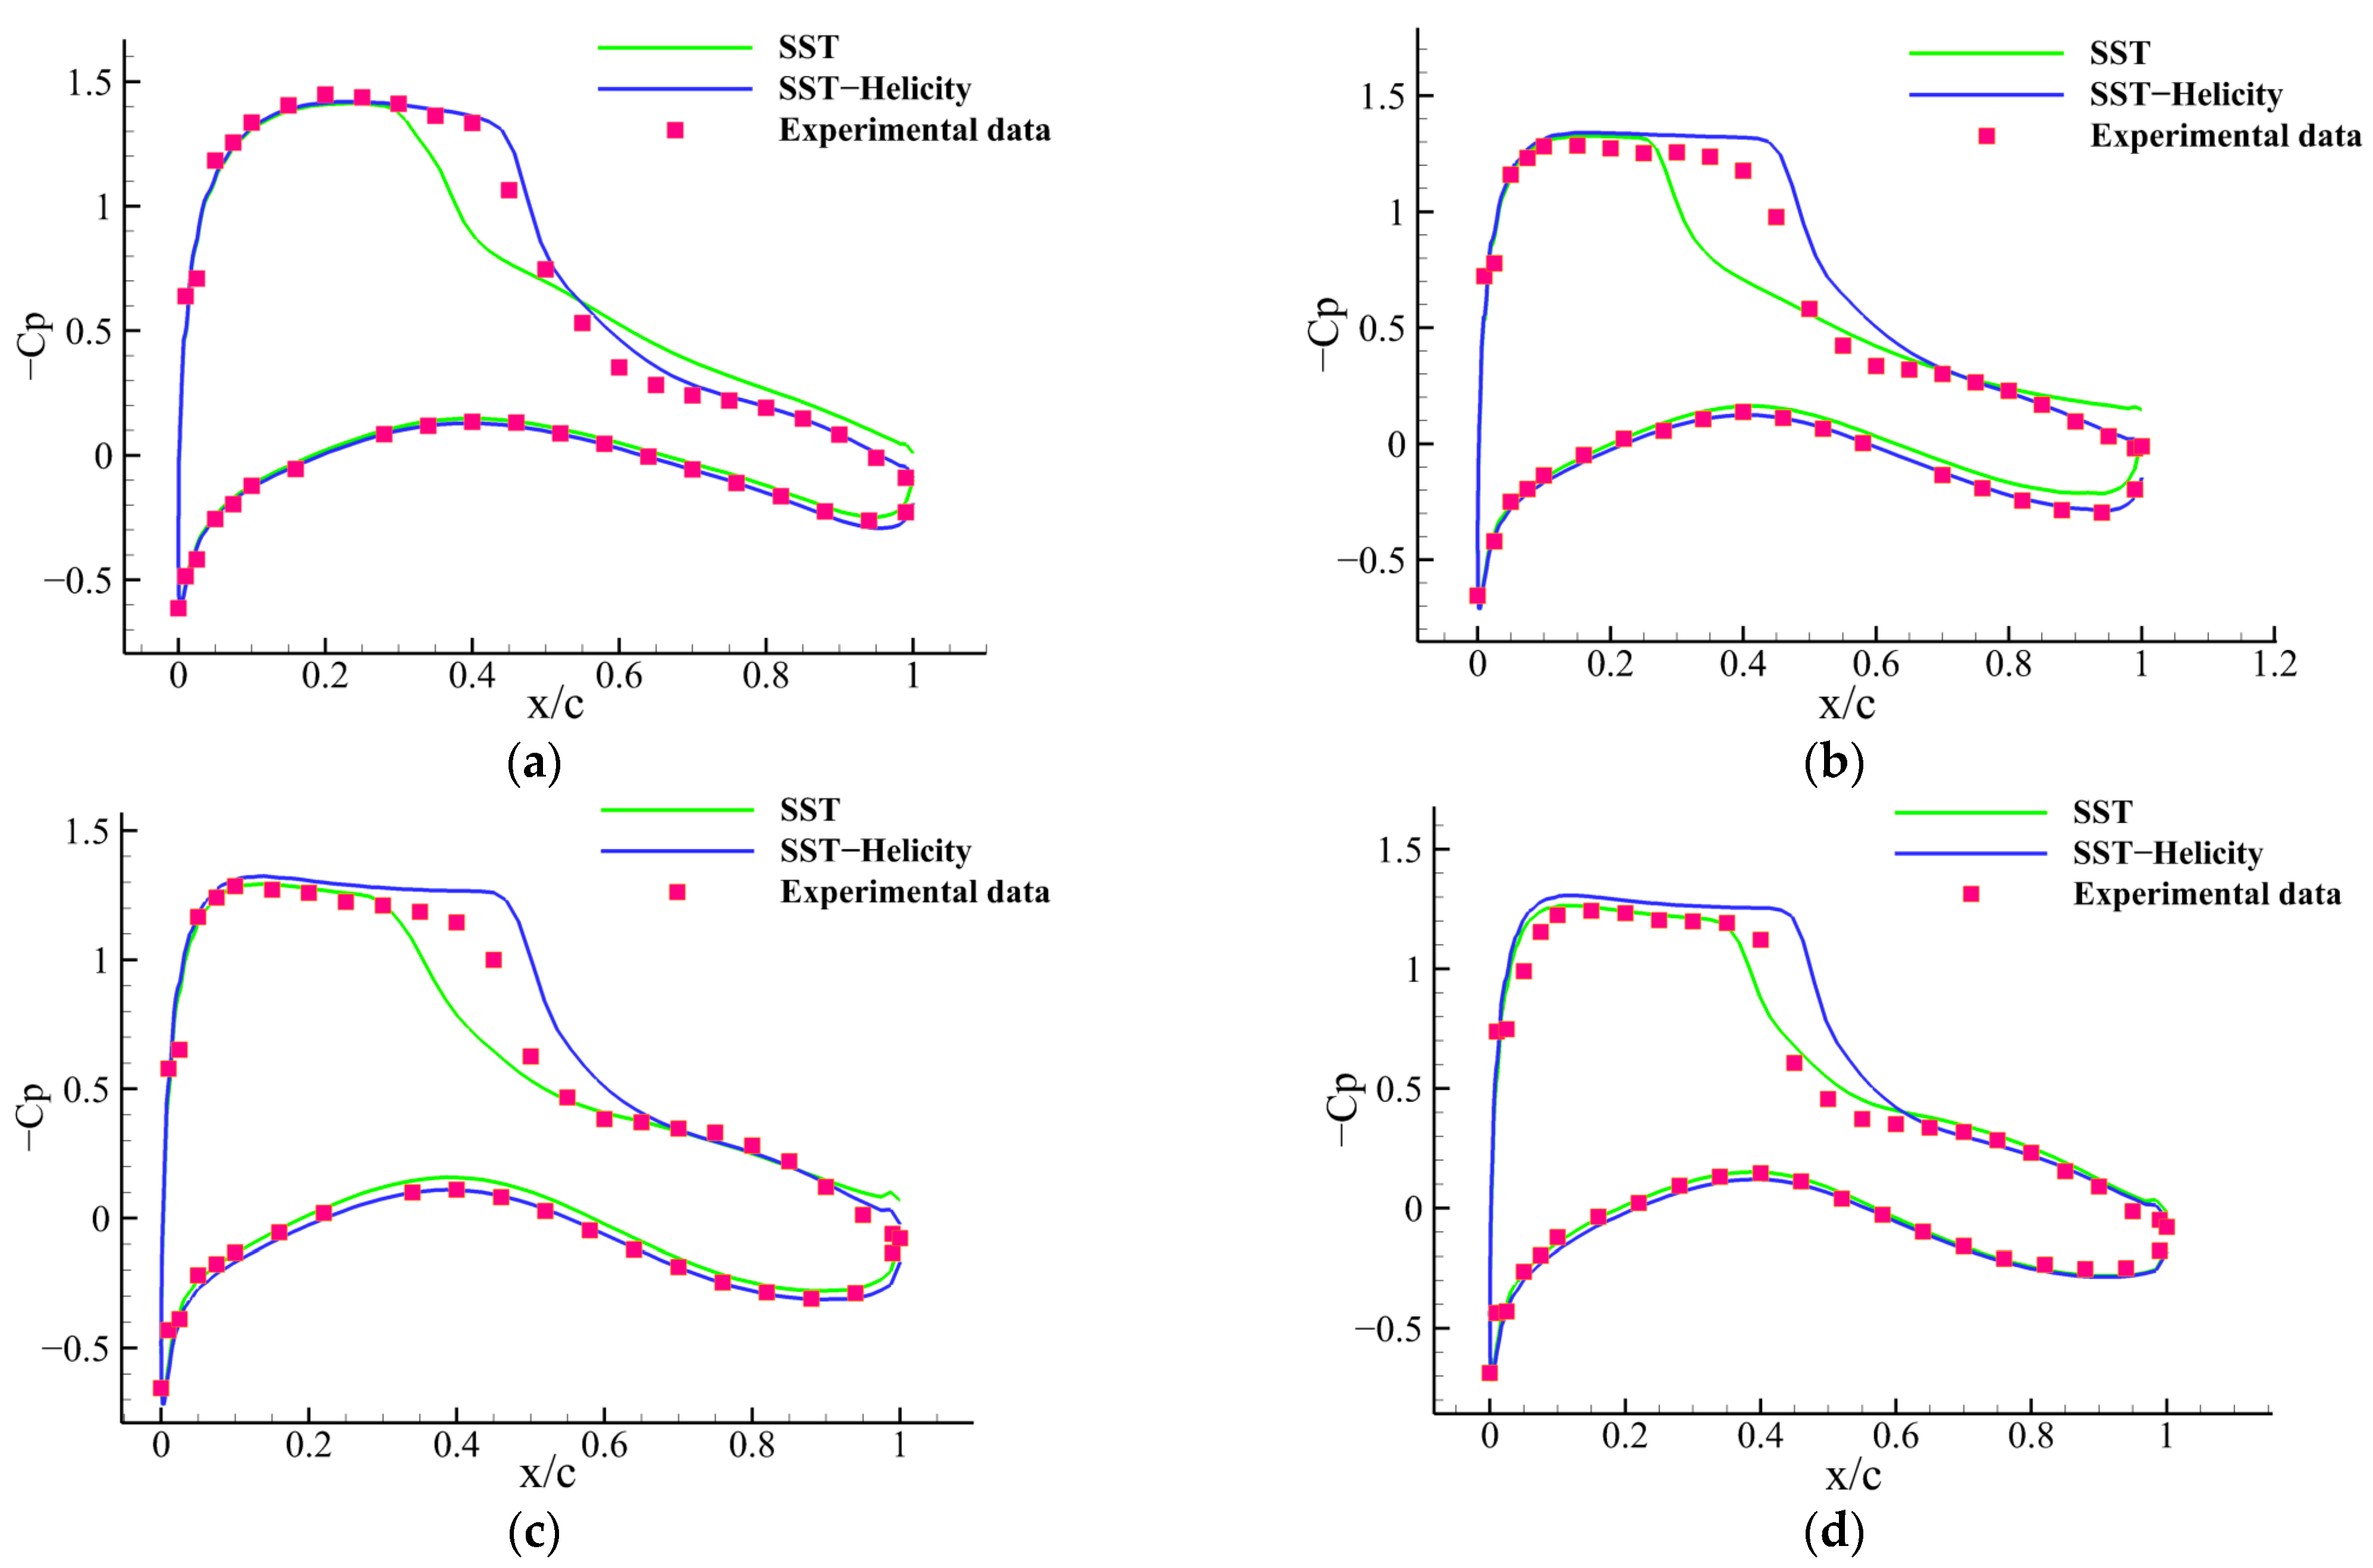
The comparison of surface pressure distributions in Figure 10 validates the superior predictive accuracy of SST-Helicity for shock-dominated transonic flow. A clear divergence is evident at inboard stations (), which are most affected by separation bubble (see in Figure 9). Here, the SST model shows a significant deviation from the experimental data: it predicts a premature shock and a less pronounced pressure recovery aft of the shock, indicating an overprediction of flow separation and an inaccurate representation of the shock/boundary-layer interaction. In contrast, the SST-Helicity model’s prediction aligns remarkably well with the experimental profile across the entire chord, accurately capturing both the shock location and the subsequent pressure rise. This close agreement, particularly in the critical post-shock recovery region, provides direct quantitative evidence that helicity correction enables a more physical simulation of the turbulent stresses under strong adverse pressure gradients. By better accounting for the turbulence energy backscattering effects in 3D separation region, the helicity correction mitigates excessive turbulence dissipation and, thus, enhances turbulence production, leading to a correct prediction of boundary-layer momentum retention and a substantial improvement in modelling the complex separated flows.
Figure 10.
Comparison of surface pressure coefficient distributions at four spanwise stations: (a) ; (b) ; (c) ; and (d)
3.4.2. DLR-F6-WB Configuration
The DLR-F6-WB transport aircraft configuration, a canonical benchmark for CFD validation, features an unfaired wing–fuselage junction. Its geometry generates strong 3D interference and induces challenging flow separation. Leveraging this configuration and its associated wind-tunnel data [22], this study specially assesses the impact of helicity correction on the predictive accuracy of key aerodynamic performance parameters. The freestream conditions for the simulation were set to a static temperature of 274.3 K, a Mach number () of 0.75, and a unit-length Reynolds number () of . The angle of attack () varied between −3° and 4.3° to span the aerodynamic range.
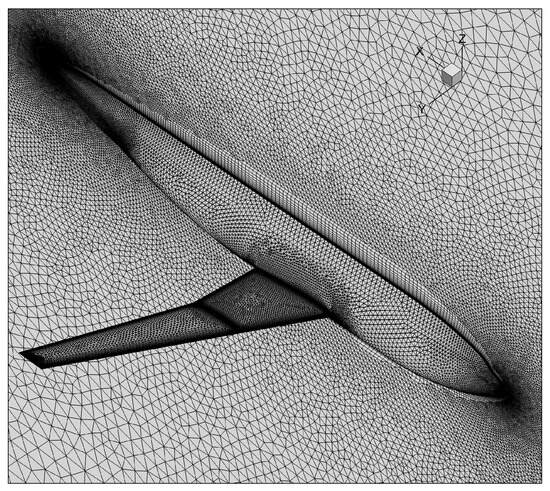
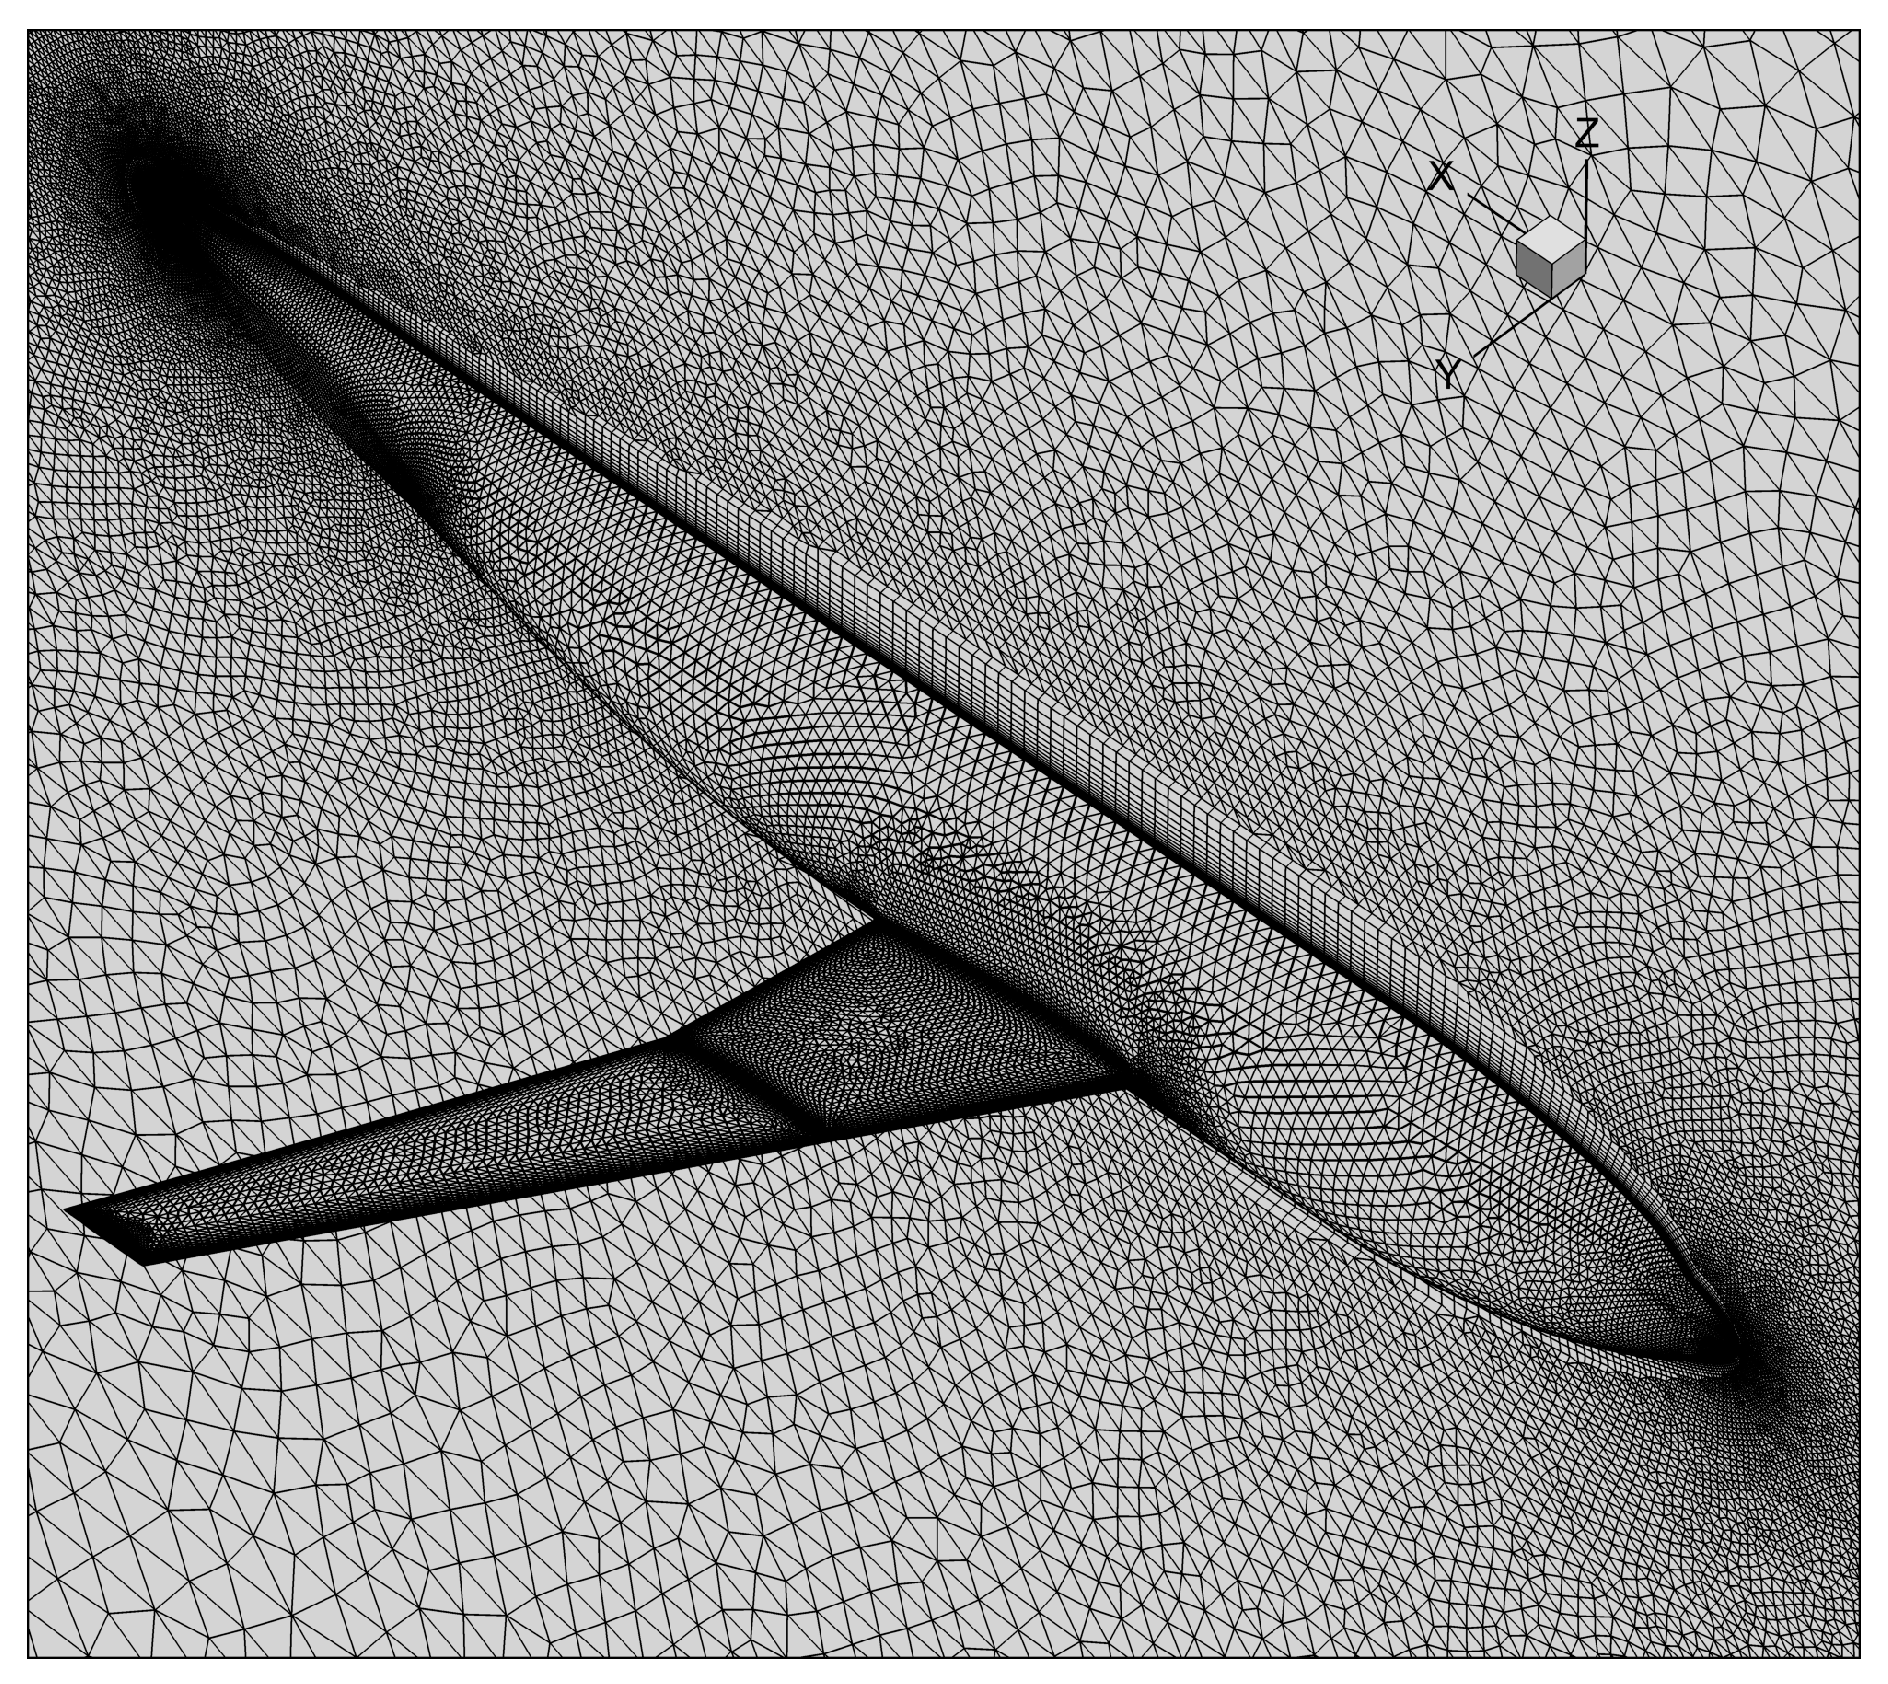
The computational grid for the DLR-F6 wing–body configuration is a medium-sized, single-block, unstructured hybrid mesh consisting of pyramidal, tetrahedral, and prismatic elements, with a total of 6.65 million cells. This mesh was selected based on grid independence study results demonstrated in the 2nd AIAA Drag Prediction Workshop (DPW) [25]. The aerodynamic lift and drag coefficient curves exhibit changes of less than 1% between the medium mesh (6.65 million cells) and fine mesh (10.31 million cells), confirming that the chosen grid provides results independent of further grid refinement. The mesh was generated using Pointwise grid generation software. Particular attention was paid to near-wall resolution: the height of the first grid layer was set to m, designed to maintain an average non-dimensional wall distance of on both the wing and fuselage surfaces, thereby ensuring adequate resolution of the viscous sublayer for the accurate capture of flow separation. The mesh configuration, including the computational domain, boundary conditions, and corresponding experimental data, follows the setup from the publicly available 2nd AIAA DPW.
Figure 11 illustrates the DLR-F6 wing–body configuration, with the corresponding surface-fitted unstructured mesh presented and refined in regions of anticipated high-flow gradients. A half-model simulation was employed to reduce the computational cost. The outer boundary was set as the pressure far-field condition, while a viscous, no-slip wall condition was imposed on the aircraft surface.
Figure 11.
DLR-F6 configuration.
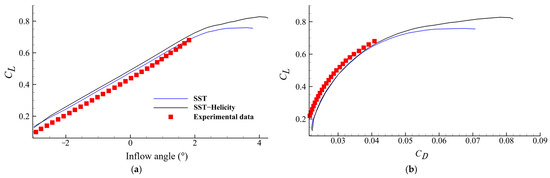
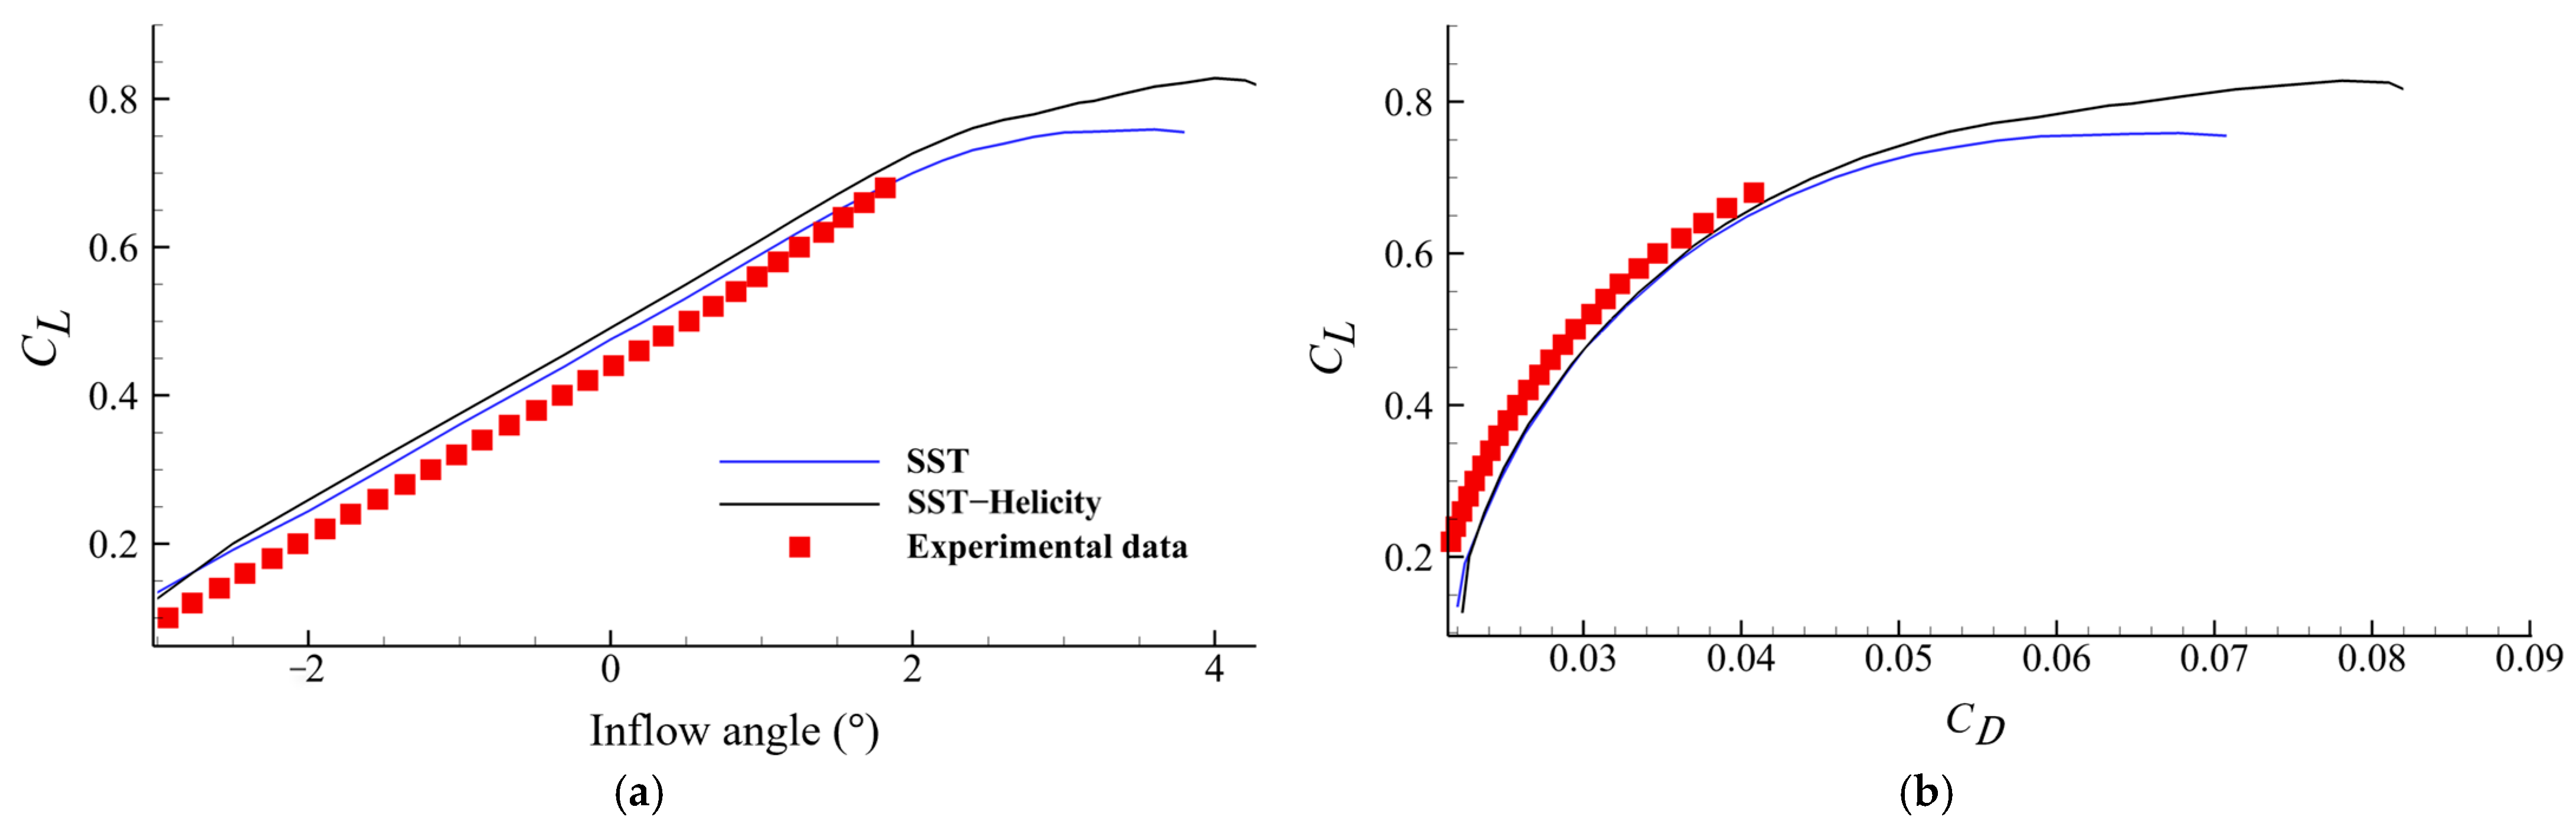
Figure 12 presents the aerodynamic characteristics of DLR-F6 configuration, comparing the predictive accuracy of the SST and the SST-Helicity models against experimental data. Based on the comparison provided, the advantage of the SST-Helicity model, while not quite dramatic, is evident and consistent across both performance metrics. In Figure 12a, a meticulous observation confirms that the SST-Helicity line aligns more closely with the trend of the experimental data across most of the angle-of-attack range, suggesting an improvement in accuracy for lift prediction. Combined with the results from the ARA M100 case, where the helicity-based correction effectively suppressed shock-induced excessive flow separation at positive angles of attack, it is reasonable to expect that a similar beneficial effect—namely, the suppression of over-predicted separation and a consequent delay in stall—would also be observed in the DLR-F6 configuration. This anticipated improvement is corroborated by the comparative results presented in Figure 12.
Figure 12.
DLR-F6 aerodynamic characteristics: (a) CL vs. angle of attack; (b) lift–drag polar.
The more pronounced advantage is visible in the lift–drag polar (Figure 12b). Here, while both models follow the experimental trend, the SST-Helicity curve demonstrates a superior fit in the critical mid-to-high-lift coefficient region (CL > 0.6). Its trajectory more accurately tracks the envelope formed by the experimental data points, especially near the maximum lift. This closer alignment suggests that the helicity correction provides a more physically accurate representation of the flow development, related to capturing inverse energy cascade in 3D separation region. Consequently, for predicting integrated aerodynamic performance, particularly near high-lift conditions, the SST-Helicity model offers a verifiable enhancement in accuracy over the SST model in this test case.
4. Conclusions and Future Work
4.1. Conclusions
This study has developed, validated, and demonstrated a physics-informed helicity correction for the SST turbulence model. The main conclusions are as follows:
- (1)
- A DDES-guided enhancement framework was established. A high-fidelity DDES database was established for a linear compressor cascade, which directly informed the integration of a normalized helicity parameter into the Menter’s SST model, resulting in the novel SST-Helicity model.
- (2)
- The correction mechanism is physically grounded. The helicity-based term dynamically modulates turbulence kinetic energy production, effectively countering the SST model’s tendency to produce an erroneously intense and misplaced peak in TKE production in separation zones. This yields a more realistic representation of turbulence kinetics in complex, vortical flows.
- (3)
- Validation in internal flow shows significant improvement. For a compressor cascade, the SST-Helicity model significantly improved the prediction of corner separation, suppressing the SST model’s unphysical over-prediction. Results for blade surface pressure and flow blockage showed close agreement with experimental data and DDES benchmark data.
- (4)
- Validation in external aerodynamics consolidates robustness. For the ARA M100 wing–fuselage model, the SST-Helicity model accurately captured shock location and post-shock pressure recovery, rectifying the SST model’s over-prediction of shock-induced separation. For the DLR-F6 aircraft, it consistently improved the prediction of aerodynamic coefficients, delivering a lift–drag polar and lift curve in closer agreement with experimental data, especially near high-lift conditions.
- (5)
- The model offers practical engineering utility. The SST-Helicity model provides a viable strategy for enhancing RANS-based design workflows. It maintains computational efficiency while substantially improving predictive fidelity for complex separated flows, making it suitable for parametric studies and optimization in aeronautics.
4.2. Future Work
Building on the validated SST-Helicity model, the next step is to integrate it into aerodynamic design systems. This will involve validating the model for complex industrial applications—such as full aircraft at high incidence and multi-stage compressor—to strengthen its robustness and generalizability. Meanwhile, the physics-guided correction can be combined with the data-driven machine learning. High-fidelity databases like the DDES-VTM-SST benchmark can be used to develop adaptive, self-calibrating model coefficients tailored to specific regimes, improving predictive accuracy across a wider flight envelope. This shift towards hybrid physics-informed/data-driven modelling will significantly advance RANS-based simulation capabilities, providing a powerful tool for predicting complex separated flows in the design of next-generation high-efficiency aeronautical systems.
Author Contributions
Conceptualization, W.S. and Z.Y.; methodology, W.S. and B.X.; software, W.S., F.F. and Z.Y.; validation, W.S., B.X. and Z.Y.; formal analysis, W.S. and B.X.; investigation, H.Y. and B.X.; resources, H.Y.; data curation, W.S., Z.Y. and F.F.; writing—original draft preparation, W.S. and Z.Y.; writing—review and editing, H.Y., B.X., W.S., Z.Y. and F.F.; visualization, W.S. and Z.Y.; supervision, H.Y. and B.X.; project administration, H.Y. All authors have read and agreed to the published version of the manuscript.
Funding
This research received no external funding.
Data Availability Statement
The raw data supporting the conclusions of this article will be made available by the corresponding author on request.
Acknowledgments
The authors would like to thank Ashley Scillitoe for providing the PVD compressor cascade for this study.
Conflicts of Interest
Authors Wei Sun, Haijin Yan and Bangmeng Xue were employed by the company COMAC. The remaining authors declare that the research was conducted in the absence of any commercial or financial relationships that could be construed as a potential conflict of interest.
References
- Rizzi, A.; Luckring, J.M. Historical development and use of CFD for separated flow simulations relevant to military aircraft. Aerosp. Sci. Technol. 2021, 117, 106940. [Google Scholar] [CrossRef] [Scilit]
- Babister, A.W. Aircraft longitudinal motion at high incidence. Aeronaut. J. 1979, 83, 230–232. [Google Scholar] [CrossRef] [Scilit]
- Hah, C.; Loellbach, J. Development of hub corner stall and its influence on the performance of axial compressor blade rows. J. Turbomach. 1999, 121, 67–77. [Google Scholar] [CrossRef] [Scilit]
- Xue, B.M.; Zhang, W.S.; Zhang, Z.X. Multi-objective wing optimization of civil aircrafts in engine-aircraft integration configuration. Acta Aerodyn. Sin. 2018, 36, 941–948. [Google Scholar]
- Spalart, P.; Allmaras, S. A one-equation turbulence model for aerodynamic flows. In Proceedings of the 30th AIAA Aerospace Sciences Meeting and Exhibit, Reno, NV, USA, 6–9 January 1992. [Google Scholar]
- Menter, F.R.; Kuntz, M.; Langtry, R. Ten years of industrial experience with the SST turbulence model. Heat Mass Transf. 2003, 4, 625–632. [Google Scholar]
- Spalart, P. Strategies for turbulence modelling and simulation. Int. J. Heat Fluid Fl. 2000, 21, 252–263. [Google Scholar] [CrossRef] [Scilit]
- Mani, M.; Babcock, D.; Winkler, C.; Spalart, P. Predictions of a supersonic turbulent flow in a square duct. In Proceedings of the 51st AIAA Aerospace Sciences Meeting Including the New Horizons Forum and Aerospace Exposition, Grapevine, TX, USA, 7–10 January 2013. [Google Scholar]
- Liu, Y.W.; Yan, H.; Liu, Y.J.; Lu, L.P.; Li, Q.S. Numerical study of corner separation in a linear compressor cascade using various turbulence model. Chin. J. Aeronaut. 2016, 29, 639–652. [Google Scholar] [CrossRef] [Scilit]
- Li, W.H.; Liu, Y.W. Numerical investigation of corner separation flow using Spalart-Allmaras model with various modifications. Aerosp. Sci. Technol. 2022, 127, 107682. [Google Scholar] [CrossRef] [Scilit]
- Sun, W. Assessment of advanced RANS turbulence models for prediction of complex flows in compressors. Chin. J. Aeronaut. 2023, 36, 162–177. [Google Scholar] [CrossRef] [Scilit]
- Liu, Y.W.; Lu, L.P.; Fang, L.; Gao, F. Modification of Spalart–Allmaras model with consideration of turbulence energy backscatter using velocity helicity. Phys. Lett. A 2011, 375, 2377–2381. [Google Scholar] [CrossRef] [Scilit]
- Sun, W. Non-equilibrium turbulence modelling for compressor corner separation flows. In Proceedings of the ASME Turbo Expo 2021: Turbomachinery Technical Conference and Exposition, Online, 7–11 June 2021. [Google Scholar]
- Duraisamy, K.; Iaccarino, G.; Xiao, H. Turbulence modeling in the age of data. Annu. Rev. Fluid Mech. 2019, 51, 357–377. [Google Scholar] [CrossRef] [Scilit]
- Wang, J.X.; Wu, J.L.; Xiao, H. Physics-informed machine learning approach for reconstructing Reynolds stress modeling discrepancies based on DNS data. Phys. Rev. Fluids 2017, 2, 034603. [Google Scholar] [CrossRef] [Scilit]
- Yang, W.C.; Zhao, L.; Liu, Y.K.; He, H.; Deng, E. Dynamic characteristics of overhead electrification catenary support structure in high-speed railway tunnel under train slipstream: A FSI simulation study. J. Wind Eng. Ind. Aerod. 2026, 270, 106355. [Google Scholar] [CrossRef] [Scilit]
- Zhao, L.; Deng, E.; Yang, W.C.; Ni, Y.Q.; Zhao, W.; Luo, L.S. Unraveling the impact of cutting transition section on the aerodynamic loads of high-speed trains: Utilizing the IDDES approach. J. Cent. South Univ. 2024, 31, 989–1002. [Google Scholar] [CrossRef] [Scilit]
- Liu, Y.K.; Deng, E.; Yang, W.C.; Wang, Y.W.; He, X.H.; Huang, Y.M.; Zou, Y.F. Nonlinear aerodynamic effects of three new types of high speed railway acoustic insulation facilities using a model experiment and IDDES. Nonlinear Dyn. 2023, 111, 17819–17841. [Google Scholar] [CrossRef] [Scilit]
- Tang, Y.M.; Liu, Y.W. VR helicity density and its application in turbomachinery tip leakage flows. Chin. J. Aeronaut. 2022, 35, 1–17. [Google Scholar] [CrossRef] [Scilit]
- Shur, M.L.; Spalart, P.R.; Strelets, M.K.; Travin, A.K. An enhanced version of DES with rapid transition from RANS to LES in separated flows. Flow Turbul. Combust. 2015, 95, 709–737. [Google Scholar] [CrossRef] [Scilit]
- CFL3D Version 6.7 Homepage. Available online: https://nasa.github.io/CFL3D/Cfl3dv6/cfl3dv6_home.html (accessed on 12 August 2022).
- Rudnik, R.; Sitzmann, M.; Godard, J.L.; Lebrun, F. Experimental investigation of the wing-body juncture flow on the DLR-F6 configuration in the ONERA S2MA facility. In Proceedings of the 27th AIAA Applied Aerodynamics Conference, San Antonio, TX, USA, 22–25 June 2009. [Google Scholar]
- Menter, F.R. Best Practice: Scale-Resolving Simulations in Ansys CFD, 2nd ed.; Ansys Germany GmbH: Darmstadt, Germany, 2015. [Google Scholar]
- Gbadebo, S.A.; Cumpsty, N.A.; Hynes, T.P. Three-dimensional separations in axial compressors. J. Turbomach. 2005, 127, 331–339. [Google Scholar] [CrossRef] [Scilit]
- 2nd AIAA CFD Drag Prediction Workshop Homepage. Available online: https://www.aiaa-dpw.org/Workshop2/workshop2.html (accessed on 22 October 2003).
Disclaimer/Publisher’s Note: The statements, opinions and data contained in all publications are solely those of the individual author(s) and contributor(s) and not of MDPI and/or the editor(s). MDPI and/or the editor(s) disclaim responsibility for any injury to people or property resulting from any ideas, methods, instructions or products referred to in the content. |
© 2026 by the authors. Licensee MDPI, Basel, Switzerland. This article is an open access article distributed under the terms and conditions of the Creative Commons Attribution (CC BY) license.