


Abstract
Region-specific skin appendage phenotypes enable animals to meet diverse environmental and functional demands, yet the molecular basis of this specialization remains incompletely understood. Feathers vary markedly in size and shape across the avian body. Here, we investigate the relationship between regional feather phenotypes and morphogen signaling using bulk RNA sequencing, single-cell transcriptomics, spatial expression mapping, and in vivo functional perturbation. Adult chicken feathers from the scalp, neck, back, breast, forelimb, hindlimb, and tail each exhibit distinct morphogen signatures involving Wnt–Frizzled, FGF, IGF, and BMP pathway members. Elongated flight and sickle feathers shared an IGF-associated signature but differed in Wnt- and FGF-associated profiles, suggesting that similar phenotypes can arise through partially distinct molecular programs. Spatial mapping revealed region-specific Frizzled receptor expression within the proximal flight feather follicle. RCAS-mediated misexpression demonstrated that Wnt–Frizzled signaling is required for adult flight feather follicle regeneration and morphogenesis. Perturbation of individual Frizzled family members differentially affected flight feather follicle organization, cell survival, and feather filament elongation. Together, these findings show that region-specific feather phenotypes arise from combinations of core morphogen signaling modules that are differentially tuned by individual pathway components, providing a framework for understanding how a shared developmental toolkit generates diverse and convergent skin appendage phenotypes.
Keywords:
morphogenesis; regeneration; development; regional specificity; morphogen; Wnt/Frizzled; BMP; FGF; IGF; Evo-Devo 1. Introduction
Organisms rely on regional integument specification for optimal adaptation to the environment [1,2,3], although every cell shares an identical genetic blueprint. How developing tissues use the same genome differently in specific regions to produce structurally diverse, yet sometimes convergently similar appendages remains a fundamental question in developmental biology.
The avian integument provides an ideal model to investigate this spatial regulation. Across the avian body axis, feathers exhibit striking morphological diversity in size and shape to support specialized functions, ranging from flight to thermoregulation. This evolutionary plasticity is well-documented in the fossil record, which captures the transition from the simple filamentous structures of early theropods, such as Sinosauropteryx, to the highly complex, branched feathers of modern birds [4,5,6]. While the emergence of the feather follicle represents a pivotal evolutionary innovation, feather diversity across different body regions arose through modifications of a shared developmental program [7,8,9,10,11,12].
The integument of modern birds displays morphological diversity organized in a hierarchical manner with macroscopic and microscopic integumental regional specificities. At the macroscopic level, spatial regulation generates different appendage types, such as feathers, scales, beaks, and combs. Studies have elucidated the signaling networks dictating the developmental choice between scales and feathers, particularly on the avian foot [13,14,15,16,17,18]. Using Polish chickens, we investigated the genetic and epigenetic mechanisms that determine fate specification of the comb versus feathers of the crown integument. We found that the distinctive crest phenotype characterized by elongated cranial feathers is caused by a 195-bp intron duplication in HOXC10 [19]. More recently, we demonstrated that region-specific epigenetic topographies govern higher-order organization of the HOXC cluster that drives different downstream targets to produce the crest phenotype [20].
At the microscopic level, a single class of skin appendage can show diverse morphologies based on variations in size, shape, and/or density that can form across the body. Regional differences in appendage phenotypes can be seen in human facial hairs (long scalp hairs versus short vellus facial hairs), lion manes versus body hairs, etc., or on diverse avian beak shapes [21]. Laboratory mice exhibit regional specificity that enables broader spatial regulation and regional specification [22,23,24,25]. Spatial signaling defines broad macro-boundaries as seen in the Wnt-dependent segregation of hairless and hair-bearing skin [26]. However, while localized stem cell populations encode region-specific molecular signatures, their four principal hair types (guard, awl, auchene, and zigzag) are not clearly segregated into anatomically distinct appendage regions or tracts. On the other hand, avian models offer complex plumages whose region-specific phenotypes show a growth gradient from the head to the tail. This arrangement makes them an excellent model to investigate spatial regulation and incremental morphological diversification across the body [27]. Thus, the chicken model offers opportunities to study both macroscopic [13,20] and microscopic integumental regional specification [7,21]. Here we further analyze the regulation of regional-specific feather phenotypes.
In adult feather follicles, cyclic regeneration is driven by interactions between dermal papilla cells and epithelial stem cell populations within the proximal follicular niche [4,10,28,29,30]. This process demonstrates robust positional identity, reliably yielding region-specific morphotypes [4]. For example, plucked head follicles invariably regenerate short head feathers, while wing follicles regenerate long, asymmetrical flight feathers. Despite this structural variation, the initiation and growth of all feathers depend on deeply conserved signaling networks, notably the Wingless/Integrated (Wnt), Bone Morphogenetic Protein (BMP), Fibroblast Growth Factor (FGF), and Insulin-like Growth Factor (IGF) pathways [7,28,31,32,33,34,35,36]. How these core pathways are tuned to generate region-specific phenotypes remains poorly understood.
Our long-term objective is to understand the mechanisms underlying regional feather specification. Feathers from different body regions exhibit diverse phenotypic characteristics, including differences in length, branching pattern, barb rigidity, and other structural features. In the present study, we mapped morphogen expression profiles across different body regions of White Leghorn chickens and correlated them with regional differences in feather length. Using a combination of transcriptomic analyses and spatial expression mapping, we found that distinct body regions exhibit localized, region-specific combinations of WNT, BMP, IGF, and FGF signaling components. We then perturbed specific Frizzled (FZD) receptors using RCAS-mediated in vivo gene misexpression to further investigate their roles in regulating region-specific feather growth. Our results show that perturbing individual FZD receptors affects flight feather follicle organization, cell proliferation, apoptosis, and feather filament elongation.
2. Materials and Methods
2.1. Ethics Statement
All animals used in this study were processed following a protocol approved by the Institutional Animal Care and Use Committee (IACUC) of the University of Southern California (Protocol No. 11903; approved 22 July 2024).
2.2. Chickens
White Leghorn chickens were hatched from pathogen-free fertilized eggs (SPAFAS, Preston, CT, USA). Chickens were raised at 22 °C with 12-h cycles of light and darkness. Eight-month-old male chickens were used in this study. Two chickens were used for bulk RNA-seq and twelve chickens were used for functional studies.
2.3. Tissue Collection and Immunostaining
For adult feather studies, mature feathers from anatomically defined body tracts—specifically the Head, Neck, Anterior Back (AB), Posterior Back (PB), Breast, Thigh, Wing (flight feathers), and Tail (including lesser sickle and main sickle feathers)—were carefully plucked to induce feather regeneration. Regenerated feather follicles, including dermal papilla were subsequently harvested after 3 weeks of regeneration. Immediately upon collection, Feather follicles were fixed in 4% paraformaldehyde at 4 °C overnight, and 7 μm longitudinal paraffin sections were prepared. Hematoxylin and Eosin (H&E) and immunostaining were followed by procedures previously described by [30]. We used the following antibodies: PCNA (Millipore, Billerica, MA, USA; MAB4078; 1:200), AMV-3C2 (Developmental Studies Hybridoma Bank, Iowa City, IA, USA; 1:10). Anti-mouse Alexa Fluor 488 (Invitrogen, Carlsbad, CA, USA; A11029; 1:200) or anti-mouse Alexa Fluor 546 (Invitrogen, A11030; 1:200) were used as the secondary antibody. DAPI was used to visualize nuclei.
2.4. In Situ Hybridization (ISH)
To generate RNA probes, PCR was performed using cDNA from embryonic day 8 chicken skin. PCR primers were: FZD1 (forward, CAACAACGTGGATGCTCTGC; backward, AACCCCCAAGTCTGTCCCAA); FZD5 (forward, ATGGGCGGCCGGGGGC; backward, GGTGAAGTAGGGCTGGTAGCAGGG). PCR products were inserted into p-drive (Qiagen, Venlo, The Netherlands) to make antisense RNA probes. Whole-mount and section in situ hybridizations were performed according to procedures described in [13]. Diluted eosin (2%) was used for faint counter-staining.
2.5. RNAscope Analysis
RNAScope was performed using the Multiplex Fluorescent v2 system (Advanced Cell Diagnostics [ACD], Newark, CA, USA; 323100). The standard RNAScope protocol was used according to the manufacturer’s instructions. We used the following probes: LGR6 (Cat No. 1097781-C3), SOSTDC1 (Cat No. 1055361-C2), FZD4 (Cat No. 1593551-C2), and FZD8 (Cat No. 1055381-C3) (Figures S1 and S2).
2.6. Bulk RNA-Sequencing and Transcriptomic Analysis
Three-week-old regenerated feather follicles from 9 different regions (including dermal papilla) were dissected, and the bottom 0.5 cm was used for RNA extraction. Two biological replicates were collected from each region, with each replicate derived from a different chicken. For RNA extraction, one feather follicle was used per region per bird, except for the head region, where four feather follicles from the same bird were pooled to obtain sufficient RNA due to their small size. Total RNA was isolated using Trizol (Thermo Fisher Scientific, Carlsbad, CA, USA; 15596026). The RNA quantities and quality were analyzed using a NanoDrop (Thermo Fisher Scientific) and 2100 Bioanalyzer (Agilent Technologies, Santa Clara, CA, USA). A poly-A enrichment + optimized NEB Ultra II directional kit was used to generate an RNA-seq library, which was sequenced using NovaSeq 6000 PE150 by Novogene Corporation Inc. (Sacramento, CA, USA).
The original data from five feather regions were from the Gene Expression Omnibus (GEO) (accession number GSE247782). These regions include the head, neck, anterior back, posterior back, and main sickle feathers, corresponding to samples GSM7900712–GSM7900721 [20]. Raw data from four additional feather regions—lesser sickle, flight, thigh, and breast—have been deposited in GEO under accession number GSE341183.
2.7. Bulk RNA-Seq: Read Count Normalization and DEG Identification
Bulk RNA-seq data were analyzed using Partek Flow (Partek Inc., St. Louis, MO, USA). Sequencing reads were trimmed and aligned to the chicken reference genome Gallus gallus GRCg6a (galGal6) using STAR and the corresponding Ensembl release 103 genome annotation. Gene-level read counts and transcripts per million (TPM) values were generated from the aligned reads. Genes with a mean TPM > 1 across libraries were considered expressed. Read counts were normalized, and differential expression analysis was performed using DESeq2 [37].
Differential expression analysis was performed using DESeq2 with the design formula “~ condition”, where “condition” represents the feather-region groups that are compared. Two chickens were used as biological replicates, labeled “1” and “2”, respectively, and each contributed samples from the same feather regions. Animal identity was recorded in the sample metadata but was not included as a separate factor in the model. Differential expression contrasts were performed between feather regions, with log2 fold changes calculated relative to the corresponding reference group.
The expressed genes were defined as DEGs when their log2 fold change > 1 and adjusted p-value < 0.05 between the comparisons. DEGs and their normalized log-transformed values were calculated by DESeq2 and used as the input for the following analysis. The hierarchical clusters and heatmaps were generated from the merged DEGs by the R package ‘pheatmap’. Principal component analysis (PCA) was performed on regularized log-transformed (rlog) count data utilizing the plotPCA function within the DESeq2 R package, and dataset intersections were visualized as UpSet plots using the ggVennDiagram package.
2.8. scRNA-Seq Analysis
scRNA-seq metadata is from [7]. We used one anterior back contour feather and one lesser sickle feather, representing short and long feathers, respectively, to analyze possible communications among cell clusters using CellChat (version 2.2.0) [38]. This enabled us to identify and compare potential differences in the strength and patterns of intercellular communication between these two feather types. These candidates will be further evaluated with expression data and functional analyses. All parameters for the CellChat analysis were set to their default value. We focused on source-target interactions, which will help us understand which groups of cells in the feather follicle are sending signals to each other, and ligand–receptor interaction analysis to see exactly which ligands and receptors are being used in this interaction.
2.9. RCAS Retroviral Production and In Vivo Perturbation
RCAS-dnFZD design was from [39], which removed the ligand-binding domain and part of the 7-transmembrane domain to generate dominant negative function. The PCR product was ligated to an RCAS vector carrying a mCherry fluorescent tracer (RCAS-2A-mCherry). Primers for dnFZD1 are forward, 5′-ACTCTGCTGGCGGCCGCGCCACCctgagcatggccgagcgg-3′; backward, 5′-CTCTGCCCTCACTAGcccgaagtacatgagcccgt-3′. Primers for dnFZD4 are forward, 5′-ACTCTGCTGGCGGCCGCGCCACCgtcccgatgtgcacggag-3′; backward, 5′-CTCTGCCCTCACTAGgctgtagagcccagcgtc-3′ Primers for dnFZD5 are forward, 5′-ACTCTGCTGGCGGCCGCGCCACCatgggcggccgggggc-3′; backward, 5′-CTCTGCCCTCACTAGggtgaagtagggctggtagcaggg-3′. Primers for dnFZD8 are forward, 5′-ACTCTGCTGGCGGCCGCGCCACCatggagtggagctacctgtt-3′; backward, 5′-CTCTGCCCTCACTAGgctgaagtaggggttgtggc-3′.
RCAS viruses were prepared and concentrated by centrifugation at 20,000 rpm for 2 h at 4 °C. For gene misexpression in embryos, RCAS virus (1 × 10⁷ IU/mL, 4 μL) was injected into the left hindlimb bud and amniotic cavity at embryonic day 3 (E3; stage 18). Embryos were harvested at E9. RCAS-GFP was used as the control. Eight biological replicates were collected for each condition.
For gene misexpression in adult chickens, flight feathers from 6-month-old males were plucked, and approximately 100 μL of RCAS virus was injected into the empty feather follicles. Feathers were allowed to regenerate for 4 weeks before collection. At least six feathers were harvested for each condition.
2.10. TUNEL Assays
TUNEL assay was performed using the In Situ Cell Death Detection Kit, Fluorescein (Roche Diagnostics, Mannheim, Germany; 11684795910), according to the manufacturer’s protocol.
2.11. Correlation Analysis
Pearson’s correlation analysis was performed in R using the cor.test() function to assess the strength and significance of the linear association. A linear regression line was fitted using the linear model (lm) method, and the shaded areas in Figure S3A,C represent the 95% confidence intervals around the fitted regression lines. Pearson’s correlation coefficient (r) and the corresponding p value were displayed on each plot. Figures were generated using the ggplot2 package (version 4.0.3) in R (version 4.6.2).
3. Results
3.1. Different Feather Phenotypes Across Body Regions Exhibit Distinct Morphogen Profiles and Modifiable Follicular Architectures
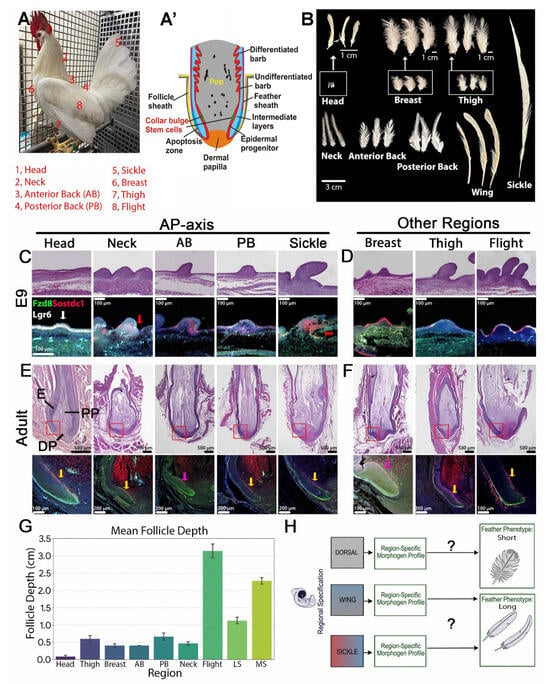
To establish a baseline for morphometric and molecular comparisons, we sampled feathers from eight distinct anatomical regions of the adult male White Leghorn chicken. These included five regions along the anterior–posterior body axis (head, neck, anterior back (AB), posterior back (PB), and tail (lesser sickle (LS) and main sickle (MS)), as well as three appendicular/ventral regions (breast, thigh, and the flight feathers of the wing) (Figure 1A). A growth-phase feather follicle comprises distinct epidermal components (epidermal progenitors, intermediate layers, undifferentiated and differentiated barb cells, apoptosis zone, and the feather sheath), as well as dermal components (dermal papilla and pulp) (Figure 1A’). Macroscopic analysis of feathers from these defined territories demonstrates significant structural variation and differences in absolute length (Figure 1B). Feather length varies systematically across the body axis, ranging from the short contour feathers of the head and breast to the highly elongated flight and sickle feathers, highlighting the precise spatial regulation of skin appendage growth.
Figure 1.
Distinct feather phenotypes exhibit region-specific developmental trajectories and follicular architecture. (A) The White Leghorn chicken displays feather type diversity across different anatomical regions. The numbers indicate the regions from which feathers were collected for analysis: 1. Head, 2. Neck, 3. Anterior Back (AB), 4. Posterior Back (PB), 5. Tail (Silkie), 6. Breast, 7. Thigh, 8. Wing (Flight). (A’) Schematic drawing showing the major epidermal and dermal components in a growth-phase feather follicle. (B) Feathers from these defined regions demonstrate clear differences in structure and length across the body axis. (C,D) Histological analysis of embryonic day 9 (E9) feather buds across sampled tracts along the anterior-to-posterior axis (AP-axis). (C) Head, Neck, Anterior Back, Posterior Back, and Sickle; and other regions. (D) Breast, Thigh, and Flight. Top panels: H&E staining. Bottom panels: RNAscope analysis mapping the spatial expression of key morphogenetic regulators: FZD8 (green), SOSTDC1 (red), and LGR6 (white). Counterstaining with DAPI is shown in blue. White arrow indicates the expression of LGR6 expression in E9 head feather buds. Red arrows indicate the FZD8 expression in the epidermis near the feather bud invagination site. (E,F) Histological analysis of adult regenerating follicles across sampled tracts along the AP-axis (E) and other regions (F). Top panels: H&E staining. Bottom panels: RNAscope analysis. H&E staining shows the follicle structure and the relative size of the collar region. The red boxes indicate the regions analyzed by RNAscope in the lower panels. RNAscope analysis maps the spatial expression of FZD8 (green), SOSTDC1 (red), and LGR6 (white). DAPI counterstain is shown in blue. Yellow arrows indicate strong SOSTDC1 expression, while pink arrows mark weak SOSTDC1 expression. (G) Mean follicle depth (cm) across different anatomical regions. Error bars represent standard deviation. (H) A hierarchical model of regional feather development in which region-specific regulatory states establish local morphogen landscapes that regulate downstream epidermal responses and determine terminal feather length and form. DP, dermal papilla; E, feather epidermis; PP, pulp.
To determine how these macroscopic differences relate to tissue architecture, we characterized embryonic day 9 (E9) feather buds during organogenesis (Figure 1C,D). We also examined adult regenerating follicles across the sampled tracts (Figure 1E,F). E9 feather buds already exhibit region-specific architectural differences, particularly regarding bud elongation. For example, feather buds in the anterior back and thigh are at the long-bud stage, whereas head and neck buds remain at the short-bud stage. Concurrently, flight and sickle feather buds have reached the late long-bud stage and are poised to invaginate to form mature feather follicles [40]. This structural divergence becomes pronounced in adult regenerating follicles. We observed that the depth of follicle invagination strongly correlates with the final length of the respective feather phenotype (Figure 1G and Figure S3A). Elongated flight and sickle feathers possess deeply invaginated follicles that dramatically contrast with the relatively shallow follicles characteristic of short head and breast feathers.
We next investigated whether these physical differences are associated with regional variations in molecular signaling. Using RNAscope analysis, we examined the spatial distribution of key morphogenetic regulators across these tracts, specifically targeting the Wnt receptor FZD8, the Wnt/BMP dual antagonist SOSTDC1, and the epithelial stem cell marker LGR6 (Figure 1C–F, lower panels). Individual fluorescence channels are shown in Figures S1 and S2. At both embryonic and adult stages, these transcripts displayed distinct spatial expression patterns within the epithelial and dermal tissue layers. Notably, the location and boundaries of their expression domains varied among anatomical regions. For example, LGR6 expression was prominently localized to E9 head feather buds (Figure 1C, white arrow), whereas FZD8 expression was localized to the epidermis near the invagination site of neck and sickle feather buds (red arrow). However, the observed expression differences may also reflect developmental stage differences in different anatomical regions.
In adult feathers, FZD8 expression was localized to the epidermal flank, whereas SOSTDC1 was detected in the collar bulge across all regions (Figure 1E,F, yellow arrow). The anterior back and breast feathers showed a more restricted SOSTDC1 spatial distribution (Figure 1E,F, pink arrow). These distinct spatial expression domains suggest that the localized signaling environment is regionally patterned across different feather tracts.
Integrating these morphometric, histological, and molecular observations, we propose a hierarchical model for the regional specification of feather morphogenesis (Figure 1H). Local morphogen signals in the dermal mesenchyme establish region-specific regulatory states and transcription factor expression. These spatially restricted signaling networks subsequently influence the downstream epidermal progenitor cells’ response, driving the growth programs that determine the final feather length and form. Crucially, this model suggests that different body regions can develop similar feather shapes by using different combinations or levels of key signaling molecules.
3.2. Transcriptomic Analyses Reveal Region-Specific Expression Profiles of the Wnt/Frizzled, FGF, IGF, and BMP Signaling Pathways
3.2.1. Bulk RNA-Seq Analysis Reveals Three Distinct Molecular Expression Profiles Across Skin Regions
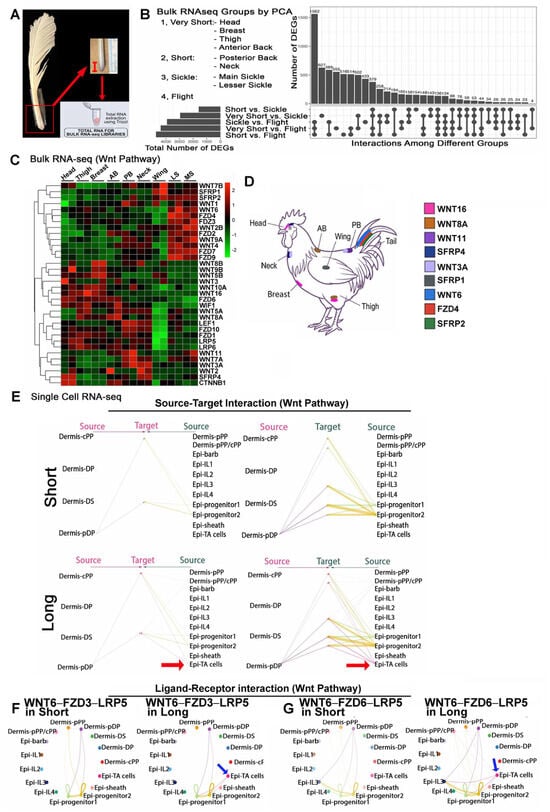
To test our main hypothesis, we systematically profiled the transcriptomic landscape across multiple anatomical tracts. We generated bulk RNA-sequencing data from feather follicles sampled from nine distinct body regions: head, neck, anterior back, posterior back, breast, thigh, wing (flight feathers), lesser sickle, and main sickle (Figure 2A). Two biological replicates were included for each body region.
Figure 2.
Transcriptomic profiling and cellular communication analysis of Wnt signaling networks. (A) Schematic of the bulk RNA-seq sample collection workflow. (B) Upset plot of bulk RNA-seq analysis. Horizontal bars on the bottom left indicate the total number of DEGs for each pairwise comparison. The dot matrix indicates intersections between comparisons. The vertical bars above quantify the number of DEGs in each intersection. (C) Unsupervised hierarchical clustering of bulk RNA-seq data shows the expression of Wnt pathway components across distinct anatomical tracts. Samples are ordered by feather length. (D) Schematic representation of the White Leghorn chicken indicates the sampled anatomical sites and their predominant Wnt pathway gene expression. (E–G) scRNA-seq analysis. (E) Global Wnt signaling networks showing source-target interactions among annotated dermal and epidermal cell populations in contour and sickle feathers. Red arrows indicate the inferred prominent Wnt interactions from epidermal TA cells to epidermal progenitor populations in long follicles. (F) Circle plots detail the inferred spatial communication networks for the highly ranked WNT6-FZD3-LRP5 pathway. (G) Circle plots detail the inferred spatial communication networks for the highly ranked WNT6-FZD6-LRP5 axis. Blue arrows in F and G indicate the interactions between TA cells and epidermal cells in long feathers.
Principal component analysis (PCA) revealed transcriptomic separation along PC1 that broadly corresponded to three feather-length categories, defined numerically based on the observed regional mean feather lengths: Very short (1.0–8.0 cm; head, breast, thigh, and anterior back), Short (9.0–11.0 cm; neck and posterior back), and Elongated (22.0–41.0 cm; flight, main sickle, and lesser sickle) (Figure S3B). Across the nine anatomical regions, mean PC1 scores were strongly positively correlated with mean measured feather length (Pearson’s r = 0.885, 95% CI: 0.535–0.976; two-sided p = 0.00152; n = 9 regions; Figure S3C), supporting an association between the primary axis of transcriptomic variation and feather length.
Despite clustering together on PC1, the secondary axis of variation (PC2) drove a clear separation between the elongated flight and sickle tracts (Figure S3B). Intersection analysis of differentially expressed genes (DEGs) reinforced this split, identifying a distinct transcriptional program of 433 DEGs that differed between flight and sickle feathers (Figure 2B). The DEGs among the Very short feathers, Short feathers, Flight, and Sickle groups are shown in Table S1. The substantial transcriptional distance between the flight and sickle feathers, which represent two types of elongated feathers, demonstrates that their elongation is driven by fundamentally different molecular networks. This finding reinforces the concept that the avian integument does not merely scale a single, universal growth pathway, but rather utilizes distinct molecular strategies to achieve phenotypic convergence.
3.2.2. Wnt/Frizzled Signaling Exhibits Multiple Signaling Trajectories Associated with Feather Length
We then analyzed expression levels of four major developmental pathways involved in feather morphogenesis (Wnt, FGF, IGF, and BMP) across these nine feather follicles collected from different body regions. For each pathway, we analyzed the regional expression profiles across the nine anatomical tracts with progressively increasing feather length using our bulk RNA-seq dataset. Given the established role of Wnt signaling in appendage development, we first analyzed the Wnt signaling network. When ordering the bulk RNA-seq samples by progressively increasing feather length (from the Head feather to the Main sickle feather), unsupervised hierarchical clustering revealed distinct, length-associated transcriptional patterns (Figure 2C,D). Specifically, Wnt pathway components segregated into expression modules that strongly align with terminal feather length. Elongated feathers (flight and sickle) exhibited enriched expression of specific receptors, such as FZD3, FZD4, and FZD9, alongside secreted antagonists like SFRP1 and SFRP2. Conversely, Very short feathers (Head, Thigh, Breast, Anterior back) were characterized by elevated expression of the FZD6 receptor, as well as WNT5B, WNT8B, and WNT9B ligands. Short feathers (Posterior back and Neck) displayed a distinct signature enriched for WNT3A, WNT7A, and WNT11. Furthermore, specific feather regions (Head and Posterior back) showed elevated expression of canonical pathway effectors (LEF1, CTNNB1) and modulators (WIF1, SFRP4). Collectively, this demonstrates that rather than modulating a single Wnt axis, different tracts deploy entirely distinct combinations of Wnt ligands, receptors, and regulators.
Then we used our previously published single-cell RNA-seq (scRNA-seq) data [7] from Anterior back and Lesser sickle feather follicles, representing short and long feathers, respectively, to infer potential ligand–receptor interactions among the cell clusters. In this dataset, cells in a feather follicle are characterized into 15 clusters. Epidermal cells are distributed in nine clusters (progenitor group 1 [Epi-progenitor1], progenitor group 2 [Epi-progenitor2], transient amplifying cells [Epi-TA cells], intermediate layer 1 [Epi-IL1], intermediate layer 2 [Epi-IL2], intermediate layer 3 [Epi-IL3], intermediate layer 4 [Epi-IL4], feather barb differentiated cells [Epi-barb], and feather sheath differentiated cells [Epi-sheath]) while dermal clusters are distributed into six clusters (peripheral pulp [pPP], central pulp [cPP], mixed peripheral/central pulp [pPP/cPP], dermal papilla [DP], peripheral dermal papilla [pDP], and dermal sheath [DS]) (Figure S3D). Using CellChat [38], we compared inferred intercellular communication networks between Anterior back and Lesser sickle follicles, including predicted ligand–receptor relationships and model-estimated communication probabilities. We compared the relative contributions of Wnt ligand–receptor combinations to inferred intercellular communication in the short and long feather scRNA-seq datasets (Figure S4A). Interactions involving WNT6, particularly the WNT6–FZD3–LRP5 and WNT6–FZD6–LRP5 combinations, ranked among the highest contributors to the inferred Wnt networks in both datasets, identifying shared predicted interactions.
Despite this shared core of global Wnt signaling networks, CellChat revealed differences in interaction topology between short and long feathers. The strength and directionality of communication between specific dermal and epidermal clusters vary drastically. Notably, CellChat inferred prominent Wnt interactions from epidermal transit-amplifying (TA) cells to epidermal progenitor populations in long follicles; however, corresponding interactions were not detected in the short-follicle network under the analysis settings used (Figure 2E, red arrow). Previous work has shown that skin appendages build specific shapes by adding cells from these localized growth zones, a process directly regulated by dynamic Wnt activity [36].
We further examined the cellular sources and target populations involved in these predicted WNT6-associated interactions (Figure 2F,G). Circle plots show changes in signaling between epithelial and mesenchymal cell populations, highlighting shifts in signal sources and targets (red arrows). Specifically, predicted interactions between TA cells through the WNT6 ligand and epidermal progenitor cells through FZD3–LRP5 or FZD6–LRP5 receptors were inferred in long follicles but not detected in short follicles. Hence, this analysis predicts that while the core ligand–receptor combinations are shared, the cellular context and directionality of these interactions support the elongated growth of long follicles.
3.2.3. FGF Signaling Reveals Phenotypic Convergence Underlying Feather Length Regulation in Different Skin Regions
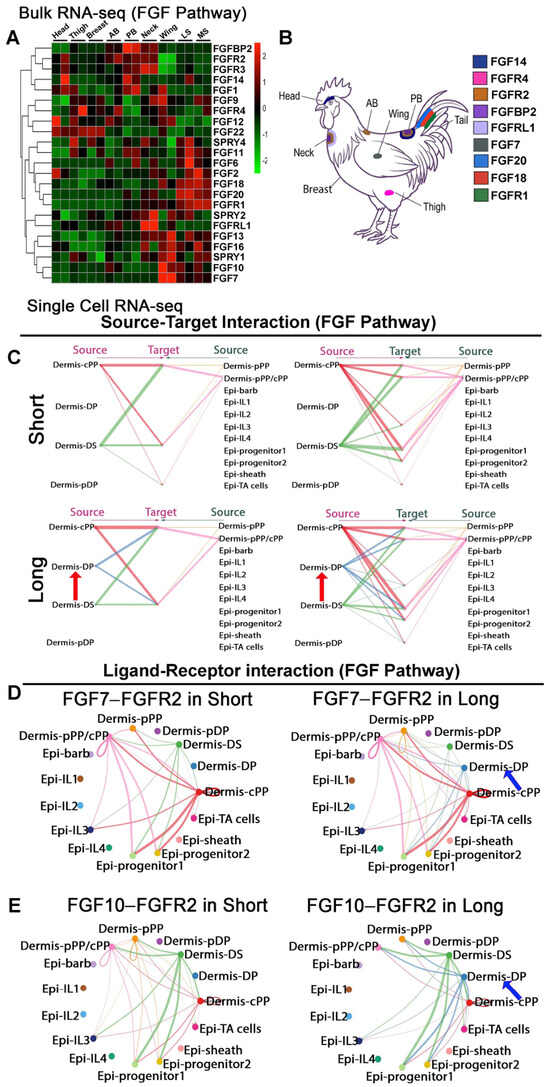
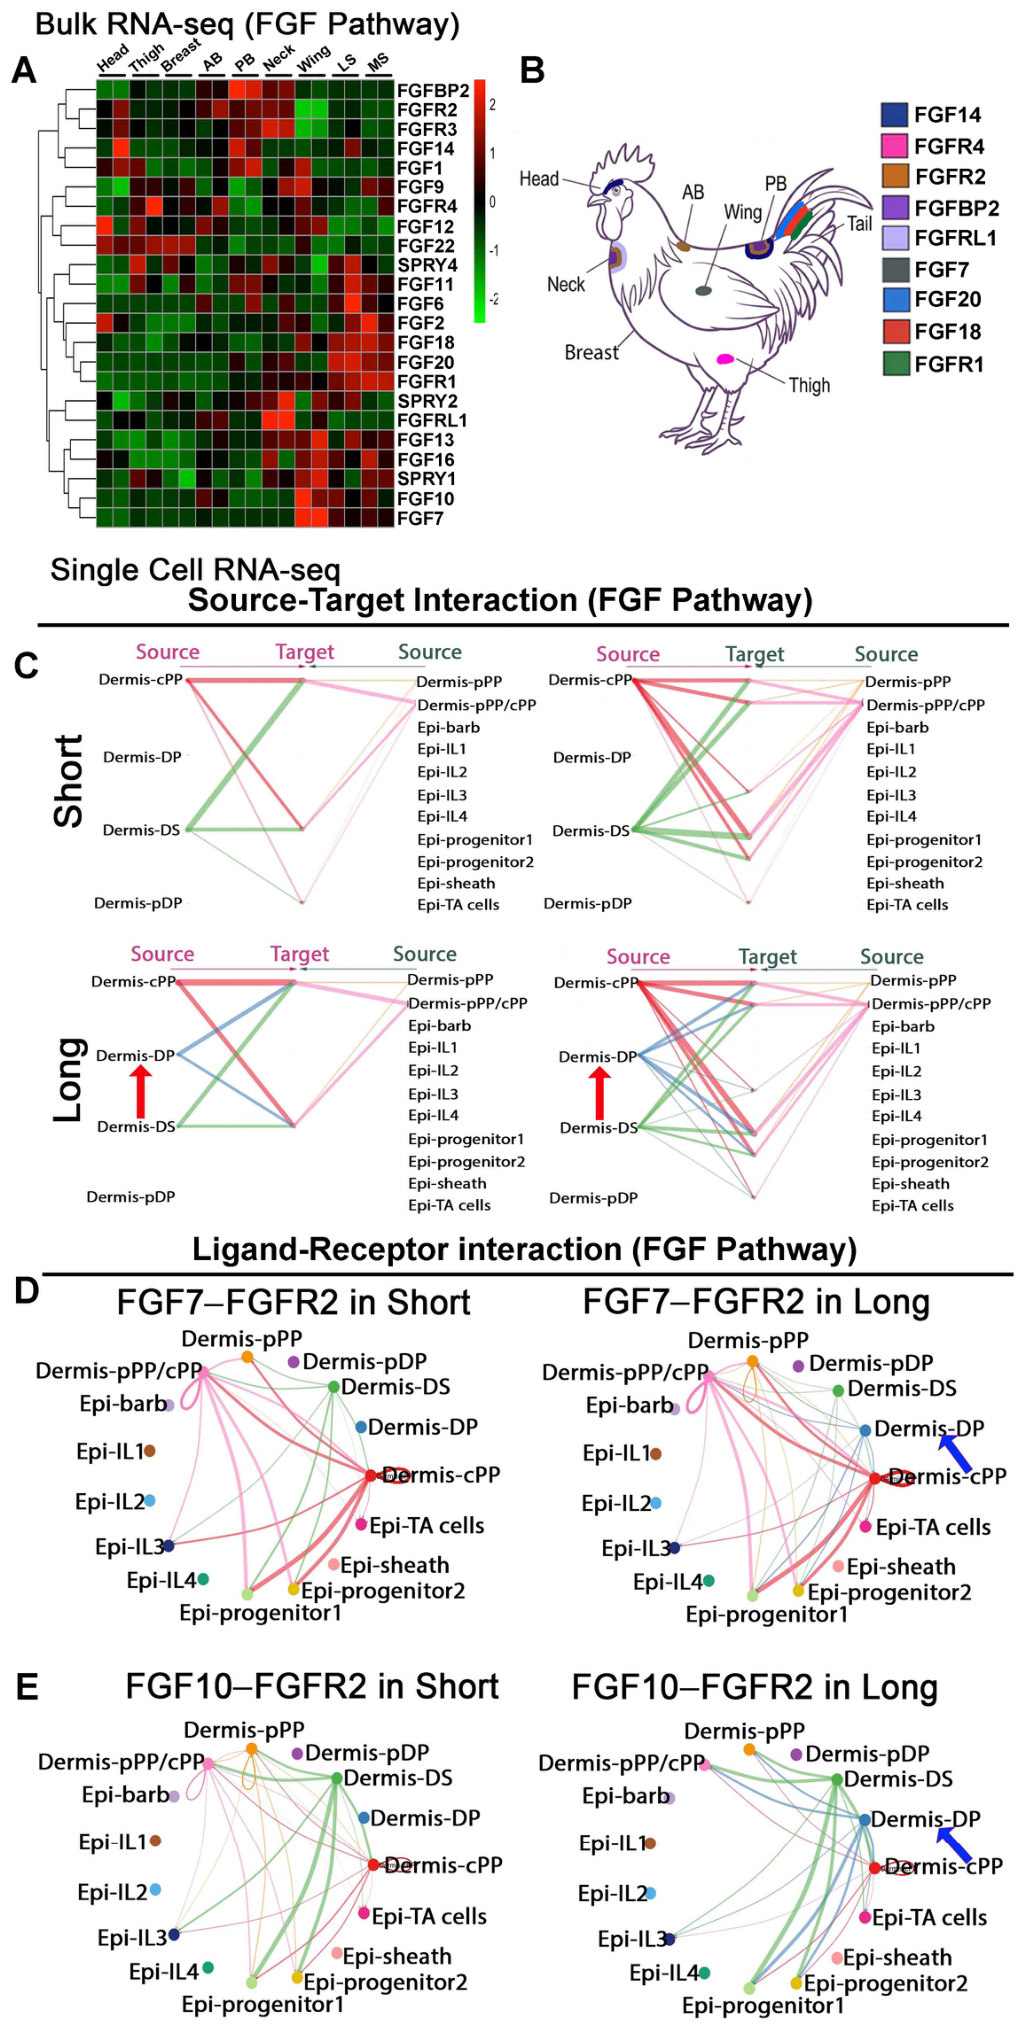
We next examined the Fibroblast Growth Factor (FGF) signaling network (Figure 3). Unsupervised hierarchical clustering of FGF pathway components (Figure 3A,B) revealed that samples do not cluster according to feather length alone. Instead, each anatomical tract exhibits a distinct expression profile of FGF ligands, receptors, and modulators, consistent with the idea that similar macroscopic appendage phenotypes can arise from different underlying molecular signal expressions.
Figure 3.
Transcriptomic profiling and cellular communication analysis of FGF signaling networks. (A) Unsupervised hierarchical clustering of bulk RNA-seq data showing FGF pathway gene expression across distinct anatomical tracts. (B) Schematic representation of the White Leghorn chicken indicating sampled anatomical tracts and their predominant FGF pathway gene expression. (C–E) scRNA-seq analysis. (C) Global FGF signaling networks show source-target interactions among annotated dermal and epidermal cell populations in contour and sickle feathers. Red arrows indicate the increased signaling from the dermal papilla to the peripheral pulp and epithelial-progenitor cells in long feathers. (D) Circle plots detailing inferred spatial communication networks for the highly ranked FGF7–FGFR2 signaling axis. (E) Circle plots detailing inferred spatial communication networks for the highly ranked FGF10–FGFR2 axis. Blue arrows in D and E indicate the Dermal papilla associated interactions with epidermal and dermal cell clusters in long feathers.
The divergence between Elongated feather tracts illustrates this principle. Although both the Wing and Sickle tracts produce elongated feathers, bulk RNA-seq analysis shows that they are characterized by distinct FGF expression profiles. The Wing tract displays elevated expression of ligands such as FGF7, FGF10, FGF13, and FGF16, alongside the modulator SPRY1. Conversely, elongated Sickle tracts exhibit enrichment of a different set of ligands, including FGF6, FGF18, FGF20, and the receptor FGFR1. A similar molecular divergence is observed among Very short feathers: Head feathers have high expression levels of FGF12, FGF14, and FGF22, whereas the Anterior back and Posterior back feathers show increased expression of FGFBP2.
To determine how these regional transcriptomic differences may reflect altered cellular communication, we analyzed the scRNA-seq intercellular networks (Figure 3C–E). Despite the vast diversity of ligands observed in bulk tissue, CellChat inferred that signaling through the FGFR2 receptor (specifically the FGF7–FGFR2 and FGF10–FGFR2 axes) ranked among the highest-contributing inferred ligand–receptor pairs in both short and long feather models (Figure S4B). However, mapping these interactions across specific cell clusters revealed profound differences in signaling dynamics. Global analysis of the FGF network (Figure 3C, red arrows) predicted increased signaling from the dermal papilla (DP) to the peripheral pulp and epithelial-progenitor cells in long feathers compared to short feathers. Examination of the individual ligand–receptor networks identified DP-associated inferred interactions involving both FGF7–FGFR2 and FGF10–FGFR2 in long follicles (Figure 3D,E, blue arrows). These predicted results inferred differences in the cell populations contributing to potential FGFR2-mediated communication between the two follicle types.
3.2.4. IGF Signaling Represents a Conserved Growth Program Across Region-Specific Morphogen Profiles
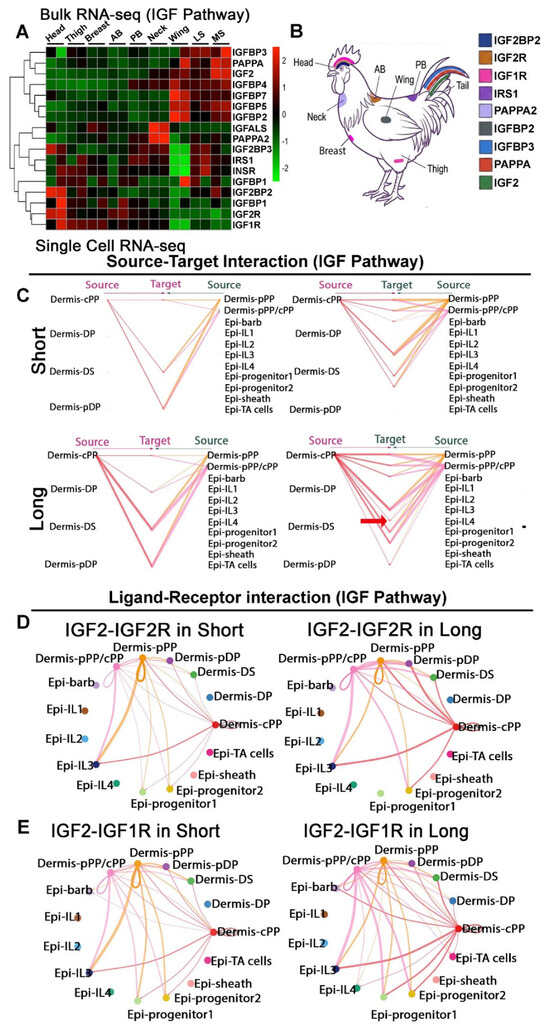
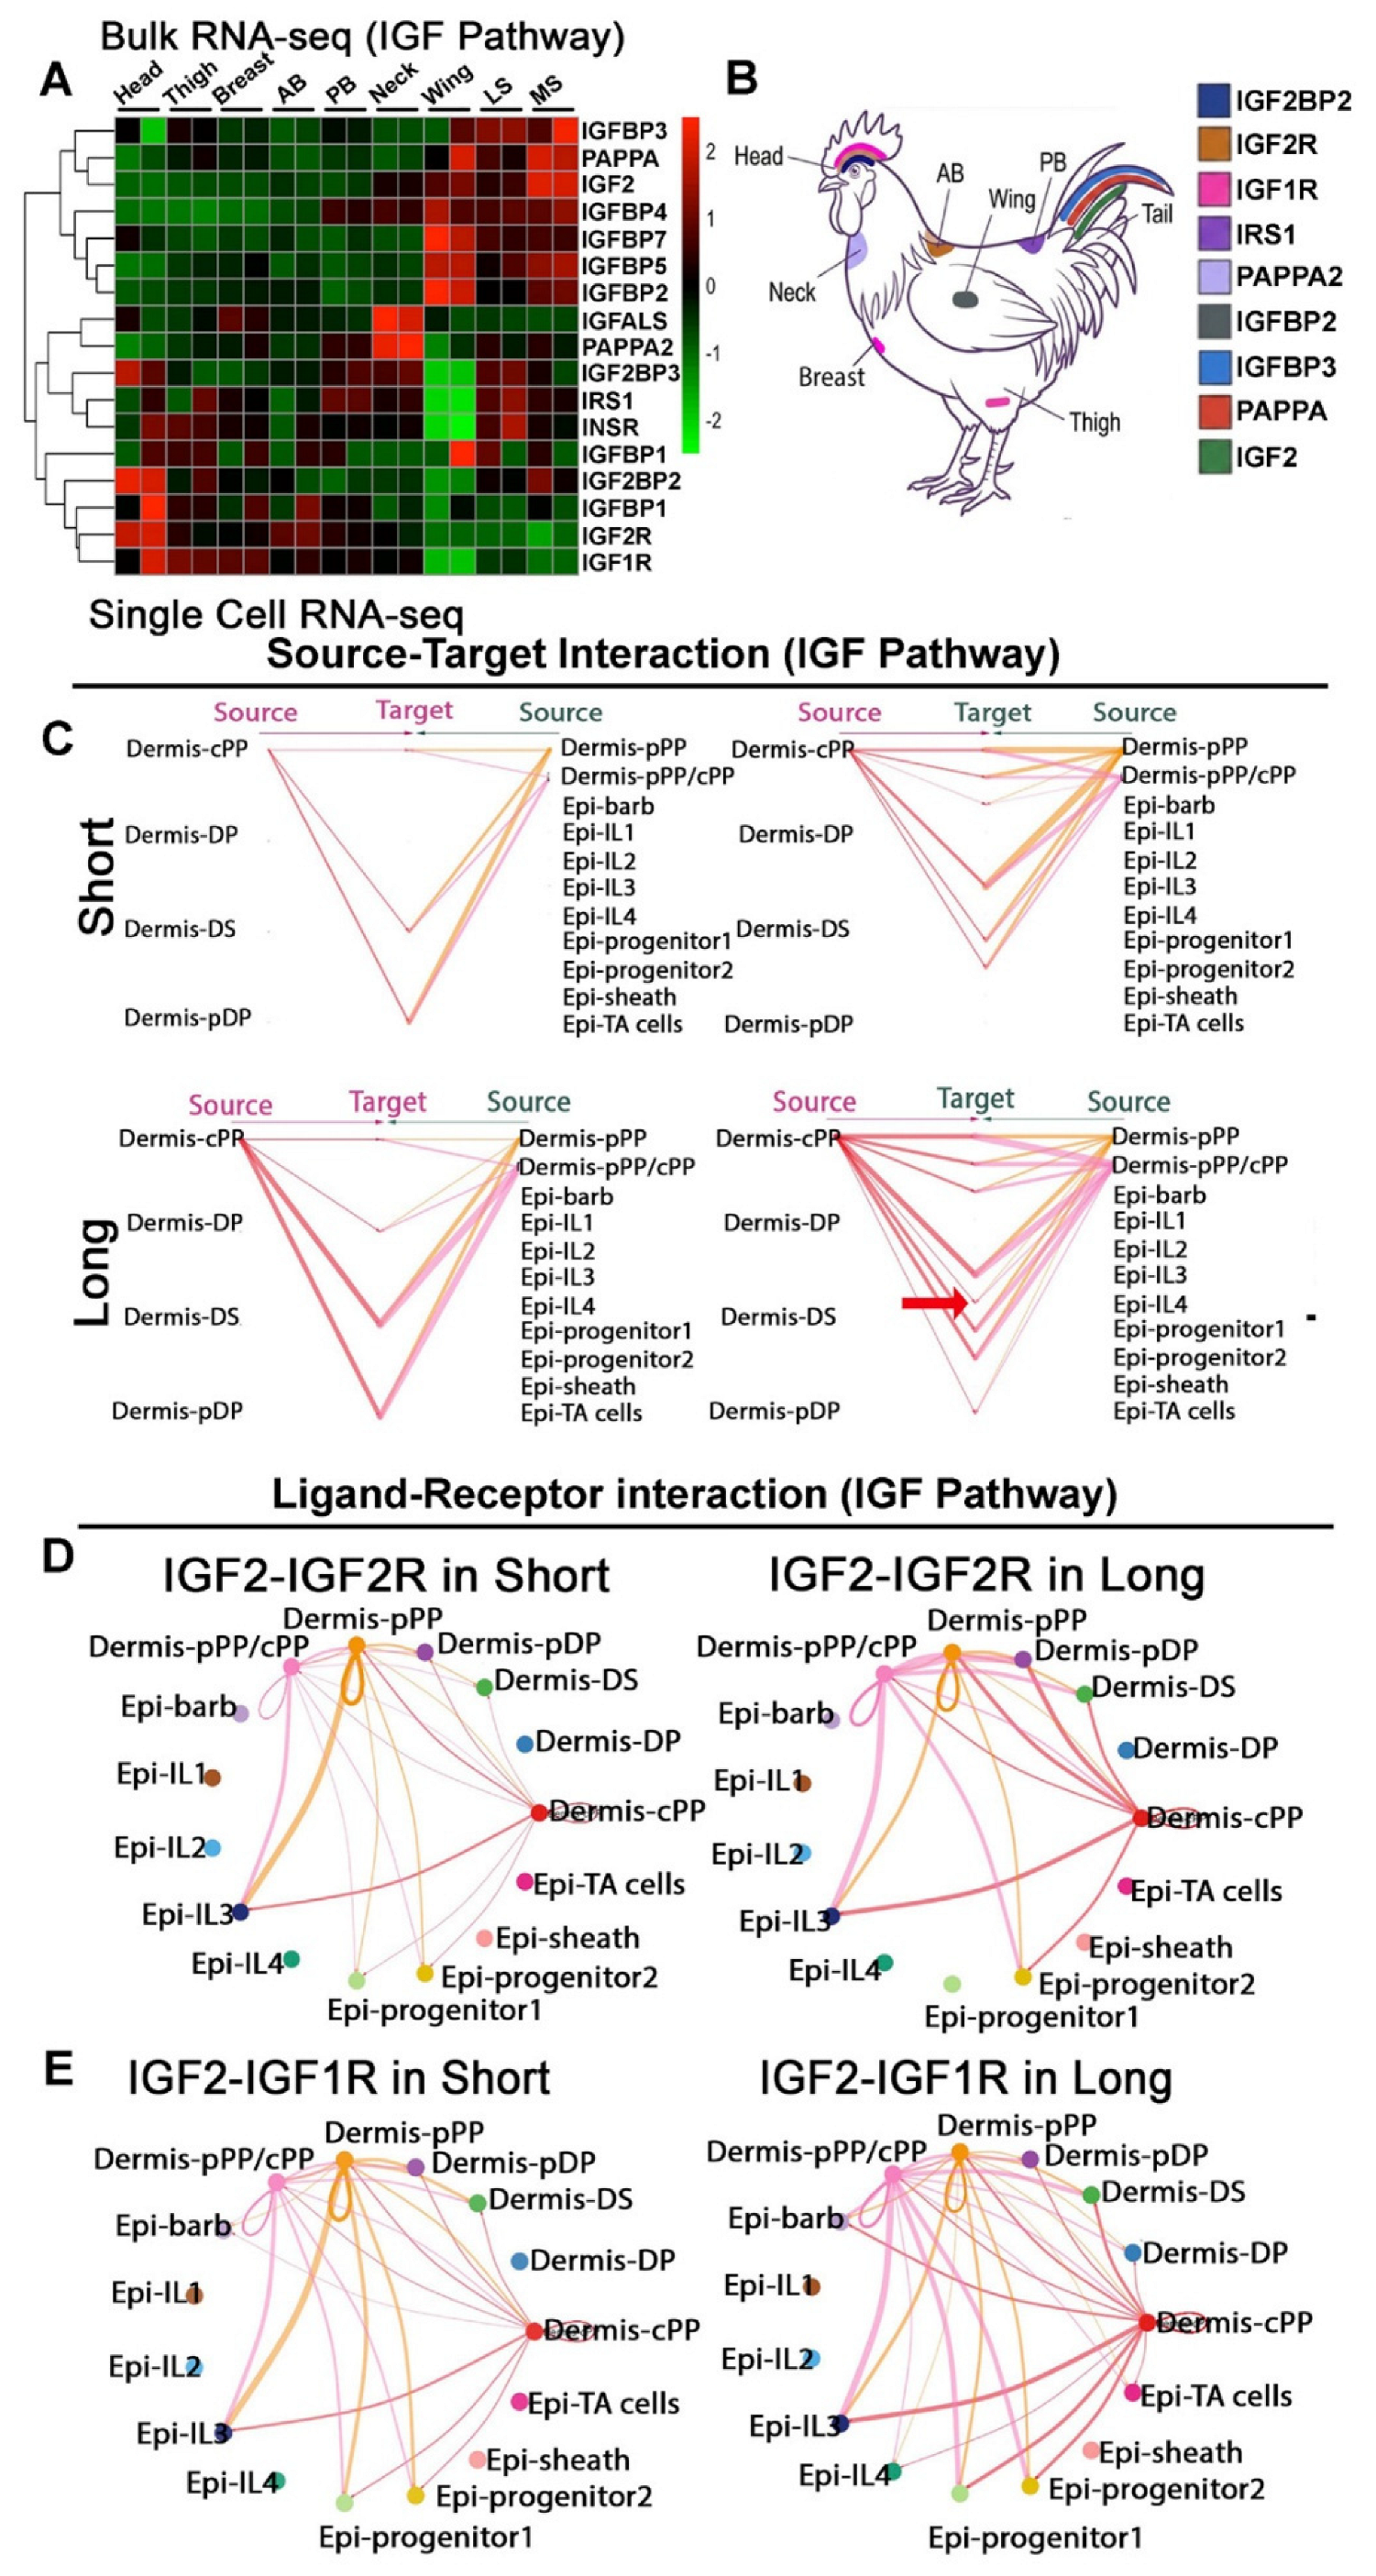
Having established that regional feather length can be associated with distinct Wnt and FGF expression profiles, we next examined the Insulin-like Growth Factor (IGF) pathway. The IGF pathway is known to regulate the growth rate of regenerating feathers [7]. To determine whether this network exhibits a similarly divergent spatial pattern, we performed unsupervised hierarchical clustering of IGF pathway components (Figure 4A,B). In contrast to the region-specific expression patterns observed in Wnt and FGF signaling, IGF pathway components exhibited a distinct expression signature that aligned more closely with terminal feather length than with anatomical region.
Figure 4.
Transcriptomic profiling and cellular communication analysis of IGF signaling networks. (A) Unsupervised hierarchical clustering of bulk RNA-seq data showing IGF pathway gene expression across anatomical tracts. Samples are ordered by feather length. (B) Schematic representation of the White Leghorn chicken indicating sampled anatomical tracts and their predominant IGF pathway gene expression. (C–E) scRNA-seq analysis. (C) Global IGF signaling networks showing source-target interactions for IGF among dermal and epidermal cell populations in contour and sickle feathers. Red arrow indicates the new interaction in long feathers. (D) Circle plots detailing inferred spatial communication networks for the highly ranked IGF2-IGF2R axis in both short and long feathers. (E) Circle plots detailing inferred spatial communication networks for the highly ranked IGF2-IGF1R axis.
Bulk RNA-seq analysis demonstrated that both the elongated Flight and Sickle tracts exhibit a similarly upregulated set of IGF pathway-associated genes. This shared elongation signature includes the ligand IGF2, the metalloproteinase PAPPA, and multiple IGF-binding proteins (IGFBP2, IGFBP3, IGFBP4, IGFBP5, and IGFBP7). In contrast, shorter feather tracts display reduced expression of this group of genes, alongside more localized enrichment of factors such as IGF1R and IGF2BP in Very short regions. These findings suggest that the IGF-associated signaling environment is shared by feathers with similar length.
To examine potential interactions associated with these expression patterns, we evaluated inferred intercellular communication using CellChat. Ligand–receptor analysis (Figure S4C) predicted that interactions involving IGF2 signaling through IGF1R represent the highest-contributing communication axis in both short and long feathers. However, the relative contribution of secondary interactions diverges between morphotypes (Red arrows in Figure S4C). In short feathers, the IGF2 ligand primarily targets the IGF2R receptor. In long follicles, IGF2-integrin αVβ3 interactions made a prominent relative contribution.
Comparison of predicted sender–receiver relationships revealed differences in the cell populations contributing to inferred IGF communication (Figure 4C, red arrow). The results show that source-target interactions in long feathers are overall stronger than interactions in short feathers, especially for signals originating from the central pulp and peripheral pulp. Circle plots of the IGF2–IGF1R and IGF2–IGF2R networks predicted greater inferred interaction strengths from central pulp cells to intermediate epithelial cell clusters in long follicles (Figure 4D,E).
Together, our bulk RNA-seq data show that unlike WNT and FGF pathway genes, all elongated feathers share a similar IGF gene expression profile. CellChat analysis further predicts differences in the relative contributions of receptor-associated interactions and participating cell populations between short and long follicles.
3.2.5. BMP Signaling Exhibits Differential Ligand Expression Patterns and Localized Follicular Structural Modulation Across Distinct Feather Phenotypes
We further analyzed the Bone Morphogenetic Protein (BMP) signaling network, a pathway classically associated with spatial patterning, boundary formation, and feather branching [29,31].
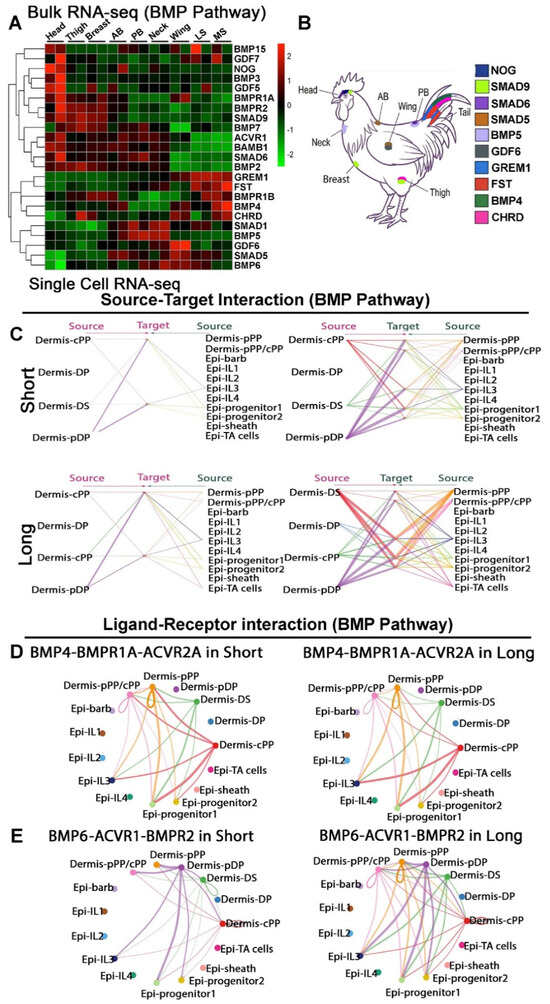
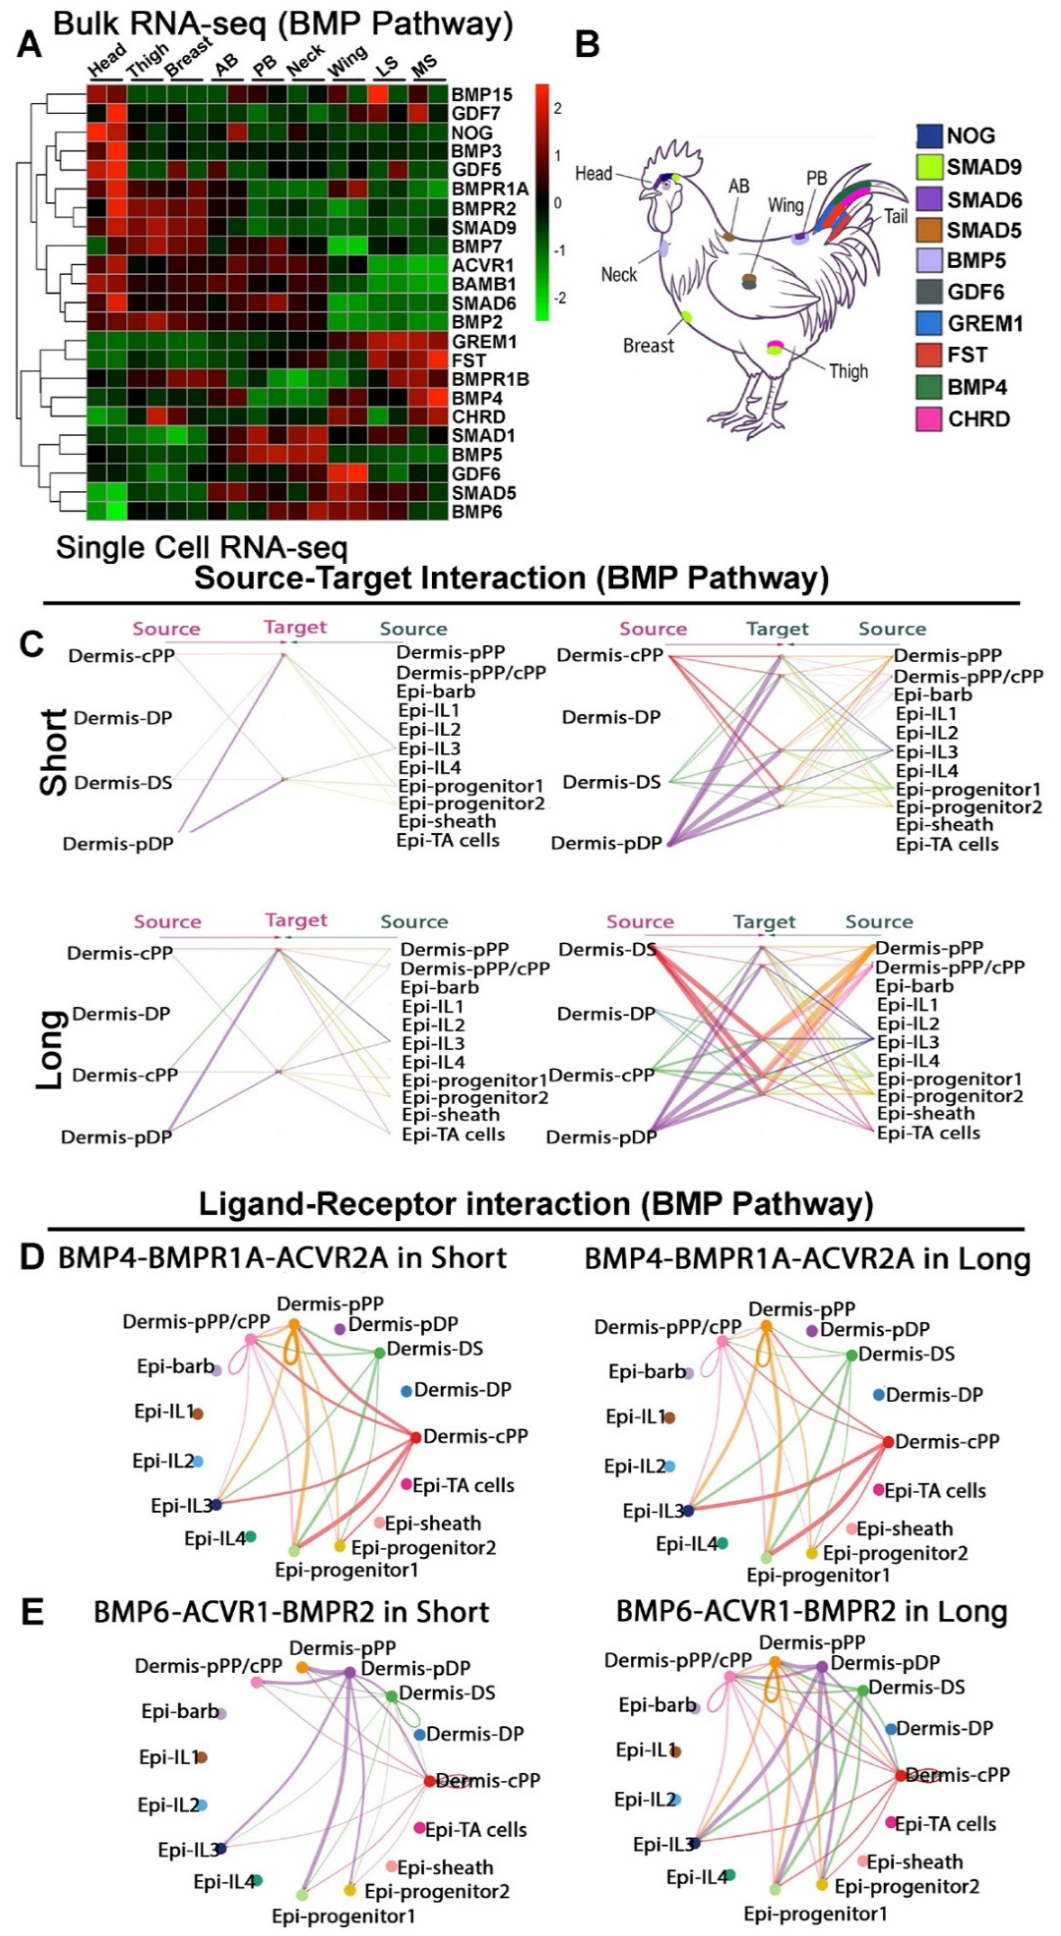
Bulk RNA-seq analysis revealed a clear shift in BMP pathway molecular usage among feather morphotypes, accompanied by tract-specific variations (Figure 5A,B). Our analysis showed that Very short feather tracts (Head, Thigh, Breast, and Anterior Back) are characterized by increased expression of genes such as BMP7, BMP3, and GDF5, with the shortest feathers within this group exhibiting the most robust expression. Interestingly, the shortest feathers on the head specifically show expression of the BMP antagonist NOG (Noggin). In contrast, the Elongated feather group (Wing, Sickle) displayed elevated expression of BMP4 alongside the antagonist CHRD (Chordin). Meanwhile, the short feather group (Posterior Back, Neck) exhibited higher expression of BMP6. Beyond these broad tier-based variations, further tract-specific refinements are evident within the elongated feather group itself: sickle feathers show localized enrichment of FST (Follistatin), whereas flight feathers have an increased expression of modulators such as GDF6 (Figure 5A).
Figure 5.
Transcriptomic profiling and cellular communication analysis of BMP signaling networks. (A) Unsupervised hierarchical clustering of bulk RNA-seq data showing BMP pathway gene expression across anatomical tracts. (B) Schematic representation of the White Leghorn chicken indicating sampled anatomical tracts and their predominant BMP pathway gene expression. (C–E) scRNA-seq analysis. (C) Global BMP signaling networks showing source-target interactions among dermal and epidermal cell populations in contour and sickle feathers. (D) Circle plots detailing inferred spatial communication networks for the highly ranked BMP4-BMPR1A-ACVR2A axis. (E) Circle plots detailing inferred spatial communication networks for the highly ranked BMP6-ACVR1-BMPR2 axis.
These differences in ligand expression are reflected in intercellular communication networks (Figure 5C). CellChat analysis predicted a more specific ligand–receptor interaction. Although BMP4-associated interactions were prominent in both inferred networks, the highest-contributing receptor complexes differed between short and long follicles. The predominant predicted BMP4 receptor complexes differed between short and long follicles (Figure S4D).
Furthermore, in long feathers, BMP signaling networks appear denser, with increased signals originating from the dermal sheath, central pulp and peripheral pulp. Analysis of BMP4- and BMP6-associated pathways suggests that the dermal sheath acts as a strong BMP6 signal source in long feathers compared to short feathers (Figure 5D,E). These predicted results support a model in which regional feather phenotypes are associated with both shifts in BMP ligand/receptor usage and differences in how these signals are received across cell clusters.
3.2.6. Summary of the Transcriptomic Data
Together, our systematic analysis of Wnt, FGF, IGF, and BMP pathway components suggests that feather phenotypic diversity across the avian body is associated with region-specific expression profiles and predicted ligand–receptor interactions. Different anatomical tracts exhibit distinct combinations of expressed ligands, receptors, and antagonists, which may be relevant to regional variation in feather morphology. Two main patterns emerge from these analyses. First, similarly elongated feathers exhibit differences in regional FGF and Wnt expression profiles, indicating that comparable morphological features can be associated with distinct patterns of signaling-related gene expression. Second, shared signaling components, including IGF pathway components and BMP ligands, show different predicted ligand–receptor pairings across feather morphotypes, suggesting possible regional variation in intercellular communication. Overall, these results support a possible model in which shared and region-specific signaling profiles contribute to differences in feather growth and morphology across anatomical regions.
3.3. Spatial Expression Mapping Reveals Region-Specific Expression of FZD Receptors in the Proximal Follicle
To further investigate the functional significance of this modular regulatory organization, we focused on the Wnt/Frizzled signaling system as a representative pathway. By combining spatial mapping and in vivo perturbation of FZD receptors, we sought to determine whether these regionally restricted signaling profiles contribute to the control of follicle organization and skin appendage growth.
To relate our transcriptomic findings to spatial tissue organization, we mapped the expression of specific FZD receptors within the regenerating feather follicle. In a feather follicle, elongation is supported by a proliferative zone at the proximal base, which consists of the mesenchymal dermal papilla surrounded by an epithelial basal layer. Adjacent to this region lies the ramogenic zone, encompassing the intermediate layer and collar bulge, where epithelial cells initiate differentiation into organized feather barb ridges.
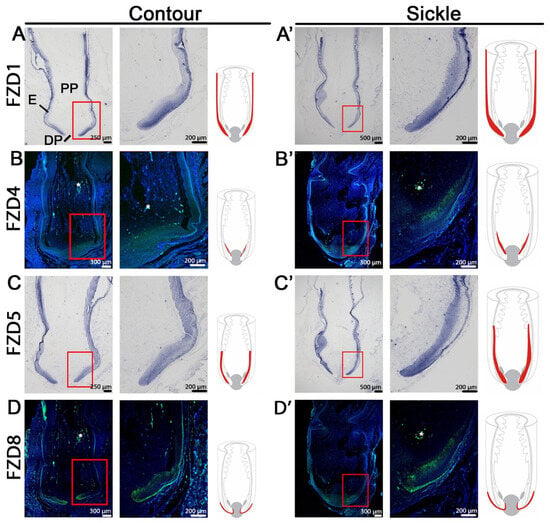
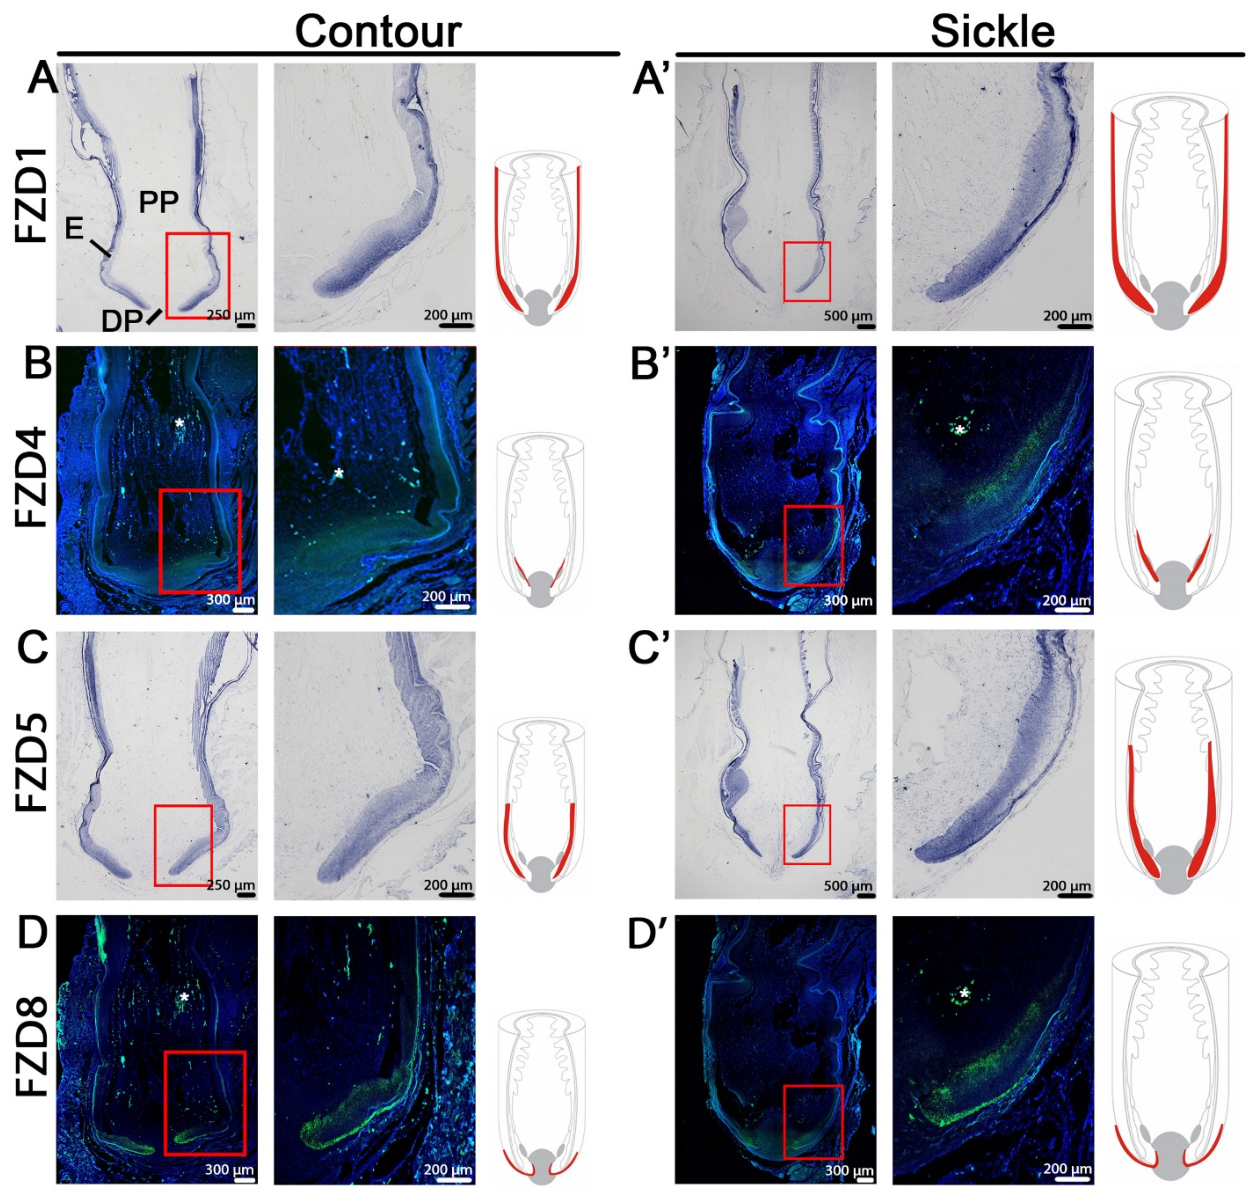
Using this structural framework, we analyzed the spatial expression of FZD receptors via in situ hybridization (Figure 6A–D). Consistent with the macroscopic differences between morphotypes, elongated sickle feathers exhibit deeply invaginated follicles with substantially expanded proximal compartments compared to short contour feathers.
Figure 6.
Spatial expression mapping reveals morphotype-specific FZD receptor expression within the proximal follicle base. (A–D’) Comparative spatial localization of FZD1, FZD4, FZD5 and FZD8 in regenerating short contour (left columns) and elongated sickle (right columns) feather follicles. For each morphotype, low- and high-magnification images show receptor expression in the proximal follicle base, with red boxes indicating magnified regions. Adjacent schematic drawings highlight receptor expression domains within the follicle. FZD1 (A,A’) and FZD5 (C,C’) transcripts are visualized via in situ hybridization (dark blue signal), whereas FZD4 (B,B’) and FZD8 (D,D’) are visualized via RNAscope (green signal, with DAPI nuclear counterstain in blue). “*” indicates autofluorescence in the pulp. DP, dermal papilla; E, feather epidermis; PP, pulp.
Transcripts for FZD1, FZD4, FZD5, and FZD8 were concentrated within the proximal growth zone in both morphotypes; however, their spatial distributions differed. In contour feathers, FZD1 expression was localized to the intermediate layers and feather sheath (Figure 6A). Whereas sickle feathers exhibited a broader FZD1 expression domain (Figure 6A’). FZD4 expression was very faint in contour feathers (Figure 6B) but was detectable in the progenitor cell zone of sickle feathers (Figure 6B’). In contour feathers, FZD5 expression was distributed throughout the epidermis, with stronger expression in the intermediate layers (Figure 6C). In contrast, FZD5 expression in sickle feathers was restricted to the progenitor cell zone and intermediate layers (Figure 6C’). FZD8 exhibited similar expression patterns in both feather morphotypes, primarily in the epidermis adjacent to the dermal sheath, although its expression domain was broader in sickle feathers (Figure 6D,D’). Together, these observations suggest that the spatial organization of FZD-expressing cell populations differs between short and elongated feather follicles and does not simply scale with overall follicle size.
3.4. Functional Studies of FZD Genes in Embryonic and Adult Chicken Feathers
3.4.1. Functional Perturbation of FZD Genes in E9 Chicken Embryos Alters Feather Bud Shape and Patterning
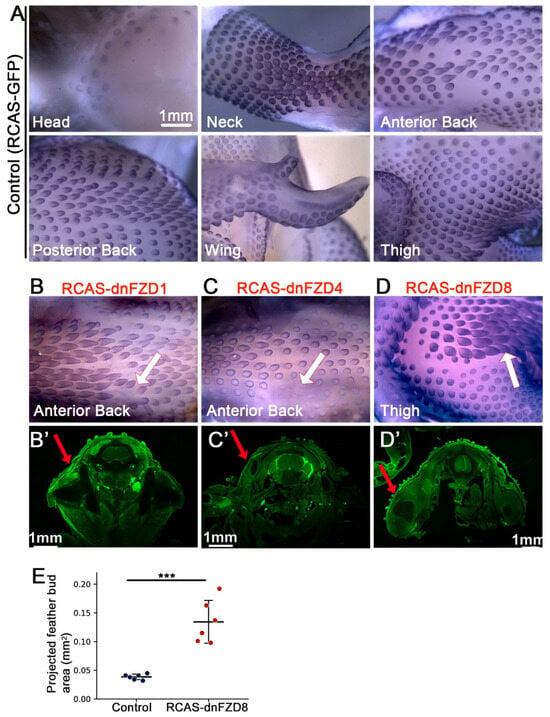
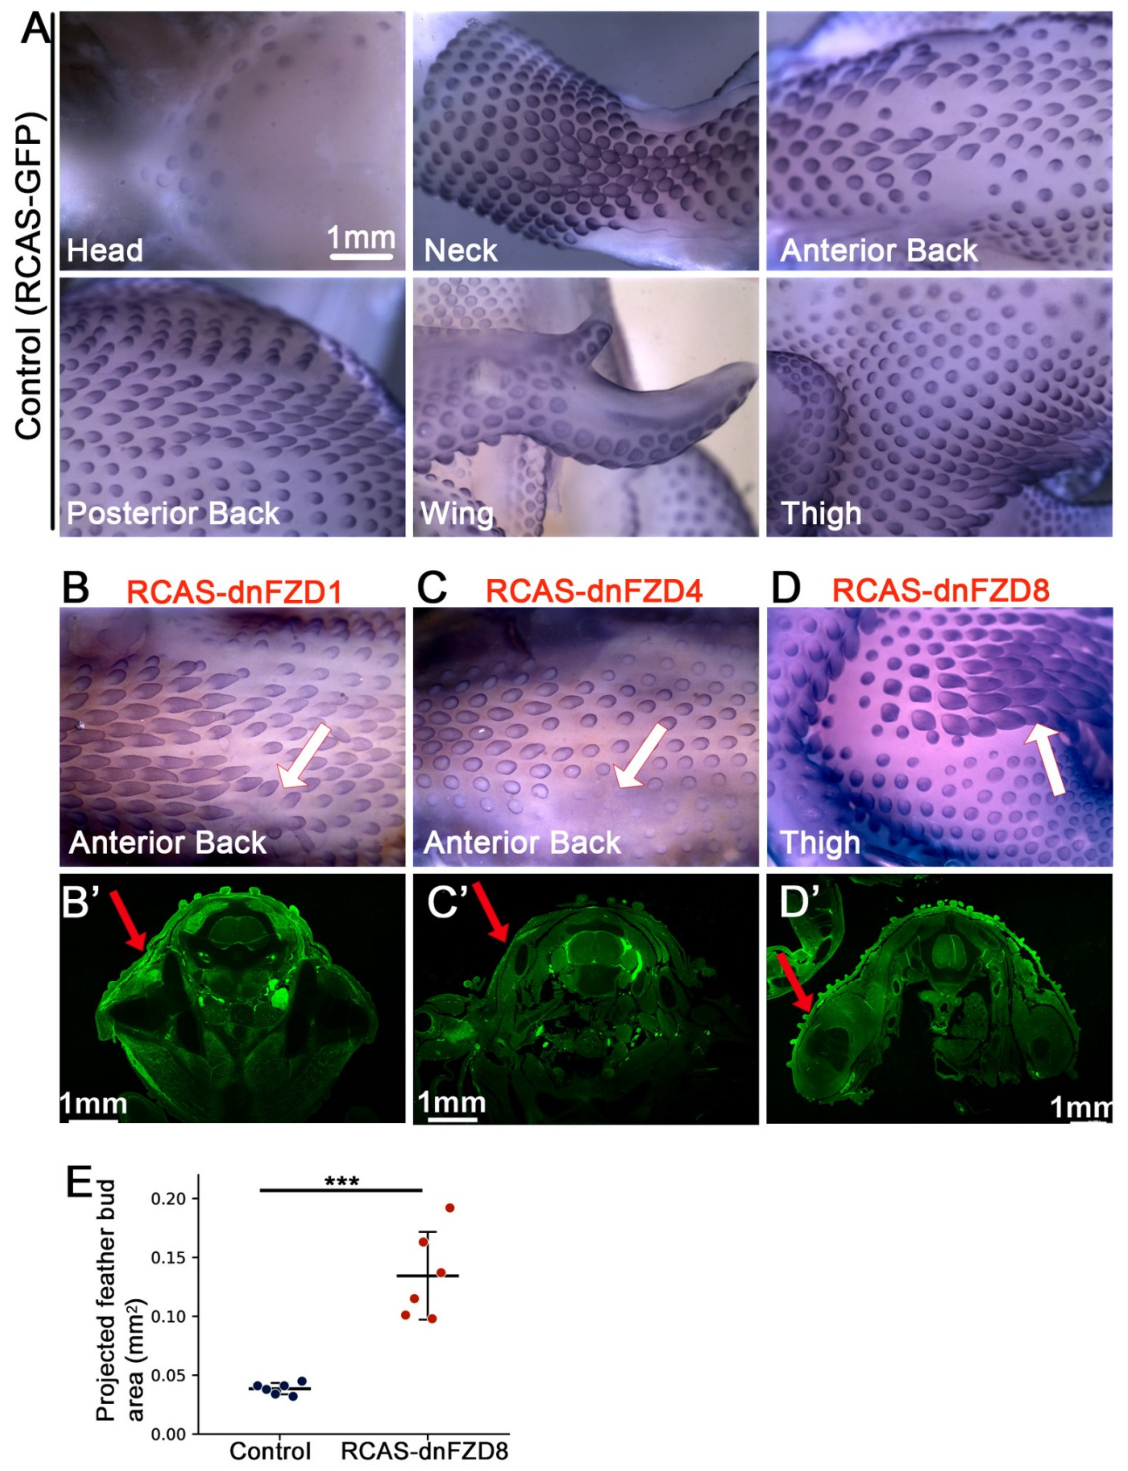
To investigate the region-specific functions of FZD receptors during embryogenesis, we generated dominant-negative FZD (dnFZD) constructs and delivered them in vivo using the RCAS retroviral system. Viral vectors were injected into the amniotic cavity at embryonic day 3 (E3), and the embryos were collected at E9. RCAS-GFP was used as the control. β-catenin whole-mount in situ hybridization was performed on samples to visualize the feather buds in different body regions (Figure S5).
Perturbing individual FZD receptors yielded various developmental defects (Figure 7). In the anterior back region of RCAS-dnFZD1-infected embryos, feather bud development was inhibited, resulting in missing feather buds (Figure 7B, white arrow, n = 4/8). Similarly, RCAS-dnFZD4 expression also inhibited feather bud development in the anterior back, producing asymmetric bud patterning along the anterior–posterior axis (Figure 7C. white arrow, n = 5/8). RCAS-dnFZD8perturbation in the thigh tract specifically altered feather bud structures, resulting in a distinctly widened phenotype compared to the control (Figure 7D, white arrow, n = 5/8). The distribution of RCAS virus by AMV-3C2 immunostaining reveals higher expression of RCAS virus on the left side of the body (Figure 7B’–D’). Quantification of increased feather bud size (measured by the projected area in mm2) after RCAS-dnFZD8 perturbation is shown in Figure 7E.
Figure 7.
Functional perturbation of FZD receptors during chicken embryo development. (A–D) Whole-mount in situ hybridization of β-catenin at E9. (A) Six different regions of the control sample. (B–D) Embryos were injected with RCAS-dnFZD constructs. RCAS-dnFZD1 inhibited bud development in the anterior back (B), whereas RCAS-dnFZD4 caused asymmetric inhibition, with 3 rows of buds on the right and only 2 rows on the left (C). In the thigh, RCAS-dnFZD8 treatment significantly increased feather bud size compared with controls. (D). White arrows in (B–D) indicate altered phenotypes. All six regions treated with the RCAS-dnFZD constructs are shown in Figure S5. (B’–D’) RCAS virus infection patterns, with red arrows indicating higher infection levels on the left side. (E) Quantification of feather bud area (mm2) shows increased size following dnFZD8 infection compared with controls (n = 3 embryos per group, with two feather buds per region analyzed in each embryo, *** p < 0.001, paired two-tailed Student’s t-test).
Together, these results demonstrate that FZD receptors play a role in feather phenotype determination in early feather development. Although the RCAS virus was injected into the amniotic cavity and theoretically spread throughout the entire embryo, only localized patches of feathers exhibited altered phenotypes. We propose that distinct FZD receptors function at specific developmental stages and within specific regions. Therefore, during our perturbation window (E3 to E9), the regions displaying phenotypic changes were likely more susceptible to FZD suppression than others.
3.4.2. Functional Perturbation of FZD4 Disrupts Follicle Organization and Compromises Cell Survival During Feather Regeneration
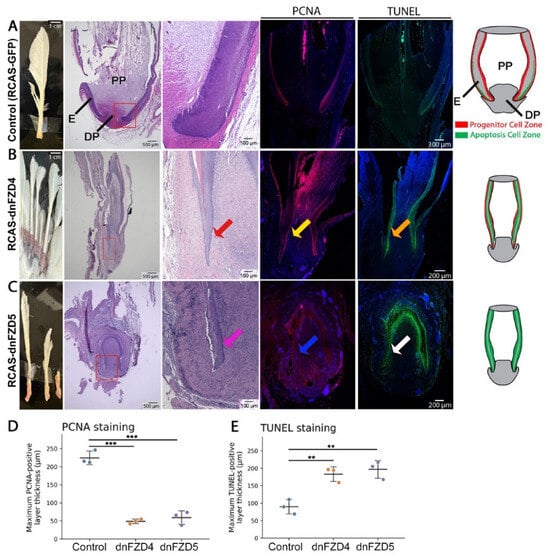
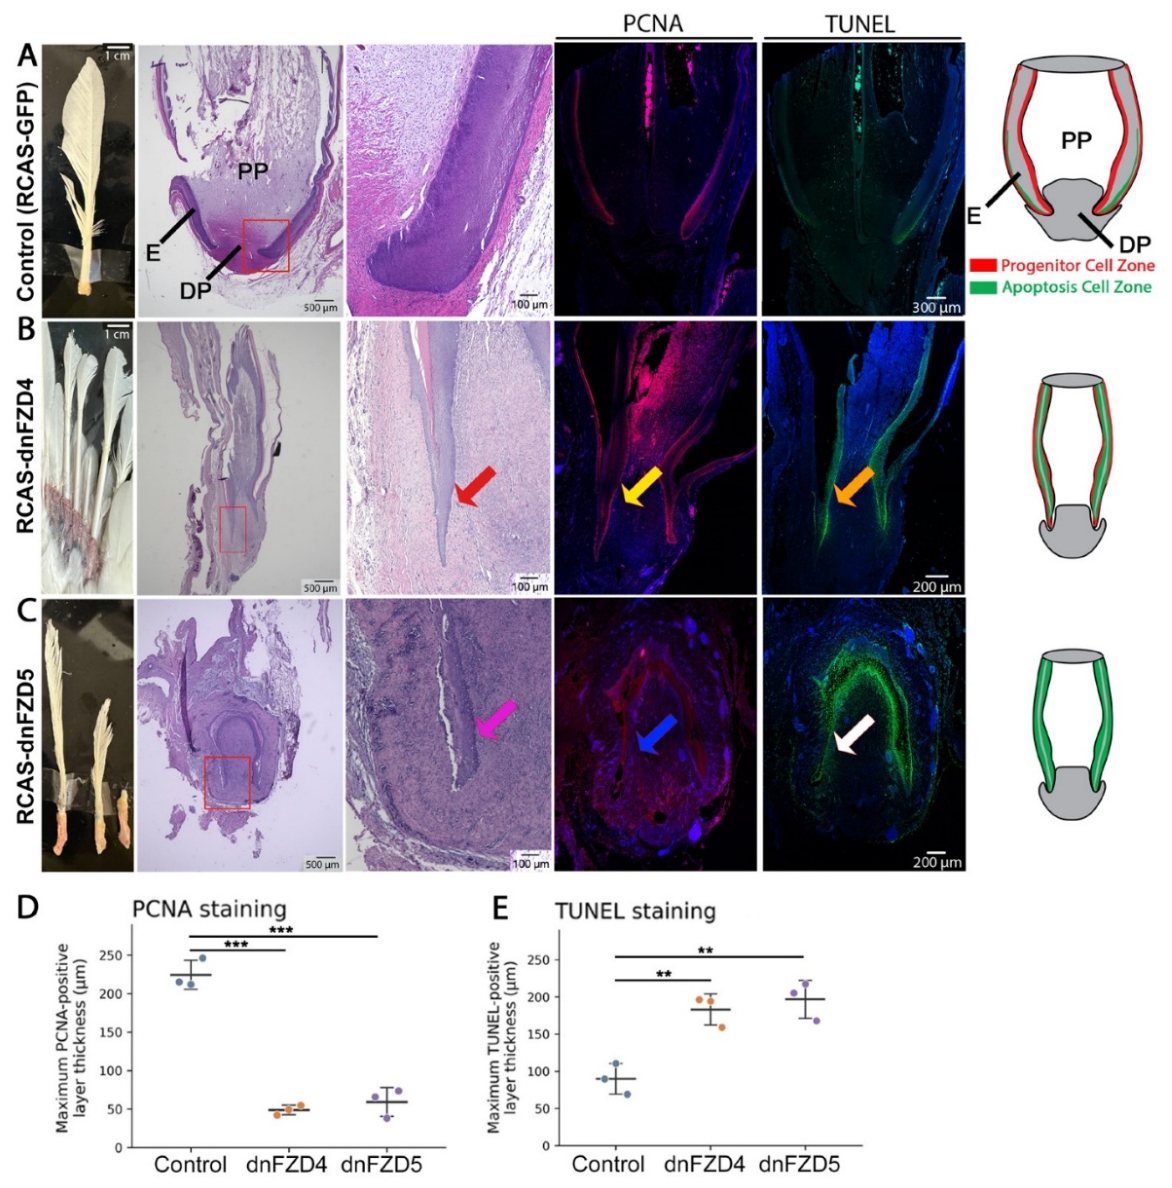
During the normal growth phase, the adult feather follicle exhibits distinct progenitor cell and apoptosis zones (Figure 1A’) [7]. We next examined the functional requirement of FZD receptors during adult feather regeneration. To this end, we performed in vivo perturbation by injecting avian RCAS retroviral vectors expressing a dominant-negative form of FZD4(RCAS-dnFZD4) into regenerating flight feather follicles following plucking.
Macroscopic analysis of regenerated feathers four weeks post-injection revealed severe morphological disruption in RCAS-dnFZD4-treated follicles (Figure 8B, n = 4/7). Control follicles (RCAS-GFP) consistently regenerated a single, structurally intact flight feather. In contrast, RCAS-dnFZD4-infected follicles produced shortened and malformed feather structures. The bases of the most severely affected structures frequently showed localized tissue abnormalities.
Figure 8.
Functional perturbation of FZD receptors during adult flight feather regeneration. (A–C) Representative images of regenerating adult flight feather follicles. (A) Control. (B) dnFZD4. (C) dnFZD5. Columns from left to right display gross morphology, low-magnification H&E staining (red boxes indicate the proximal growth zone), high-magnification H&E of the follicle base, PCNA staining for cellular proliferation (red/magenta), TUNEL staining for apoptosis (green), and DAPI nuclear counterstain (blue). Schematic diagrams on the right illustrate changes in follicle shape and cellular dynamics following dominant-negative RCAS treatment. Red, yellow, and orange arrows indicate altered follicular structure, proliferation, and apoptosis, respectively, in RCAS-dnFZD4-treated samples. Pink, blue, and white arrows indicate corresponding changes in RCAS-dnFZD5-treated samples. (D) Quantification of PCNA positive cell layer thickness in RCAS-dnFZD4, RCAS-dnFZD5 and control samples (n = 3 chickens per group, one follicle per sample, *** p < 0.001, paired two-tailed Student’s t-test). (E) Quantification of TUNEL positive cell layer thickness in RCAS-dnFZD4, RCAS-dnFZD5 and control samples (n = 3 chickens per group, one follicle per sample, ** p < 0.01, paired two tailed Student’s t-test). DP, dermal papilla; E, feather epidermis; PP, pulp.
To investigate the cellular basis of this phenotype, we performed histological and molecular analyses (Figure 8B). H&E staining revealed a pronounced disruption of the proximal follicular architecture in treated samples (Figure 8B), compared to the control (Figure 8A). The feather epithelial and mesenchymal compartments were disorganized, showing a sharp edge at the tip of the epithelial layer (Figure 8B, red arrow).
Furthermore, analysis of proliferation using PCNA staining revealed that the progenitor cell zone became narrower in RCAS-dnFZD4–treated samples (Figure 8B, yellow arrow). TUNEL staining demonstrated a marked increase in the apoptosis zone within the proximal follicle base of these RCAS-dnFZD4–treated samples (Figure 8B, orange arrow).
These findings suggest that FZD4 signaling contributes to the maintenance of follicular organization and cell survival within the proximal growth zone during flight feather regeneration. When this signaling is disrupted, the structural integrity of the follicle is severely compromised, potentially preventing normal cell movement between the exterior and interior compartments of the flight feather follicle.
3.4.3. Functional Perturbation of FZD5 Reveals a Critical Role in Maintaining Follicular Structural Integrity During Regeneration
To further examine the roles of length-associated FZD receptors, we performed functional perturbation of FZD5. Regenerating flight feather follicles were injected with RCAS vectors expressing a dominant-negative form of FZD5 (RCAS-dnFZD5) and analyzed four weeks post-injection.
RCAS-dnFZD5–treated follicles revealed a severe morphological phenotype distinct from that observed in FZD4 perturbation (Figure 8C, n = 3/6). H&E staining showed a severe disruption of proximal follicle organization in RCAS-dnFZD5-treated samples (Figure 8C, pink arrow). The feather follicle is smaller and epidermal cell layers were poorly organized compared to control sample.
PCNA staining indicated that progenitor cell zone is significantly reduced in RCAS-dnFZD5–treated samples (Figure 8C, blue arrow, Figure 8D) suggesting impaired organization of the proliferative zone. TUNEL staining demonstrated a widespread increase in apoptosis zone in these treated samples (Figure 8C, white arrow, Figure 8E).
These results indicate that FZD5 signaling is required to maintain proper follicle organization and to support cell survival during flight feather regeneration. The more extensive structural disruption following FZD5 perturbation, relative to FZD4 perturbation, is consistent with the broader spatial distribution of FZD5, suggesting that distinct FZD receptors differentially contribute to the organization and maintenance of the localized feather growth environment. We also tested RCAS-dnFZD1 and RCAS-dnFZD8 in adult flight feather follicles; however, neither construct induced any obvious phenotypic changes, suggesting that different FZD receptors may play distinct roles in flight feather regeneration.
4. Discussion
How is microscopic regional variation in the skin established? What controls the length, shape, and density of approximately 30,000 skin appendages that cover a single organism. Although skin appendages may look similar in some species, their diversity allows the amniote integument to develop new functions that adapt to different environments [1]. Distinct appendage phenotypes may be intermingled, as seen in mouse guard hairs and awl/auchene hairs, or occupy different body regions, as seen in the flight and contour feathers of birds. Using the diversity of region-specific chicken feather phenotypes, we performed transcriptomic analyses that revealed previously unrecognized regional heterogeneity in morphogen expression that underlie appendage diversity.
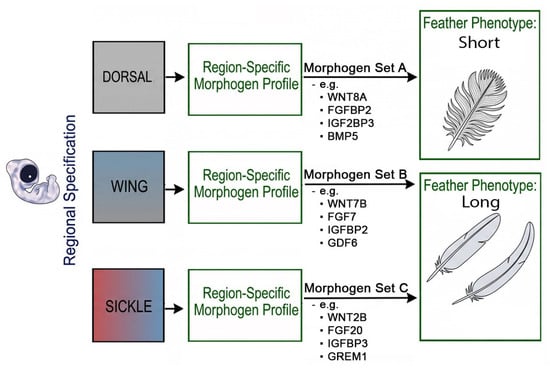
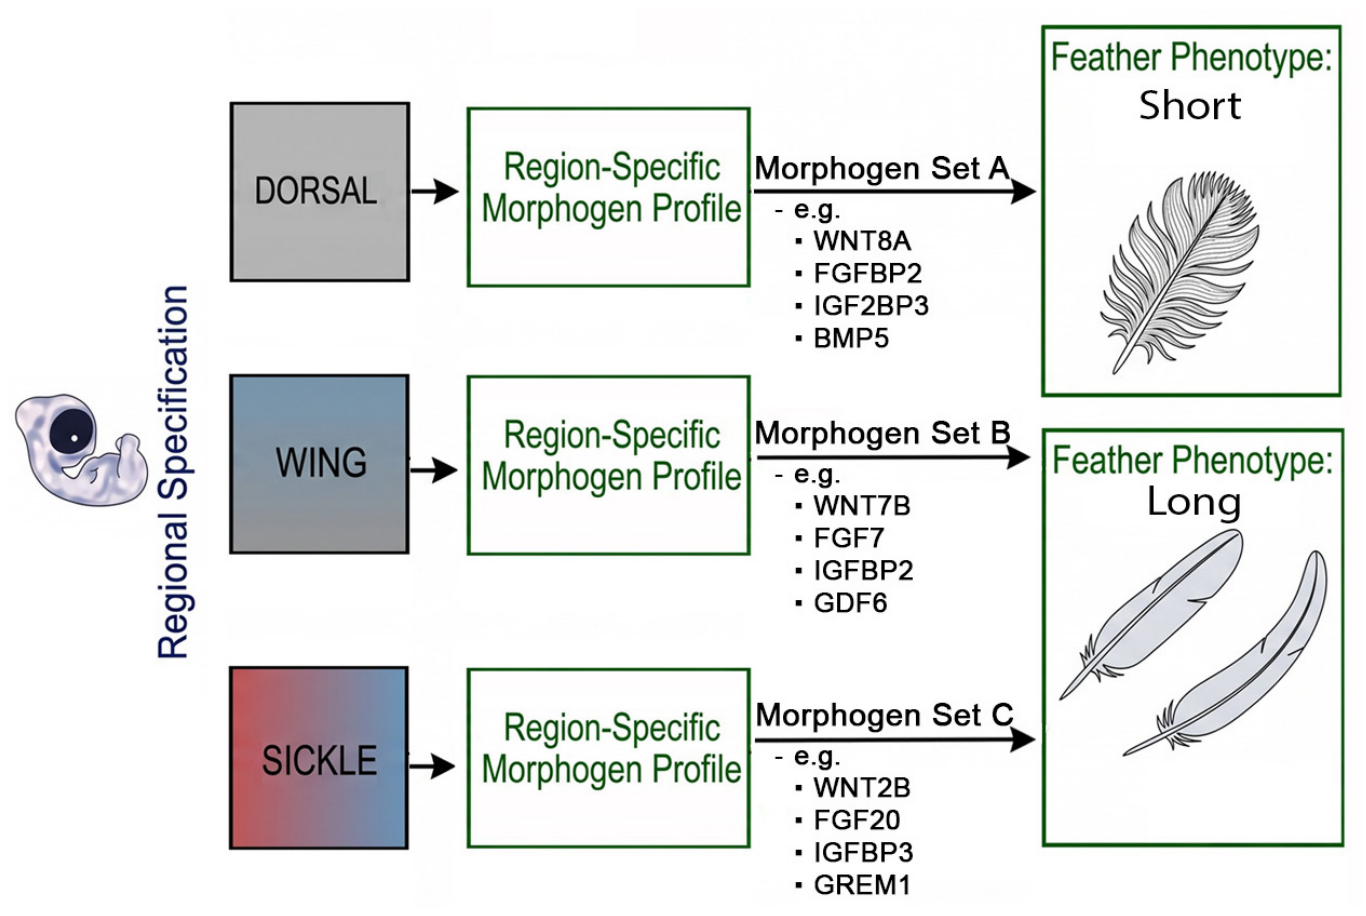
A prevailing assumption is that similar structures, such as elongated feathers, result from increased activity of shared “growth-promoting” pathways [7]. We hypothesize, instead, that different body regions establish unique combined morphogen activities to regulate growth. Here, we reveal unexpected diversity in morphogen expression across body regions associated with regional differences in feather length. The avian integument generates a vast array of feather morphotypes from a single genetic blueprint. Previous studies have demonstrated that FGF, BMP, and Wnt signaling pathways play important roles in feather development and the regulation of feather length [28,31,33]. Recently, we revealed that multiple pathways including Notch/YAP, IGF and Wnt signaling also are involved in determining feather length [7]. Our current data shows that the body does not simply turn a single “growth pathway” up or down to change feather size. Instead, different body regions use specific combinations of Wnt, FGF, IGF, and BMP agonists and antagonists to tune the signal strength up and down to build different feather shapes (Figure 9).
Figure 9.
Conceptual model of regional feather specification and phenotypic convergence. Schematic representation of how localized morphogen profiles drive the diverse structure and length of avian skin appendages. During development, distinct anatomical tracts (e.g., Dorsal, Wing, Sickle) establish specific signaling environments. Each region expresses a unique combination of Wnt, FGF, IGF, and BMP pathway members (represented by Morphogen Sets A, B, and C). These distinct molecular profiles can generate divergent appendage forms (short versus long feathers). Short contour feathers are produced by morphogen Set A, whereas long feathers are produced by either morphogen Set B or morphogen Set C. However, distinct morphogen combinations, as observed in the Wing (Set B) and Sickle (Set C) tracts, are associated with similarly elongated feather phenotypes, suggesting that different molecular profiles may contribute to convergent feather morphologies.
Bulk RNA-seq analysis revealed an unexpected cause of phenotypic convergence: similarly elongated feathers can emerge from divergent morphogen signaling. For instance, while both flight and sickle feathers are elongated, they share IGF signaling but differ in their Wnt and FGF signature profiles (Figure 2C and Figure 3A). This divergence is strikingly evident within the FGF network. Despite sharing the long feather phenotype, flight feathers have elevated expression of FGF ligands such as FGF7, FGF10, FGF13, and FGF16, whereas sickle feathers are enriched for FGF6, FGF18, FGF20, and the receptor FGFR1 (Figure 3A). Similarly, short breast and anterior dorsal contour feathers emerge from divergent BMP environments. These findings suggest that feather follicles modify their size by reconfiguring shared signaling pathways rather than activating entirely new ones. Our scRNA-seq analysis further suggests that regional differences involve not only gene expression but also patterns of cell–cell communication within feather follicles. Even when distinct feather tracts utilize the same core ligand–receptor pairs (such as WNT6-FZD3/6 and FGF7/10-FGFR2), the specific cellular populations sending and receiving these signals differ (Figure 2F,G and Figure 3D,E). For example, in elongated sickle feathers, CellChat analysis suggests that transit-amplifying (TA) cells send WNT6 signals to epidermal progenitors, an interaction that is absent in short contour feathers. Likewise, the dermal papilla in sickle feathers secretes FGF7 to target the peripheral pulp and progenitors, while contour feathers utilize FGF10 to target the same FGFR2 receptors (Figure 3D,E). Similarly, dermal cells emit IGF signals to the epidermal TA cells exclusively in sickle feather follicles (Figure 4C). These specific communication loops may maintain a larger progenitor pool and strictly regulate the timing of differentiation to facilitate prolonged feather elongation.
Finally, in vivo viral perturbation experiments confirmed that specific FZD genes are essential to maintain the flight feather progenitor zone. Spatial mapping demonstrates that distinct FZD receptors exhibit unique expression boundaries within the proximal growth zone at the follicle base (Figure 8). Notably, suppressing FZD4 or FZD5 during adult flight feather regeneration disrupts follicular architecture and increases apoptosis, suggesting that these receptors play important roles in maintaining cellular homeostasis within the feather growth environment (Figure 8). Together, our results suggest that FZD receptors do not function as simple binary switches controlling progenitor cell proliferation and differentiation in flight feather follicles. Instead, they may serve as region-specific spatial modulators that interpret local morphogen landscapes, fine-tuning follicular architecture to generate diverse skin appendage morphologies.
5. Conclusions and Future Directions
In this study, we demonstrate that the regional patterning of avian feather length is governed by a highly adaptable signaling system (Figure 9). These exploratory CellChat predictions suggest that regional differences in receptor expression and potential intercellular communication networks involving a core set of conserved signals may contribute to the diversity of feather size and shape. Here, we focus specifically on regional differences in feather length. While our findings provide insight into the signaling networks that contribute to regional feather morphogenesis, several key questions remain. First, the mechanisms underlying the establishment of region-specific molecular profiles remain to be elucidated. Given the role of the dermal papilla in maintaining positional information associated with appendage morphology, future studies should investigate how upstream regulators, including HOX genes and epigenetic modifications in dermal cells, contribute to the establishment of region-specific signaling patterns that influence feather morphology during subsequent growth. Second, future studies should determine how morphogen signals regulate cell growth, differentiation, and apoptosis to physically shape each feather. Third, in birds, many appendage phenotypes vary incrementally, exhibiting gradual morphological transitions across a certain feather tract. For example, dorsal midline contour feathers increase progressively in length from the anterior to the posterior body regions. How morphogen signaling is quantitatively regulated to produce graded morphological variations remains a fundamental question in developmental biology, and the avian skin provides a potentially tractable model.
Together, our findings provide a framework for understanding how a shared developmental toolkit can generate convergent morphological outcomes across distinct anatomical contexts. This modular adaptability is likely to be a major driver of avian evolutionary success in optimizing their integument for flight, thermoregulation, and display without creating entirely novel genetic pathways [11,41,42]. Our long-term goal is to define the regional regulatory code linking transcription factors, morphogen signaling, and cell proliferation to the characteristic feather phenotypes of different body regions. The present study represents an initial step toward this objective by establishing a foundation for future mechanistic studies of region-specific feather morphology.
6. Limitations of This Study
Our pathway analyses are primarily based on differential expression of ligands, receptors, and pathway modulators, together with predicted ligand–receptor interactions derived from CellChat. Because many of these signaling components are functionally redundant, these data do not directly measure pathway activity or signaling output. Therefore, the inferred pathway differences should be interpreted as candidate regional signaling features rather than definitive evidence of the whole controlling pathway. We hope future studies using pathway-specific reporters or other functional readouts will help clarify the causal roles of signaling activity across feather regions.
Our adult functional experiments revealed specific phenotypes, but viral injections were limited to flight feather follicles because follicles in most other tracts are too small for accurate injection and sufficient viral delivery. The future use of genetic tools, such as transgenic chicken models or AAV virus technology in birds, could overcome these limitations and advance the field.
Supplementary Materials
The following supporting information can be downloaded at: https://www.mdpi.com/article/10.3390/jdb14040046/s1, Figure S1: RNAscope analysis for FZD8, SOSTDC1, and LGR6 in E9 feather buds; Figure S2: RNAscope staining for FZD8, SOSTDC1, and LGR6 in the lower portion of adult feather follicles; Figure S3: Bulk and single-cell RNA-seq analyses of adult chicken feather follicles from different body regions; Figure S4: Ligand-Receptor pairs in short (contour) vs. long (Sickle) feathers; Figure S5: Functional study of FZD receptors in embryonic chicken feather development; Table S1: DEGs in feather groups.
Author Contributions
Conceptualization: P.W. and C.-M.C. Methodology: P.W., C.-M.C., J.L., S.-M.H.L. and C.-K.C. Investigation: P.W., G.-W.L., J.L., S.-M.H.L. and C.-K.C. Writing—original draft: P.W., C.-M.C. and J.L. Writing—review and editing: P.W., C.-M.C. and J.L. Project administration: P.W., C.-M.C. Funding acquisition: C.-M.C., Supervision: C.-M.C. and P.W. Resources: C.-M.C. All authors have read and agreed to the published version of the manuscript.
Funding
This work is supported by NIH grants RO1 AR 047364 and R35GM153402.
Institutional Review Board Statement
The animal study protocol was approved by the Institutional Animal Care and Use Committee (IACUC) of the University of Southern California (Protocol No. 11903; approved on 22 July 2024).
Informed Consent Statement
Not applicable.
Data Availability Statement
All data needed to evaluate the conclusions in the paper are present in the paper and/or the Supplementary Materials. The raw and processed bulk RNA-seq data have been deposited in the Gene Expression Omnibus (GEO) under accession number GSE341183. The CellChat analysis scripts can be found in the shared Google Drive link (https://drive.google.com/drive/folders/1Hb4dqtIDdvr93xiRPYH_9fvLB1arA57d?usp=sharing, accessed on 27 October 2026).
Acknowledgments
We thank all members of the Chuong laboratory for helpful discussions. We are also grateful to Randall Widelitz for assistance with English language editing.
Conflicts of Interest
The authors declare no conflicts of interest.
References
- Chuong, C.M.; Wu, P.; Yu, Z.; Liang, Y.-C.; Widelitz, R.B. Organizational principles of integumentary organs: Maximizing variations for effective adaptation. Dev. Biol. 2025, 522, 171–195. [Google Scholar] [CrossRef] [Scilit] [PubMed]
- Rinn, J.L.; Bondre, C.; Gladstone, H.B.; Brown, P.O.; Chang, H.Y. Anatomic demarcation by positional variation in fibroblast gene expression programs. PLoS Genet. 2006, 2, e119. [Google Scholar] [CrossRef] [Scilit] [PubMed]
- Rinn, J.L.; Wang, J.K.; Allen, N.; Brugmann, S.A.; Mikels, A.J.; Liu, H.; Ridky, T.W.; Stadler, H.S.; Nusse, R.; Helms, J.A.; et al. A dermal HOX transcriptional program regulates site-specific epidermal fate. Genes Dev. 2008, 22, 303–307. [Google Scholar] [CrossRef] [Scilit] [PubMed]
- Chen, C.-K.; Juan, W.-T.; Liang, Y.-C.; Wu, P.; Chuong, C.-M. Making region-specific integumentary organs in birds: Evolution and modifications. Curr. Opin. Genet. Dev. 2021, 69, 103–111. [Google Scholar] [CrossRef] [Scilit] [PubMed]
- Maderson, P.F.A.; Hillenius, W.J.; Hiller, U.; Dove, C.C. Towards a comprehensive model of feather regeneration. J. Morphol. 2009, 270, 1166–1208. [Google Scholar] [CrossRef] [Scilit] [PubMed]
- Prum, R.O.; Brush, A.H. The evolutionary origin and diversification of feathers. Q. Rev. Biol. 2002, 77, 261–295. [Google Scholar] [CrossRef] [Scilit] [PubMed]
- Wu, P.; Bocci, F.; Guerrero-Juarez, C.F.; Chen, C.-K.; Wang, G.; Liu, T.-Y.; Lu, J.; Li, S.-M.H.; Lai, Y.-C.; Jiang, T.-X.; et al. Regulation of feather length: FGF/IGF signaling and NOTCH/YAP modulation of progenitor cell topology. Sci. Adv. 2025, 11, eadw2382. [Google Scholar] [CrossRef] [PubMed]
- Chiappe, L.M. Downsized dinosaurs: The evolutionary transition to modern birds. Evol. Educ. Outreach 2009, 2, 248–256. [Google Scholar] [CrossRef] [Scilit]
- Benton, M.J.; Dhouailly, D.; Jiang, B.; McNamara, M. The early origin of feathers. Trends Ecol. Evol. 2019, 34, 856–869. [Google Scholar] [CrossRef] [Scilit] [PubMed]
- Yue, Z.; Jiang, T.-X.; Widelitz, R.B.; Chuong, C.-M. Mapping stem cell activities in the feather follicle. Nature 2005, 438, 1026–1029. [Google Scholar] [CrossRef] [Scilit] [PubMed]
- Xu, X.; Zhou, Z.; Dudley, R.; Mackem, S.; Chuong, C.-M.; Erickson, G.M.; Varricchio, D.J. An integrative approach to understanding bird origins. Science 2014, 346, 1253293. [Google Scholar] [CrossRef] [Scilit] [PubMed]
- Chuong, C.-M.; Yeh, C.-Y.; Jiang, T.-X.; Widelitz, R. Module-based complexity formation: Periodic patterning in feathers and hairs. Wiley Interdiscip. Rev. Dev. Biol. 2013, 2, 97–112. [Google Scholar] [CrossRef] [Scilit] [PubMed]
- Wu, P.; Yan, J.; Lai, Y.-C.; Ng, C.S.; Li, A.; Jiang, X.; Elsey, R.M.; Widelitz, R.; Bajpai, R.; Li, W.-H.; et al. Multiple Regulatory Modules Are Required for Scale-to-Feather Conversion. Mol. Biol. Evol. 2018, 35, 417–430. [Google Scholar] [CrossRef] [Scilit] [PubMed]
- Dhouailly, D.; Hardy, M.H.; Sengel, P. Formation of feathers on chick foot scales: A stage-dependent morphogenetic response to retinoic acid. J. Embryol. Exp. Morphol. 1980, 58, 63–78. [Google Scholar] [CrossRef] [Scilit]
- Widelitz, R.B.; Jiang, T.X.; Lu, J.; Chuong, C.M. beta-catenin in epithelial morphogenesis: Conversion of part of avian foot scales into feather buds with a mutated beta-catenin. Dev. Biol. 2000, 219, 98–114. [Google Scholar] [CrossRef] [Scilit] [PubMed]
- Crowe, R.; Niswander, L. Disruption of scale development by Delta-1 misexpression. Dev. Biol. 1998, 195, 70–74. [Google Scholar] [CrossRef] [Scilit] [PubMed]
- Zou, H.; Niswander, L. Requirement for BMP signaling in interdigital apoptosis and scale formation. Science 1996, 272, 738–741. [Google Scholar] [CrossRef] [Scilit] [PubMed]
- Cooper, R.L.; Milinkovitch, M.C. Transient agonism of the sonic hedgehog pathway triggers a permanent transition of skin appendage fate in the chicken embryo. Sci. Adv. 2023, 9, eadg9619. [Google Scholar] [CrossRef] [Scilit] [PubMed]
- Li, J.; Lee, M.-O.; Davis, B.W.; Wu, P.; Hsieh Li, S.-M.; Chuong, C.-M.; Andersson, L. The crest phenotype in domestic chicken is caused by a 197 bp duplication in the intron of HOXC10. G3 2021, 11, jkaa048, Correction in G3 2022, 12, jkab425. [Google Scholar] [CrossRef] [Scilit] [PubMed]
- Li, S.-M.H.; Liang, Y.-C.; Jiang, T.-X.; Jea, W.C.; Chen, C.-K.; Lu, J.; Núñez-León, D.; Yu, Z.; Lai, Y.-C.; Widelitz, R.B.; et al. Skin regional specification and higher-order HoxC regulation. Sci. Adv. 2025, 11, eado2223. [Google Scholar] [CrossRef] [Scilit] [PubMed]
- Wu, P.; Jiang, T.-X.; Suksaweang, S.; Widelitz, R.B.; Chuong, C.-M. Molecular shaping of the beak. Science 2004, 305, 1465–1466. [Google Scholar] [CrossRef] [Scilit] [PubMed]
- Duverger, O.; Morasso, M.I. Role of homeobox genes in the patterning, specification, and differentiation of ectodermal appendages in mammals. J. Cell. Physiol. 2008, 216, 337–346. [Google Scholar] [CrossRef] [Scilit] [PubMed]
- Schneider, M.R.; Schmidt-Ullrich, R.; Paus, R. The hair follicle as a dynamic miniorgan. Curr. Biol. 2009, 19, R132–R142. [Google Scholar] [CrossRef] [Scilit] [PubMed]
- Yu, Z.; Jiang, K.; Xu, Z.; Huang, H.; Qian, N.; Lu, Z.; Chen, D.; Di, R.; Yuan, T.; Du, Z.; et al. Hoxc-Dependent Mesenchymal Niche Heterogeneity Drives Regional Hair Follicle Regeneration. Cell Stem Cell 2018, 23, 487–500.e6. [Google Scholar] [CrossRef] [Scilit] [PubMed]
- Canto-Santos, J.; Ho, A.; Ferdinand, A.; Xu, M.; Millar, S. 0882 Patterning and regional specification of hairy skin. J. Investig. Dermatol. 2025, 145, S153. [Google Scholar] [CrossRef] [Scilit]
- Song, Y.; Boncompagni, A.C.; Kim, S.-S.; Gochnauer, H.R.; Zhang, Y.; Loots, G.G.; Wu, D.; Li, Y.; Xu, M.; Millar, S.E. Regional Control of Hairless versus Hair-Bearing Skin by Dkk2. Cell Rep. 2018, 25, 2981–2991.e3. [Google Scholar] [CrossRef] [Scilit] [PubMed]
- Lucas, A.M.; Stettenheim, P.R. Avian Anatomy: Integument; U.S. Agricultural Research Service: For sale by the Supt. of Docs.; U.S. G.P.O.: Washington, DC, USA, 1972.
- Yue, Z.; Jiang, T.-X.; Widelitz, R.B.; Chuong, C.-M. Wnt3a gradient converts radial to bilateral feather symmetry via topological arrangement of epithelia. Proc. Natl. Acad. Sci. USA 2006, 103, 951–955. [Google Scholar] [CrossRef] [Scilit] [PubMed]
- Yu, M.; Wu, P.; Widelitz, R.B.; Chuong, C.-M. The morphogenesis of feathers. Nature 2002, 420, 308–312. [Google Scholar] [CrossRef] [Scilit] [PubMed]
- Wu, P.; Jiang, T.-X.; Lei, M.; Chen, C.-K.; Hsieh Li, S.-M.; Widelitz, R.B.; Chuong, C.-M. Cyclic growth of dermal papilla and regeneration of follicular mesenchymal components during feather cycling. Development 2021, 148, dev198671. [Google Scholar] [CrossRef] [Scilit] [PubMed]
- Jung, H.S.; Francis-West, P.H.; Widelitz, R.B.; Jiang, T.X.; Ting-Berreth, S.; Tickle, C.; Wolpert, L.; Chuong, C.M. Local inhibitory action of BMPs and their relationships with activators in feather formation: Implications for periodic patterning. Dev. Biol. 1998, 196, 11–23. [Google Scholar] [CrossRef] [Scilit] [PubMed]
- Ho, W.K.W.; Freem, L.; Zhao, D.; Painter, K.J.; Woolley, T.E.; Gaffney, E.A.; McGrew, M.J.; Tzika, A.; Milinkovitch, M.C.; Schneider, P.; et al. Feather arrays are patterned by interacting signalling and cell density waves. PLoS Biol. 2019, 17, e3000132. [Google Scholar] [CrossRef] [Scilit] [PubMed]
- Cheng, D.; Yan, X.; Qiu, G.; Zhang, J.; Wang, H.; Feng, T.; Tian, Y.; Xu, H.; Wang, M.; He, W.; et al. Contraction of basal filopodia controls periodic feather branching via Notch and FGF signaling. Nat. Commun. 2018, 9, 1345. [Google Scholar] [CrossRef] [Scilit] [PubMed]
- Widelitz, R.B.; Jiang, T.X.; Noveen, A.; Chen, C.W.; Chuong, C.M. FGF induces new feather buds from developing avian skin. J. Investig. Dermatol. 1996, 107, 797–803. [Google Scholar] [CrossRef] [Scilit] [PubMed]
- Chang, C.-H.; Jiang, T.-X.; Lin, C.-M.; Burrus, L.W.; Chuong, C.-M.; Widelitz, R. Distinct Wnt members regulate the hierarchical morphogenesis of skin regions (spinal tract) and individual feathers. Mech. Dev. 2004, 121, 157–171. [Google Scholar] [CrossRef] [Scilit] [PubMed]
- Chodankar, R.; Chang, C.-H.; Yue, Z.; Jiang, T.-X.; Suksaweang, S.; Burrus, L.; Chuong, C.-M.; Widelitz, R. Shift of localized growth zones contributes to skin appendage morphogenesis: Role of the Wnt/beta-catenin pathway. J. Investig. Dermatol. 2003, 120, 20–26. [Google Scholar] [CrossRef] [Scilit] [PubMed]
- Love, M.I.; Huber, W.; Anders, S. Moderated estimation of fold change and dispersion for RNA-seq data with DESeq2. Genome Biol. 2014, 15, 550. [Google Scholar] [CrossRef] [Scilit] [PubMed]
- Jin, S.; Guerrero-Juarez, C.F.; Zhang, L.; Chang, I.; Ramos, R.; Kuan, C.-H.; Myung, P.; Plikus, M.V.; Nie, Q. Inference and analysis of cell-cell communication using CellChat. Nat. Commun. 2021, 12, 1088. [Google Scholar] [CrossRef] [Scilit] [PubMed]
- Brennan, K.; Gonzalez-Sancho, J.M.; Castelo-Soccio, L.A.; Howe, L.R.; Brown, A.M.C. Truncated mutants of the putative Wnt receptor LRP6/Arrow can stabilize beta-catenin independently of Frizzled proteins. Oncogene 2004, 23, 4873–4884. [Google Scholar] [CrossRef] [Scilit] [PubMed]
- Harn, H.I.-C.; Jiang, T.-X.; Huang, C.-H.; Juan, W.-T.; Liu, T.-Y.; Chuang, T.-C.; Liao, W.-C.; Wang, Y.; Li, J.; Weijer, C.J.; et al. Novel tissue mechanics-guided cellular flows drive the formation of feather follicles. EMBO J. 2026, 45, 3926–3953. [Google Scholar] [CrossRef] [Scilit] [PubMed]
- Prum, R.O. Evolution of the morphological innovations of feathers. J. Exp. Zool. B Mol. Dev. Evol. 2005, 304, 570–579. [Google Scholar] [CrossRef] [Scilit] [PubMed]
- Terrill, R.S.; Shultz, A.J. Feather function and the evolution of birds. Biol. Rev. Camb. Philos. Soc. 2023, 98, 540–566. [Google Scholar] [CrossRef] [Scilit] [PubMed]
Disclaimer/Publisher’s Note: The statements, opinions and data contained in all publications are solely those of the individual author(s) and contributor(s) and not of MDPI and/or the editor(s). MDPI and/or the editor(s) disclaim responsibility for any injury to people or property resulting from any ideas, methods, instructions or products referred to in the content. |
© 2026 by the authors. Licensee MDPI, Basel, Switzerland. This article is an open access article distributed under the terms and conditions of the Creative Commons Attribution (CC BY) license.