


Abstract
T Coronae Borealis (T CrB) is a symbiotic recurrent nova that is approaching its next thermonuclear eruption after a long super-active accretion state and a pre-eruption dip state. Flickering has been observed in T CrB for decades, but its amplitude in the red-optical TESS band and its dependence on accretion state have not yet been characterized using a homogeneous set of short-cadence space photometry. We analyze TESS Science Processing Operations Center light curves of T CrB obtained in Sectors 24, 25, 51, and 78. The primary measurements use the 120 s PDCSAP_FLUX products; agreement with independently detrended SAP_FLUX, 20 s products, and target-pixel checks demonstrates that the rapid signal is not created by Presearch Data Conditioning (PDC) processing or aperture contamination. After normalizing each light curve by its median flux, we remove slow sector-scale variability with a 0.5 d segment-wise smooth trend and measure the excess fractional rms variability, binned rms amplitudes, residual distributions, and power spectral densities. TESS detects millimagnitude-level stochastic variability in all four sectors. The total-light excess fractional rms values are , , , and per cent in Sectors 24, 25, 51, and 78, respectively, equivalent to 2.96, 3.00, 3.45, and 2.33 mmag. The power spectral densities are red-noise-like, with slopes from to over . The largest TESS-band flickering amplitude occurs in Sector 51, while the lowest occurs in Sector 78, observed in May 2024 after the end of the 2015–2023 super-active state and after the main pre-eruption dip. The persistence of flickering in Sector 78 shows that rapidly variable accretion continued, but the reduced amplitude indicates that the red-optical variable component was weaker, more diluted by the red giant, or geometrically altered. Because the TESS passband is dominated by the cool giant, the intrinsic fractional variability of the accretion component must be larger than the observed total-light values.
1. Introduction
Among Galactic symbiotic binaries, T Coronae Borealis (T CrB; HR 5958; HD 143454) is exceptionally nearby and has an unusually extensive observational record. It is the closest known recurrent nova (RN)1, and its interacting components are a cool giant and a massive white dwarf (WD). The two securely documented nova eruptions, in 1866 and 1946, each rose to about mag [4]. Nearly eight decades have elapsed since the 1946 eruption, and the system has therefore become a key target for studies of nova recurrence, pre-eruption accretion activity, and the final approach to thermonuclear runaway [5,6,7,8,9,10,11,12].
Its binary configuration also makes T CrB a valuable test case for accretion in symbiotic RN systems. The red-giant donor is close to filling its Roche lobe and revolves with –227.58 d; tidal distortion of the giant produces a strong optical modulation near [13,14,15,16,17]. Current constraints place the giant radius at and the WD mass at , close to the Chandrasekhar limit [17,18,19]. Gaia early Data Release 3 (Gaia eDR3) implies a distance of pc2 [20]; this agrees with the independent value of approximately 914 pc reported by Schaefer [21].
The recent accretion history of T CrB has been unusually active. After decades of lower activity, the system entered a high or “super-active” accretion state around 2014–2015, reached maximum activity near 2016, and returned toward a lower state in 2023 [5,6,8,9,11,15,16,22,23,24,25,26,27,28,29]. This was followed by a pronounced optical/ultraviolet (UV) fading episode, often referred to as the pre-eruption dip [10,30,31,32]. These changes imply that T CrB should not be treated as a stationary flickering source: its short-timescale variability may depend on the long-term accretion state. Recent timing work further shows that the active phases are not robustly locked to orbital phase [33], supporting an interpretation in which the relevant short-timescale variability is compared primarily across accretion states rather than at a single preferred binary phase.
Flickering is a direct observational signature of unstable accretion in WD binaries, occurring stochastically on timescales from seconds to hours [34,35]. Although rare among symbiotic stars, it is well established in T CrB [36,37]. Early high-speed photometry showed the largest amplitudes in the U band, typically –0.5 mag, with much weaker variability in B and V because of red-giant dilution; temporary non-detections also demonstrated that the flickering is state dependent [37,38,39].
Correcting for the red giant is therefore essential. Zamanov & Bruch [38] found that the red giant contributes only about 10 per cent of the mean U-band flux and concluded that the remaining flickering is cataclysmic variable (CV)-like and probably originates near the WD. From 27 nights of UBV and high-speed U-band photometry, Zamanov et al. [39] measured an average power spectral density (PSD) slope of and found that the flickering amplitude correlates with the accreting-component flux after giant subtraction.
Rapid stochastic variations have been detected from the optical and UV through the X-ray band, with characteristic timescales ranging from a few minutes to several hours (e.g., [15,22,23,26,29,39,40,41,42]). Earlier analyses by Schaefer [15] and Merc et al. [42] already identified optical flickering in the TESS observations from Sectors 24, 25, and 51. These observations have been interpreted in terms of turbulence in the inner disk and variability associated with the boundary layer [22,23,41]. More recent ground-based analyses found minute-to-hour quasi-periodic structures and an amplitude–flux connection [43], while 2024 UBV observations inferred hot-component luminosities of 19– and mass-accretion rates of ∼0.6– [44]. These results motivate a state-resolved comparison that extends the previous TESS work to Sector 78.
The TESS band is much redder than the classical U and B bands in which T CrB flickering has often been studied. Consequently, the TESS flickering amplitude is expected to be strongly diluted by the M-giant light, and the total-light fractional amplitude cannot be interpreted directly as the intrinsic fractional variability of the accretion source. However, TESS provides nearly uninterrupted high-cadence photometry over many days, which is difficult to obtain from the ground. It therefore offers a complementary view: rather than resolving the largest blue/UV flickering amplitudes, it enables a homogeneous measurement of low-amplitude red-optical flickering across different activity states.
In this paper we use TESS short-cadence photometry to measure the red-optical flickering of T CrB in Sectors 24, 25, 51, and 78. The observations sample super-active-state epochs in 2020 and 2022 and the post-dip state in 2024. Our aim is to quantify how the TESS-band flickering amplitude changes between these epochs and to test whether the result is robust against data-product choice, cadence, detrending prescription, and aperture contamination. The TESS observations and data reduction are detailed in Section 2; the variability measurements and validation tests are presented in Section 3 and Section 4; the interpretation and conclusions follow in Section 5 and Section 6.
2. TESS Observations and Data Reduction
T CrB was observed by the Transiting Exoplanet Survey Satellite (TESS) [45] in Sectors 24, 25, 51, and 78. We used Science Processing Operations Center (SPOC) light-curve products archived at the Mikulski Archive for Space Telescopes (MAST) [46]. The target is TIC 462607643, and the products were accessed with lightkurve [47]. Sectors 24 and 25 provide 120 s light curves, whereas Sectors 51 and 78 provide both 20 s and 120 s products. The 120 s products were adopted for the homogeneous primary analysis, and the 20 s products were retained for a cadence check. The observation log is given in Table 1.
Table 1.
TESS observation log for T CrB.
TESS has useful sensitivity over approximately 6000–10,000 Å [45]. Published optical spectral-energy distributions show that the red giant supplies a major red-optical contribution, particularly outside the high state [15,29]; however, no contemporaneous component-resolved TESS-band spectral-energy distribution is available for all four sectors. Ground-based work also shows that flickering is much stronger in the blue and ultraviolet than in B or V because the red-giant contribution increases toward longer wavelengths [37,38,39]. We therefore report total-light TESS-band amplitudes and do not assume a fixed numerical red-giant dilution correction. Nearby-source contamination is a separate issue and is evaluated with the target-pixel images in Section 4.4.
For each product we read TIME, SAP_FLUX, SAP_FLUX_ERR, PDCSAP_FLUX, PDCSAP_FLUX_ ERR, and QUALITY. We first retained finite measurements with QUALITY = 0 and then calculated the sector median used for normalization. The barycentric time is expressed as in the correct format in the text.
where BTJD is TESS Barycentric Julian Date, BJD is Barycentric Julian Date, and TDB is Barycentric Dynamical Time. We adopted the 120 s PDCSAP_FLUX products for the primary analysis because they provide a homogeneous set of light curves in which common spacecraft- and detector-related systematics have been corrected by the SPOC Presearch Data Conditioning procedure [46,48,49,50]. Our analysis concerns the detrended minute-to-hour variability rather than the sector-scale light-curve morphology. Nevertheless, PDC processing can modify genuine long-timescale astrophysical variations. We therefore repeated the complete detrending and excess-rms analysis using SAP_FLUX. The close agreement between the independently detrended SAP and PDCSAP amplitudes demonstrates that the measured short-timescale flickering and its sector-to-sector evolution are not created by the PDC correction.
Each light curve was normalized by its own median flux. We then divided the normalized flux by a smooth local trend to remove slow variations on timescales longer than the flickering of interest. This follows the usual approach in high-speed flickering studies, in which slow orbital, atmospheric, or secular variations are removed before quantifying the stochastic component (e.g., [34,39]). The data were first split at gaps longer than 0.2 d. Within each continuous segment we computed a 0.5 d smooth trend, using a second-order Savitzky–Golay filter [51] when the segment length was sufficient and a rolling median interpolation for short or edge-affected segments. The baseline detrended residual was then defined as
where is the median-normalized flux, and is the smooth trend at cadence i. In the figures and tables we often quote , that is, the residual in per cent. Points deviating by more than eight median absolute deviations from the median residual were rejected to prevent isolated outliers from dominating the rms and periodogram measurements.
The primary 120 s Sector 51 light curve contains an 8.12 d gap between BTJD 2704.70 and 2712.82 and an offset between the two surviving segments. The Sector 51 release notes document strong Earth/Moon scattered light and unusually large gaps in this sector [52]. Inspection of SAP and PDCSAP products shows that the abrupt inter-segment step is a processing/calibration discontinuity rather than a plausible stellar change. It is also too abrupt to represent the 113.8 d ellipsoidal modulation. Because we split the data at gaps and determine the trend separately in each continuous segment, this step does not enter the short-timescale measurement.
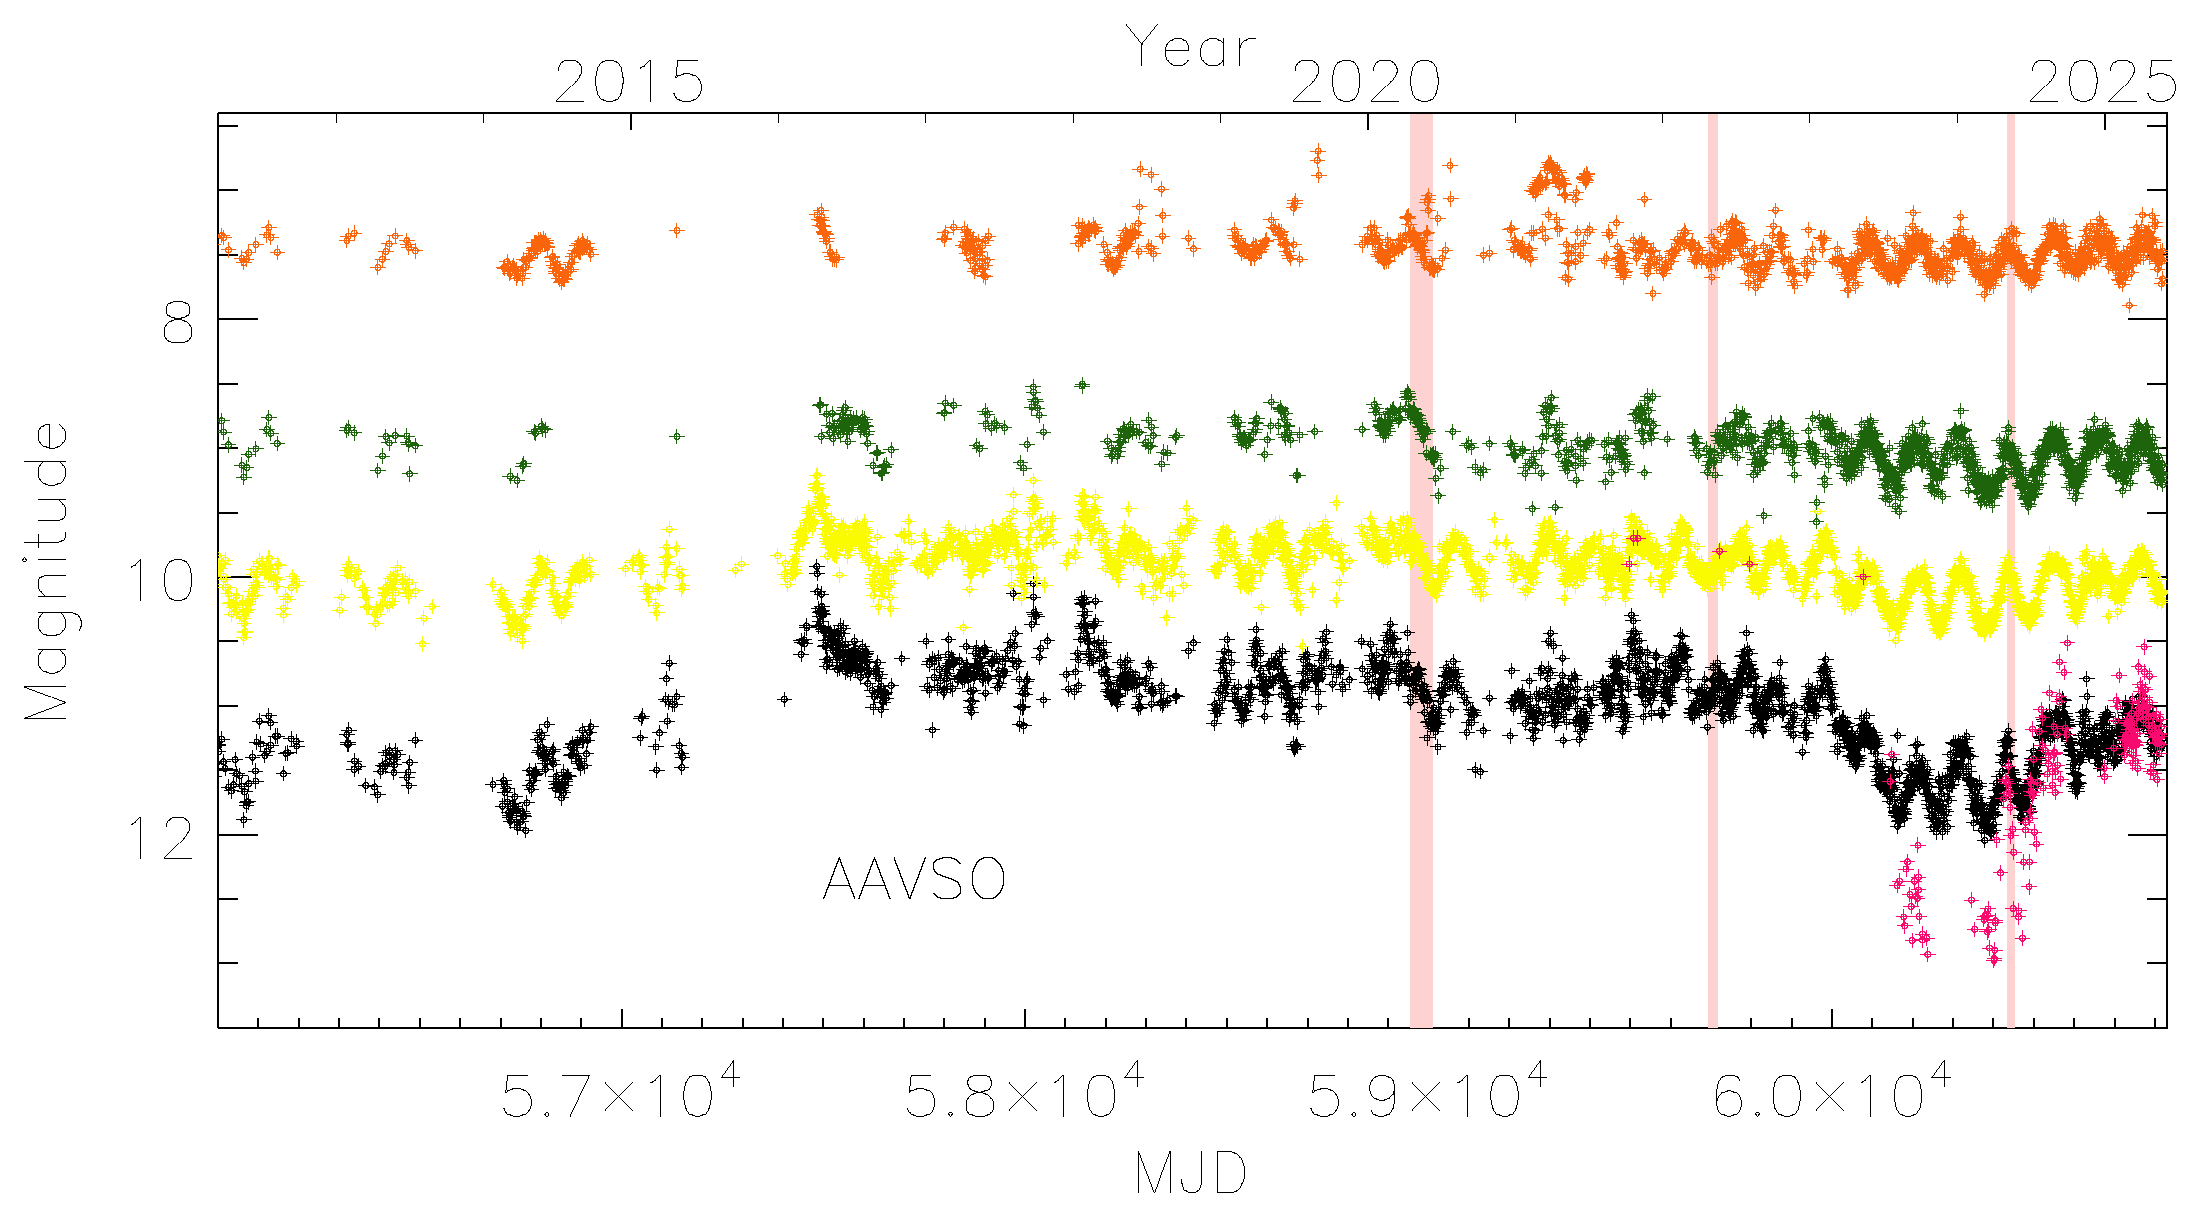
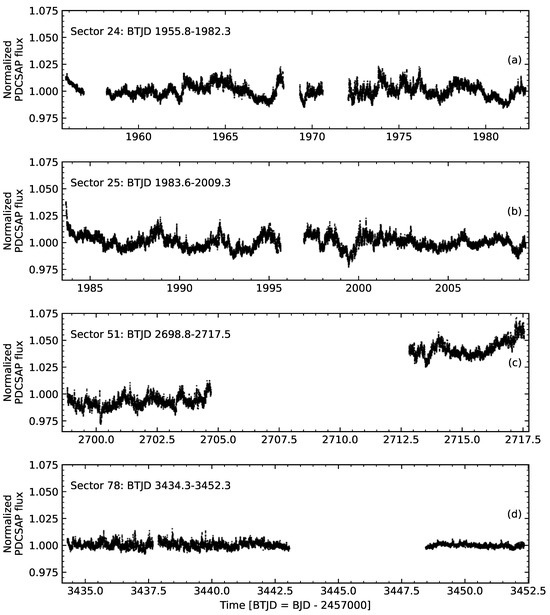
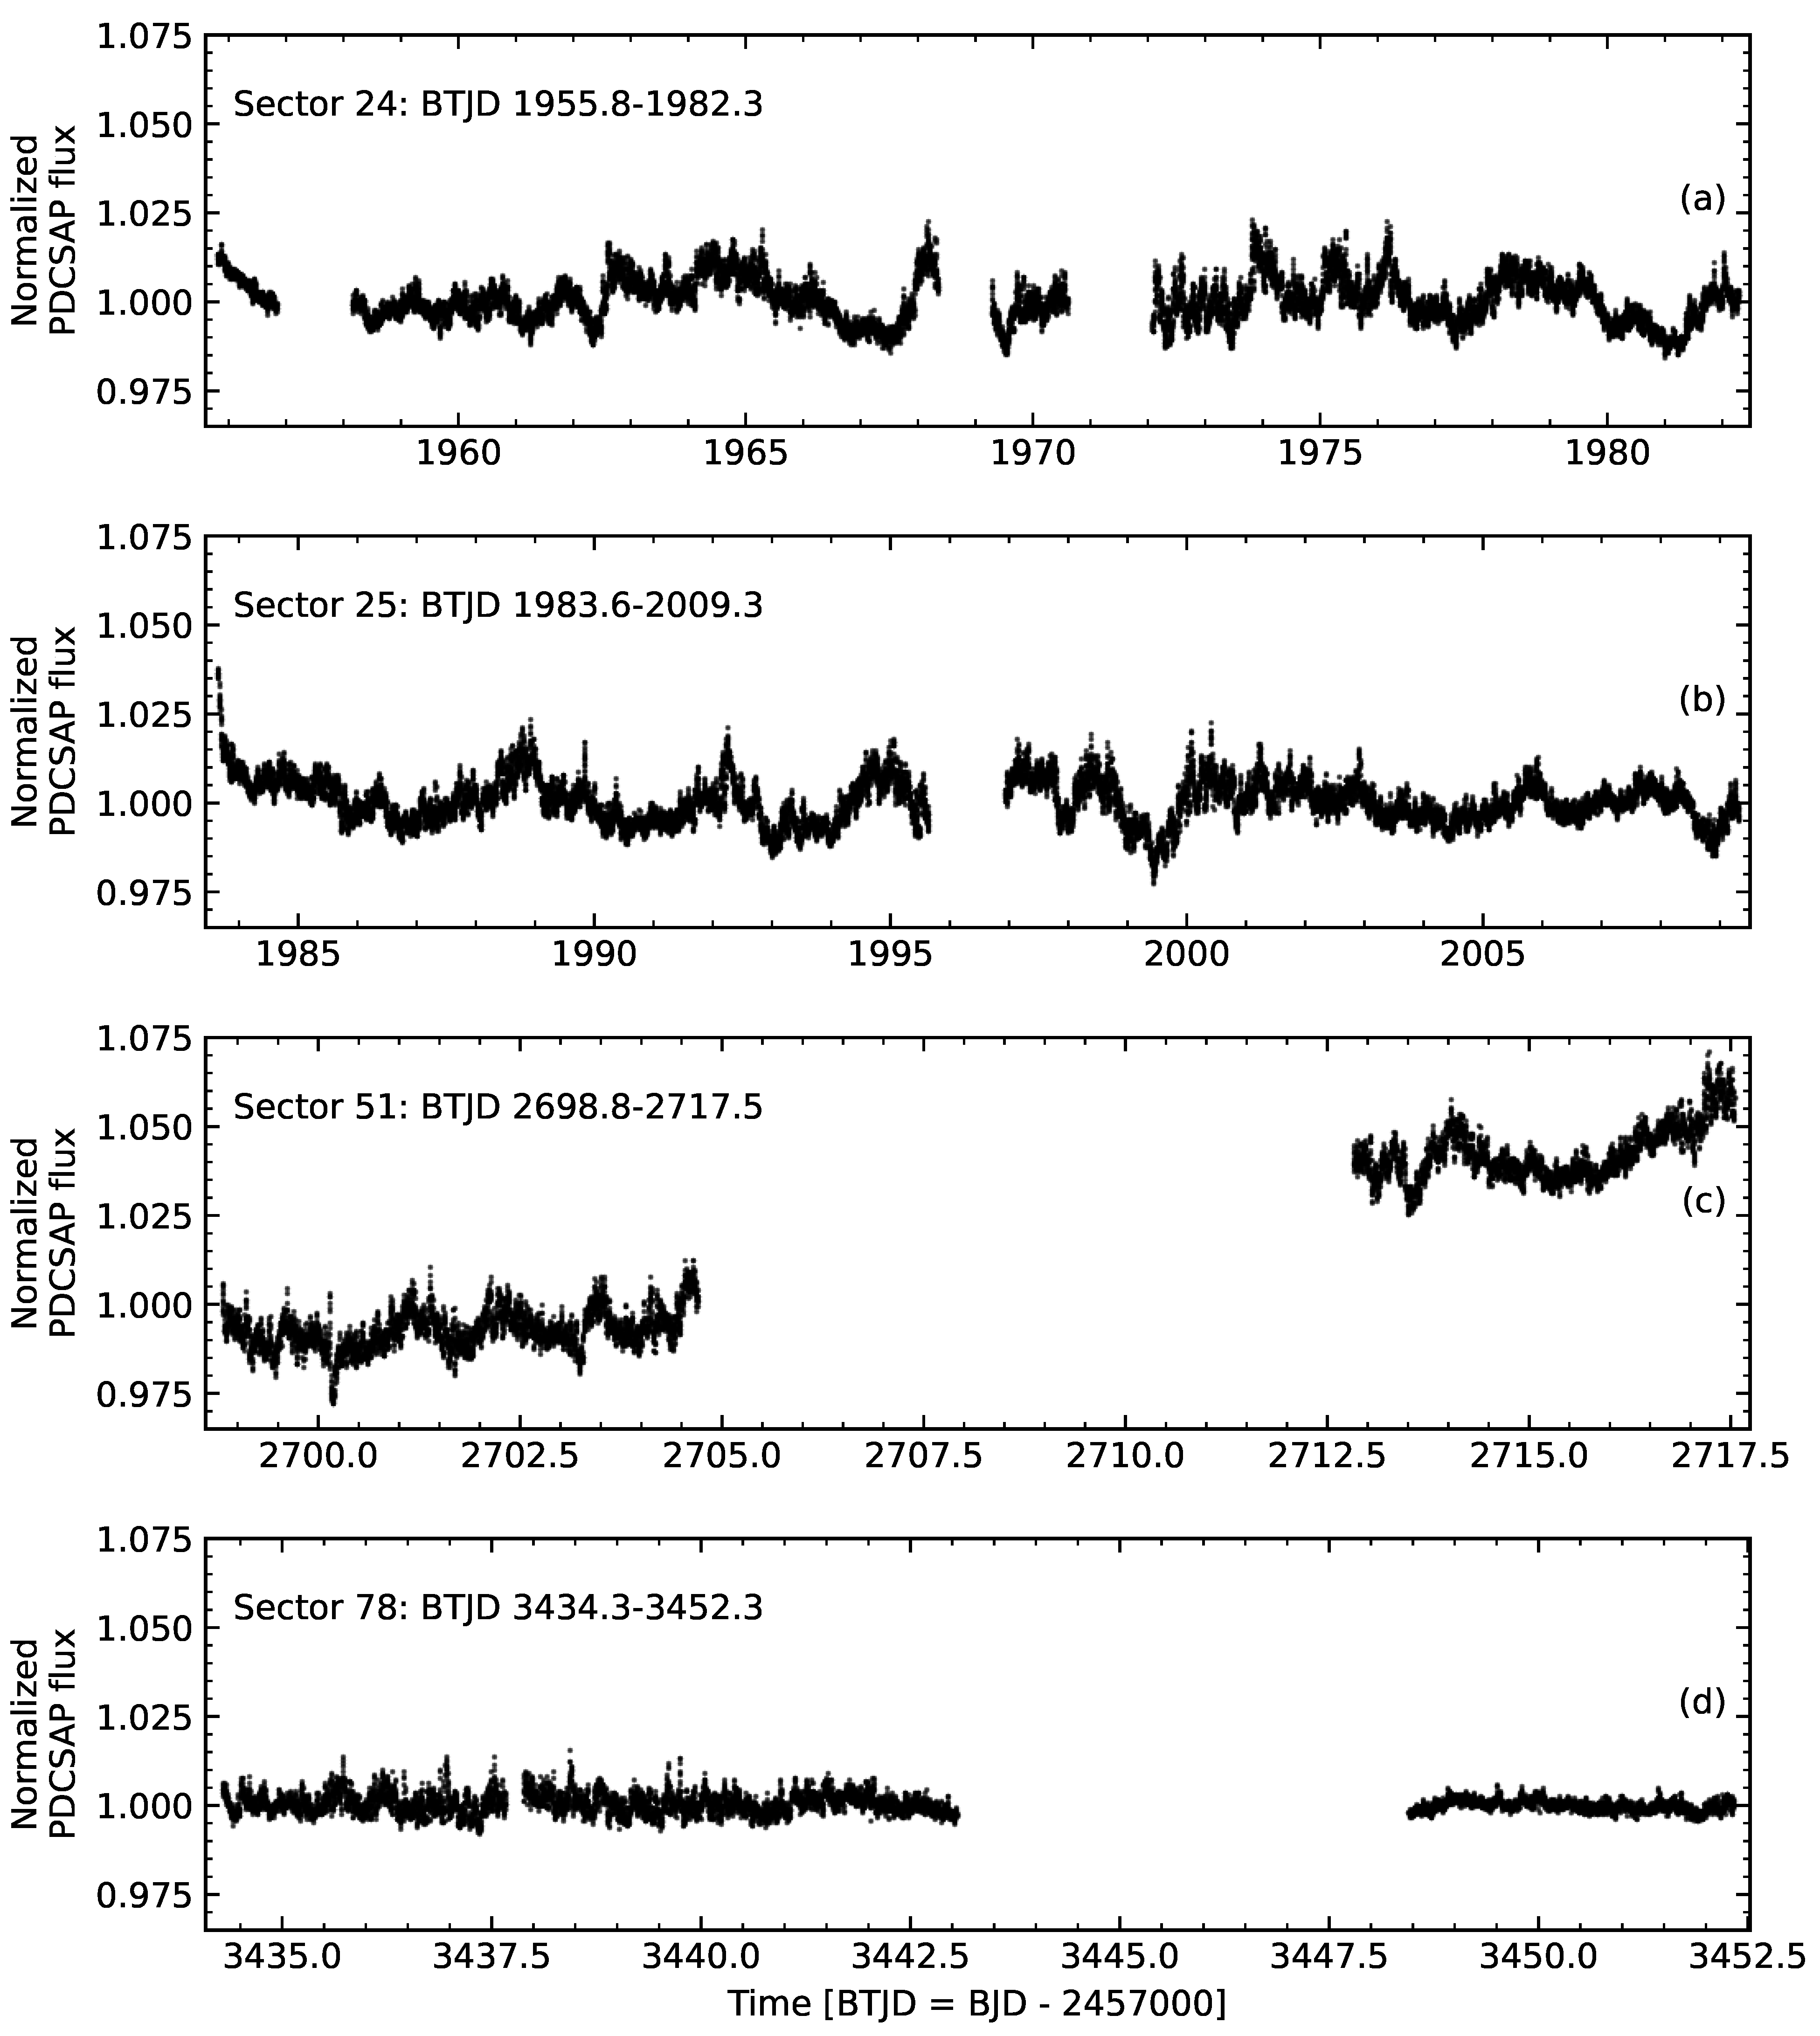
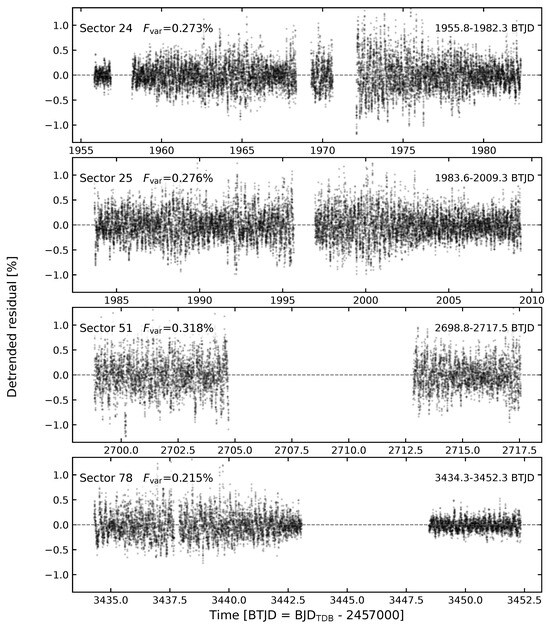
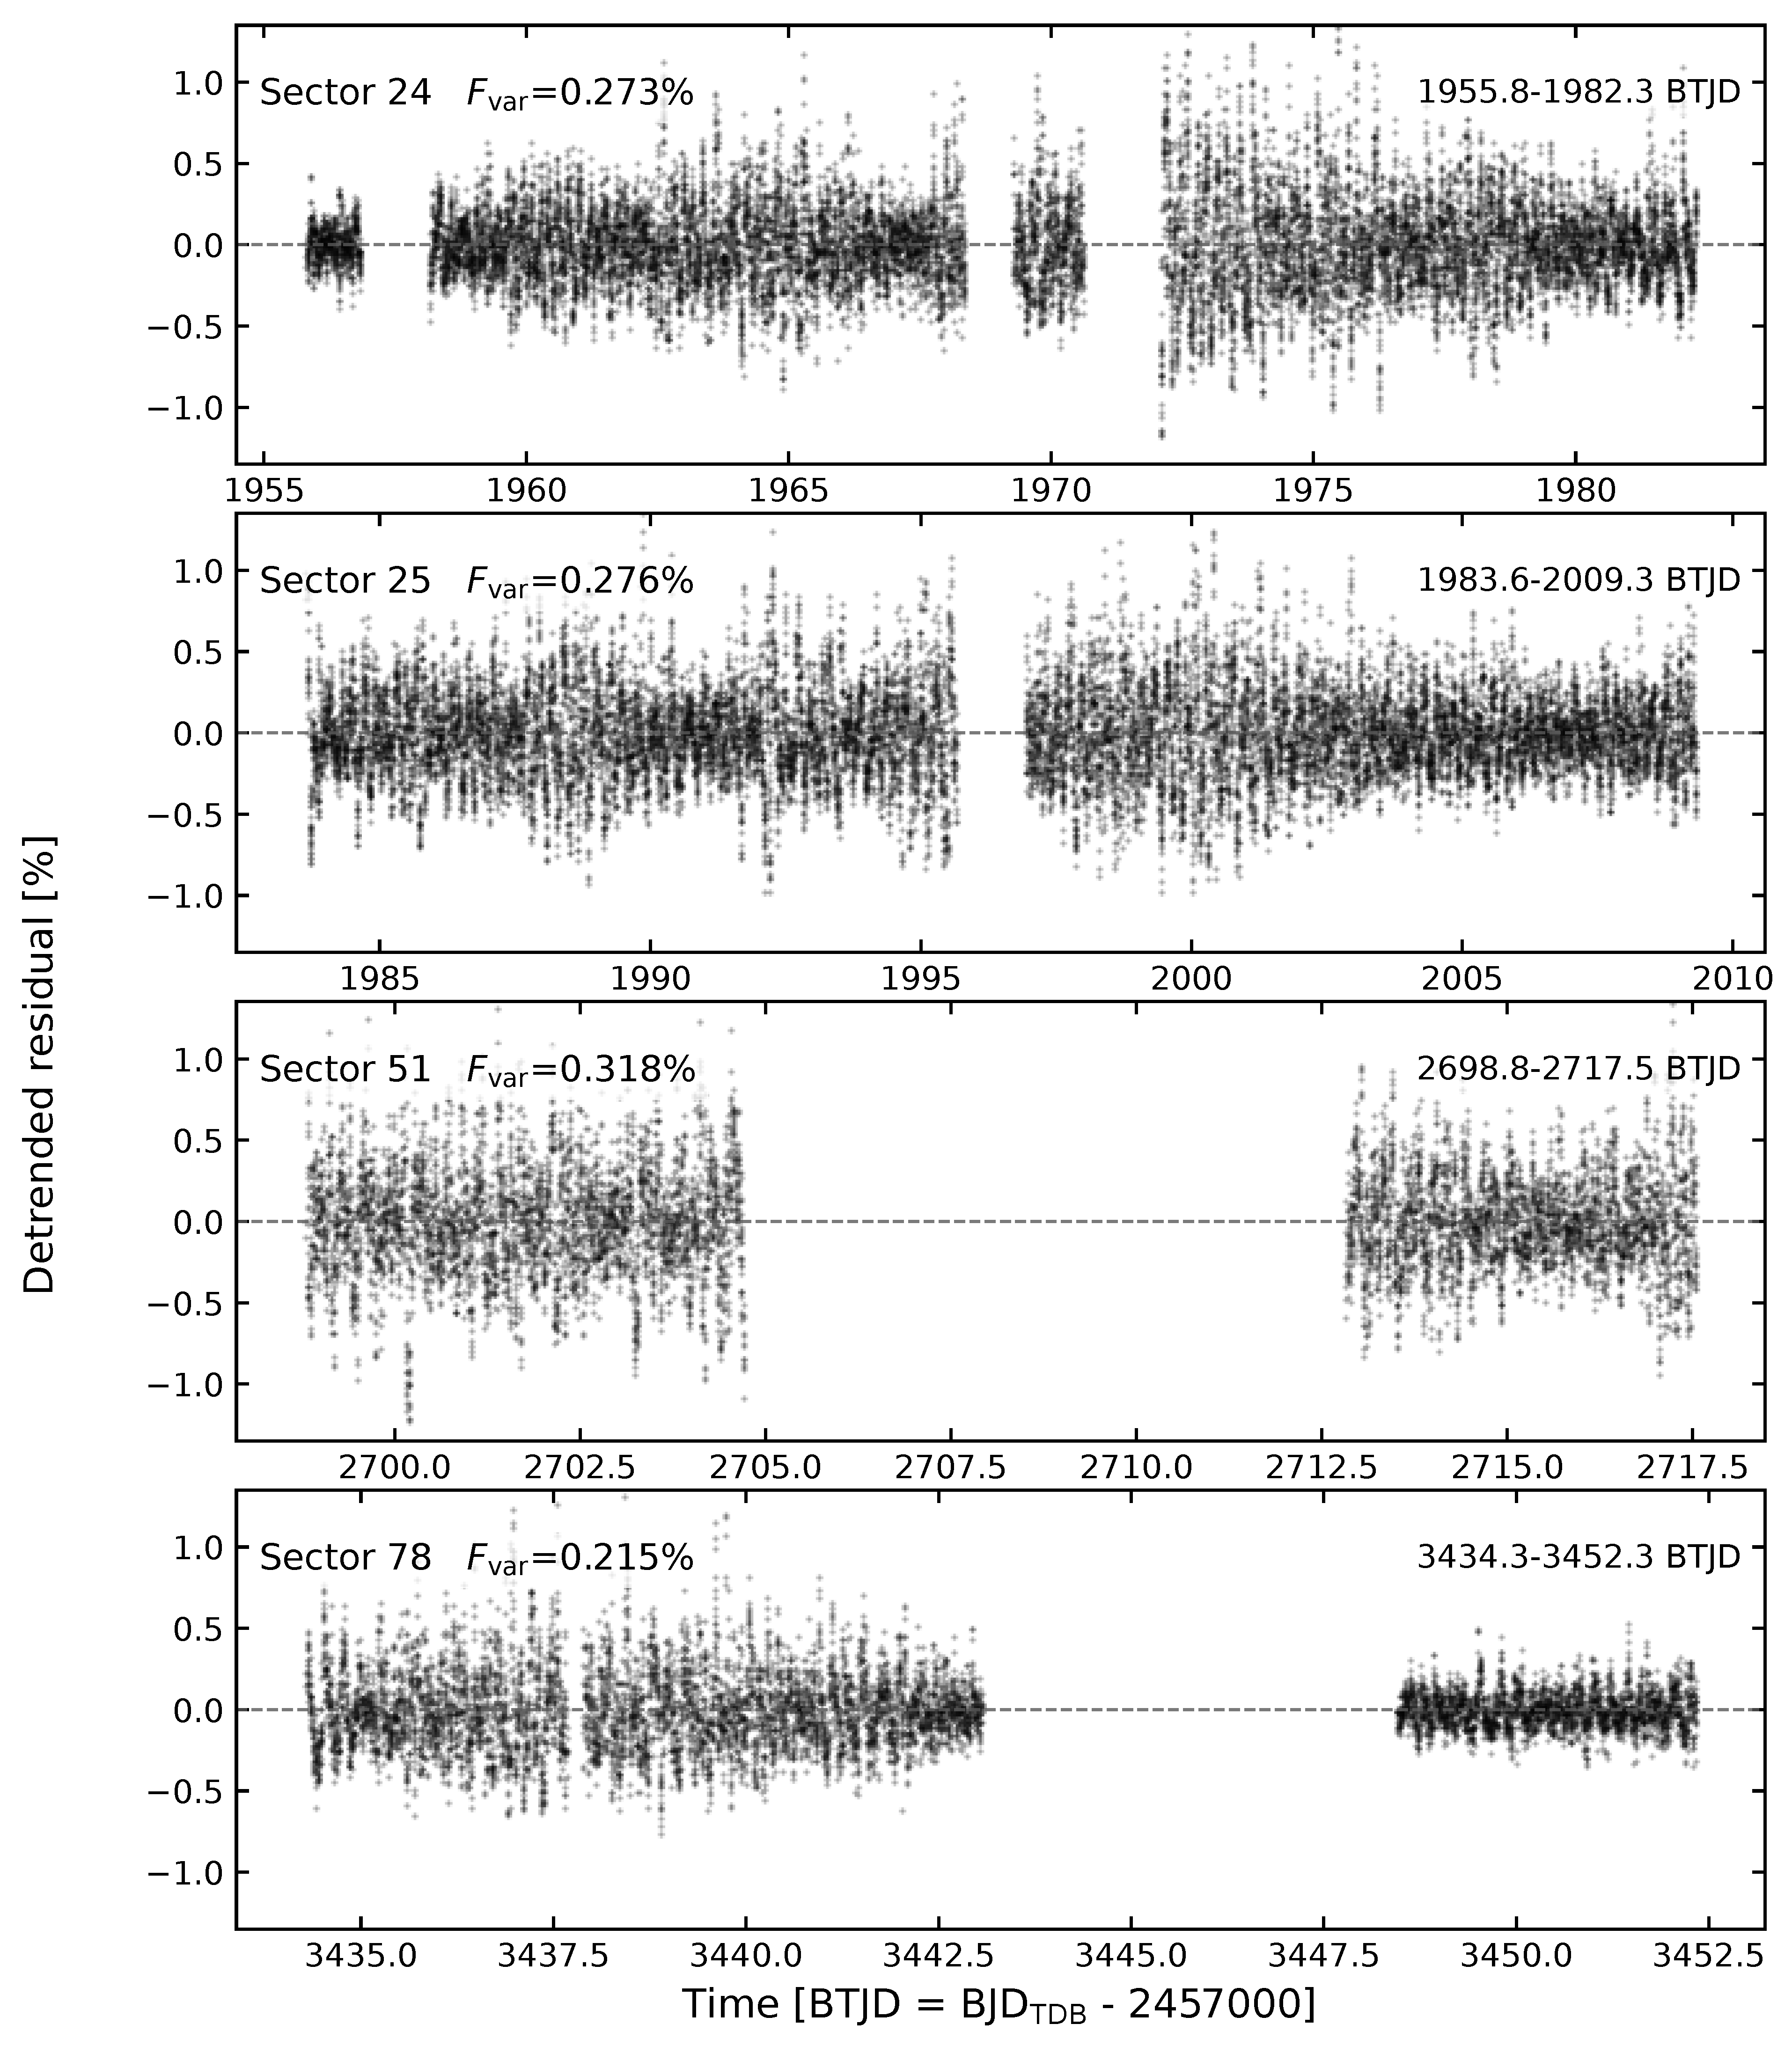
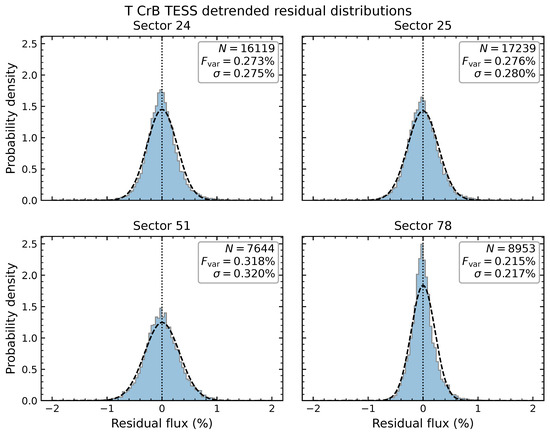
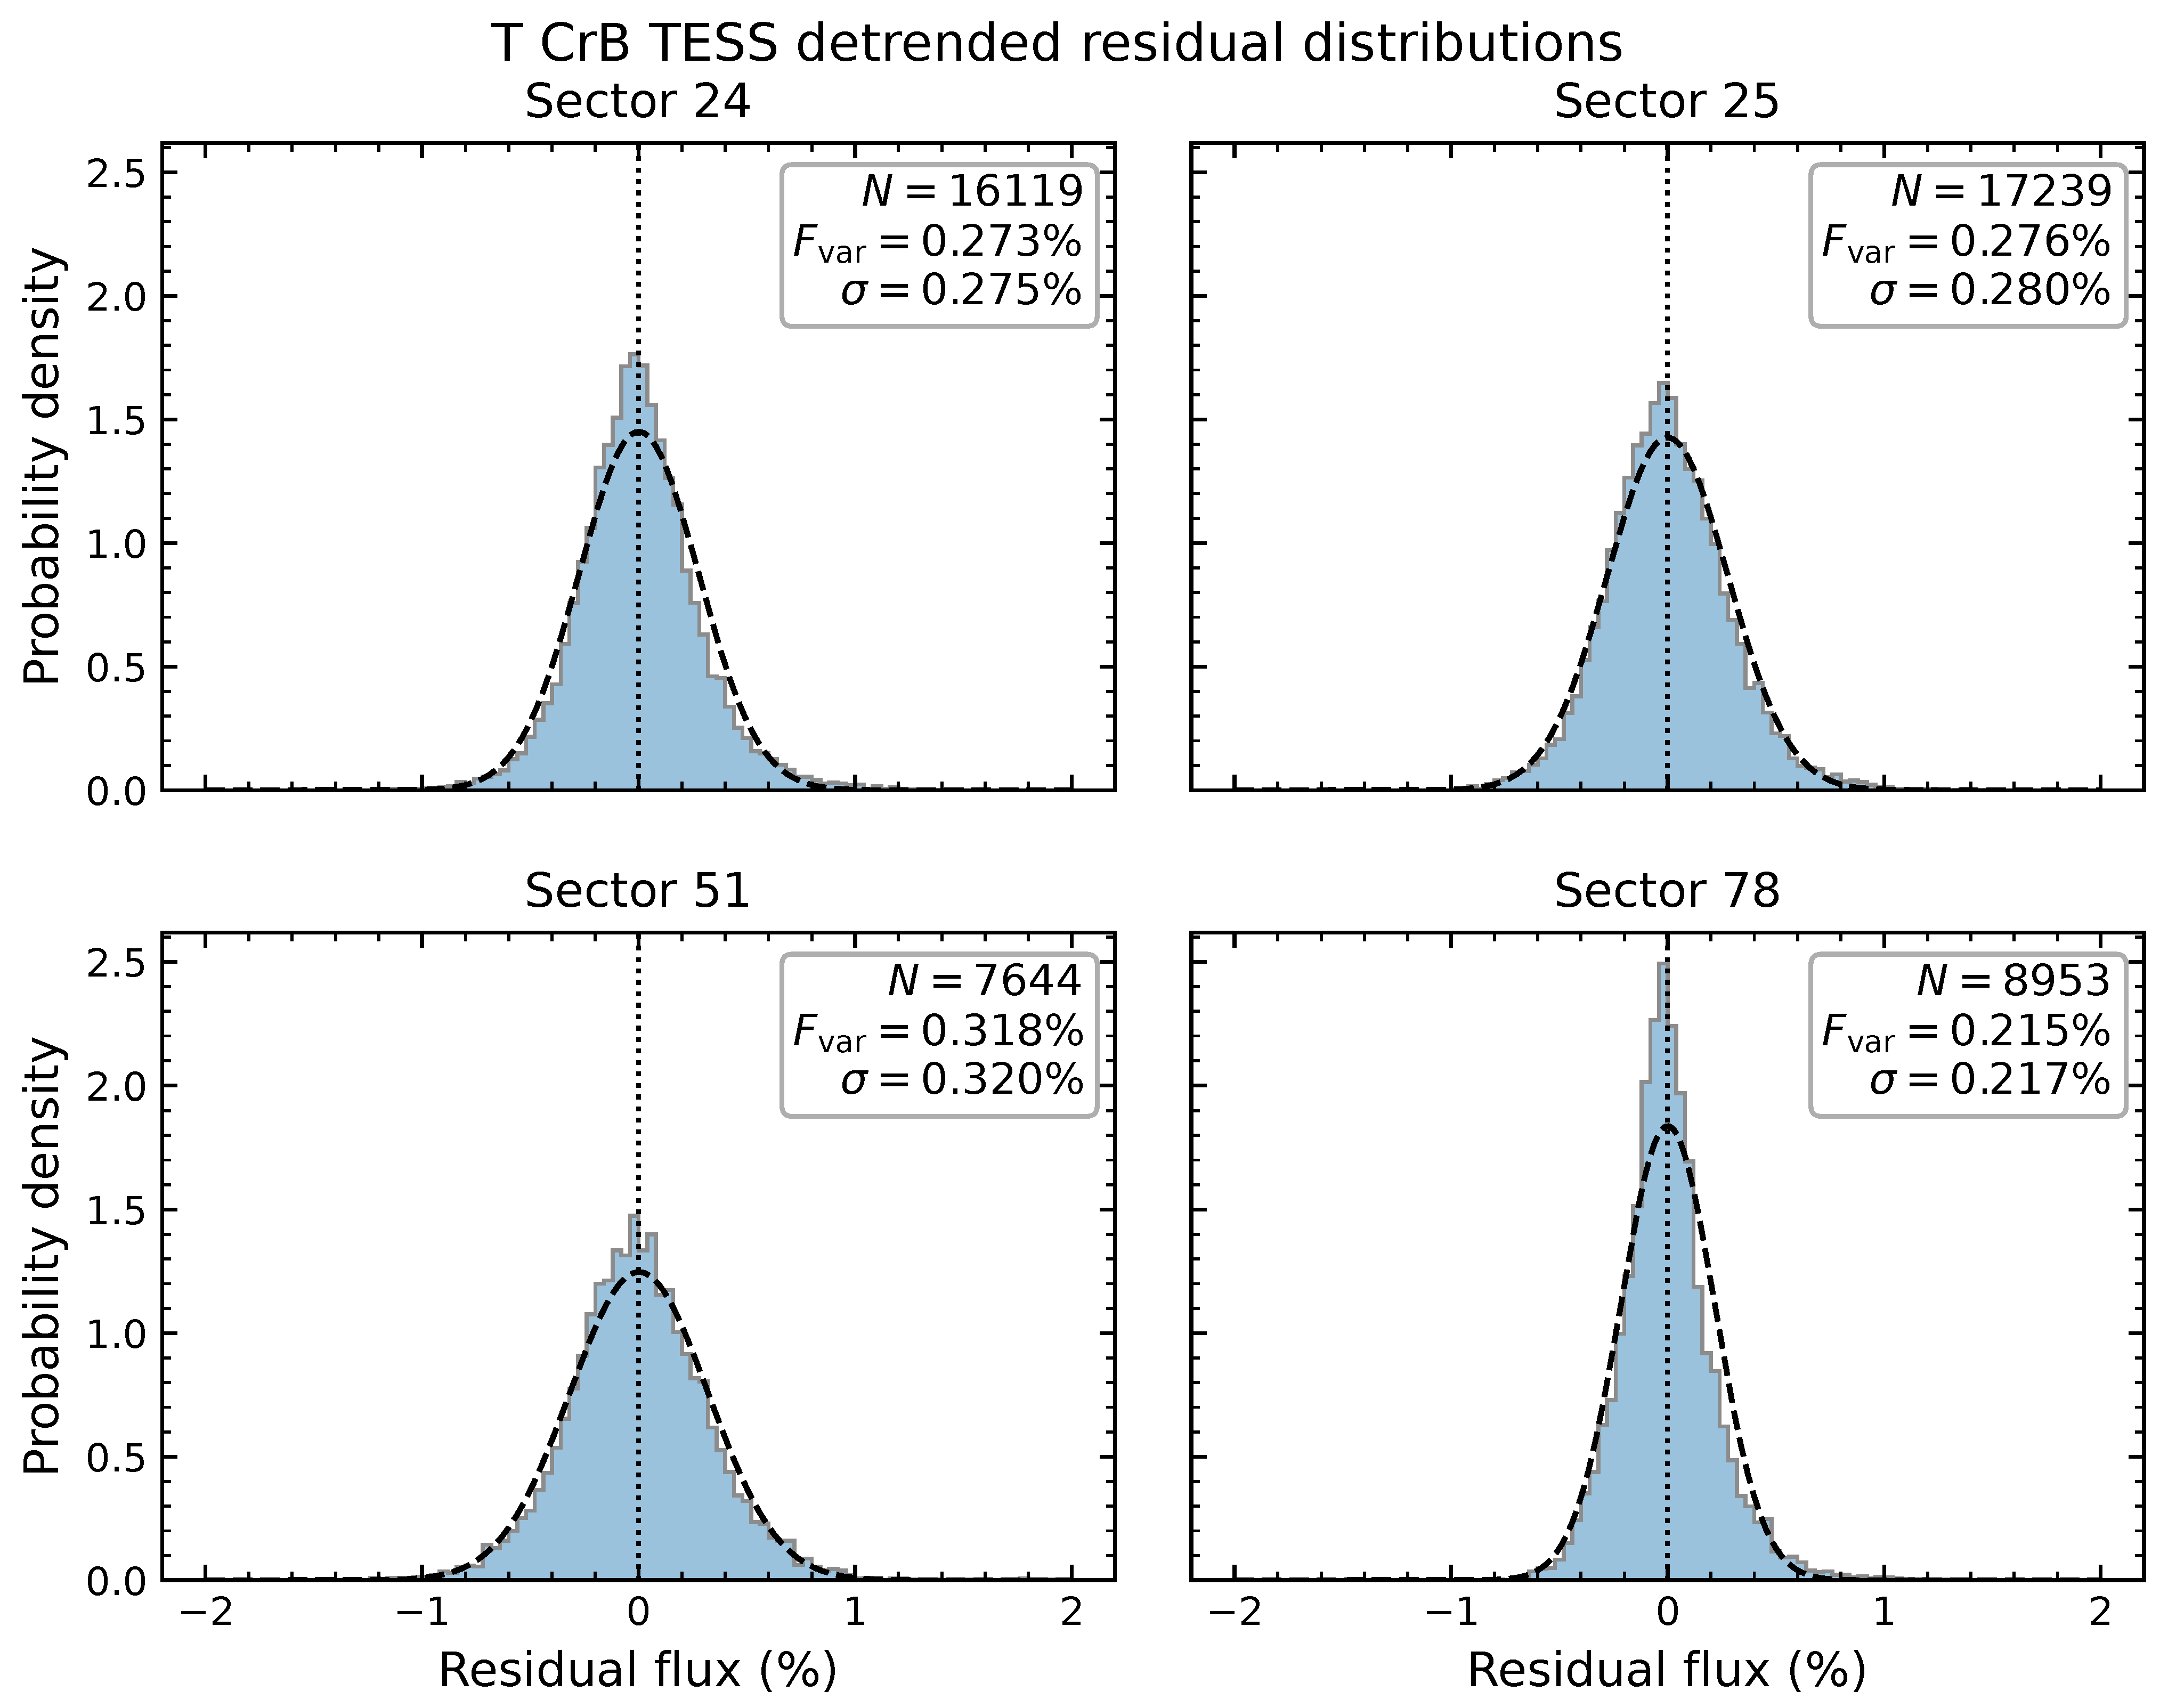
We retrieved all publicly available photometric observations of T CrB in the U, B, V, R, and I bands from the American Association of Variable Star Observers (AAVSO) International Database. The data span Modified Julian Date (MJD) 56,000–60,830 and place the four TESS observing intervals in their long-term optical context. The resulting AAVSO light curves are shown in Figure 1. The resulting sector light curves are shown in Figure 2. The detrending removes the slow sector-scale variability and isolates the short-timescale stochastic component, as shown in Figure 3. The residual distributions are summarized in Figure 4.
Figure 1.
Long-term multiband optical evolution of T CrB from March 2012 to June 2025 (MJD 56,000–60,830), based on AAVSO photometry in the I (green), R (orange), V (yellow), B (black), and U (red) bands. The red-shaded intervals mark the observing windows of TESS Sectors 24, 25, 51, and 78. These light curves place the red-optical TESS flickering measurements in the context of the optical state of the system at each epoch.
Figure 2.
TESS SPOC light curves of T CrB in Sectors 24, 25, 51, and 78. The plotted fluxes are quality-filtered 120 s PDCSAP_FLUX measurements normalized by the median flux in each sector. The same vertical scale is used in all panels to facilitate comparison of the sector-to-sector variability. The apparent Sector 51 inter-segment step occurs across an 8.12 d data gap and is treated as a processing/calibration discontinuity; each segment is detrended independently. The 2022 Sector 51 light curve shows the largest long-timescale change, while the 2024 Sector 78 light curve is comparatively flat in the TESS band.
Figure 3.
Detrended TESS residual light curves of T CrB in Sectors 24, 25, 51, and 78. The plotted data are quality-filtered 120 s SPOC PDCSAP_FLUX measurements. For each sector, the light curve was normalized by its median flux and divided by a 0.5 d segment-wise smooth trend. The residuals are defined as . The dashed horizontal line marks zero residual. The annotated values give the excess fractional rms variability after subtracting the mean squared photometric uncertainty.
Figure 4.
Histograms of the detrended TESS residual fluxes of T CrB in Sectors 24, 25, 51, and 78. The residuals are defined as , where is the median-normalized 120 s SPOC PDCSAP_FLUX light curve, and is the 0.5 d segment-wise smooth trend. All panels use the same binning and horizontal scale. The vertical dotted line marks zero residual, and the dashed curve shows a Gaussian profile with the measured mean and standard deviation in each sector.
3. Flickering Analysis
Flickering is commonly used as an observational tracer of accretion in white-dwarf binaries. It is generally described as stochastic, aperiodic variability on timescales from seconds or minutes to hours, with amplitudes that depend on passband, accretion state, and the relative contribution of steady light sources [34,35,36]. In symbiotic stars, rapid optical flickering is observed only in a minority of systems, but T CrB is one of the best established examples [36,37,39]. Previous studies of T CrB found strong U-band flickering, smaller amplitudes at longer optical wavelengths, a power-law-like Fourier spectrum, and an amplitude–flux relation after subtracting the red-giant contribution [38,39,43]. Our analysis applies the same physical idea to TESS. We use PDCSAP for the homogeneous primary measurement, while Section 4.1 verifies with independently detrended SAP data that the short-timescale amplitudes are not introduced by PDC processing.
3.1. Excess Fractional Rms
We quantified the flickering amplitude using the excess fractional rms variability of the detrended residual light curve, following the normalized-excess-variance formalism commonly used for stochastic astrophysical time series [53,54]. For a set of N residuals with residual uncertainties , we computed
where
is the sample variance of the residuals, and is the mean squared residual uncertainty. The uncertainty of each residual was propagated from the flux error as
where is the SPOC flux uncertainty, and is the sector median flux used for normalization. We quote in per cent. The corresponding small-amplitude rms in magnitudes was estimated as
where is expressed as a fraction.
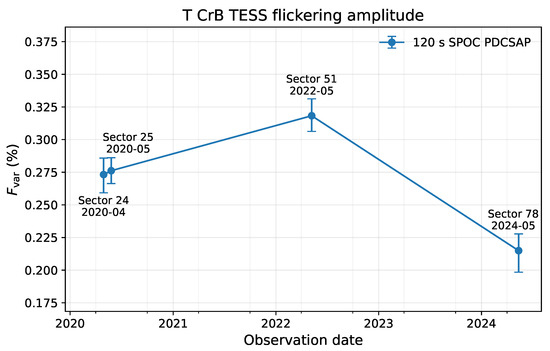
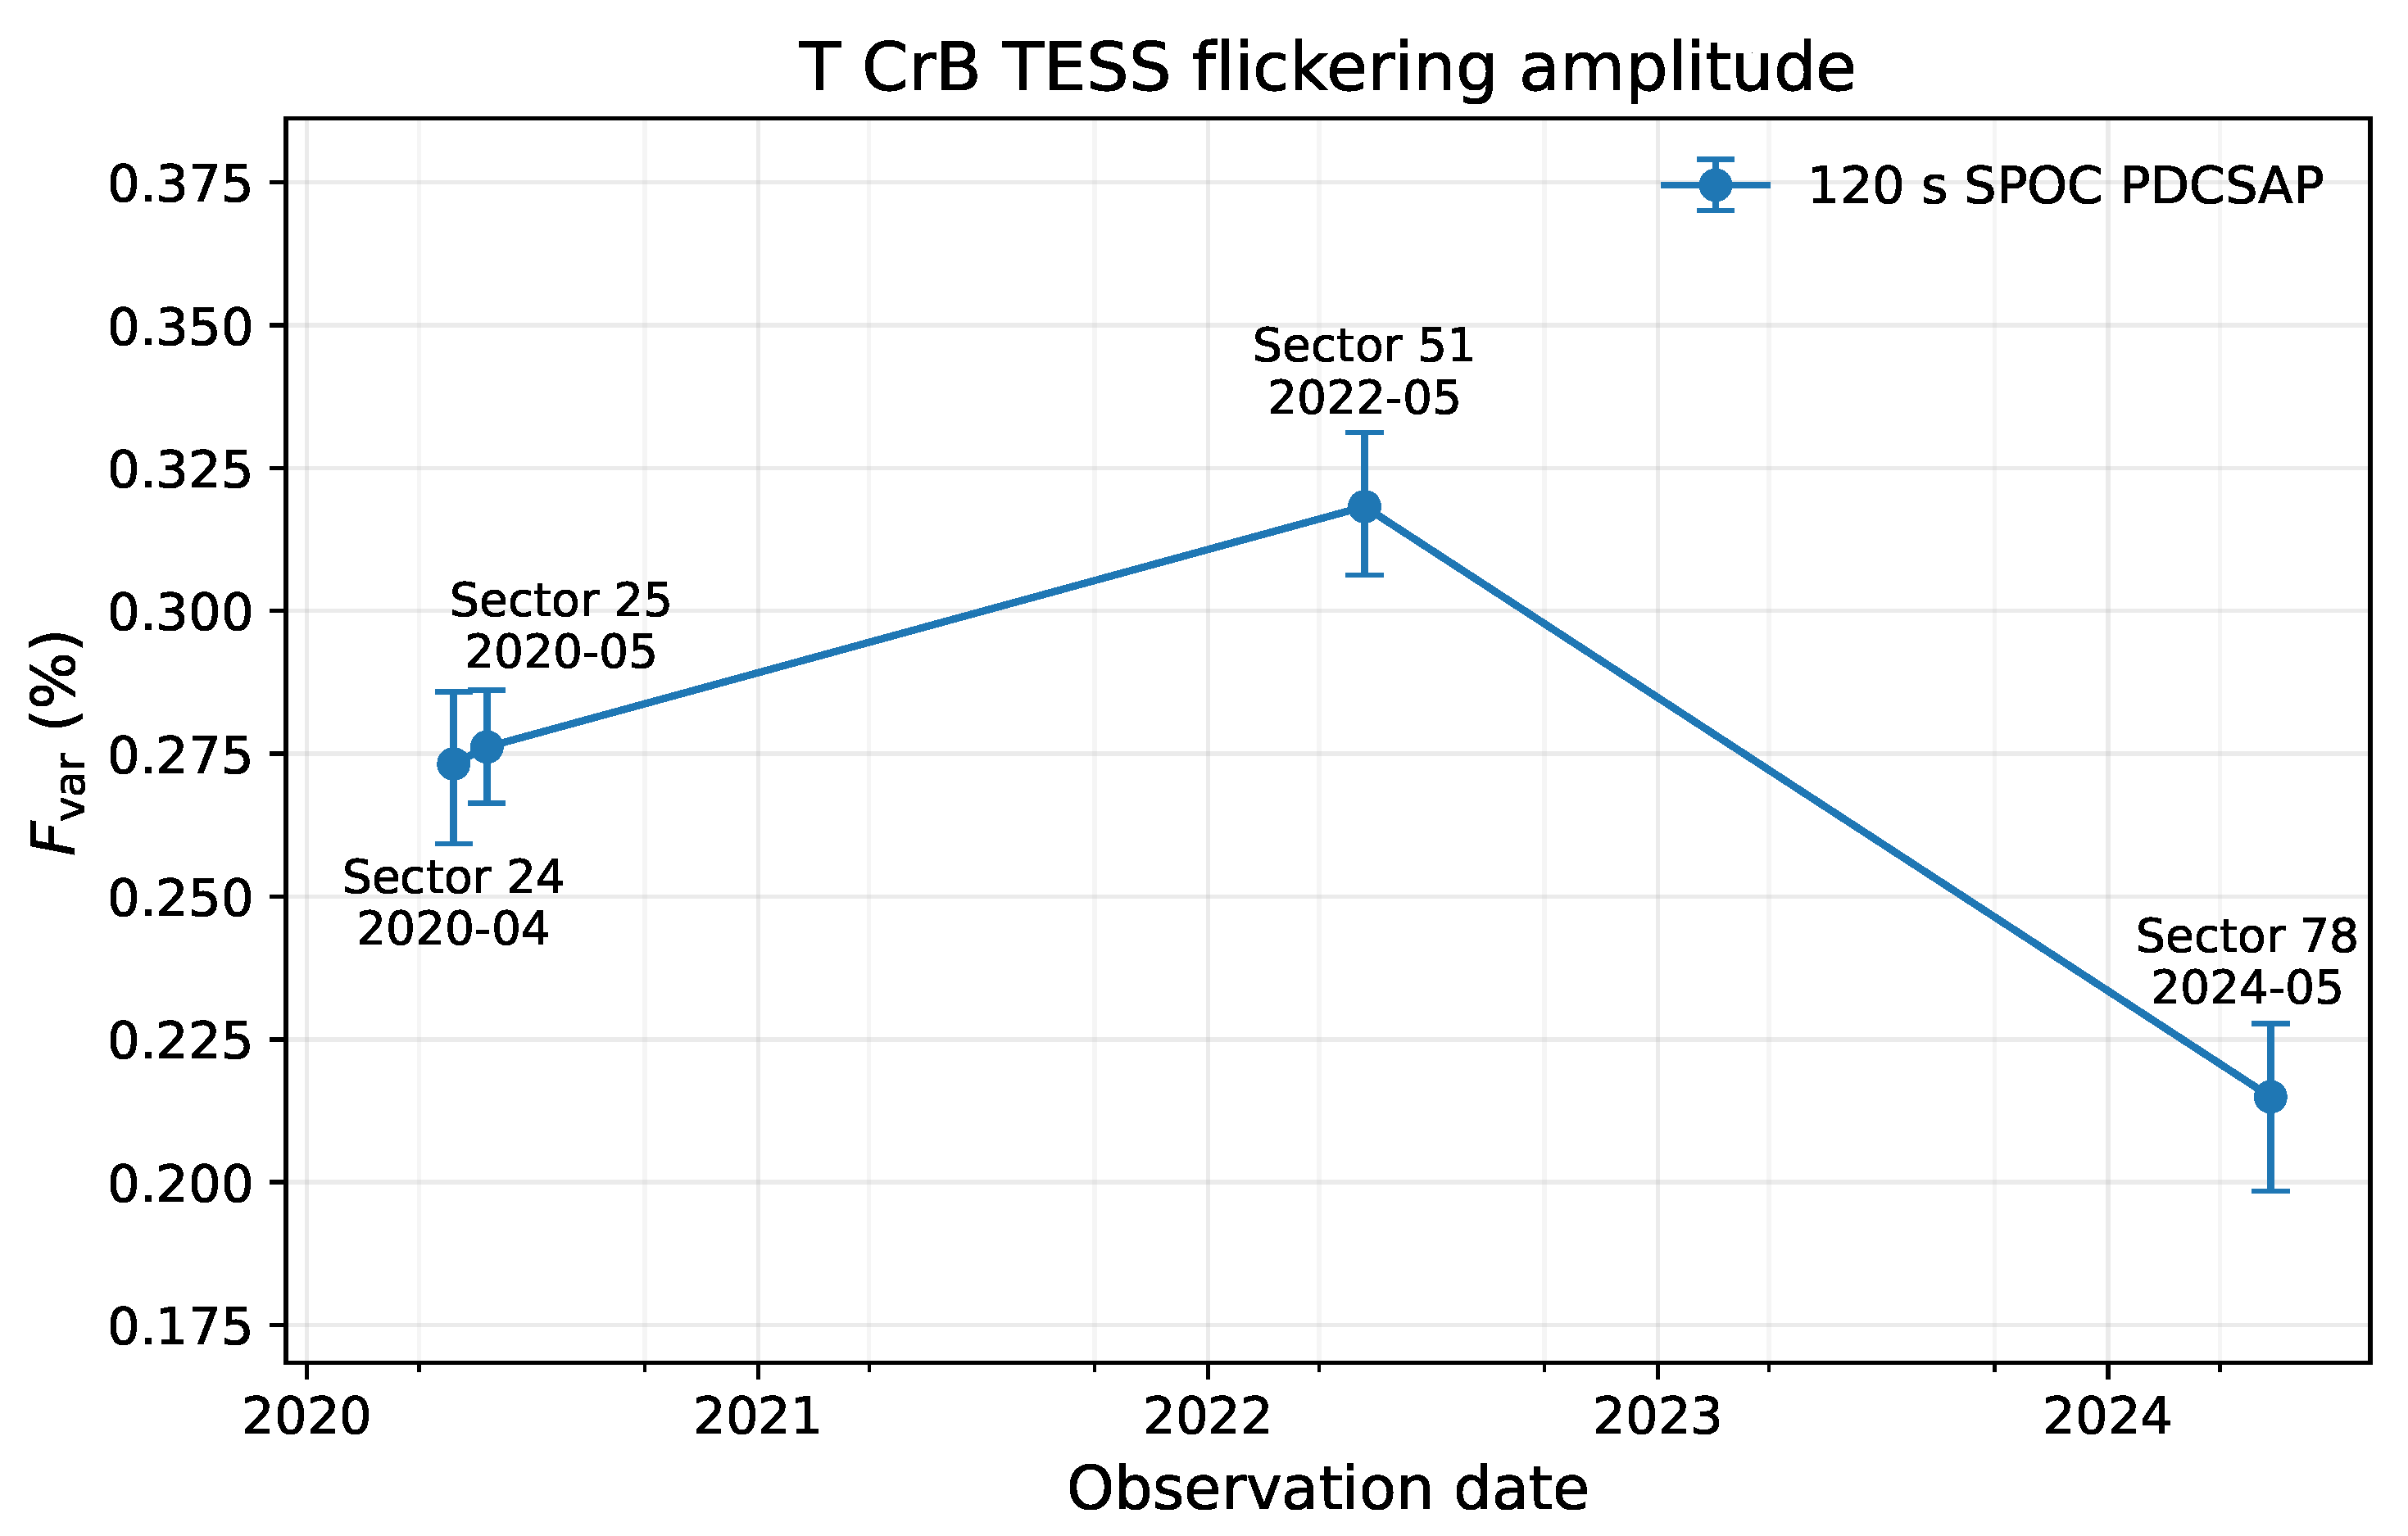
The measured amplitudes are listed in Table 2, and their epoch dependence is shown in Figure 5. Using the primary 120 s PDCSAP_FLUX light curves, we obtain , 0.276, 0.318, and 0.215 per cent in Sectors 24, 25, 51, and 78, respectively. Using Equation (6), these values correspond to approximately 2.96, 3.00, 3.45, and 2.33 mmag. The residual distributions in Figure 4 are centered close to zero and are non-Gaussian: the skewness values are 0.35, 0.30, 0.20, and 0.68, and the excess kurtoses are 1.41, 0.87, 1.07, and 2.26 for Sectors 24, 25, 51, and 78, respectively. These moments quantify the positive asymmetry and extended wings but are not, by themselves, unique diagnostics of accretion.
Table 2.
Flickering amplitudes measured from the detrended 120 s TESS light curves of T CrB.
Figure 5.
Excess fractional rms variability, , of the detrended TESS light curves of T CrB as a function of observing date. The values were measured from the quality-filtered 120 s SPOC PDCSAP_FLUX residual light curves after removal of a 0.5 d segment-wise smooth trend. The error bars were estimated using a 0.5 d time-block bootstrap. Sector 51 has the largest TESS-band flickering amplitude, while Sector 78 has the smallest.
3.2. Timescale-Dependent Rms
To examine the timescale dependence, we binned each continuous residual segment into 30 min and 2 h intervals. The value in each bin is the unweighted arithmetic mean. Bins are anchored at the start of each segment; incomplete terminal bins are retained when they contain at least two cadences, and one-point bins are discarded. The uncertainty of a binned point is propagated as . This timescale-resolved view is motivated by previous high-speed studies of T CrB and related symbiotic recurrent novae [39,43,55]. The results are given in Table 3. The 30 min amplitudes are 0.158–0.242 per cent, and the 2 h amplitudes are 0.087–0.150 per cent. Their reduction after binning is consistent with substantial power on timescales shorter than a few hours; it is not an independent confirmation because temporal averaging necessarily suppresses high-frequency variability.
Table 3.
Timescale-dependent excess rms variability of the detrended TESS light curves of T CrB.
3.3. Power Spectral Densities
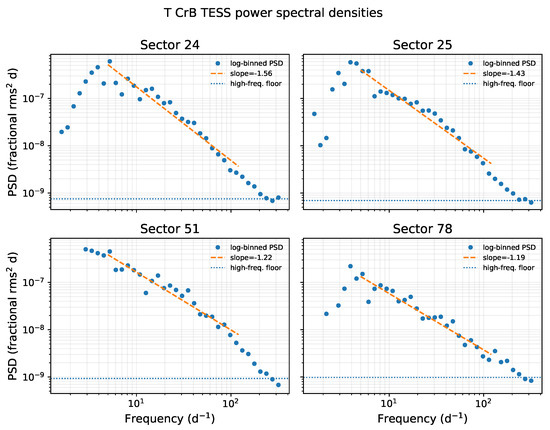
Power-law PSDs provide a compact description of stochastic accretion variability and have been widely used to characterize flickering in CVs and symbiotic stars [34,39,56,57]. We computed power spectral densities (PSDs) from the 0.5 d detrended residual light curves. Each sector was split into continuous segments at cadence gaps larger than 3.5 times the median cadence. For each segment with at least 256 points, we subtracted the mean residual and computed a Hann-windowed periodogram. The individual periodograms from the same sector were combined and logarithmically binned in frequency. We then fitted a power law,
where is the PSD, and is the log–log slope. The fits were performed over , corresponding to timescales from approximately 4.8 h to 12 min. This range avoids the lowest frequencies, where the result is most sensitive to the adopted detrending, and the highest frequencies, where the periodogram approaches the empirical white-noise floor.
The PSDs are shown in Figure 6, and the fitted slopes are listed in Table 4. The slopes range from in Sector 24 to in Sector 78. The negative slopes show that the residual variability is red-noise-like and not simply white photometric noise. Sectors 24 and 25 have slopes close to the average optical power-law index found in high-speed observations of T CrB by Zamanov et al. [39], while Sectors 51 and 78 have somewhat flatter TESS-band PSDs. Sector 51 shows an apparent downturn above (timescales shorter than about 14 min). This curvature occurs where the periodogram approaches the empirical high-frequency noise floor and near the upper edge of the fitted interval. We therefore do not claim a statistically established intrinsic break; confirming such a feature would require a dedicated broken-power-law analysis with an explicit noise model and longer continuous coverage.
Figure 6.
Power spectral densities of the detrended TESS residual light curves of T CrB in Sectors 24, 25, 51, and 78. The PSDs were computed from the quality-filtered 120 s SPOC PDCSAP_FLUX residuals after removal of a 0.5 d segment-wise smooth trend. The points show logarithmically binned PSDs, and the dashed lines show power-law fits over . The dotted horizontal lines mark empirical high-frequency noise floors. The apparent Sector 51 curvature near occurs close to this transition and is not interpreted as a secure intrinsic PSD break. The negative slopes indicate red-noise-like stochastic variability.
Table 4.
Power spectral density slopes of the detrended TESS residual light curves of T CrB.
4. Robustness Checks
4.1. SAP and PDCSAP Comparison
The SPOC PDCSAP_FLUX product is designed to remove common systematics through the PDC cotrending procedure [46,48,49,50], but for intrinsically variable stars it is important to verify that the astrophysical short-timescale signal is not an artifact of the correction. We therefore repeated the main residual and excess-rms analysis using SAP_FLUX. The resulting amplitudes are listed in Table 2. After detrending, the SAP_FLUX and PDCSAP_FLUX products give very similar short-timescale amplitudes in all sectors. This indicates that the millimagnitude-level flickering is not introduced solely by the PDC procedure.
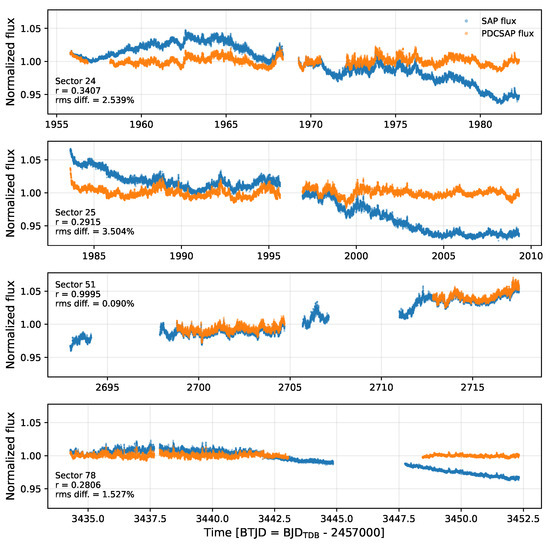
Figure 7 compares the 120 s quality-zero SAP and PDCSAP series and, for Sectors 51 and 78, also overlays the available non-zero-quality SAP cadences from the 20 s products as a diagnostic. These flagged points are displayed only to reveal data gaps and processing discontinuities and are never used in the flickering measurements. The products can differ substantially on long timescales. Some smooth SAP trends could contain a local portion of the red giant’s 113.8 d ellipsoidal modulation, but an individual 19–26 d sector is too short to separate that signal from instrumental trends. PDC may remove part of such long-timescale astrophysical variability. Conversely, the abrupt Sector 51 step across the 8.12 d gap cannot plausibly be ellipsoidal. We therefore restrict the scientific comparison to independently detrended short-timescale residuals, whose SAP and PDCSAP amplitudes agree closely.
Figure 7.
Comparison of the 120 s TESS SPOC SAP_FLUX and PDCSAP_FLUX light curves of T CrB in Sectors 24, 25, 51, and 78. The PDCSAP_FLUX series contain only quality-filtered cadences, whereas the SAP_FLUX series include all available finite cadences, with no filtering based on the QUALITY flag. For each sector, both flux series were normalized by their own median values. The annotations give the Pearson correlation coefficient between the two normalized series and their rms difference. The long-timescale behavior can differ between SAP and PDCSAP, especially in Sectors 24, 25, and 78, but the detrended short-timescale flickering amplitudes are similar in the two products.
4.2. Cadence Comparison
Sectors 51 and 78 provide both 20 s and 120 s SPOC products. Appendix A.1 compares the two cadences. Sector 78 gives nearly the same flickering amplitude in the two products, per cent for 20 s data and 0.230 per cent for 120 s data in the simple 0.5 d residual analysis. Sector 51 gives a somewhat larger amplitude in the 20 s product than in the 120 s product, but both products show a higher amplitude than Sector 78. Therefore, the low amplitude of Sector 78 is not caused by using the 120 s product as the primary data set.
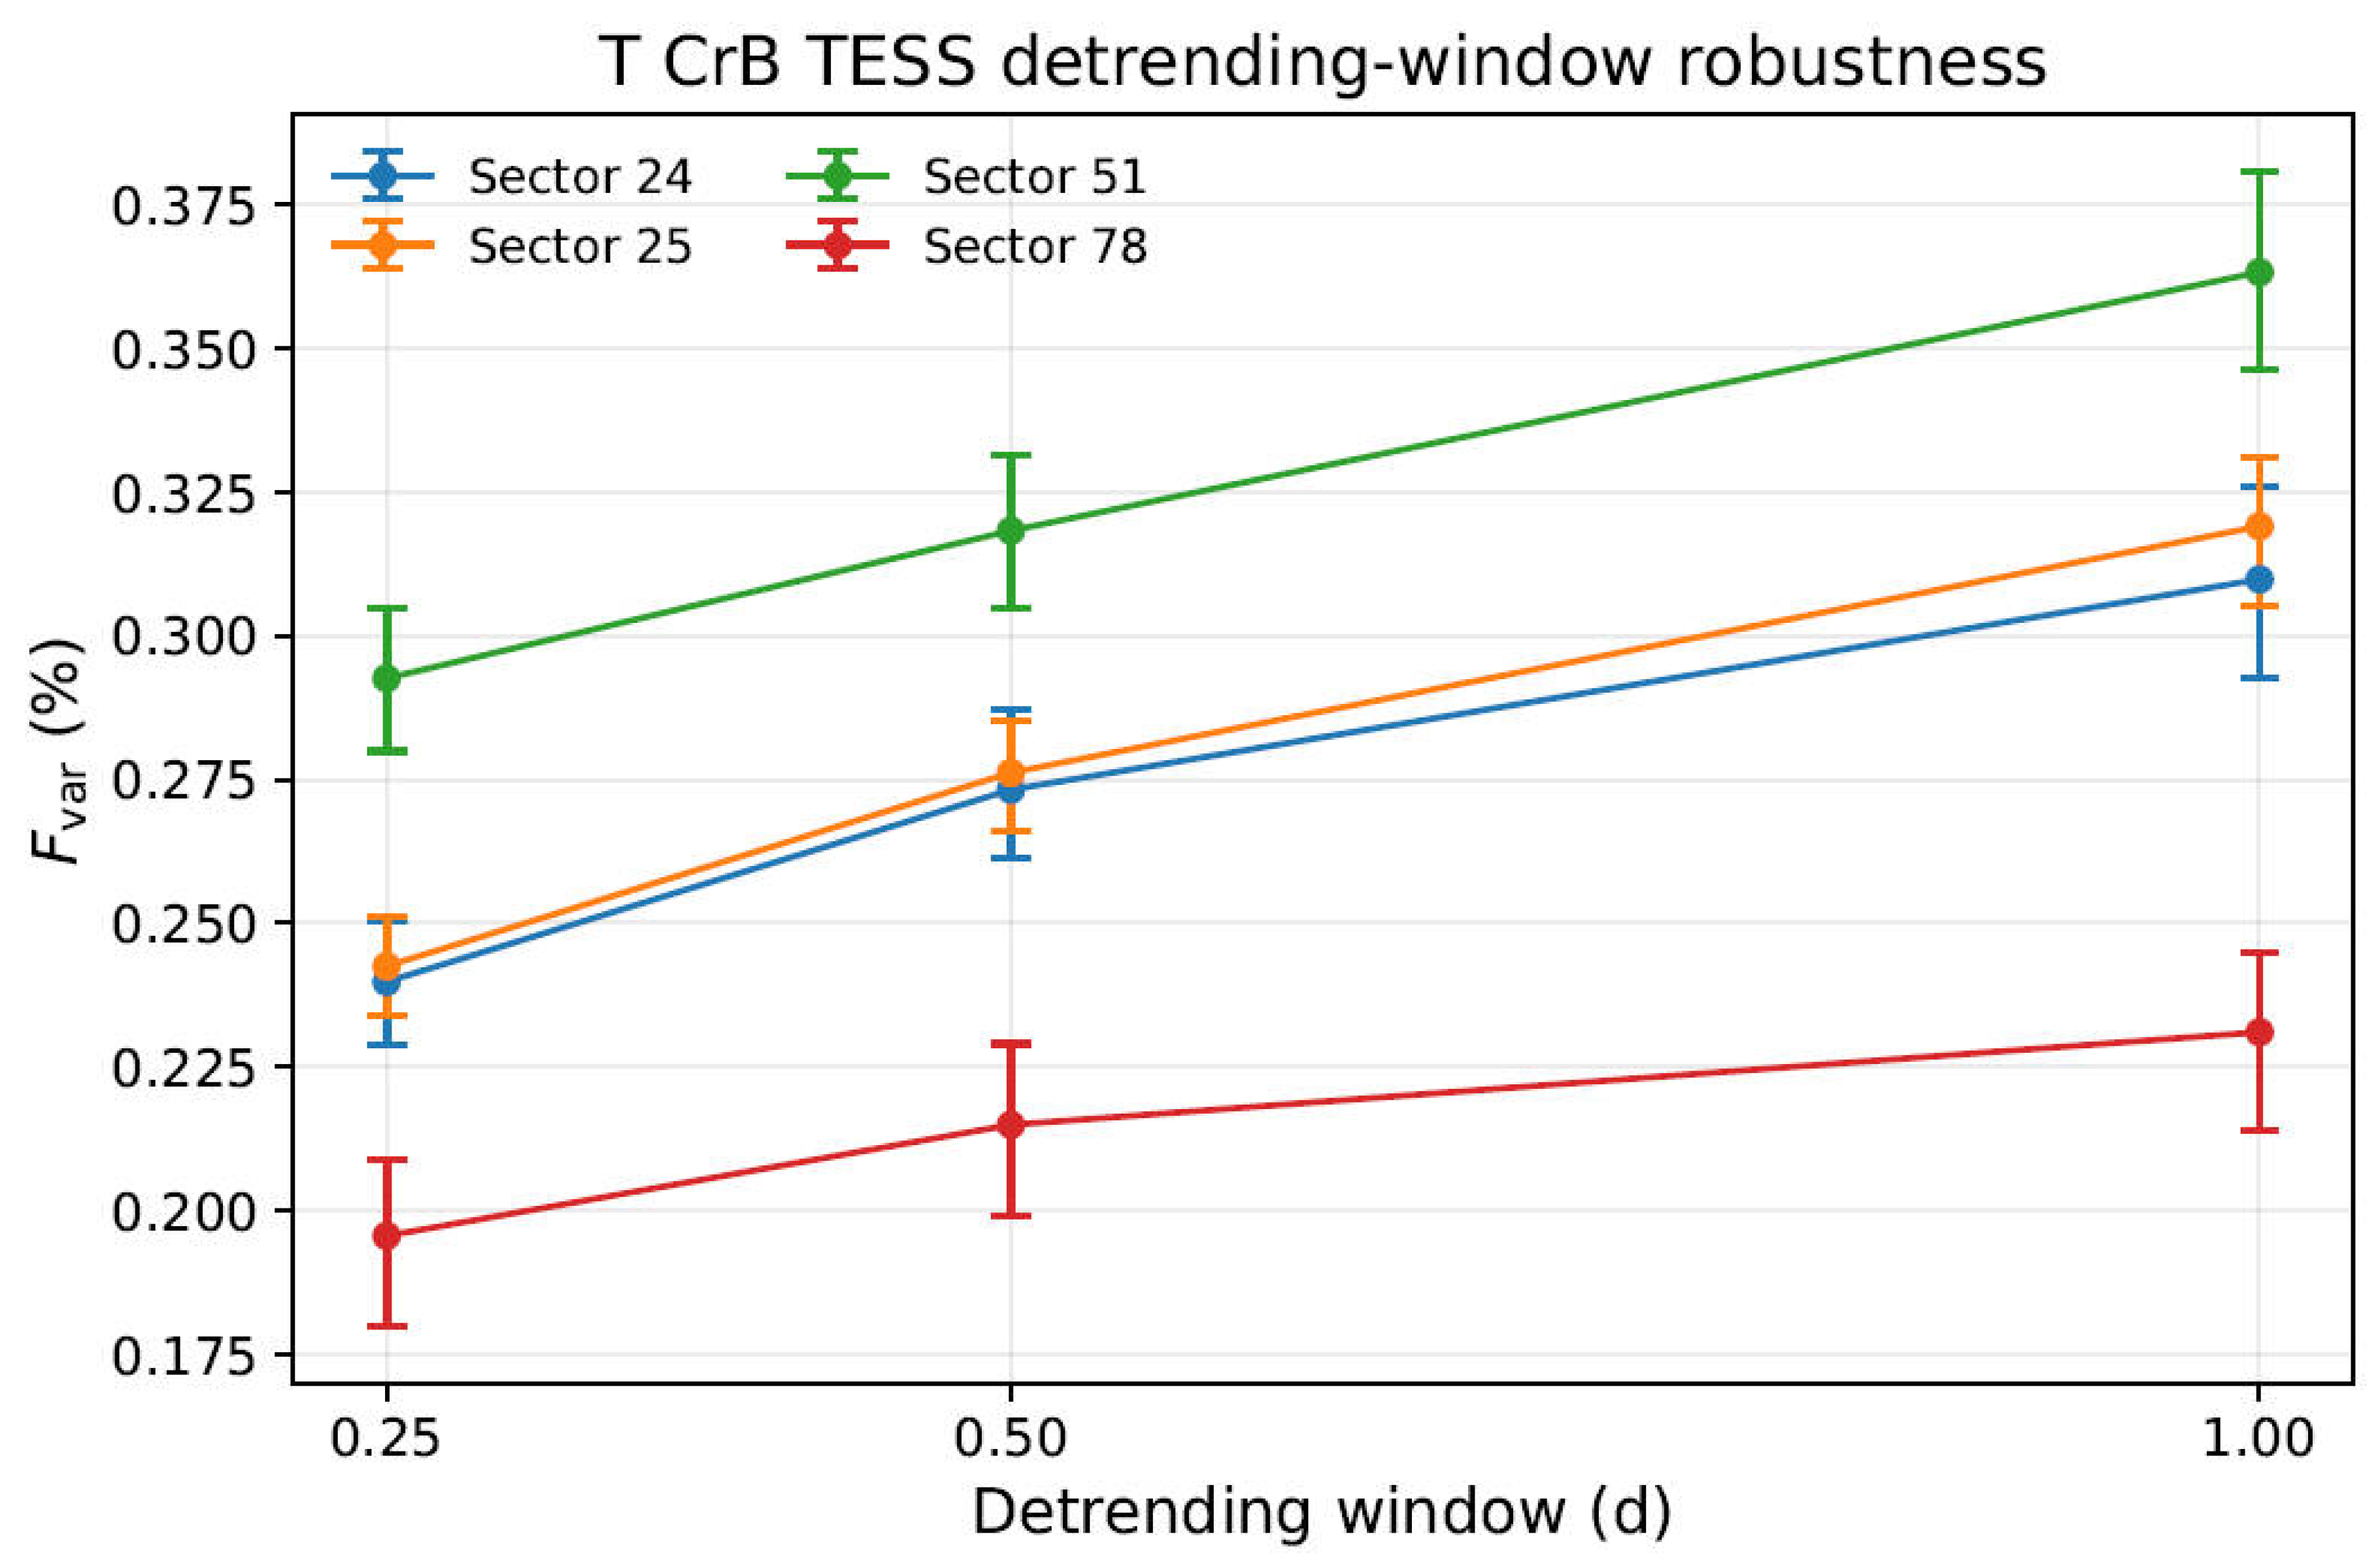
4.3. Detrending-Window Dependence
Trend removal can affect low-frequency power and correlation-time estimates in flickering studies [39]. To test whether the measured flickering amplitudes depend on the adopted trend window, we repeated the full analysis using segment-wise smoothing windows of 0.25, 0.50, and 1.00 d. The results are shown in Figure A2 and listed in Table 5. The absolute values of increase for longer smoothing windows because a longer trend removes less low-frequency variability. The uncertainties were estimated with a time-block bootstrap, a resampling approach based on the general bootstrap framework of Efron & Tibshirani [58] but applied to contiguous 0.5 d blocks in order to preserve short-timescale correlations. The relative ordering, however, is unchanged for all three windows: Sector 51 has the largest excess rms, and Sector 78 has the smallest. Thus, the reduced flickering amplitude in the 2024 TESS data is robust against reasonable changes in the detrending prescription.
Table 5.
Robustness of the TESS flickering amplitudes against the choice of detrending window.
4.4. Aperture and Contamination Check
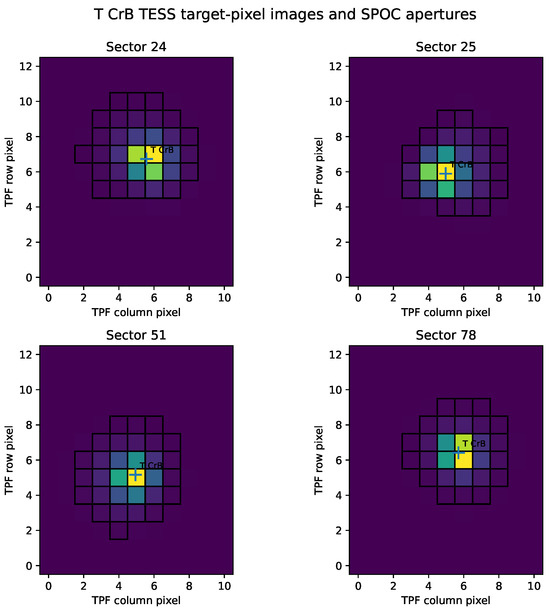
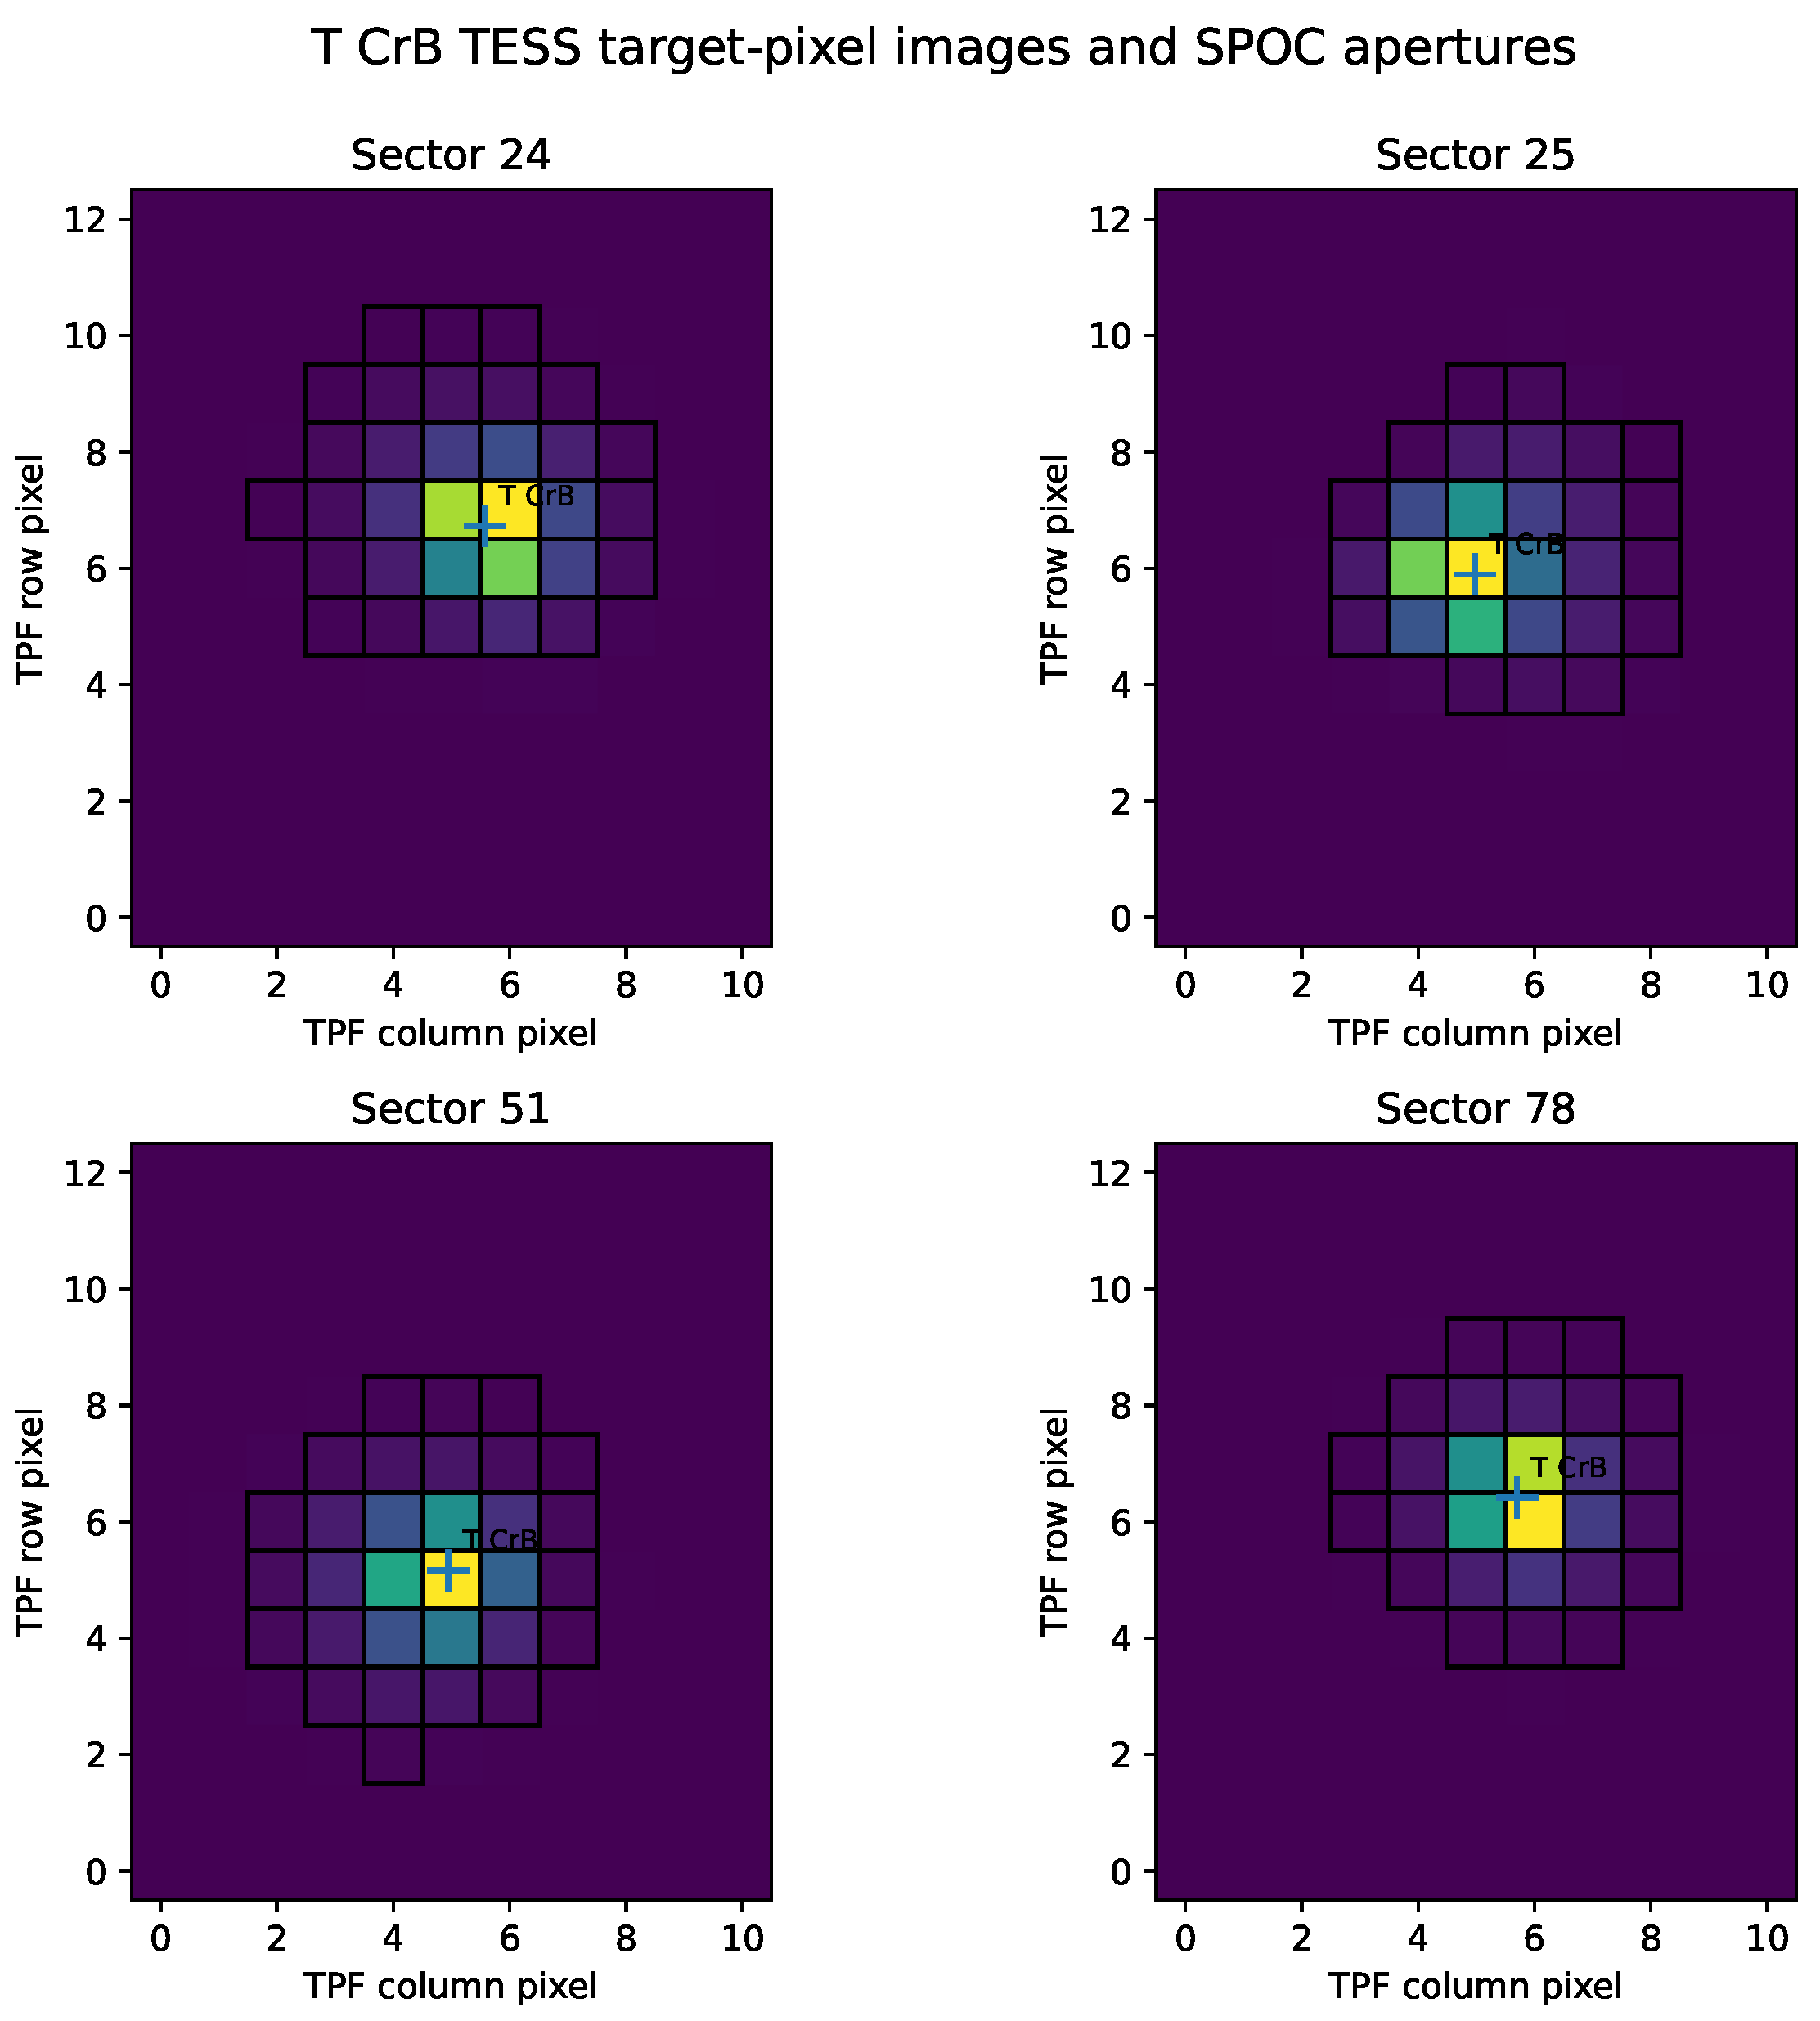
As noted in Section 2, we inspected the SPOC target-pixel files for all four primary sectors, using the pipeline aperture masks delivered with the SPOC products [46]. The median target-pixel images and pipeline apertures are shown in Figure 8, and the aperture summary is given in Table 6. T CrB lies well inside the adopted SPOC aperture in all sectors. The aperture contains approximately 97.3–97.8 per cent of the median flux within the downloaded target-pixel cutout, and no obvious source of comparable brightness is visible inside the aperture. This target-pixel check supports the use of the SPOC light curves for the present analysis.
Figure 8.
TESS target-pixel images and SPOC aperture masks for T CrB in Sectors 24, 25, 51, and 78. Each panel shows the median image of the corresponding 120 s SPOC target-pixel file. The background colors represent the relative median flux recorded in each target-pixel-file pixel, with darker colors indicating lower flux and brighter colors indicating higher flux. The black boxes mark the SPOC pipeline aperture pixels, and the cross marks the position of T CrB. The target is well located inside the adopted aperture in all four sectors. The aperture contains approximately 97.3–97.8 per cent of the median flux within the downloaded target-pixel cutout.
Table 6.
TESS target-pixel aperture and contamination summary for T CrB.
5. Discussion
5.1. Detection of Red-Optical Flickering with TESS
The TESS residual light curves show stochastic millimagnitude-level variability in all four sectors. The residual distributions, excess-rms values, and red-noise-like PSDs are consistent with accretion-driven flickering rather than purely instrumental noise, although none of these diagnostics is unique to accretion. This interpretation is consistent with the general view that flickering is a fingerprint of accretion in WD binaries and related accretors [34,35]. This conclusion is consistent with previous ground-based and X-ray studies showing that T CrB is a persistent flickering source [22,23,39,40,41]. Our contribution is to measure the flickering in a uniform red-optical TESS band over several activity states.
The PSD slopes provide an independent diagnostic of the stochastic process. Accretion-disk flickering models naturally produce broad-band, red-noise-like PSDs, including power-law segments at high frequencies [56]; observationally, this form is also seen in T CrB high-speed photometry [39]. The values in Sectors 24 and 25, and , are close to the mean optical power-law index of ∼−1.46 reported from high-speed optical observations [39]. The flatter slopes in Sectors 51 and 78 may reflect changes in the relative balance of low- and high-frequency variability, but they should not be over-interpreted because the measured slope depends on passband, detrending, finite observing length, and the adopted frequency interval.
5.2. State Dependence of the Flickering Amplitude
The main observational result is the sector-to-sector change in . The 2020 Sectors 24 and 25 have very similar values, –0.28 per cent. Sector 51, observed in 2022 during the late super-active state, has the largest amplitude, per cent. Sector 78, observed in May 2024 after the end of the 2015–2023 super-active state and after the main pre-eruption dip, has the smallest amplitude, per cent. The difference is not caused by the choice of SAP versus PDCSAP, the use of the 120 s cadence, or the adopted detrending window.
The detection of rapid variability in Sector 78 is consistent with continued accretion activity after the super-active state and the main dip. It does not demonstrate that the inner disk, boundary layer, or reprocessing region retained the geometry present during earlier sectors. The direct measurement is only that the observed total-light TESS-band fractional amplitude was lower in 2024. A lower intrinsic rms is one possible explanation, but stronger red-giant dilution, a different accretion-component flux fraction, or a changed emitting/reprocessing geometry can produce the same observational result.
5.3. Relation to the Super-Active State and the Post-Dip State
The super-active state of T CrB is thought to be associated with a higher accretion rate and a changed disk or boundary-layer state [22,23,26,29]. In this context, the higher observed TESS-band amplitude in Sector 51 is consistent with a larger contribution from rapidly variable red-optical emission in 2022. By May 2024, Sector 78 had a lower total-light amplitude, but the data alone do not distinguish an intrinsic decrease from a change in dilution or geometry.
This behavior is qualitatively consistent with a post-dip state in which the accretion flow persists but the optical/UV emitting structure has changed. A reduction in TESS-band flickering does not necessarily imply a lower total accretion rate by itself, because the red-optical passband is sensitive to reprocessed light, disk temperature, and dilution by the giant. Nevertheless, the observed change provides a useful timing diagnostic of the evolving inner accretion flow shortly before the next nova eruption.
5.4. Origin of the Flickering
In accreting WD systems, flickering is generally attributed to stochastic fluctuations in the inner accretion disk, the boundary layer, the disk–stream interaction region, or reprocessing regions [34,35]. Previous work on T CrB has argued that optical flickering is linked to the accreting component and likely originates near the WD, while X-ray flickering traces the boundary-layer region [22,38,39,41]. Turbulence in the inner accretion disk provides one plausible route for producing the observed stochastic light variations [41]. The TESS data do not spatially or spectrally isolate these components, but the red-noise PSDs and the minute-to-hour timescales are consistent with the same broad class of accretion-driven variability.
The TESS band probably samples a mixture of direct disk emission and reprocessed accretion luminosity, both strongly diluted by the red giant. Previous spectral energy distribution (SED) decompositions and optical photometry show that the red giant is a major contributor at visual and red-optical wavelengths [15,29,38]. The small observed total-light amplitudes therefore do not contradict the much larger amplitudes measured in bluer bands. Instead, they are the expected result of observing a symbiotic recurrent nova in a broad red band where the cool giant provides a large quasi-steady flux contribution.
5.5. Dilution by the Red Giant
The need to account for dilution by the cool giant has been emphasized in previous T CrB flickering work; Zamanov & Bruch [38] showed that the secondary contributes strongly in the visual while being much less important in the U band. Let be the approximately steady TESS-band flux of the red giant, the mean TESS-band flux of the accretion-related component, and the intrinsic fractional rms variability of that component. The observed total-light fractional rms is then approximately
Here, is the observed total-light excess fractional rms variability in the TESS band. Thus, even a physically strong accretion flickering signal can appear as only a few millimagnitudes in the total TESS light curve when in the red optical. For this reason, the measured values of –0.32 per cent should be regarded as lower limits to the intrinsic fractional variability of the accretion-related component, provided that the red giant is approximately steady on the relevant timescales.
Equation (8) also shows why a change in the observed TESS amplitude does not have a unique interpretation. A lower can result from a lower intrinsic flickering amplitude, a lower accretion-component flux fraction, or a change in the spectral energy distribution that shifts variable power out of the TESS band. Simultaneous blue-optical, UV, and X-ray observations would be required to separate these possibilities.
5.6. Connection with the Accretion State and Boundary Layer
The reduced TESS-band flickering amplitude in Sector 78 is also consistent with the multiwavelength picture in which both the accretion rate and the optical depth of the boundary layer were higher during the super-active state than after the main pre-eruption dip. Sectors 24, 25, and 51 were observed while T CrB was still in the 2015–2023 super-active state. During this interval, the enhanced mass flow through the disk is thought to have increased the optical depth of the boundary layer and shifted a larger fraction of the accretion luminosity into the UV/optical bands [8,29,59,60]. In contrast, Sector 78 was observed in May 2024, after the end of the super-active state and after the main pre-eruption dip, when the optical/UV emission had declined and the X-ray emission had increased, consistent with a reduced accretion rate and a transition toward a less optically thick boundary layer [10,11].
This interpretation naturally explains why the total-light TESS-band flickering amplitude can decrease even if accretion-driven stochastic variability persists. If the red giant supplies a nearly steady contribution in the TESS band, then a reduction of the accretion-related optical component increases the dilution of the flickering signal. According to Equation (8), the low value of in Sector 78 can therefore be produced by a lower intrinsic accretion-component variability, a smaller accretion-related fraction of the total TESS-band flux, or both. The result is consistent with the independently inferred transition from a high-accretion, optically thicker-boundary-layer state during the super-active state to a lower-accretion, less optically thick state after the main dip.
We emphasize, however, that the TESS data alone do not directly measure the boundary-layer optical depth. They show that the red-optical flickering amplitude changed in a manner consistent with the independently inferred multiwavelength evolution of the accretion flow. A direct test of this interpretation requires simultaneous TESS-like optical photometry, UV spectroscopy or photometry, and X-ray monitoring, so that the optical flickering amplitude can be compared with the spectral state of the boundary layer.
6. Summary and Conclusions
We analyzed TESS short-cadence photometry of T CrB in Sectors 24, 25, 51, and 78 in order to quantify red-optical flickering across different accretion states. The principal results are the following:
- TESS detects millimagnitude-level stochastic red-optical variability in all four sectors. After removing a 0.5 d segment-wise smooth trend from the 120 s SPOC PDCSAP_FLUX light curves, the excess fractional rms values are , , , and per cent in Sectors 24, 25, 51, and 78, respectively, equivalent to rms amplitudes of 2.96, 3.00, 3.45, and 2.33 mmag.
- The flickering amplitude is state dependent. Sector 51, observed in 2022 during the late super-active state, has the largest TESS-band amplitude. Sector 78, observed in May 2024 after the end of the 2015–2023 super-active state and after the main pre-eruption dip, has the smallest amplitude.
- Binning the residual light curves to 30 min and 2 h reduces the measured excess rms, showing that a substantial fraction of the variability power occurs on timescales shorter than a few hours.
- The log-binned PSDs are red-noise-like over , with slopes from to . This supports an accretion-flickering interpretation rather than white photometric noise alone.
- The lower amplitude in Sector 78 is robust against several checks. Similar short-timescale amplitudes are obtained from SAP and PDCSAP products after detrending; the 20 s and 120 s products are consistent in Sectors 51 and 78; the sector ordering is unchanged for detrending windows of 0.25, 0.50, and 1.00 d; and the SPOC aperture contains T CrB well in all four sectors.
- Because the TESS passband is dominated by the red giant, the observed total-light amplitudes are diluted. The intrinsic fractional flickering amplitude of the accretion component is therefore likely larger than the measured 0.21–0.32 per cent values.
- The lower Sector 78 TESS-band flickering amplitude is consistent with the multiwavelength picture that the accretion rate and boundary-layer optical depth were higher during Sectors 24, 25, and 51 than during Sector 78.
The persistence of flickering in Sector 78 shows that rapidly variable accretion continued into the 2024 post-dip state, while its reduced TESS-band amplitude indicates that the variable accretion-related component was weaker, more diluted, or geometrically altered. Continued simultaneous optical, UV, and X-ray monitoring before and after the next nova eruption will be essential for determining how the inner accretion flow evolves through the eruption cycle.
Author Contributions
Conceptualization, X.Z. and S.P.; methodology, X.Z. and S.P.; formal analysis, X.Z., S.P. and X.R.; data curation, X.Z., S.P., X.R. and M.L.; writing—original draft preparation, X.Z. and S.P.; writing—review and editing, X.Z., S.P., X.R. and M.L. All authors have read and agreed to the published version of this manuscript.
Funding
This work is supported by the High-level Talents Research Start-up Fund Project of Liupanshui Normal University (Grant No. LPSSYKYJJ202208), the Science and Technology Foundation of Guizhou Province (Grant Nos. QKHJC-ZK[2023]442 and QKHJCMS[2026]752), the Discipline-Team of Liupanshui Normal University (Grant No. LPSSY2023XKTD11), the Liupanshui Science and Technology Development Project (Grant Nos. 52020-2024-PT-05, 52020-2025-0-2-08, and 52020-2025-0-2-13), and the High-Level Talent Recruitment Project of Qiannan Normal University for Nationalities (Grant No. qnsyrc202308).
Data Availability Statement
The data analyzed in this article are all available in the MAST at the following URL: https://mast.stsci.edu/portal/Mashup/Clients/Mast/Portal.html, accessed on 12 January 2026.
Acknowledgments
We extend our sincere gratitude to the anonymous reviewers for their insightful and constructive comments, which helped us to improve the scientific content of this article. This work made use of TESS data obtained from the MAST at the Space Telescope Science Institute.
Conflicts of Interest
The authors declare no conflicts of interest.
Abbreviations
The following abbreviations are used in this manuscript:
| PDC | Presearch Data Conditioning |
| RN | recurrent nova |
| WD | white dwarf |
| CV | cataclysmic variable |
| UV | ultraviolet |
| TESS | Transiting Exoplanet Survey Satellite |
| SPOC | Science Processing Operations Center |
| MAST | Mikulski Archive for Space Telescopes |
| AAVSO | American Association of Variable Stars Observers |
| MJD | Modified Julian Date |
| TPF | target-pixel file |
| CCD | charge-coupled device |
| BTJD | TESS Barycentric Julian Date |
| BJD | Barycentric Julian Date |
| TDB | Barycentric Dynamical Time |
| PSD | power spectral density |
| Gaia eDR3 | Gaia early Data Release 3 |
| SED | spectral energy distribution |
Appendix A. Additional Robustness Tests
Appendix A.1. Cadence Comparison
Figure A1 compares the 20 s and 120 s products, and Table A1 reports their independently detrended values. The two cadences give the same sector ordering, and both show a substantially lower amplitude in Sector 78 than in Sector 51.
Figure A1.
Comparison of the 20 s and 120 s TESS SPOC PDCSAP_FLUX products in Sectors 51 and 78. Each series is normalized by its own median, and the legend explicitly identifies all four products and their independently measured 0.5 d-detrended values. Vertical offsets separate the sectors for clarity.
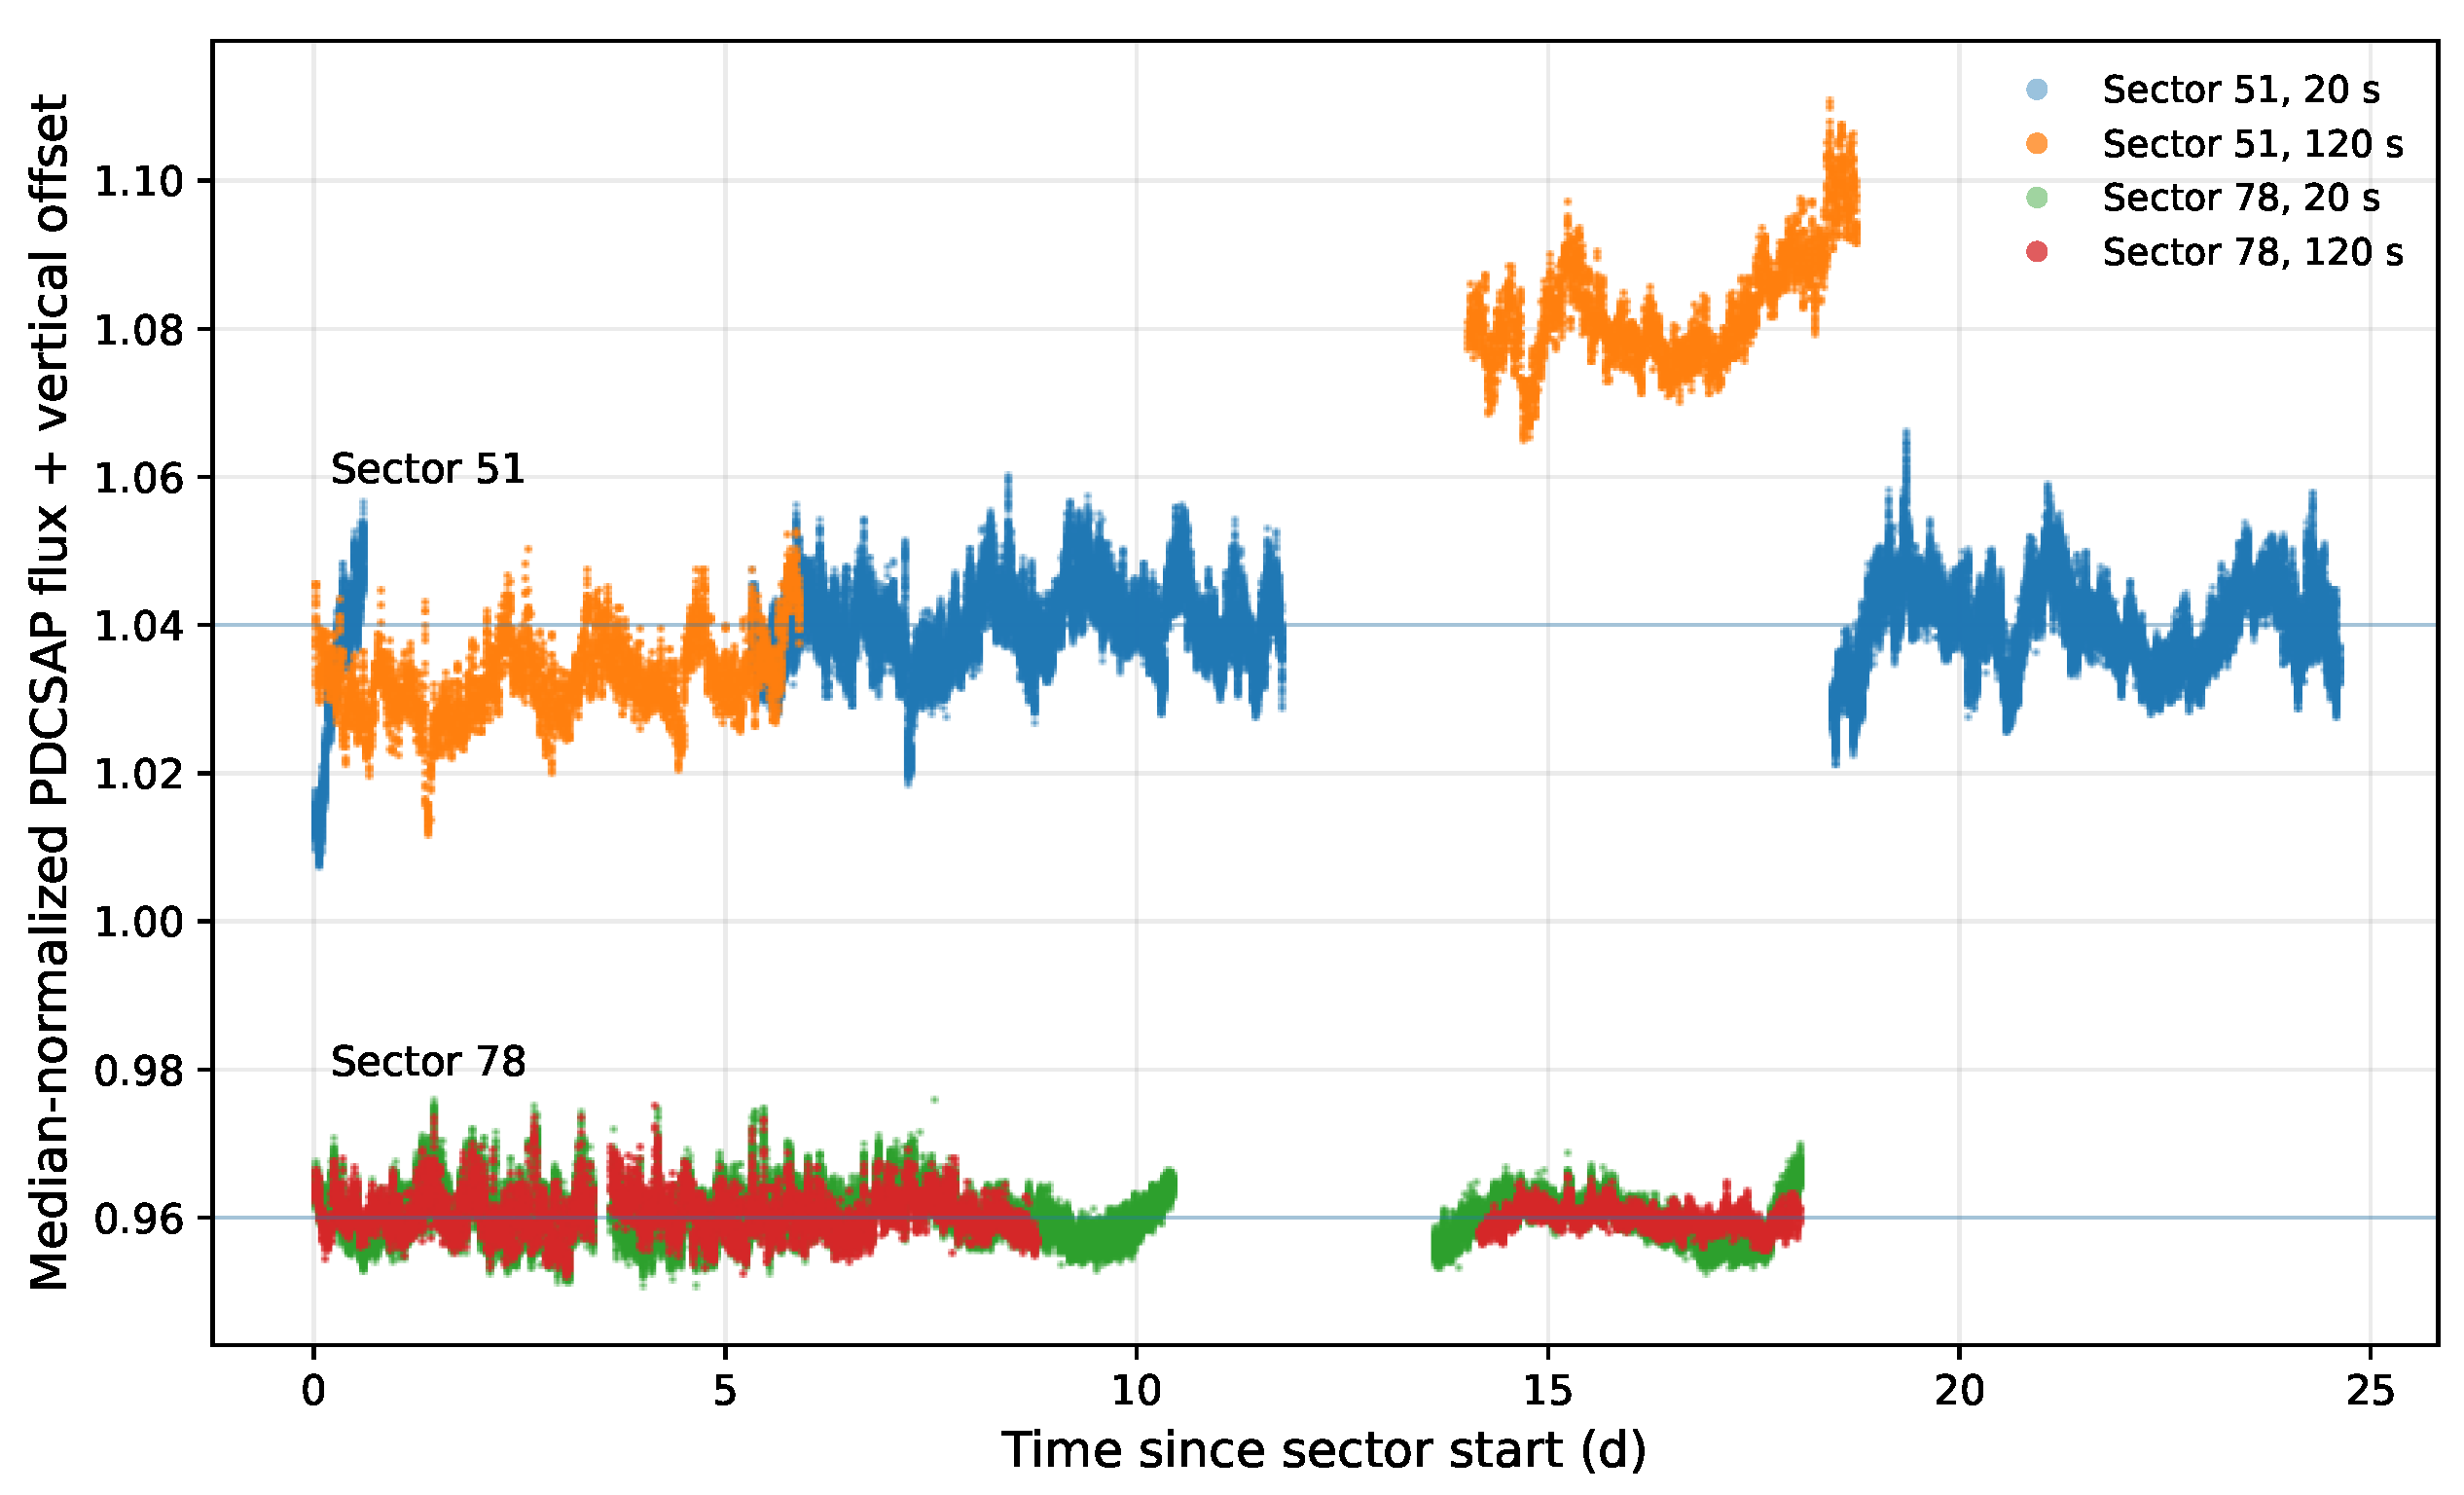
Table A1.
Cadence comparison of the 0.5 d-detrended excess fractional rms.
Appendix A.2. Detrending-Window Robustness
Figure A2 shows how the measured changes with detrending window. The absolute amplitudes increase for longer windows, but the sector ordering is unchanged.
Figure A2.
Detrending-window robustness test for the TESS flickering amplitude of T CrB. The excess fractional rms variability, , was measured after removing segment-wise smooth trends with windows of 0.25, 0.50, and 1.00 d. Although the absolute values increase for longer detrending windows, the relative sector-to-sector ordering remains unchanged: Sector 51 has the largest , while Sector 78 has the smallest.
Notes
| 1 | Here RN denotes a recurrent nova. This abbreviation should not be confused with its separate use for red novae, a distinct class of optical transients that generally peak at absolute magnitudes fainter than mag (e.g., [1,2,3]). |
| 2 | http://dc.g-vo.org/tableinfo/gedr3dist.main, accessed on 15 January 2026. |
References
- Cai, Y.-Z.; Pastorello, A.; Fraser, M.; Prentice, S.J.; Reynolds, T.M.; Cappellaro, E.; Benetti, S.; Morales-Garoffolo, A.; Reguitti, A.; Elias-Rosa, N.; et al. The transitional gap transient AT 2018hso: New insights into the luminous red nova phenomenon. Astron. Astrophys. 2019, 632, L6. [Google Scholar] [CrossRef] [Scilit]
- Cai, Y.-Z.; Pastorello, A.; Fraser, M.; Wang, X.-F.; Filippenko, A.V.; Reguitti, A.; Patra, K.C.; Goranskij, V.P.; Barsukova, E.A.; Brink, T.G.; et al. Forbidden hugs in pandemic times. III. Observations of the luminous red nova AT 2021biy in the nearby galaxy NGC 4631. Astron. Astrophys. 2022, 667, A4. [Google Scholar]
- Cai, Y.; Reguitti, A.; Valerin, G.; Wang, X. Gap Transients Interacting with Circumstellar Medium. Universe 2022, 8, 493. [Google Scholar] [CrossRef] [Scilit]
- Sanford, R.F. High-Dispersion Spectrograms of T Coronae Borealis. Astrophys. J. 1949, 109, 81. [Google Scholar] [CrossRef] [Scilit]
- Munari, U.; Dallaporta, S.; Cherini, G. The 2015 super-active state of recurrent nova T CrB and the long term evolution after the 1946 outburst. New Astron. 2016, 47, 7. [Google Scholar] [CrossRef] [Scilit]
- Iłkiewicz, K.; Mikołajewska, J.; Stoyanov, K.A. Symbiotic Star T CrB as an Extreme SU UMa-type Dwarf Nova. Astrophys. J. Lett. 2023, 953, L7. [Google Scholar] [CrossRef] [Scilit]
- Maslennikova, N.A.; Tatarnikov, A.M.; Tatarnikova, A.A.; Dodin, A.V.; Shenavrin, V.I.; Burlak, M.A.; Zheltoukhov, S.G.; Strakhov, I.A. Recurrent Symbiotic Nova T Coronae Borealis before Outburst. Astron. Lett. 2023, 49, 501. [Google Scholar] [CrossRef] [Scilit]
- Zamanov, R.; Boeva, S.; Latev, G.Y.; Semkov, E.; Minev, M.; Kostov, A.; Bode, M.F.; Marchev, V.; Marchev, D. Accretion in the recurrent nova T CrB: Linking the superactive state to the predicted outburst. Astron. Astrophys. 2023, 680, L18. [Google Scholar] [CrossRef] [Scilit]
- Merc, J.; Wyrzykowski, Ł.; Beck, P.G.; Mikołajczyk, P.J.; Kotysz, K.; Zieliński, P.; Zola, S.; Kurowski, S.; Ogłoza, W.; Drozdz, M.; et al. Is the symbiotic recurrent nova T CrB late? Recent photometric evolution and comparison with past pre-outburst behaviour. Mon. Not. R. Astron. Soc. 2025, 541, L14. [Google Scholar] [CrossRef] [Scilit]
- Pei, S.; Zhang, X.; Su, R.; Cai, Y.; Ou, Z.; Li, Q.; Ren, X.; Yang, T.; Li, M. Multiwavelength study of the pre-eruption dip in the recurrent nova T Coronae Borealis preceding imminent nova eruption. Astron. Astrophys. 2026, 706, A94. [Google Scholar] [CrossRef] [Scilit]
- Luna, G.J.M.; Kuin, N.P.M.; Mukai, K.; Sokoloski, J.L.; Page, K.; Osborne, J.P. Evolution of the recent high-accretion state of the recurrent nova T CrB: HST, Swift, NuSTAR, and XMM-Newton observations. Astron. Astrophys. 2026, 707, A102. [Google Scholar] [CrossRef] [Scilit]
- Pei, S.; Zhang, X.; Su, R.; Ou, Z.; Cai, Y.; Li, Q.; Liu, Y.; Ren, X.; Yang, T. When will T Coronae Borealis next erupt as a nova? Constraints from recurrence, orbital phase, and accretion-state evolution. Mon. Not. R. Astron. Soc. 2026, 550, stag1361. [Google Scholar] [CrossRef] [Scilit]
- Bailey, J. Periodic fluctuations in the recurrent nova T CrB. J. Br. Astron. Assoc. 1975, 85, 217. [Google Scholar]
- Fekel, F.C.; Joyce, R.R.; Hinkle, K.H.; Skrutskie, M.F. Infrared Spectroscopy of Symbiotic Stars. I. Orbits for Well-Known S-Type Systems. Astron. J. 2000, 119, 1375. [Google Scholar] [CrossRef] [Scilit] [PubMed]
- Schaefer, B.E. The B & V light curves for recurrent nova T CrB from 1842–2022, the unique pre- and post-eruption high-states, the complex period changes, and the upcoming eruption in 2025.5 ± 1.3. Mon. Not. R. Astron. Soc. 2023, 524, 3146. [Google Scholar] [CrossRef] [Scilit]
- Planquart, L.; Jorissen, A.; Van Winckel, H. Resolving the mass transfer in the symbiotic recurrent nova T Coronae Borealis. Astron. Astrophys. 2025, 694, A85. [Google Scholar] [CrossRef] [Scilit]
- Hinkle, K.H.; Nagarajan, P.; Fekel, F.C.; Mikołajewska, J.; Straniero, Q.; Muterspaugh, M.W. Binary Parameters for the Recurrent Nova T Coronae Borealis. Astrophys. J. 2025, 983, 76. [Google Scholar] [CrossRef] [Scilit]
- Belczynski, K.; Mikolajewska, J. New binary parameters for the symbiotic recurrent nova T Coronae Borealis. Mon. Not. R. Astron. Soc. 1998, 296, 77. [Google Scholar] [CrossRef] [Scilit]
- Mürset, U.; Schmid, H.M. Spectral classification of the cool giants in symbiotic systems. Astron. Astrophys. Suppl. Ser. 1999, 137, 473. [Google Scholar] [CrossRef] [Scilit]
- Bailer-Jones, C.A.L.; Rybizki, J.; Fouesneau, M.; Demleitner, M.; Andrae, R. Estimating Distances from Parallaxes. V. Geometric and Photogeometric Distances to 1.47 Billion Stars in Gaia Early Data Release 3. Astron. J. 2021, 161, 147. [Google Scholar] [CrossRef] [Scilit]
- Schaefer, B.E. Comprehensive catalogue of the overall best distances and properties of 402 galactic novae. Mon. Not. R. Astron. Soc. 2022, 517, 6150. [Google Scholar] [CrossRef] [Scilit]
- Iłkiewicz, K.; Mikołajewska, J.; Stoyanov, K.; Manousakis, A.; Miszalski, B. Active phases and flickering of a symbiotic recurrent nova T CrB. Mon. Not. R. Astron. Soc. 2016, 462, 2695. [Google Scholar] [CrossRef] [Scilit]
- Zhekov, S.A.; Tomov, T.V. XMM-Newton observations of the symbiotic recurrent nova T CrB: Evolution of X-ray emission during the active phase. Mon. Not. R. Astron. Soc. 2019, 489, 2930. [Google Scholar] [CrossRef] [Scilit]
- Linford, J.D.; Chomiuk, L.; Sokoloski, J.L.; Weston, J.H.S.; van der Horst, A.J.; Mukai, K.; Barrett, P.; Mioduszewski, A.J.; Rupen, M. T CrB: Radio Observations during the 2016–2017 “Super-active” State. Astrophys. J. 2019, 884, 8. [Google Scholar] [CrossRef] [Scilit]
- Luna, G.J.M.; Sokoloski, J.L.; Mukai, K.; MKuin, N.P. Increasing Activity in T CrB Suggests Nova Eruption Is Impending. Astrophys. J. Lett. 2020, 902, L14. [Google Scholar] [CrossRef] [Scilit]
- Munari, U. The “Super-Active” Accretion Phase of T CrB has Ended. Res. Notes Am. Astron. Soc. 2023, 7, 145. [Google Scholar] [CrossRef] [Scilit]
- Stoyanov, K.A.; MLuna, G.J.; Zamanov, R.K.; Iłkiewicz, K.; Nikolov, Y.M.; Moyseev, M.; Minev, M.; Kurtenkov, A.; Stefanov, S.Y. Evolution of the optical emission lines and the X-ray emission during the super-active stage of T CrB. Bulg. Astron. J. 2025, 42, 29. [Google Scholar]
- Schlindwein, W.; Baptista, R.; Luna, G.J.M. Modeling the High-brightness State of the Recurrent Nova T CrB as an Enhanced Mass-transfer Event. Astrophys. J. 2025, 989, 78. [Google Scholar] [CrossRef] [Scilit]
- Munari, U.; Walter, F.; Masetti, N.; Valisa, P.; Dallaporta, S.; Bergamini, A.; Cherini, G.; Frigo, A.; Maitan, A.; Marino, C.; et al. T CrB: Overview of the accretion history, Roche-lobe filling, orbital solution, and radiative modeling. Astron. Astrophys. 2025, 701, A176. [Google Scholar] [CrossRef] [Scilit]
- Schaefer, B.E.; Kloppenborg, B.; Waagen, E.O.; Observers, T.A. Recurrent nova T CrB has just started its Pre-eruption Dip in March/April 2023, so the eruption should occur around 2024.4 ± 0.3. Astron. Telegr. 2023, 16107, 1. [Google Scholar]
- Toone, J. T Coronae Borealis—The Pre-Eruption Dip. Br. Astron. Assoc. Var. Star Sect. Circ. 2023, 196, 8. [Google Scholar]
- Kuin, N.P.; Luna, G.J.M.; Page, K.; Mukai, K.; Sokoloski, J.L.; Osborne, J.P.; Schaefer, B.E. Swift observations of the changes in the brightness of the recurrent nova T CrB. Astron. Telegr. 2023, 16114, 1. [Google Scholar]
- Pei, S.; Zhang, X.; Su, R.; Cai, Y.; Ou, Z.; Li, Q.; Ren, X.; Liu, Y.; Yang, T. Lack of Significant Orbital-phase Locking in the Active Phases of the Recurrent Nova T CrB. Astrophys. J. 2026, 1006, 193. [Google Scholar] [CrossRef] [Scilit]
- Bruch, A. Flickering in cataclysmic variables: Its properties and origins. Astron. Astrophys. 1992, 266, 237. [Google Scholar]
- Bruch, A. Studies of the flickering in cataclysmic variables. VI. The location of the flickering light source in HT Cassiopeiae, V2051 Ophiuchi, IP Pegasi and UX Ursae Majoris. Astron. Astrophys. 2000, 359, 998. [Google Scholar]
- Dobrzycka, D.; Kenyon, S.J.; Milone, A.A.E. Rapid Light Variations in Symbiotic Binary Stars. Astron. J. 1996, 111, 414. [Google Scholar] [CrossRef] [Scilit]
- Gromadzki, M.; Mikolajewski, M.; Tomov, T.; Bellas-Velidis, I.; Dapergolas, A.; Galan, C. Searching for Flickering Variability in Several Symbiotic Stars and Related Objects: BX Mon, V471 Per, RS Oph, V627 Cas, CI Cam, V886 Her, Z And, T CrB, MWC 560, V407 Cyg. Acta Astron. 2006, 56, 97. [Google Scholar]
- Zamanov, R.K.; Bruch, A. Studies of the flickering in cataclysmic variables. V. The recurrent nova T Coronae Borealis. Astron. Astrophys. 1998, 338, 988. [Google Scholar]
- Zamanov, R.; Bode, M.F.; Stanishev, V.; Martí, J. Flickering variability of T Coronae Borealis. Mon. Not. R. Astron. Soc. 2004, 350, 1477. [Google Scholar] [CrossRef] [Scilit]
- Luna, G.J.M.; Sokoloski, J.L.; Mukai, K. High Energy X-ray Emission from Recurrent Novae in Quiescence: T CrB. In Astronomical Society of the Pacific Conference Series; Evans, A., Bode, M.F., O’Brien, T.J., Darnley, M.J., Eds.; RS Ophiuchi (2006) and the Recurrent Nova Phenomenon; Astronomical Society of the Pacific (ASP): San Francisco, CA, USA, 2008; Volume 401, p. 342. [Google Scholar]
- Dobrotka, A.; Hric, L.; Casares, J.; Shahbaz, T.; Martínez-Pais, I.G.; Muñoz-Darias, T. Searching for flickering statistics in T CrB. Mon. Not. R. Astron. Soc. 2010, 402, 2567. [Google Scholar] [CrossRef] [Scilit]
- Merc, J.; Beck, P.G.; Mathur, S.; García, R.A. Accretion-induced flickering variability among symbiotic stars from space photometry with NASA TESS. Astron. Astrophys. 2024, 683, A84. [Google Scholar] [CrossRef] [Scilit]
- Georgiev, T.B.; Boeva, S.; Latev, G.; Semkov, E.; Stoyanov, K.A.; Tsvetkova, S.V. Intra-night flickering of T Coronae Borealis: Flickering parameters and quasi-period modes. Comparison with RS Ophiuchi. Bulg. Astron. J. 2021, 34, 10. [Google Scholar]
- Yankova, K.; Boneva, D.; Spassov, B.; Minev, M.; Zamanov, R.K. Flickering of the Recurrent Nova T CrB. Bulg. Astron. J. 2026, 44, 85. [Google Scholar]
- Ricker, G.R.; Winn, J.N.; Vanderspek, R.; Latham, D.W.; Bakos, G.A.; Bean, J.L.; Berta-Thompson, Z.K.; Brown, T.M.; Buchhave, L.; Butler, N.R.; et al. Transiting Exoplanet Survey Satellite (TESS). J. Astron. Telesc. Instrum. Syst. 2015, 1, 014003. [Google Scholar] [CrossRef] [Scilit]
- Jenkins, J.M.; Twicken, J.D.; McCauliff, S.; Campbell, J.; Sanderfer, D.; Lung, D.; Mansouri-Samani, M.; Girouard, F.; Tenenbaum, P.; Klaus, T.; et al. The TESS science processing operations center. In Society of Photo-Optical Instrumentation Engineers (SPIE) Conference Series; Chiozzi, G., Guzman, J.C., Eds.; Software and Cyberinfrastructure for Astronomy IV; SPIE: Bellingham, WA, USA, 2016; Volume 9913, p. 99133E. [Google Scholar]
- Lightkurve Collaboration; Cardoso, J.V.d.M.; Hedges, C.; Gully-Santiago, M.; Saunders, N.; Cody, A.M.; Barclay, T.; Hall, O.; Sagear, S.; Turtelboom, E.; et al. Lightkurve: Kepler and TESS Time Series Analysis in Python; Record ascl:1812.013; Astrophysics Source Code Library: Houghton, MI, USA, 2018. [Google Scholar]
- Stumpe, M.C.; Smith, J.C.; Van Cleve, J.E.; Twicken, J.D.; Barclay, T.S.; Fanelli, M.N.; Girouard, F.R.; Jenkins, J.M.; Kolodziejczak, J.J.; McCauliff, S.D. Kepler Presearch Data Conditioning I—Architecture and Algorithms for Error Correction in Kepler Light Curves. Publ. Astron. Soc. Pac. 2012, 124, 985. [Google Scholar] [CrossRef] [Scilit] [PubMed]
- Smith, J.C.; Stumpe, M.C.; Van Cleve, J.E.; Twicken, J.D.; Barclay, T.S.; Fanelli, M.N.; Girouard, F.R.; Jenkins, J.M.; Kolodziejczak, J.J.; McCauliff, S.D. Kepler Presearch Data Conditioning II—A Bayesian Approach to Systematic Error Correction. Publ. Astron. Soc. Pac. 2012, 124, 1000. [Google Scholar] [CrossRef] [Scilit] [PubMed]
- Stumpe, M.C.; Smith, J.C.; Catanzarite, J.H.; Van Cleve, J.E.; Jenkins, J.M.; Twicken, J.D.; Girouard, F.R. Multiscale Systematic Error Correction via Wavelet-Based Bandsplitting in Kepler Data. Publ. Astron. Soc. Pac. 2014, 126, 100. [Google Scholar] [CrossRef] [Scilit]
- Savitzky, A.; Golay, M.J.E. Smoothing and differentiation of data by simplified least squares procedures. Anal. Chem. 1964, 36, 1627. [Google Scholar] [CrossRef] [Scilit]
- Fausnaugh, M.M.; Burke, C.J.; Caldwell, D.A.; Jenkins, J.M.; Smith, J.C.; Twicken, J.D.; Vanderspek, R.; Doty, J.P.; Ting, E.B.; Villasenor, J.S. TESS Data Release Notes: Sector 51; DR74; NASA/TM–20220016324; National Aeronautics and Space Administration (NASA): Washington, DC, USA, 2022.
- Howell, S.B.; Mitchell, K.J.; Warnock, A., III. Statistical error analysis in CCD time-resolved photometry with applications to variable stars and quasars. Astron. J. 1988, 95, 247. [Google Scholar] [CrossRef] [Scilit] [PubMed]
- Vaughan, S.; Edelson, R.; Warwick, R.S.; Uttley, P. On characterizing the variability properties of X-ray light curves from active galaxies. Mon. Not. R. Astron. Soc. 2003, 345, 1271. [Google Scholar] [CrossRef] [Scilit]
- Zamanov, R.; Latev, G.; Boeva, S.; Sokoloski, J.L.; Stoyanov, K.; Bachev, R.; Spassov, B.; Nikolov, G.; Golev, V.; Ibryamov, S. Optical flickering of the recurrent nova RS Ophiuchi: Amplitude-flux relation. Mon. Not. R. Astron. Soc. 2015, 450, 3958. [Google Scholar] [CrossRef] [Scilit][Green Version]
- Yonehara, A.; Mineshige, S.; Welsh, W.F. Cellular-Automaton Model for Flickering of Cataclysmic Variables. Astrophys. J. 1997, 486, 388. [Google Scholar] [CrossRef] [Scilit]
- Vaughan, S. A simple test for periodic signals in red noise. Astron. Astrophys. 2005, 431, 391. [Google Scholar] [CrossRef] [Scilit]
- Efron, B.; Tibshirani, R.J. An Introduction to the Bootstrap; Chapman and Hall: New York, NY, USA, 1993. [Google Scholar]
- Luna, G.J.M.; Mukai, K.; Sokoloski, J.L.; Nelson, T.; Kuin, P.; Segreto, A.; Cusumano, G.; Jaque Arancibia, M.; Nuñez, N.E. Dramatic change in the boundary layer in the symbiotic recurrent nova T Coronae Borealis. Astron. Astrophys. 2018, 619, A61. [Google Scholar] [CrossRef] [Scilit]
- Luna, G.J.M.; Nelson, T.; Mukai, K.; Sokoloski, J.L. Dissecting a Disk-instability Outburst in a Symbiotic Star: NuSTAR and Swift Observations of T Coronae Borealis during the Rise to the “Superactive” State. Astrophys. J. 2019, 880, 94. [Google Scholar] [CrossRef] [Scilit]

Disclaimer/Publisher’s Note: The statements, opinions and data contained in all publications are solely those of the individual author(s) and contributor(s) and not of MDPI and/or the editor(s). MDPI and/or the editor(s) disclaim responsibility for any injury to people or property resulting from any ideas, methods, instructions or products referred to in the content. |
© 2026 by the authors. Licensee MDPI, Basel, Switzerland. This article is an open access article distributed under the terms and conditions of the Creative Commons Attribution (CC BY) license.