


Abstract
The fifth edition of the Roma-BZCAT catalog (5BZCAT) contains 227 blazars of the uncertain type (BZU), whose available data do not support an unambiguous assignment to the BL Lacertae object (BZB), flat-spectrum radio quasar (BZQ), or host-galaxy-dominated blazar-like source (BZG) categories. We construct a machine-readable value-added catalog for these sources using 1151 BZB, 1909 BZQ, and 274 BZG catalog entries as the supervised reference sample. The compact input set contains redshift, optical magnitude, radio, X-ray, and gamma-ray measurements; missingness indicators; and spectral slopes connecting the radio, optical, and X-ray bands. Redshift and its availability are explicitly treated as optical-spectroscopy-related label proxies. Cross-validation shows that the Light Gradient Boosting Machine (LightGBM) provides the most reliable probability scores among the tested models, although the stacking ensemble gives a slightly higher balanced accuracy. The final catalog reports LightGBM probabilities and contains 61 BZB-like, 120 BZQ-like, and 46 BZG-like sources; 17 are flagged for low probability separation. These probabilities quantify similarity to existing 5BZCAT labels conditional on catalog measurements, rather than an independent physical taxonomy.
Keywords:
blazars; Roma-BZCAT; active galactic nuclei; machine learning; TabNet; LightGBM; SHAP; catalogs 1. Introduction
Blazars are radio-loud active galactic nuclei (AGNs) in which a relativistic jet is viewed at a small angle to the observer’s line of sight. Relativistic Doppler boosting then produces strong nonthermal continuum emission, high polarization, rapid variability, apparent superluminal motion, and a characteristic double-humped spectral energy distribution (SED) extending from the radio to gamma-ray bands [1,2,3,4,5]. In the classical phenomenological division, BL Lacertae objects (BL Lacs) have weak or absent optical emission lines, while flat-spectrum radio quasars (FSRQs) show strong broad emission lines and higher accretion-powered radiative output. This distinction is useful but not absolute: continuum dilution of lines, host-galaxy contamination, and spectral-state changes complicate catalog-level classification [6,7,8]. The physical link between aligned blazars and misaligned radio galaxies remains central to AGN unification, beginning with the Fanaroff–Riley dichotomy [9].
The Roma-BZCAT catalogs were designed as multi-frequency resources for identifying blazar-like objects and supporting high-energy source association studies [10,11]. The fifth edition of Roma-BZCAT contains 3561 sources, separated into BZB, BZQ, BZG, and BZU categories. In the catalog convention, BZB denotes BL Lac objects, BZQ denotes flat-spectrum radio quasars, BZG denotes sources whose optical/SED properties are dominated by the host galaxy, and BZU denotes blazars of uncertain or transitional type [11]. This four-way taxonomy is more nuanced than a simple BL Lac/FSRQ binary. In particular, BZU objects may include sources whose broad lines appear only in certain states, sources that lie between radio galaxies and BL Lacs, and low-luminosity blazar nuclei embedded in galaxy-dominated systems. Redshift incompleteness is especially common for gamma-ray-selected BL Lacs, so spectroscopic follow-up is central to assessing such catalog assignments [12,13]. Treating all BZU sources as unresolved BZB/BZQ candidates would therefore be too restrictive. A probability catalog that includes a BZG-like branch is better matched to the physical ambiguity of the BZU class.
A broad body of multiwavelength blazar research provides the physical context for this problem. Relativistic beaming, Doppler boosting, broad-band spectral shape, variability, and gamma-ray emission connect radio flux densities, integrated high-energy fluxes, and spectral indices with jet orientation and intrinsic power [14]. These studies motivate a classifier that does not force BZU objects into a deterministic binary label, but instead reports class probabilities and identifies sources for follow-up.
Machine learning methods have become standard tools for high-energy source classification. In the Fermi-LAT context, statistical and machine learning approaches have been applied to unassociated sources, pulsar candidates, AGN identification, BCU subclassification, and multiclass catalog inference [15,16,17,18,19,20,21,22,23,24,25,26,27]. These studies show that catalog observables encode useful information about catalog source classes. However, most gamma-ray catalog classifiers are based on LAT observables, whereas BZCAT is explicitly multiwavelength, including optical, radio, X-ray, and gamma-ray quantities. A BZCAT-specific classifier should therefore use physically transparent multiwavelength features and should treat missing observations as part of the catalog-level information structure.
This paper constructs a machine-readable value-added catalog for all BZU sources in the fifth Roma-BZCAT [11]. Our goal is not to introduce a new machine learning algorithm. Instead, we build a reproducible catalog-classification pipeline with explicit scope limits. We train on BZB, BZQ, and BZG sources and predict three-way posterior probabilities for BZU objects; compare imputation with complete-case analysis; audit the provenance of broad-band indices and the uniqueness of post-imputation feature vectors; and compare the Light Gradient Boosting Machine (LightGBM) [28], TabNet [29], and out-of-fold stacking [30]. Macro- is the arithmetic mean of the class-specific scores, so BZB, BZQ, and BZG receive equal weight despite their unequal sample sizes. The final probability columns use LightGBM because its macro- is statistically indistinguishable from stacking while its out-of-fold log loss and Brier score are lower. We also quantify the sensitivity to redshift and redshift availability, which encode part of the catalog-label construction. SHapley Additive exPlanations (SHAP) and TabNet attention are used to identify influential catalog variables, not to establish their causal physical importance. The rest of this paper is organized as follows. Section 2 describes the sample and features. Section 3 gives the formal model definition and evaluation metrics. Section 4 presents performance, missing-data comparison, BZU predictions, and feature interpretation. Section 5 discusses astrophysical implications and limitations, and Section 6 summarizes the conclusions.
2. Sample and Feature Construction
2.1. 5BZCAT Sample and Class Definitions
We use the fifth Roma-BZCAT catalog as the parent sample [11]. The input table contains 3561 sources and four catalog classes: BZB, BZQ, BZG, and BZU. We use the known-class subset as a supervised training set and apply the fitted classifier to BZU sources only after model development. The training labels are constructed as follows: BZB includes catalog BL Lac objects and BL Lac candidates, BZQ includes flat-spectrum radio quasars, and BZG includes host-galaxy-dominated blazar-like objects. Within the BZB training class, 1059 of 1151 sources (92.0%) are listed as BL Lac objects and 92 sources (8.0%) as BL Lac candidates in the input table. We retain both groups because they are part of the 5BZCAT BZB convention and because excluding the candidate subset would define a narrower training label than the catalog class for which BZU similarity is being estimated. This choice also means that the published probabilities should be interpreted as similarity to the 5BZCAT BZB class, not as a pure confirmed-BL-Lac classifier. These labels are not independent of optical-spectroscopic observability: broad emission lines facilitate both BZQ assignment and redshift measurement, whereas featureless optical spectra often prevent secure redshift determination for BZB sources. BZG classification is likewise related to host-galaxy prominence, which is correlated with redshift. Consequently, the present catalog predicts similarity to the existing 5BZCAT classes conditional on the available catalog measurements; it is not an external, label-independent test of blazar taxonomy.
The supervised sample contains 3334 known sources: 1151 BZB, 1909 BZQ, and 274 BZG objects. The prediction set contains 227 BZU sources. The resulting task is a three-class supervised problem on the known classes, followed by probability prediction for the uncertain class. Table 1 summarizes the class distribution. The large BZQ population and the smaller BZG population create class imbalance, so we report macro-averaged and balanced metrics in addition to accuracy.
Table 1.
Class distribution used in this work. BZU sources are excluded from supervised training and are used only for final prediction.
2.2. Compact Catalog Feature Set
To avoid an overly engineered feature space, we use only twelve catalog features. Names, coordinates, sequence identifiers, and explicit class strings are excluded from training. The adopted features are
where Z is redshift; Rmag is the optical R-band magnitude; is the radio flux density in the combined low-frequency catalog column; is the nominal 5 GHz radio flux density; is the 0.1–2.4 keV X-ray flux; is the 1–100 GeV gamma-ray photon flux; and , , and are missingness indicators for redshift, X-ray flux, and gamma-ray flux, respectively. The combined low-frequency column contains a 1.4 GHz measurement from NVSS or FIRST when available; otherwise, it contains a 0.843 GHz measurement from SUMSS [11]. Thus, this column supplies one low-frequency value per source, not simultaneous measurements at both frequencies. The input CSV does not include a per-source frequency or survey flag, so every non-missing value in this column is used without rescaling; the analysis therefore includes the 0.843 GHz substitutions supplied by 5BZCAT. The nominal 5 GHz column contains measurements mainly at 4.85 GHz from GB6 or PMN, with a small number of other nearby-frequency measurements documented in the catalog notes [11]. Both catalog columns are used as separate input features. Only the nominal 5 GHz value is used as the radio anchor for estimating radio–optical and radio–X-ray spectral slopes when a catalog index is absent. The three broadband spectral indices describe catalog SED contrasts from radio to optical, radio to X-ray, and optical to X-ray. Redshift and are retained because they are informative catalog variables, but they are treated as optical-spectroscopy-related proxies rather than independent multiwavelength observables. We therefore report controlled ablations with Z removed and with both Z and removed. Table 2 lists the feature set and its interpretation.
Table 2.
Adopted 12-feature set. The feature names are kept intentionally compact for use in text and figures.
2.3. Missing-Data Strategies and Broad-Band Index Estimation
Multiwavelength catalogs are intrinsically incomplete. We therefore compare two missing-data strategies under the same cross-validation protocol. The imputation strategy retains all training sources and is implemented separately inside each cross-validation fold. First, missingness indicators for redshift, X-ray flux, and gamma-ray flux are set before imputation, so the model can distinguish an observed value from a substituted one. Second, for ordinary numerical features, the median is calculated only from the training subset of the current fold and is then applied unchanged to the corresponding validation subset. The same fold-fitted preprocessing rule is used when predicting BZU sources after model selection. Third, for , , and , catalog values are retained whenever present; a formula-derived value is used only when the catalog value is absent and all required parent measurements are available, after which any remaining missing values are median-imputed within the fold. This design avoids validation-set leakage and keeps the broad-band index substitutions traceable. The complete-case strategy drops any source with a missing value in any of the twelve adopted features. It therefore tests whether using only fully observed multiwavelength sources yields more reliable validation performance.
The broadband index estimates use the convention
so that for two bands a and b,
We adopt , , and . The catalog’s nominal 5 GHz flux density is therefore used for the radio-to-optical and radio-to-X-ray index estimates. If a source lacks this measurement, we do not substitute the combined low-frequency 1.4/0.843 GHz flux density into these formulas; the corresponding index remains missing until the fold-median step. The nominal 5 GHz flux density is converted as
while the optical flux density is approximated by treating Rmag on the AB magnitude-to-flux-density scale, whose zero point is [31]:
We use this scale as a single reproducible conversion because the input CSV collapses the heterogeneous 5BZCAT optical-magnitude field into one Rmag variable without a per-source filter and zero-point flag. The underlying catalog values can be USNO-B1 R, SDSS r, or another available band [11]; consequently, and any formula-derived index that uses it are approximate fallback quantities rather than precision calibrated photometry. The X-ray flux density proxy is estimated from the integrated 0.1–2.4 keV flux as
where is the catalog flux in units of . The three estimates are therefore
The formula-derived indices are algebraic combinations of already included parent observables and therefore add no independent information for the affected sources. They are used only as transparent replacements for otherwise missing index fields; they are not interpreted as additional measurements. Their provenance is recorded source by source. Among the 227 BZU sources, is catalog-supplied for 213 sources, formula-calculated for 3, and median-imputed for 11. The corresponding catalog-supplied/formula-calculated/median-imputed counts are 148/0/79 for and 145/0/82 for .
3. Methods
3.1. Problem Definition and Probabilistic Output
Let be the feature vector of source i, with , and let
be the known catalog class. The supervised training set is
The BZU sample is not used in supervised fitting. It is treated as an unlabeled prediction set,
The aim is to learn a probabilistic mapping
where is the three-class probability simplex. For each source, the classifier outputs
The discrete prediction is obtained by the maximum posterior rule,
However, the value-added catalog reports the full probability vector rather than only because intermediate probabilities are essential for identifying low-confidence, ambiguous BZU candidates and for selecting sources for follow-up observations.
All preprocessing steps that can learn from the data, including median imputation and feature scaling where required, are fitted within the training fold and then applied to the validation fold. This prevents information from the validation subset from entering the training procedure. The three candidate classifiers are a tree-based LightGBM model, a TabNet neural tabular model, and an out-of-fold stacking ensemble that combines the two base-model probability vectors.
3.2. Tree-Based Classifier: LightGBM
The tree-based model used in this work is LightGBM, a gradient-boosting decision-tree algorithm optimized for tabular data [28]. For multiclass classification, LightGBM builds an additive model for the class score of each class c:
where M is the number of boosting iterations, is the learning rate, and is a regression tree fitted at iteration m to improve the class-c score. The score vector is transformed into class probabilities through the softmax function as follows:
The parameters of the trees are optimized by minimizing the multiclass cross-entropy loss,
where is the indicator function.
LightGBM is included for three reasons. First, gradient-boosted trees are strong baselines for heterogeneous astronomical catalog data, where nonlinear thresholds and interactions among redshift, flux density, integrated flux, and spectral-index variables are expected. Second, trees are insensitive to monotonic transformations, which is useful for broad dynamic-range catalog measurements. Third, tree-based SHAP values provide efficient and stable feature attributions for interpreting which catalog quantities drive the classification [32]. In this study, the LightGBM posterior vector for a source is written as
3.3. Neural Tabular Classifier: TabNet
The neural tabular model is TabNet [29]. Unlike a standard multilayer perceptron, which processes all input features densely at every layer, TabNet performs sequential, attentive feature selection. At decision step t, the model computes a sparse feature mask
with . The masked input is
where ⊙ denotes element-wise, or Hadamard, multiplication between two vectors of the same length. The mask is learned by an attentive transformer that depends on information from previous decision steps. A feature transformer then maps into a decision representation . The final representation can be written schematically as
where T is the number of decision steps. The class-score vector is obtained as
where is a weight matrix and is a bias vector. The probability vector is then obtained with the softmax function,
The model is trained by minimizing the multiclass cross-entropy loss, with a sparsity regularization term on the masks,
where encourages sparse feature usage. This sparsity is useful for the present problem because the 12 adopted features have clear astrophysical meaning, and a model that focuses on a subset of them is easier to interpret.
TabNet is included as a complementary model to LightGBM. The two models represent different inductive biases: LightGBM partitions the feature space through boosted decision trees, whereas TabNet learns differentiable feature selection and nonlinear transformations. Agreement between their feature attributions strengthens the physical interpretation. The TabNet posterior vector is denoted by
3.4. Out-of-Fold Stacking Ensemble
The final classifier is not a simple average of the two base models. We use an out-of-fold stacking ensemble, so the meta-classifier is trained only on base-model predictions from sources not used to fit those base models. Let the stratified cross-validation partition be
where each fold approximately preserves the BZB/BZQ/BZG class ratios. For fold k, the base models are fitted on and evaluated on . For each validation source , we obtain two out-of-fold posterior vectors,
They are concatenated to form a six-dimensional meta-feature vector,
A multinomial logistic-regression meta-classifier [33] is then trained on the set
For class c, the ensemble probability is
where
The out-of-fold stacking probabilities are used only for model comparison. The final value-added catalog adopts the LightGBM probabilities because the stacker’s small macro- increment relative to LightGBM is not significant in the paired bootstrap, whereas its log loss and Brier score are significantly worse. The use of out-of-fold probabilities is critical: it prevents the meta-classifier from being trained on overly optimistic in-sample predictions, thereby reducing leakage during model comparison.
For the final prediction of BZU sources, LightGBM is refitted on the full labeled sample under the selected missing-data strategy. The final label is the class with the largest LightGBM posterior, and the difference between the two largest probabilities is retained as a separation diagnostic. The TabNet and stacking outputs are retained in the machine-readable audit table but are not the recommended probability columns.
3.5. Cross-Validation and Missing-Data Comparison
All model comparisons use the same stratified five-fold cross-validation splits. The missing-data strategy is treated as part of the pipeline and is evaluated inside the same validation framework. In the imputation branch, catalog broadband indices are retained where available, formula-derived values are used only as documented fallbacks, and the remaining missing values are imputed using training-fold medians. In the complete-case branch, any source with a missing value in any adopted feature is removed. The selected strategy is chosen by validation macro-, while the full metric set is reported. The stacking meta-classifier is fitted only to base-model probabilities obtained out of fold, so no base learner supplies an in-sample posterior for its own training source.
3.6. Evaluation Metrics
Because the classes are imbalanced, we report metrics beyond accuracy. Let be the number of classes. For each class c, the one-vs-rest contingency terms are true positives (), false positives (), false negatives (), and true negatives (). The class-wise precision, recall, and are
The macro- and balanced accuracy are
We also report one-vs-rest macro ROC-AUC, macro PR-AUC, Matthews correlation coefficient (MCC), Cohen’s , log loss, multiclass Brier score, and expected calibration error (ECE). ROC-AUC is the area under the receiver operating characteristic curve, and PR-AUC is the area under the precision–recall curve. Both quantify ranking performance, with PR-AUC being particularly useful for imbalanced settings [34,35]. MCC is included as a single-score measure that remains informative under class imbalance [36]. In contrast to the rank- and label-based metrics, log loss and the Brier score are proper scoring rules for probabilistic forecasts [37,38]. ECE and the out-of-fold reliability diagram provide complementary, bin-dependent calibration diagnostics; temperature and Dirichlet scaling are established post hoc approaches when a suitable independent calibration set is available [39,40]. We report the mean and standard deviation across outer folds for every metric and compare the ensemble with each base model using a paired stratified bootstrap over the shared out-of-fold sources. This comparison is descriptive rather than a substitute for a fully independent test because variance estimation and hypothesis testing after cross-validation require care [41,42,43].
3.7. Feature Attribution
For physical interpretation, we compute SHAP feature attributions for both base models. SHAP assigns each input feature an additive contribution to the model output by approximating the Shapley-value concept from cooperative game theory [32]. For LightGBM, we use tree-based SHAP, which provides efficient additive feature attributions for boosted decision trees. For TabNet, we use model-agnostic SHAP on a limited background and evaluation sample. We also report the intrinsic TabNet attention-based feature importance. These explanations are computed for the base models rather than for the stacking meta-classifier because the base models map the original astrophysical features directly to class probabilities, whereas the stacking model maps base-model probabilities to final probabilities. Thus, base-model attributions are the appropriate quantities for physical interpretation.
4. Results
4.1. Missing-Data Strategy Comparison
Table 3 compares the imputation and complete-case strategies using compact metric headers to avoid an overwide main-text table. The imputation strategy retains all 3334 labeled sources and predicts all 227 BZU objects. Complete-case analysis retains only 428 labeled sources and can predict only 40 BZU objects because all twelve features must be present. The performance gap is large: imputation reaches macro-, balanced accuracy , macro ROC-AUC , and macro PR-AUC , while complete-case analysis reaches macro-, balanced accuracy , macro ROC-AUC , and macro PR-AUC . We therefore adopt imputation as the final strategy.
Table 3.
Compact comparison of missing-data strategies for the stacking ensemble. The selected strategy is imputation.
4.2. Model Performance
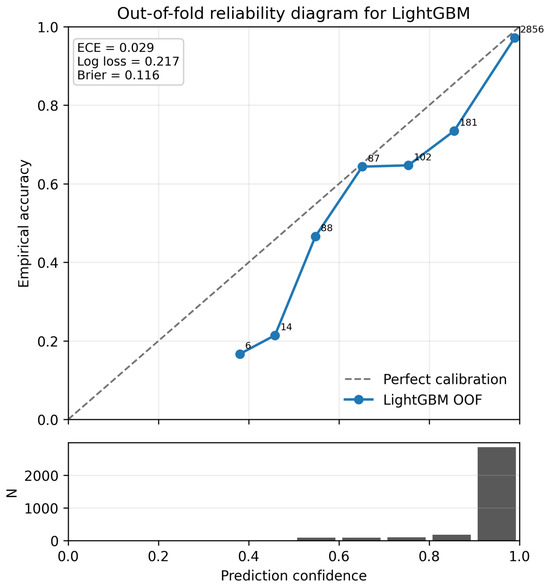
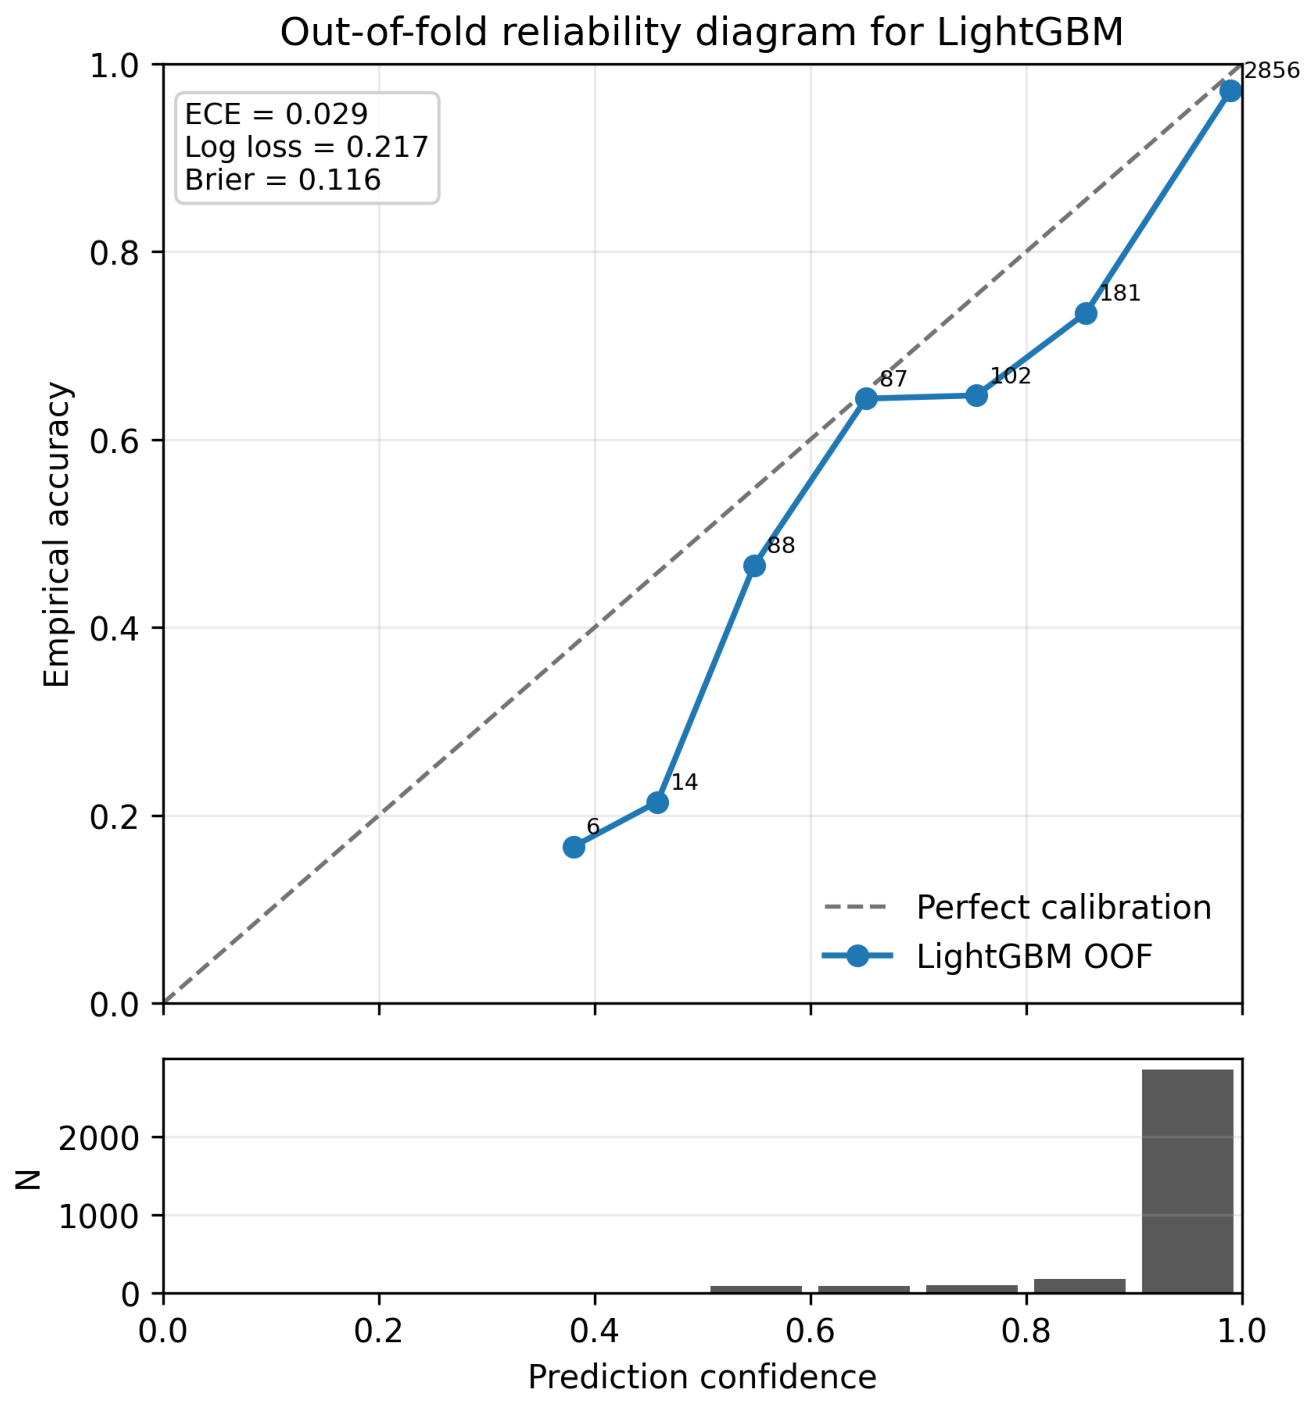
Table 4 compares LightGBM, TabNet, and the stacking ensemble under the selected imputation strategy. Stacking has the highest balanced accuracy (0.907) and macro- (0.885), but its macro- improvement over LightGBM is not significant in a paired stratified bootstrap (, 95% CI , ). Its probability scores are worse: relative to LightGBM, stacking increases log loss by 0.041 (95% CI ) and the multiclass Brier score by 0.0043 (95% CI ). LightGBM is consequently used for the published posterior probabilities. Its out-of-fold ECE is 0.029, log loss is 0.217, and Brier score is 0.116; the reliability diagram is shown in Figure 1, and all fold-level metrics are supplied electronically. These results support useful internal catalog discrimination and moderately well calibrated probabilities, but not a claim of independently validated BZU calibration.
Table 4.
Compact cross-validation performance of the three models under the selected imputation strategy.
Figure 1.
Out-of-fold reliability diagram for the LightGBM probability model on the labeled BZB/BZQ/BZG reference sample. Points show the mean confidence and empirical accuracy in ten confidence bins, with the number of sources in each non-empty bin annotated. The lower panel shows the confidence-bin occupancy. This diagnostic does not validate calibration for the unlabeled BZU population.
The redshift ablations quantify how strongly internal performance depends on catalog variables related to optical classification. With all 12 inputs, stacking obtains macro- and balanced accuracy . Removing redshift alone reduces these values to 0.836 and 0.861, respectively; removing both redshift and its availability indicator reduces them further to 0.761 and 0.783 (Table 5). Thus, a substantial part of the apparent internal predictability is shared with the way the reference labels were established. This limits the interpretation to conditional similarity with 5BZCAT classes and motivates external spectroscopic validation.
Table 5.
Sensitivity of the stacking comparison to redshift-related variables. These are internal validation results on the labeled 5BZCAT sample.
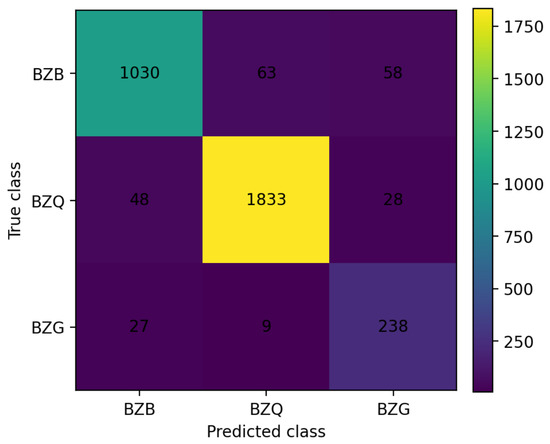
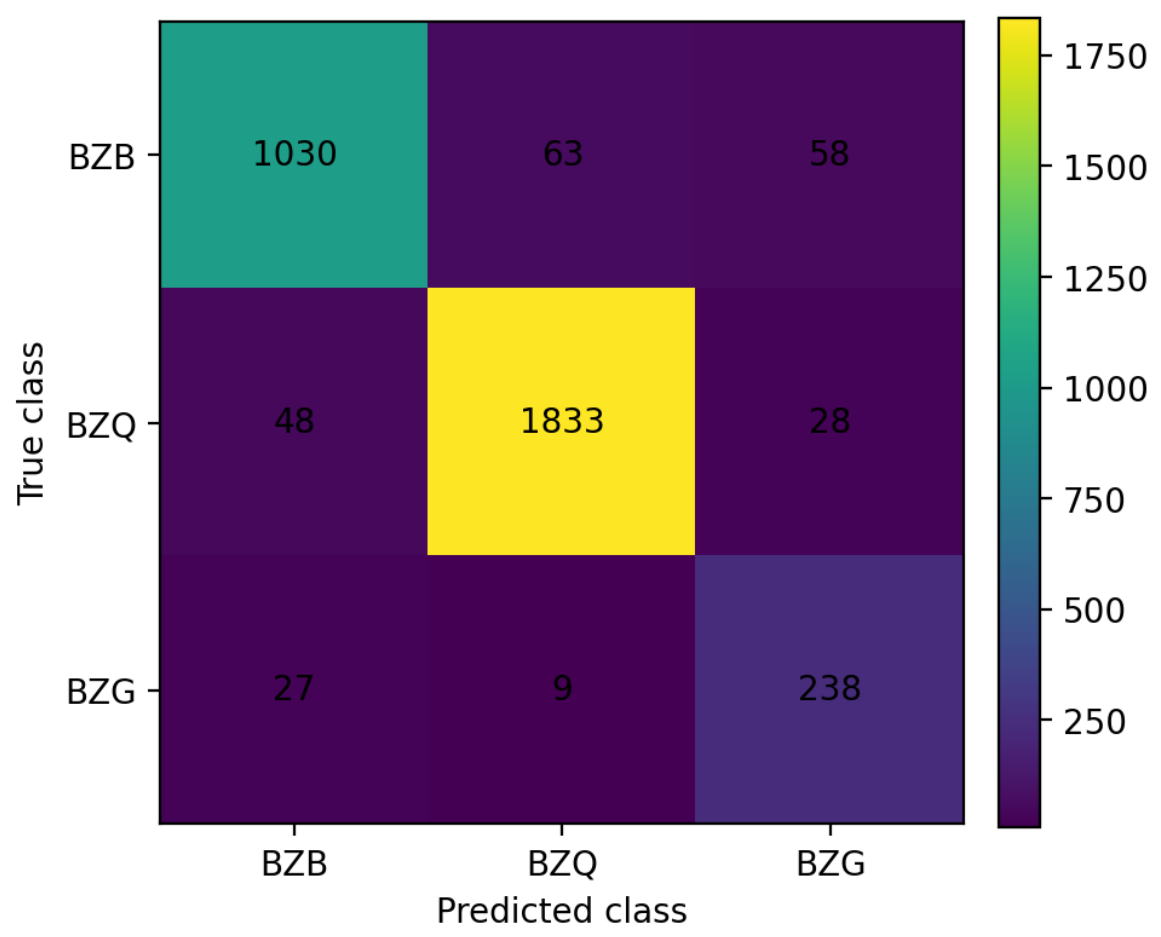
Class-wise stacking performance is shown in Table 6, as a discrimination comparison. BZQ is the easiest class, with precision and recall near 0.960. BZB also shows stable performance, with . BZG is more difficult because it is the smallest training class, but the stacking model achieves a recall of 0.869 and an score of 0.796. The confusion matrix in Figure 2 shows the same pattern: most BZQ sources are recovered, while the main errors involve confusion between BZB and BZQ or between BZB and BZG.
Table 6.
Class-wise validation performance of the stacking ensemble.
Figure 2.
Out-of-fold confusion matrix of the final LightGBM–TabNet stacking ensemble under the selected imputation strategy.
4.3. Classification of BZU Sources
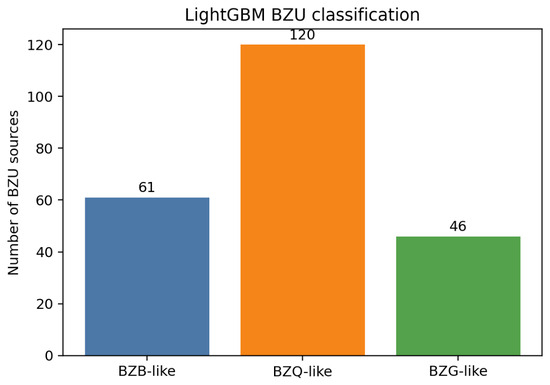
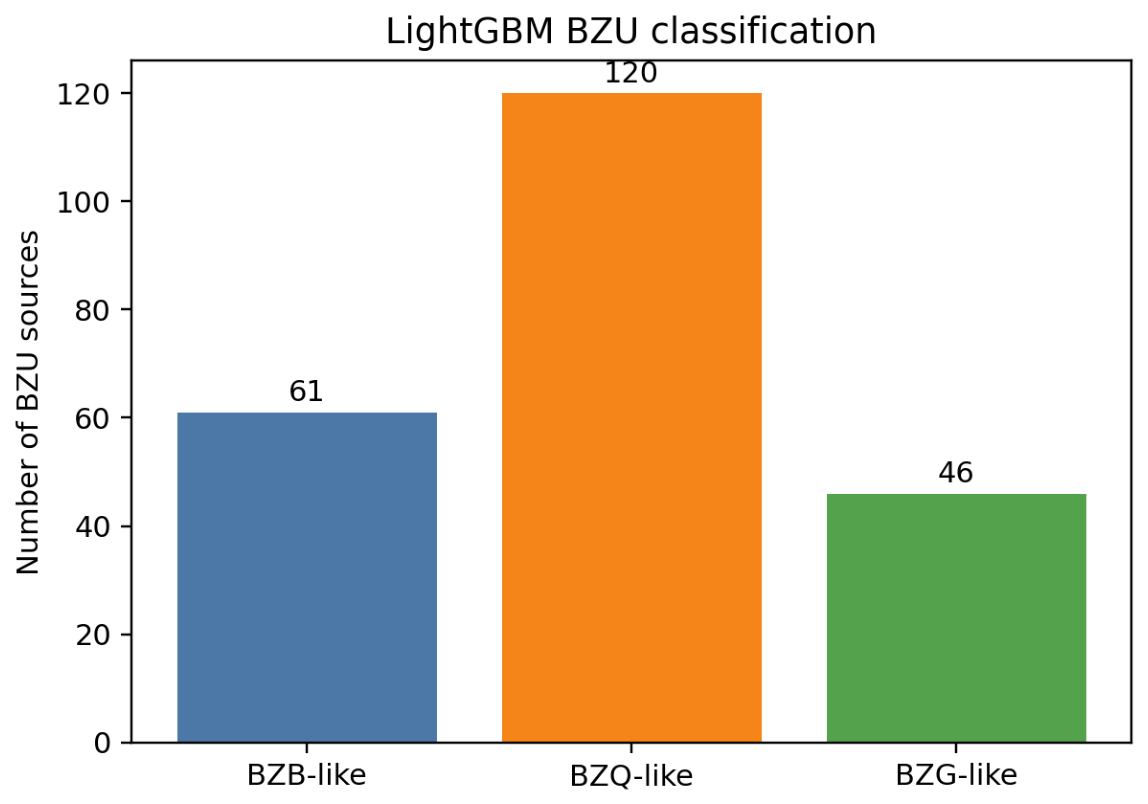
After model validation, we refit LightGBM on the full labeled sample and apply it to all 227 BZU sources. The resulting class distribution is shown in Table 7 and Figure 3. LightGBM assigns 61 sources to BZB-like, 120 to BZQ-like, and 46 to BZG-like classes. The explicit BZG branch remains important: a binary BZB/BZQ classifier would force 20.3% of the BZU sample into a potentially misleading alternative class.
Table 7.
Predicted classes for the 227 BZU sources using the final LightGBM probability model.
Figure 3.
LightGBM predicted class distribution of the 227 BZU sources. Blue, orange, and green bars denote BZB-like, BZQ-like, and BZG-like classifications, respectively.
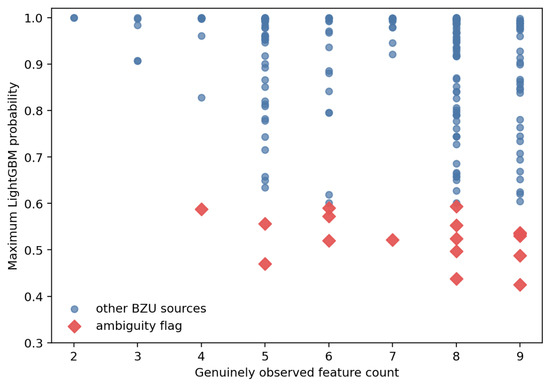
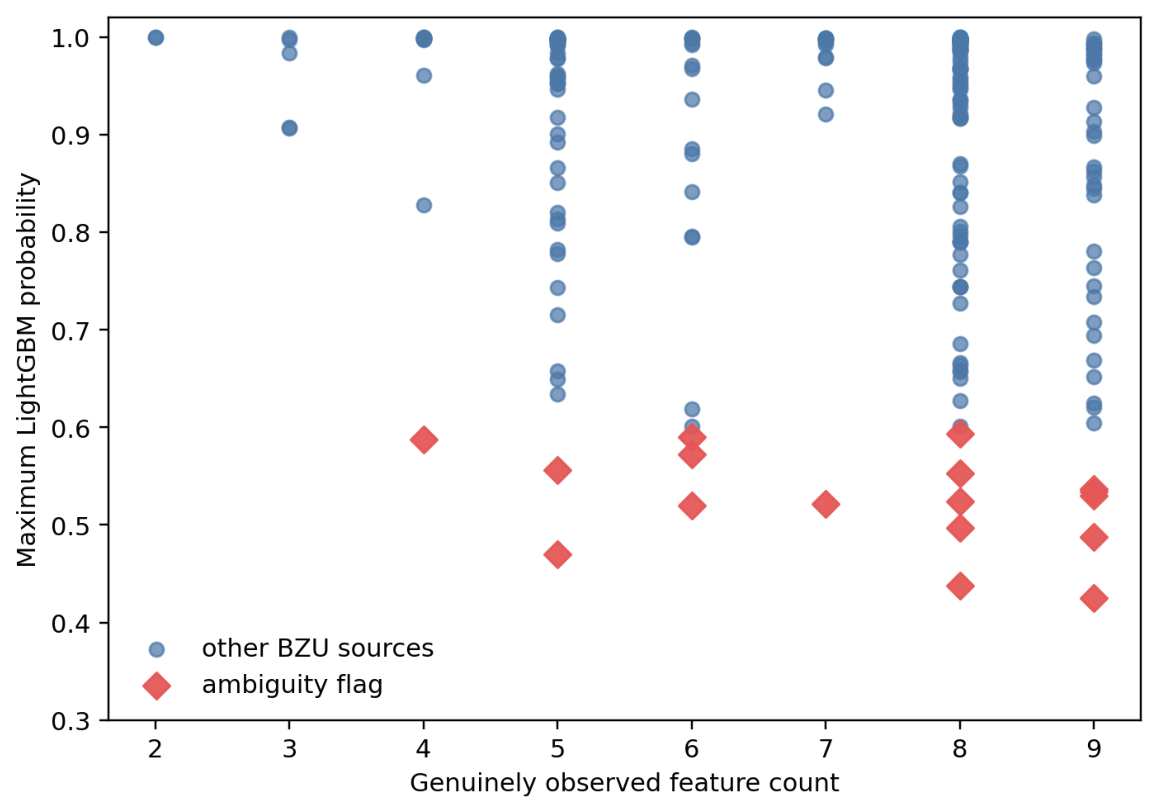
We flag a source when its maximum LightGBM probability is below 0.60 or its top-two probability gap is below 0.15. Seventeen BZU sources meet this model-level probability-separation criterion. They are retained as a machine-readable flag in the complete catalog and are appropriate priorities for spectroscopy or improved multiwavelength coverage. The flag does not demonstrate a transitional physical state; in particular, the coverage diagnostic shows that it is not confined to poorly observed sources.
For the BZU sample, we count genuinely observed physical inputs separately from missingness flags and formula-derived indices. The counts range from two to nine, with seven sources having three or fewer observed inputs. No two of the 227 BZU sources have identical post-imputation 12-dimensional feature vectors. The confidence–coverage plot (Figure 4) shows that the 17 low-separation flags are not concentrated solely among sources with sparse direct coverage. Low probability separation is therefore a catalog-model uncertainty flag, not evidence that a source is physically transitional.
Figure 4.
Maximum LightGBM probability versus the number of genuinely observed physical features for BZU sources. Red diamonds mark the probability-separation flag; missingness flags and formula-derived indices are not counted as independent observed features.
Table 8 presents the first ten rows of the simplified machine-readable BZU probability catalog; the complete 227-source table is provided as an accompanying CSV file. For each source, the printed table reports the 5BZCAT identifier, J2000 equatorial coordinates, the three LightGBM posterior probabilities, the maximum-posterior class, and the top-two probability gap. The final class is defined by . The machine-readable column Prediction_Confidence is exactly and is omitted from the compact printed table because it is redundant with the three probability columns. Coordinates and probabilities are rounded only for display, while the accompanying file retains full numerical precision and source-level feature-provenance diagnostics.
Table 8.
Excerpt of the machine-readable BZU probability catalog. The first ten sources are shown; the complete 227-source table is provided as an accompanying CSV file.
4.4. Global Feature-Importance Results
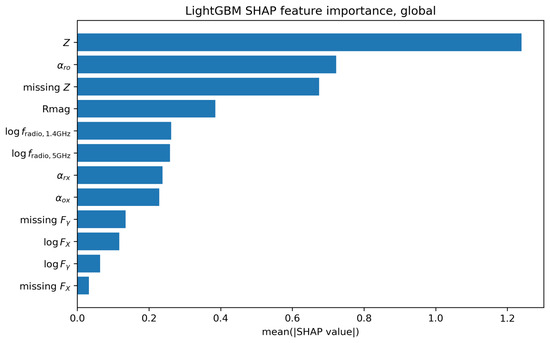
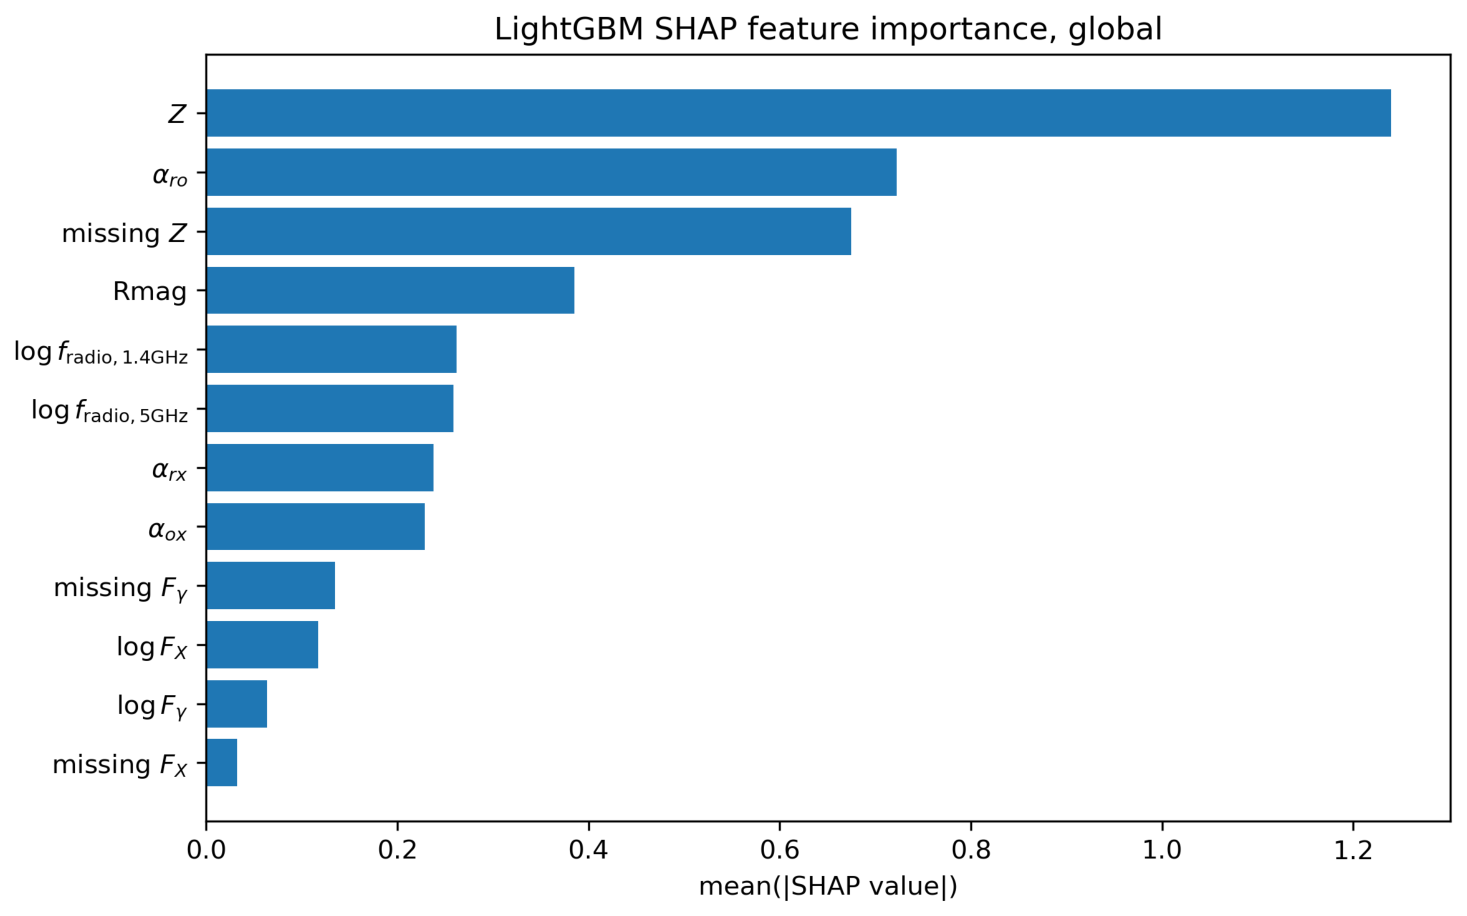
Figure 5 and Table 9 show the LightGBM global SHAP feature importance. The leading variables are Z, , missing Z, Rmag, and radio flux densities. The prominence of redshift and its availability is expected from the catalog construction: line-rich BZQ sources are more likely to have measured redshifts, whereas featureless spectra often impede redshift determination for BZB sources. These rankings therefore identify predictive catalog variables, not independent evidence that redshift is a causal discriminator of intrinsic blazar class. The broad-band indices, optical magnitude, and radio flux densities provide complementary SED and host/jet information.
Figure 5.
Global LightGBM SHAP feature importance using the compact 12-feature set.
Table 9.
Top-12 global LightGBM SHAP feature importance values.
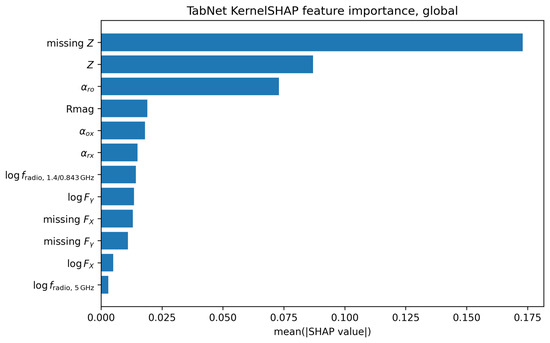
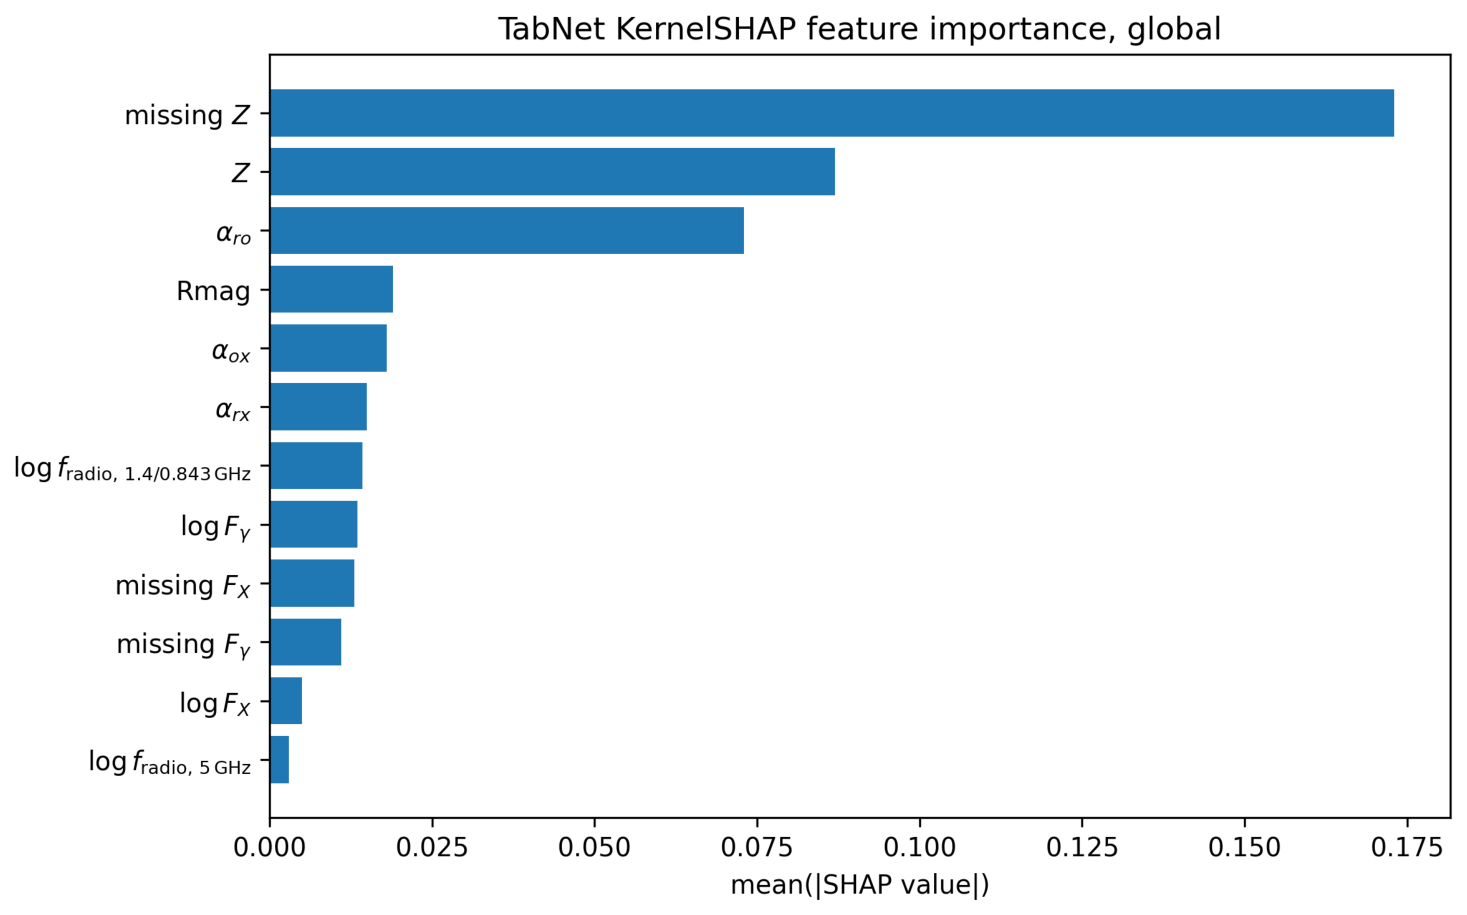
Figure 6 and Table 10 show the TabNet SHAP ranking. The leading features are missing Z, Z, , Rmag, , and . The agreement with LightGBM confirms that the two algorithms exploit a similar mixture of spectroscopy-related catalog proxies and multiwavelength SED information; it does not eliminate the label-proxy limitation demonstrated by the ablations.
Figure 6.
Global TabNet SHAP feature importance using the compact 12-feature set.
Table 10.
Top-12 global TabNet SHAP feature importance values.
The importance of missing Z requires careful interpretation. It is not a direct intrinsic physical variable. Instead, it encodes observational accessibility. BZQ sources generally have broad emission lines and more secure redshifts, while BL Lac objects often have featureless spectra and therefore lack robust redshift measurements. Thus, missing Z carries real catalog-level information, but it reflects selection and measurement effects rather than a separate emission mechanism.
5. Discussion
5.1. Why Imputation Is Preferable for 5BZCAT
The complete-case experiment shows that strict removal of incomplete sources is too destructive for a multiwavelength blazar catalog. Requiring all twelve features to be present reduces the training sample from 3334 to 428 sources and leaves only 40 of the 227 BZU sources predictable. The performance decrease is also substantial. Therefore, complete-case analysis is unsuitable for a value-added catalog whose purpose is to classify the full uncertain population. The selected imputation strategy preserves the catalog scope while avoiding pure black-box filling for broadband indices: if an index is missing but the required fluxes are available, the index is estimated from the standard relation. This makes the imputation physically transparent.
The result also has astrophysical implications. Missing observations are not random in blazar catalogs. Redshift is more frequently measured in line-rich systems, whereas BL Lac objects and galaxy-dominated sources often exhibit weak lines, host-galaxy contamination, or state-dependent continuum dominance. X-ray and gamma-ray coverage also depends on source brightness, survey depth, and association history. The strong performance of the imputation branch with missingness flags, therefore, reflects both astrophysical diversity and observational selection.
5.2. BZG-like Candidates Among BZU Sources
A major result is that 46 of 227 BZU sources are classified as BZG-like by the final LightGBM model. This fraction is large enough that BZG should not be ignored in BZU classification. The BZG-like branch is physically important because host-galaxy-dominated sources can occupy the boundary between classical BL Lacs and radio galaxies. In a binary BZB/BZQ classifier, such sources would be forced into a potentially misleading category. By reporting , , and , the value-added catalog preserves this catalog-level ambiguity.
This is also consistent with broader AGN unification work. Blazars and radio galaxies can be linked through jet viewing angle, accretion state, and radiative mechanism [2,9]. BZG-like BZU objects may therefore be useful targets for testing the relation between aligned and misaligned radio-loud AGNs. Follow-up spectroscopy and host-galaxy decomposition would be especially valuable for these candidates.
5.3. Relation to Previous Machine Learning Classifications
The present work differs from LAT-based BCU classifiers in both the data and the target definitions. Earlier Fermi-LAT classifiers mainly used gamma-ray catalog observables and focused on AGN/pulsar separation, BLL/FSRQ separation, or broader multiclass source classification [18,20,22,24,25,26]. The present task is narrower but more multiwavelength: we classify only BZU sources in 5BZCAT, using optical, radio, X-ray, gamma-ray, redshift, and broad-band spectral-index information. The output is not a general gamma-ray source classification catalog but a BZU-focused value-added catalog.
5.4. Limitations and Follow-Up Priorities
Several limitations should be kept in mind. First, the labels used for supervised training are catalog labels and may include heterogeneous literature classifications. Second, the broadband index estimates used in the imputation branch are approximate. They assume representative frequencies and use an integrated X-ray flux to approximate a flux density, so they should be interpreted as practical catalog-level estimates rather than detailed SED modeling. Third, the missingness features are useful but partly encode observational selection effects. Fourth, BZU sources may be state-dependent: an object classified as BZB-like in one optical state may exhibit BZQ-like broad lines in another state.
The feature-importance results also define a practical direction for future catalog work. Redshift and R-band magnitude are among the most informative variables, but the present study intentionally uses the 5BZCAT entries without augmenting them from later external catalogs. Future versions could cross-match BZU sources with complementary resources such as OCARS, Milliquas, and Pan-STARRS DR2 to update redshifts and optical photometry where reliable matches are available [44,45,46]. For example, such resources may provide redshift information for sources with no 5BZCAT redshift entry and optical-band photometry for sources lacking an R-band magnitude. This would test whether improved input completeness changes the BZU probability distribution and would separate catalog-incompleteness effects from intrinsic source ambiguity.
The catalog should therefore be used probabilistically and conditionally. High-confidence BZQ-like sources are good targets for confirming the presence of broad emission lines. High-confidence BZB-like sources are good targets for redshift constraints through deep spectroscopy or host-galaxy absorption features. BZG-like sources should be checked for host-galaxy dominance and radio-galaxy-like properties. Sources with small top-two probability gaps are particularly useful follow-up targets, but their flags indicate model uncertainty rather than an established transitional state. An external test set with uniform spectroscopy is needed before using the probabilities as calibrated estimates for the BZU population, particularly because predictive uncertainty can degrade under distributional shift [47].
6. Conclusions
We have constructed a machine-readable value-added catalog for the 227 uncertain-type blazars in the fifth Roma-BZCAT. The classifier is trained on 1151 BZB, 1909 BZQ, and 274 BZG sources and predicts three-way probabilities for every BZU object. We use a compact 12-feature set consisting of redshift; optical magnitude; radio flux-density information; X-ray flux; gamma-ray photon flux; missingness flags; and the three broad-band spectral indices , , and .
The main conclusions are as follows. First, imputation is strongly preferred over complete-case analysis: it retains all 3334 labeled sources and all 227 BZU sources. Formula-derived broad-band indices are used only as documented fallbacks for missing catalog fields and are never interpreted as independent measurements. Second, stacking has the best balanced accuracy (0.907), but its macro- advantage over LightGBM is not significant and its proper probability scores are worse. We consequently publish the LightGBM posterior probabilities (accuracy 0.923, macro- 0.878, log loss 0.217, Brier score 0.116, and ECE 0.029). Third, removing redshift, and then both redshift and its availability, reduces stacking macro- from 0.885 to 0.836 and 0.761, respectively. The model therefore predicts similarity to existing 5BZCAT labels conditional on catalog observations; it does not establish an independent taxonomy or validated BZU-population calibration. Fourth, the 227 BZU sources are classified into 61 BZB-like, 120 BZQ-like, and 46 BZG-like objects, with 17 flagged for low probability separation. These flags prioritize follow-up but do not by themselves identify transitional sources. The accompanying catalog includes per-source data-coverage, index-provenance, and feature-vector diagnostics. Machine-readable CSV versions of Table 1, Table 2, Table 3, Table 4, Table 5, Table 6, Table 7, Table 8, Table 9 and Table 10 and the additional Tables S1–S4 are provided in the Supplementary Materials.
Author Contributions
Investigation, J.Z. (Jingtian Zhu); methodology, J.Z. (Jingtian Zhu), J.Z. (Jun Zhang), H.C. and G.L.; data processing and formal analysis, J.Z. (Jingtian Zhu) and J.Z. (Jun Zhang); computational resources and support, J.Z. (Jun Zhang), H.C. and G.L.; writing—original draft preparation, J.Z. (Jingtian Zhu); writing—review and editing, all authors; supervision, J.Z. (Jingtian Zhu), X.S., J.F. and D.B.; astrophysical interpretation and scientific significance, X.S., J.F. and D.B.; data processing, H.X., Y.W., X.Z., A.L., Y.S., F.T., Q.W., T.X. and K.O. All authors have read and agreed to the published version of the manuscript.
Funding
This work was supported by the Talent Introduction Project of Wuhu Vocational Technical University (Grant No. wzyrc202509), the Project of the Department of Education of Anhui Province (Grant Nos. 2024AH052024 and 2024jsqygz164), the Project of Wuhu Vocational Technical University (Grant Nos. rc2022dtr05 and WHSYFZX202305), the National Natural Science Foundation of China (NSFC; Grant Nos. 12433004, U2031201, 11733001, and 12203034), the National Key Research and Development Program of China (Grant No. 2025YFA1614102), the National SKA Program of China (No. 2025SKA0130100), the Guangdong Major Project of Basic and Applied Basic Research (Grant No. 2019B030302001), the Astrophysics Key Subjects of Guangdong Province and Guangzhou City, the Shanghai Science and Technology Fund (Grant No. 22YF1431500), the China Manned Space Project (Grant No. CMS-CSST-2025-A07), and the Shanghai Municipal Education Commission regarding artificial intelligence empowered research.
Data Availability Statement
The fifth Roma-BZCAT catalog is publicly available through the ASI Space Science Data Center, VizieR/CDS, and HEASARC. The value-added BZU probability catalog, model performance tables, and feature importance tables generated in this work are provided as accompanying machine-readable CSV files in the Supplementary Materials.
Acknowledgments
The authors gratefully acknowledge the Wuhu Engineering Technology Research Center of Big Data and Artificial Intelligence for its support. The authors also thank the maintainers of the fifth edition of the Roma-BZCAT catalog and the developers of the open-source Python 3.12 packages used in this work.
Conflicts of Interest
Guo Li, Yang Wen, and Xianyao Zhang are employees of Anhui Longding Information Technology Co., Ltd. The other authors declare no conflicts of interest.
Abbreviations
| AGN | active galactic nucleus |
| BA | balanced accuracy |
| BZB | BL Lacertae object class in 5BZCAT |
| BZG | host-galaxy-dominated blazar-like class in 5BZCAT |
| BZQ | flat-spectrum radio quasar class in 5BZCAT |
| BZU | blazar of uncertain type in 5BZCAT |
| ECE | expected calibration error |
| FN | false negative |
| FP | false positive |
| LightGBM | Light Gradient Boosting Machine |
| MCC | Matthews correlation coefficient |
| OOF | out of fold |
| PR-AUC | area under the precision–recall curve |
| ROC-AUC | area under the receiver operating characteristic curve |
| SED | spectral energy distribution |
| SHAP | SHapley Additive exPlanations |
| TN | true negative |
| TP | true positive |
References
- Blandford, R.D.; Rees, M.J. Some Comments on Radiation Mechanisms in Lacertids. In Pittsburgh Conference on BL Lac Objects; Wolfe, A.M., Ed.; University of Pittsburgh: Pittsburgh, PA, USA, 1978; pp. 328–341. [Google Scholar]
- Urry, C.M.; Padovani, P. Unified Schemes for Radio-Loud Active Galactic Nuclei. Publ. Astron. Soc. Pac. 1995, 107, 803–845. [Google Scholar] [CrossRef] [Scilit] [PubMed]
- Ghisellini, G.; Celotti, A.; Fossati, G.; Maraschi, L.; Comastri, A. A Theoretical Unifying Scheme for Gamma-Ray Bright Blazars. Mon. Not. R. Astron. Soc. 1998, 301, 451–468. [Google Scholar] [CrossRef] [Scilit]
- Fossati, G.; Maraschi, L.; Celotti, A.; Comastri, A.; Ghisellini, G. A Unifying View of the Spectral Energy Distributions of Blazars. Mon. Not. R. Astron. Soc. 1998, 299, 433–448. [Google Scholar] [CrossRef] [Scilit]
- Ghisellini, G.; Righi, C.; Costamante, L.; Tavecchio, F. The Fermi Blazar Sequence. Mon. Not. R. Astron. Soc. 2017, 469, 255–266. [Google Scholar] [CrossRef] [Scilit]
- Marcha, M.J.M.; Browne, I.W.A.; Impey, C.D.; Smith, P.S. Optical Spectroscopy and Polarization of a New Sample of Optically Bright Flat Radio Spectrum Sources. Mon. Not. R. Astron. Soc. 1996, 281, 425–448. [Google Scholar] [CrossRef] [Scilit]
- Landt, H.; Padovani, P.; Giommi, P. The Classification of BL Lacertae Objects: The Ca H&K Break. Mon. Not. R. Astron. Soc. 2002, 336, 945–956. [Google Scholar] [CrossRef] [Scilit]
- Landt, H.; Padovani, P.; Perlman, E.S.; Giommi, P. A Physical Classification Scheme for Blazars. Mon. Not. R. Astron. Soc. 2004, 351, 83–92. [Google Scholar] [CrossRef] [Scilit]
- Fanaroff, B.L.; Riley, J.M. The Morphology of Extragalactic Radio Sources of High and Low Luminosity. Mon. Not. R. Astron. Soc. 1974, 167, 31P–36P. [Google Scholar] [CrossRef] [Scilit]
- Massaro, E.; Giommi, P.; Leto, C.; Marchegiani, P.; Maselli, A.; Perri, M.; Piranomonte, S.; Sclavi, S. Roma-BZCAT: A Multifrequency Catalogue of Blazars. Astron. Astrophys. 2009, 495, 691–696. [Google Scholar] [CrossRef] [Scilit]
- Massaro, E.; Maselli, A.; Leto, C.; Marchegiani, P.; Perri, M.; Giommi, P.; Piranomonte, S. The 5th Edition of the Roma-BZCAT. A Short Presentation. Astrophys. Space Sci. 2015, 357, 75. [Google Scholar] [CrossRef] [Scilit]
- Shaw, M.S.; Romani, R.W.; Healey, S.E.; Michelson, P.F.; Cotter, G.; Potter, W.J.; Readhead, A.C.S.; Richards, J.L.; Max-Moerbeck, W.; King, O. Spectroscopy of the Largest Ever γ-Ray-Selected BL Lac Sample. Astrophys. J. 2013, 764, 135. [Google Scholar] [CrossRef] [Scilit]
- Padovani, P.; Giommi, P. The Connection Between X-Ray- and Radio-Selected BL Lacertae Objects. Astrophys. J. 1995, 444, 567–581. [Google Scholar] [CrossRef] [Scilit] [PubMed]
- Wills, B.J.; Wills, D.; Breger, M.; Antonucci, R.R.J.; Barvainis, R. Optical Polarization of Radio-Loud Quasars. Astrophys. J. 1992, 398, 454–475. [Google Scholar] [CrossRef] [Scilit] [PubMed]
- Lee, K.J.; Guillemot, L.; Yue, Y.L.; Kramer, M.; Champion, D.J. Application of Classification Methods to Fermi-LAT Sources. Mon. Not. R. Astron. Soc. 2012, 424, 2832–2840. [Google Scholar] [CrossRef] [Scilit][Green Version]
- Mirabal, N.; Frias-Martinez, V.; Hassan, T.; Frias-Martinez, E. Fermi’s SIBYL: Mining the Gamma-Ray Sky for Dark Matter Subhaloes. Mon. Not. R. Astron. Soc. Lett. 2012, 424, L64–L68. [Google Scholar] [CrossRef] [Scilit]
- Saz Parkinson, P.M.; Xu, H.; Yu, P.L.H.; Salvetti, D.; Marelli, M.; Falcone, A.D. Classification and Ranking of Fermi LAT Gamma-Ray Sources from the 3FGL Catalog Using Machine Learning Techniques. Astrophys. J. 2016, 820, 8. [Google Scholar] [CrossRef] [Scilit]
- Chiaro, G.; Salvetti, D.; La Mura, G.; Giroletti, M.; Thompson, D.J.; Bastieri, D. Blazar Flaring Patterns (B-FlaP) Classifier for Fermi-LAT Sources. Mon. Not. R. Astron. Soc. 2016, 462, 3180–3195. [Google Scholar] [CrossRef] [Scilit]
- Salvetti, D.; Chiaro, G.; La Mura, G.; Thompson, D.J. 3FGLzoo: Classifying 3FGL Unassociated Fermi-LAT Gamma-Ray Sources by Artificial Neural Networks. Mon. Not. R. Astron. Soc. 2017, 470, 1291–1297. [Google Scholar] [CrossRef] [Scilit]
- Zhu, K.R.; Kang, S.J.; Zheng, Y.G. Searching for AGN and Pulsar Candidates in 4FGL Unassociated Sources Using Machine Learning. Res. Astron. Astrophys. 2021, 21, 15. [Google Scholar] [CrossRef] [Scilit]
- Germani, S.; Tosti, G.; Lubrano, P.; Cutini, S.; Mereu, I.; Berretta, A. Artificial Neural Network Classification of 4FGL Sources. Mon. Not. R. Astron. Soc. 2021, 505, 5853–5861. [Google Scholar] [CrossRef] [Scilit]
- Bhat, A.; Malyshev, D. Machine Learning Methods for Constructing Probabilistic Fermi-LAT Catalogs. Astron. Astrophys. 2022, 660, A87. [Google Scholar] [CrossRef] [Scilit]
- Coronado-Blazquez, J. Classification of Fermi-LAT Unidentified Gamma-Ray Sources Using CatBoost Gradient Boosting Decision Trees. Mon. Not. R. Astron. Soc. 2022, 515, 1807–1814. [Google Scholar] [CrossRef] [Scilit]
- Cooper, N.; Dainotti, M.G.; Narendra, A.; Liodakis, I.; Bogdan, M. Fermi LAT AGN Classification Using Supervised Machine Learning. Mon. Not. R. Astron. Soc. 2023, 525, 1731–1745. [Google Scholar] [CrossRef] [Scilit]
- Tolamatti, A.; Singh, K.K.; Yadav, K.K. Classification of the Fermi-LAT Blazar Candidates of Uncertain Type. Mon. Not. R. Astron. Soc. 2023, 523, 5341–5352. [Google Scholar] [CrossRef] [Scilit]
- Malyshev, D.; Bhat, A. Multi-Class Classification of Fermi-LAT Sources with Hierarchical Class Definition. Mon. Not. R. Astron. Soc. 2023, 521, 6195–6209. [Google Scholar] [CrossRef] [Scilit]
- Malyshev, D.V. Effect of Covariate Shift on Multi-Class Classification of Fermi-LAT Sources. RAS Tech. Instrum. 2023, 2, 735–751. [Google Scholar] [CrossRef] [Scilit]
- Ke, G.; Meng, Q.; Finley, T.; Wang, T.; Chen, W.; Ma, W.; Ye, Q.; Liu, T.Y. LightGBM: A Highly Efficient Gradient Boosting Decision Tree. In Advances in Neural Information Processing Systems 30; Curran Associates: Red Hook, NY, USA, 2017; pp. 3146–3154. Available online: https://papers.nips.cc/paper/6907-lightgbm-a-highly-efficient-gradient-boosting-decision-tree (accessed on 9 July 2026).
- Arik, S.O.; Pfister, T. TabNet: Attentive Interpretable Tabular Learning. Proc. AAAI Conf. Artif. Intell. 2021, 35, 6679–6687. [Google Scholar] [CrossRef] [Scilit]
- Wolpert, D.H. Stacked Generalization. Neural Netw. 1992, 5, 241–259. [Google Scholar] [CrossRef] [Scilit]
- Oke, J.B.; Gunn, J.E. Secondary Standard Stars for Absolute Spectrophotometry. Astrophys. J. 1983, 266, 713–717. [Google Scholar] [CrossRef] [Scilit]
- Lundberg, S.M.; Lee, S.I. A Unified Approach to Interpreting Model Predictions. In Advances in Neural Information Processing Systems 30; Curran Associates: Red Hook, NY, USA, 2017; pp. 4765–4774. Available online: https://papers.nips.cc/paper/7062-a-unified-approach-to-interpreting-model-predictions (accessed on 9 July 2026).
- Pedregosa, F.; Varoquaux, G.; Gramfort, A.; Michel, V.; Thirion, B.; Grisel, O.; Blondel, M.; Prettenhofer, P.; Weiss, R.; Dubourg, V.; et al. Scikit-learn: Machine Learning in Python. J. Mach. Learn. Res. 2011, 12, 2825–2830. Available online: https://jmlr.org/papers/v12/pedregosa11a.html (accessed on 9 July 2026).
- Fawcett, T. An Introduction to ROC Analysis. Pattern Recognit. Lett. 2006, 27, 861–874. [Google Scholar] [CrossRef] [Scilit]
- Saito, T.; Rehmsmeier, M. The Precision-Recall Plot Is More Informative than the ROC Plot When Evaluating Binary Classifiers on Imbalanced Datasets. PLoS ONE 2015, 10, e0118432. [Google Scholar] [CrossRef] [Scilit] [PubMed]
- Chicco, D.; Jurman, G. The advantages of the Matthews correlation coefficient (MCC) over F1 score and accuracy in binary classification evaluation. BMC Genom. 2020, 21, 6. [Google Scholar] [CrossRef] [Scilit] [PubMed]
- Brier, G.W. Verification of Forecasts Expressed in Terms of Probability. Mon. Weather Rev. 1950, 78, 1–3. [Google Scholar] [CrossRef] [Scilit]
- Gneiting, T.; Raftery, A.E. Strictly Proper Scoring Rules, Prediction, and Estimation. J. Am. Stat. Assoc. 2007, 102, 359–378. [Google Scholar] [CrossRef] [Scilit]
- Guo, C.; Pleiss, G.; Sun, Y.; Weinberger, K.Q. On Calibration of Modern Neural Networks. In Proceedings of the 34th International Conference on Machine Learning; PMLR: Sydney, Australia, 2017; pp. 1321–1330. [Google Scholar]
- Kull, M.; Silva Filho, T.M.; Flach, P. Beyond Temperature Scaling: Obtaining Well-Calibrated Multiclass Probabilities with Dirichlet Calibration. In Advances in Neural Information Processing Systems 32; Curran Associates: Red Hook, NY, USA, 2019. [Google Scholar]
- Dietterich, T.G. Approximate Statistical Tests for Comparing Supervised Classification Learning Algorithms. Neural Comput. 1998, 10, 1895–1923. [Google Scholar] [CrossRef] [Scilit] [PubMed]
- Nadeau, C.; Bengio, Y. Inference for the generalization error. Mach. Learn. 2003, 52, 239–281. [Google Scholar] [CrossRef] [Scilit]
- Demšar, J. Statistical Comparisons of Classifiers over Multiple Data Sets. J. Mach. Learn. Res. 2006, 7, 1–30. [Google Scholar]
- Malkin, Z. A New Version of the OCARS Catalog of Optical Characteristics of Astrometric Radio Sources. arXiv 2018, arXiv:1810.06029. [Google Scholar] [CrossRef] [Scilit]
- Flesch, E.W. The Half Million Quasars (HMQ) Catalogue. Publ. Astron. Soc. Aust. 2015, 32, e010. [Google Scholar] [CrossRef] [Scilit]
- Flewelling, H.A.; Magnier, E.A.; Chambers, K.C.; Heasley, J.N.; Holmberg, C.; Huber, M.E.; Sweeney, W.; Waters, C.Z.; Calamida, A.; Casertano, S.; et al. The Pan-STARRS1 Database and Data Products. Astrophys. J. Suppl. Ser. 2020, 251, 7. [Google Scholar] [CrossRef] [Scilit]
- Ovadia, Y.; Fertig, E.; Ren, J.; Nado, Z.; Sculley, D.; Nowozin, S.; Dillon, J.V.; Lakshminarayanan, B.; Snoek, J. Can You Trust Your Model’s Uncertainty? Evaluating Predictive Uncertainty under Dataset Shift. In Advances in Neural Information Processing Systems 32; Curran Associates: Red Hook, NY, USA, 2019. [Google Scholar]

Disclaimer/Publisher’s Note: The statements, opinions and data contained in all publications are solely those of the individual author(s) and contributor(s) and not of MDPI and/or the editor(s). MDPI and/or the editor(s) disclaim responsibility for any injury to people or property resulting from any ideas, methods, instructions or products referred to in the content. |
© 2026 by the authors. Licensee MDPI, Basel, Switzerland. This article is an open access article distributed under the terms and conditions of the Creative Commons Attribution (CC BY) license.