


Abstract
Universal Time (UT1) is a core component of the Earth orientation parameters (EOP). High-precision UT1 predictions are essential for satellite navigation, deep-space exploration, and the maintenance of national standard time. Although effective angular momentum (EAM) information can improve UT1 predictions, the impacts of different angular momentum combinations on prediction performance have not yet been systematically investigated. To improve the prediction accuracy of the National Time Service Center (NTSC) UT1 products, we constructed four prediction schemes: Case 1 uses only atmospheric angular momentum (AAM) data; Case 2 uses AAM + oceanic angular momentum (OAM) data; Case 3 uses AAM + OAM + hydrological angular momentum (HAM) data; and Case 4 uses the full EAM datasets combining AAM, OAM, HAM, and sea-level angular momentum (SLAM) data. The input UT1 series is from the NTSC EOP products, and the 10-day angular momentum forecasts are provided by the German Research Centre for Geosciences (GFZ). The rolling forecast evaluation was conducted from June 2024 to September 2025. The results show that Case 2 performs best for short-term UT1 predictions over 1–12 days, improving the mean prediction accuracy by 10.7%, 10.0%, and 52.0% relative to the predictions using Case 4, IERS finals.daily, and the original NTSC predictions, respectively. For medium- and long-term UT1 predictions over 13–90 days, Case 1 performs best, with corresponding mean improvements of 9.8%, 50.7%, and 61.3%, respectively. These results indicate that incorporating more angular momentum components does not necessarily lead to better UT1 predictions, i.e., Case 2 is preferable for short-term UT1 predictions, whereas Case 1 is more suitable for medium- and long-term UT1 predictions. These findings provide empirical evidence and practical guidance for optimizing UT1 prediction models.
1. Introduction
Universal Time (UT1) is a time scale defined by the Earth’s rotation and describes the rotational state of the Earth with respect to inertial space. As an important component of the Earth orientation parameters (EOP), UT1 is one of the parameters that provide the link between terrestrial and celestial reference frames and is therefore essential for satellite navigation, deep-space exploration, spacecraft tracking and control, time-service applications, and the generation and maintenance of national standard time [1,2,3]. Because the Earth is not a rigid body, its rotation is continuously affected by mass redistribution and angular-momentum exchange among the atmosphere, oceans, terrestrial hydrosphere, and solid Earth. Seasonal variations in the atmosphere, oceans, and terrestrial water storage, as well as changes in the Earth’s internal structure, can alter both the Earth’s rotation rate and its rotational phase [4,5]. As a result, UT1 exhibits non-uniform and time-varying behavior over multiple temporal scales. The associated length-of-day (LOD) variations provide a direct measure of changes in the Earth’s rotation rate and form an important basis for the analysis and prediction of Earth rotation [6].
High-precision UT1 determination mainly relies on Very Long Baseline Interferometry (VLBI) [7], together with other space-geodetic techniques such as the Global Navigation Satellite System (GNSS) [8], Satellite Laser Ranging (SLR) [9], and Doppler Orbitography and Radiopositioning Integrated by Satellite (DORIS) [10]. Among these techniques, VLBI is the only one capable of directly determining UT1, whereas the other techniques contribute mainly through LOD-related information [11]. However, because EOP determination involves observation, transmission, processing, and product release, operational EOP products inevitably suffer from latency. Consequently, observed EOP products alone cannot satisfy applications that require real-time or near-real-time Earth orientation information. High-precision UT1 prediction is therefore increasingly important for navigation, rapid orbit determination, and continuous time service [12,13].
At present, UT1 predictions are commonly based on the combined least-squares (LS) and autoregressive (AR) framework. In this approach, the LS algorithm is used to model the trend and dominant periodic components of the Earth-rotation series, while the AR process is used to predict the remaining residuals [14,15,16]. With the increasing understanding of the geophysical excitation of Earth rotation, effective angular momentum (EAM) products, including atmospheric angular momentum (AAM), oceanic angular momentum (OAM), hydrological angular momentum (HAM), and sea-level angular momentum (SLAM), have been increasingly incorporated into UT1 prediction studies [17]. Previous studies have shown that denoised EAM datasets can provide additional improvements in UT1-UTC and LOD prediction accuracy [18]. Dill et al. [19] developed a 90-day UT1 prediction model based on EAM datasets combined with the LS + AR method and reported a significant improvement in UT1 prediction accuracy. The Second Earth Orientation Parameters Prediction Comparison Campaign (2nd EOP PCC), organized by the German Research Centre for Geosciences (GFZ, Potsdam, Germany) during 2021–2022, further demonstrated that the use of historical EAM data together with EAM forecasts can substantially improve short- and medium-term UT1 predictions [16]. This approach has since become an important direction in UT1 forecasting research.
The International Earth Rotation and Reference Systems Service (IERS) has long provided internationally recognized EOP reference products, including the C04 series, daily, and Bulletin A products, which are widely used as benchmarks in EOP research [20]. In recent years, China has also made substantial progress in the development of EOP products. Based on domestic VLBI, the International GNSS Monitoring and Assessment System (iGMAS), Digital Zenith Telescope (DZT), and related facilities, the National Time Service Center (NTSC) has established an operational UT1 measurement and service system and has released NTSC EOP products including final, rapid, and prediction products. However, previous studies have mainly focused on autonomous observation, data combination, and service-system development, while the systematic use of external angular momentum excitation information in NTSC UT1 predictions has remained relatively limited [21].
Previous studies have mainly examined whether EAM should be introduced, or whether one specific type of angular momentum information is useful. In contrast, the relative performance of different angular momentum combinations, including Cases 1–4, has not yet been systematically discussed, particularly across different forecast horizons [17,22,23,24]. Li et al. [25] analyzed the effects of angular momentum data from GFZ and the Swiss Federal Institute of Technology Zurich (ETH) on polar motion prediction accuracy and concluded that ETH data perform better for medium- and long-term predictions, whereas GFZ data perform better for short-term predictions. However, the influence of different angular momentum combinations on EOP prediction accuracy was not considered. In this work, we investigate the effects of different angular-momentum combination schemes on NTSC UT1 prediction accuracy. Using the NTSC UT1 dataset as the input series and IERS 20 C04 series as the reference series, we compare four angular momentum combinations in a unified prediction framework, the LS + AR model, and further test the universality of the conclusions using IERS-based input data.
2. Data and Methods
2.1. Datasets
The data used in this study include three categories: angular momentum data, NTSC EOP data, and IERS data. All UT1 prediction experiments were carried out using the NTSC data as the input series, while IERS 20 C04 and IERS finals.daily products were used for benchmark evaluation and comparative validation. A rolling prediction strategy was adopted for samples from June 2024 to September 2025. Using the NTSC historical series updated each day as the initial input, UT1 and LOD forecasts for the subsequent 1–90 days were generated, and the mean absolute error (MAE) was then computed per forecast day across all samples to reduce the influence of random errors associated with any single forecast epoch.
2.1.1. GFZ Angular Momentum Datasets
This study used the AAM, OAM, HAM, and SLAM products provided by GFZ [5], and focused on the axial component (z-direction), which corresponds to changes in Earth’s rotation rate [26]. AAM reflects the excitation of Earth rotation by the atmospheric mass and motion terms. OAM represents the contribution of ocean circulation and ocean-bottom pressure variations to angular momentum conservation. HAM describes the additional effects associated with terrestrial water storage and hydrological processes, whereas SLAM further supplements the role of sea-level mass variations [23].
The progression from Case 1 to Case 2, Case 3, and finally Case 4 therefore corresponds to a gradual extension from a single-layer excitation framework to a more complete multi-layer framework. Both observational data and 10-day EAM forecast data from GFZ were used in this study [27]. The corresponding products are available from https://rz-vm480.gfz.de/files/ESMGFZ/EAM/archive_forecast/ (accessed on 4 August 2026).
2.1.2. NTSC Dataset
The historical input sequence for predictions was taken from the EOP products released by NTSC. Based on the combined processing of multiple domestic observation sources, including VLBI and iGMAS, these products have formed a stable UT1 measurement and service system and represent the current performance level of NTSC EOP products. Independent assessments against IERS EOP 20 C04 and products from the Jet Propulsion Laboratory (JPL, Pasadena, CA, USA), the United States Naval Observatory (USNO, Washington, DC, USA), and the European Space Agency (ESA, Paris, France)demonstrated the stable long-term performance and reliability of the NTSC UT1 series [21]. Instead of directly using international EOP series as historical samples, carrying out the comparison within the NTSC data framework allows for a more realistic evaluation of how much angular momentum information improves NTSC UT1 predictions. The NTSC EOP products are available from http://www.ut1.ntsc.ac.cn/page/dataInfo?dataId=12446 (accessed on 4 August 2026).
2.1.3. IERS Datasets
The IERS datasets were used both for evaluation and for universality testing. First, IERS 20 C04 series was adopted as the high-precision reference series for the unified calculation of MAE for different models at each forecast horizon [16]. Second, the IERS finals.daily file for the same period from June 2024 to September 2025 was used as a comparison target to evaluate the improvements achieved by different angular momentum combinations relative to internationally available products. IERS EOP 20 C04 was used as the independent reference series for all error calculations, whereas IERS finals.daily was used only as an operational comparison product or as historical input available before each forecast origin [16]. Third, an IERS-based input dataset was used for additional prediction experiments to examine the consistency of the segmented behavior.
IERS 20 C04 integrates observations from multiple space-geodetic techniques and is widely regarded as an authoritative reference series for EOP evaluation [28]. All UT1 and LOD error statistics in this study were computed with respect to this dataset. The IERS products are available from https://www.iers.org/iers/en/dataproducts/earthorientationdata/eop (accessed on 4 August 2026).
2.2. Prediction Methodology
2.2.1. The LS Method
The LS method is classically used to extract trend and periodic components from UT1 and LOD for prediction purposes. Because UT1 is influenced by mass redistribution among the Earth’s geophysical layers, seasonal variation, and long-term internal evolution, it exhibits complex temporal behavior containing both deterministic and stochastic components. Its long-term variations are generally composed of a trend term, annual and semiannual terms, and several medium- and short-period oscillations. The LS method was therefore used to fit the linear and periodic components of the series.
Here, denotes the observed value at epoch t; and represent the constant term and the linear trend coefficient, respectively; is the period of the i-th periodic component; and are the corresponding sine and cosine coefficients; denotes the random residual; and k is the number of periodic components included in the model. The fitted periodic terms include the 9.13 d term associated with the lunar latitudinal tide, the 13.7 d semi-monthly term and the 27.4 d monthly term associated with lunar tidal forcing, the seasonal and subseasonal periods of 121.75 d, 182.62 d, and 365.24 d associated with atmosphere-ocean motion, and the interannual periods of 1095.72 d and 3396.73 d related to climatic variability such as the El Nino-Southern Oscillation [29,30,31]. The LS method determines the coefficients of these terms by minimizing the sum of squared residuals between the observations and the fitted model.
For signals such as UT1 and LOD, which contain both long-term drift and multi-period oscillations, LS fitting can effectively extract the relatively smooth deterministic structure and reduce the remaining component to a residual sequence that is closer to a stationary process. In the combined prediction framework adopted here, the LS method therefore plays the role of first fitting and then separating the original series, thereby providing a low-noise input for the subsequent AR model.
2.2.2. The AR Method
The AR model is mainly used to fit the residual sequence obtained after LS fitting and is one of the most commonly used stochastic extrapolation methods in Earth rotation predictions [32]. After the trend and dominant periodic components are removed, UT1 and LOD still retain short-term random fluctuations, making them suitable for modeling and extrapolation with an AR model. For the residual series , a p-order AR model can be expressed as follows:
Here, denotes the autoregressive coefficient, p is the model order, and is the white-noise term. This model establishes predictions based on the historical behavior of the residual series itself. The model order was selected by considering both forecast performance and model complexity. In this study, the AR order was determined according to the final prediction error criterion.
2.2.3. Prediction Procedure Using Different Angular Momentum Combinations
By introducing angular momentum data into the classical LS + AR framework, the conventional statistical model can be combined with the external physical excitation of Earth rotation. The EAM + LS + AR approach proposed by Dill et al. [19] first uses LS + AR to predict the residual between geodetic angular momentum (GAM) and EAM. This predicted residual is then added to the angular momentum forecast data, yielding UT1 predictions that are more consistent with the actual evolution of Earth’s rotation. Geodetic angular momentum (GAM) is the geodetic angular-momentum excitation function derived from observed Earth-rotation variations through the Liouville relationship. For Case k, denotes the angular-momentum series used in that case, and the case-dependent residual is defined as , where . Therefore, four series are constructed.
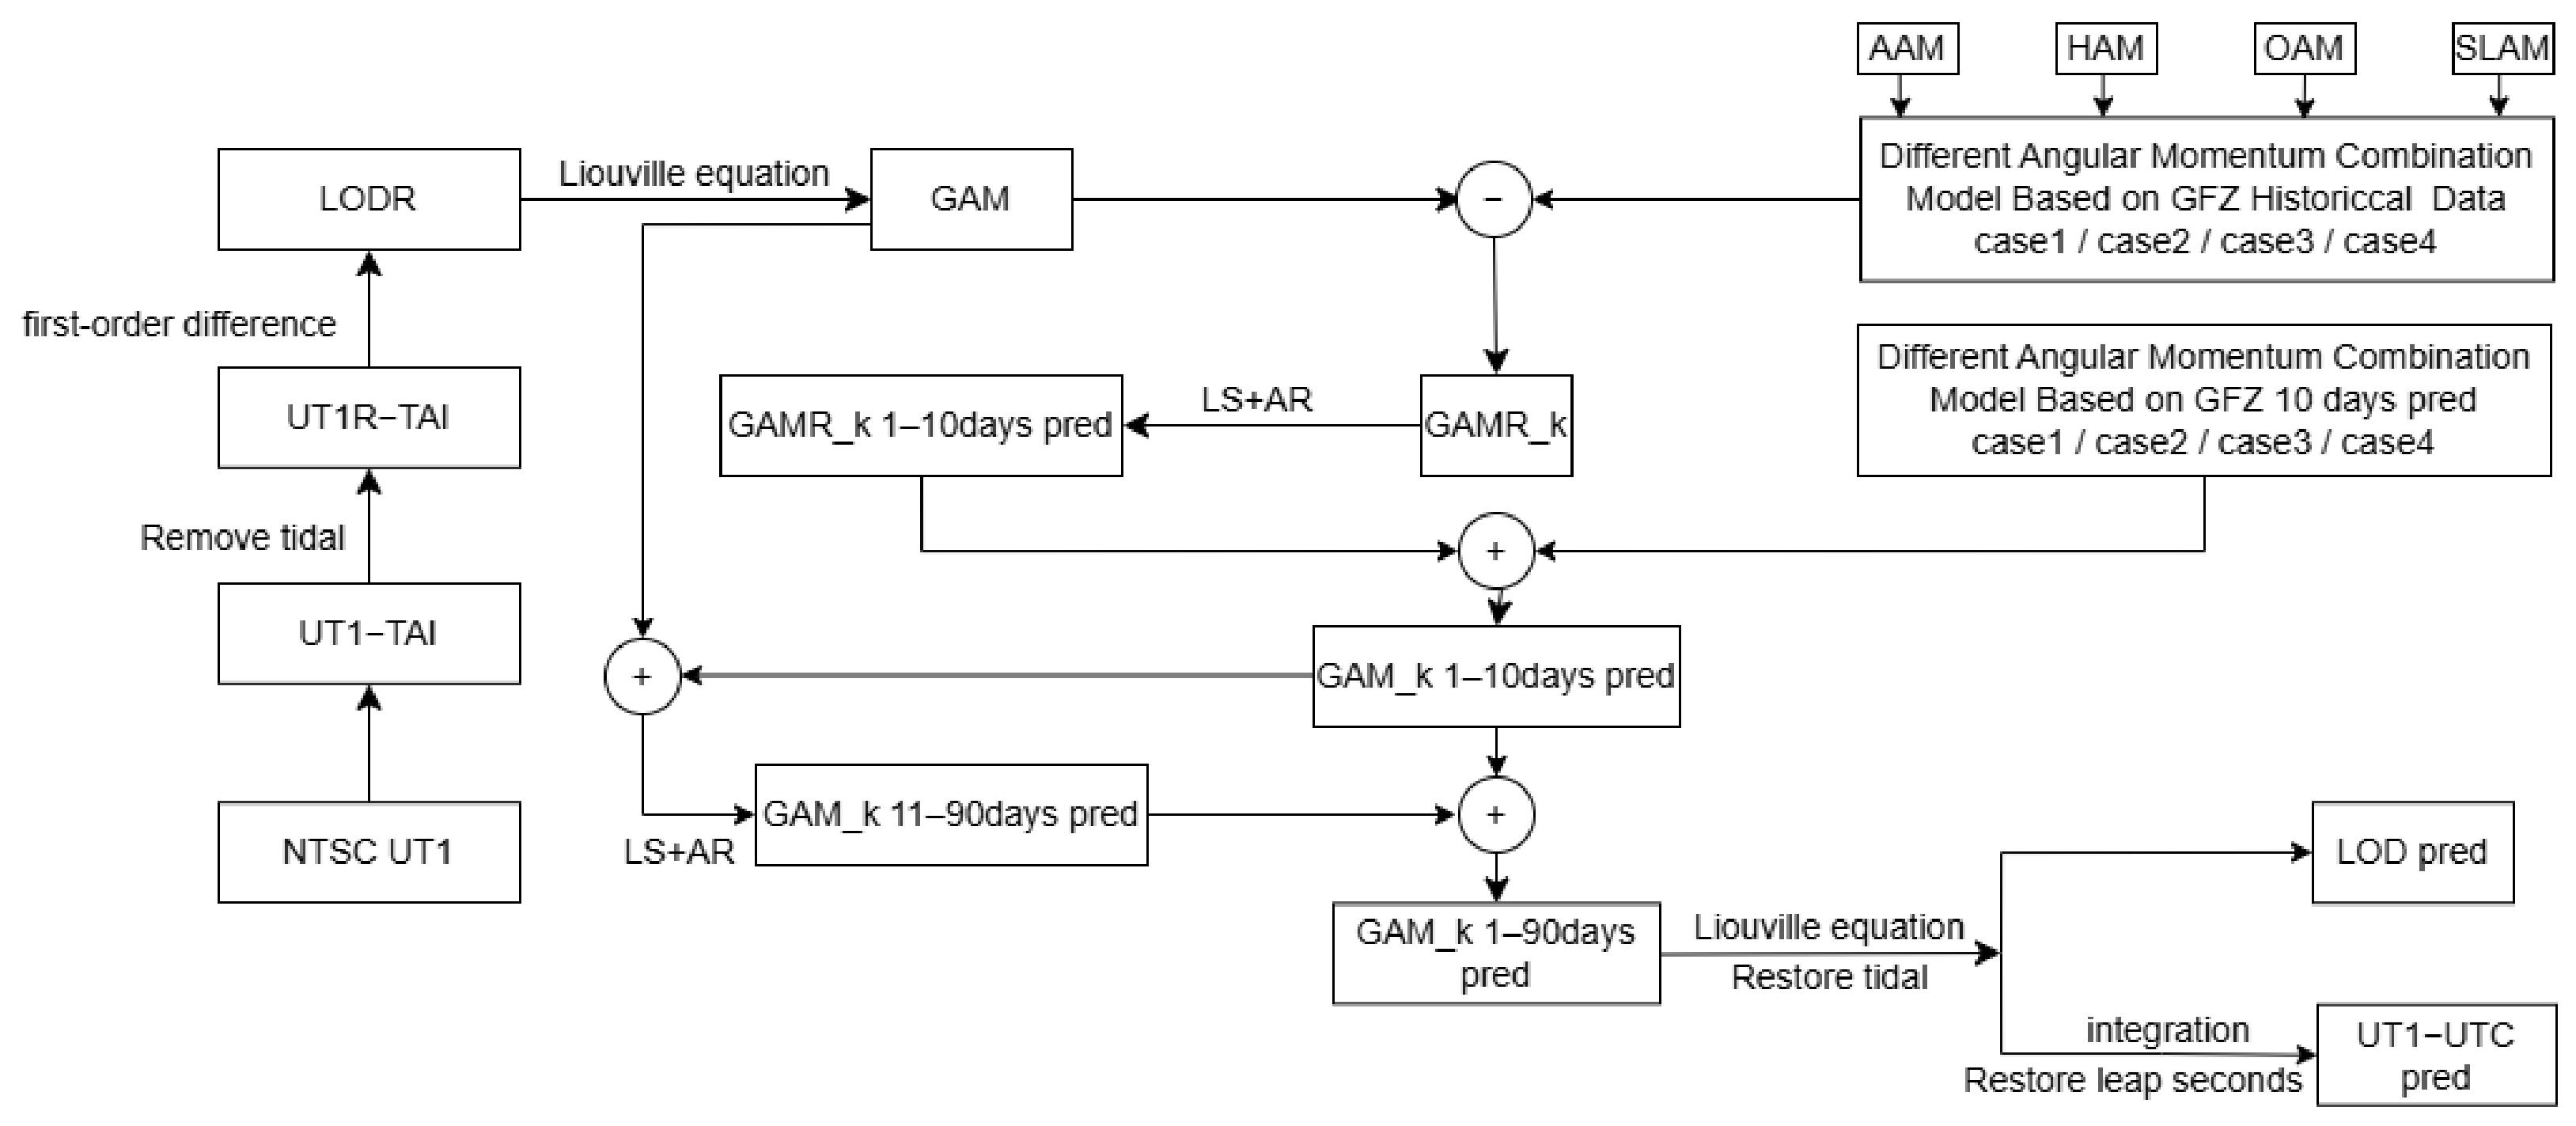
In this study, the 10-day angular momentum forecast data provided by GFZ were used, and the prediction procedure was divided into two stages: days 1–10 and days 11–90. First, the residual between GAM and the selected angular momentum model was computed and extrapolated for 10 days using the LS + AR framework. The extrapolated residual was then added to the 1–10 day angular momentum forecast values to form the 1–10 day GAM forecast series, from which the 1–10 day UT1 predictions were obtained. Second, the 1–10 day GAM forecast series was appended to the historical GAM sequence to construct a continuous GAM series. The LS + AR framework was then applied to this extended sequence to extrapolate the complete 11–90 day GAM series, and the corresponding UT1 predictions were obtained through the Liouville equation and integration. Therefore, the 11–90 day predictions are not obtained from GFZ forecast values directly, but from the LS + AR extrapolation of the historical GAM series after being constrained by the first 10 forecast days. The prediction workflow is shown in Figure 1. For each forecast origin, the LS + AR model was fitted using a four-year historical data window immediately preceding that origin.
2.2.4. Accuracy Metric
To evaluate the prediction accuracy of different combination models consistently across each forecast horizon, we adopted MAE as the primary assessment metric [33]. For each forecast day, the predicted value for each start epoch was compared with the corresponding IERS 20 C04 value, and the average absolute difference over all samples was taken as the MAE:
Here, denotes the predicted value for the j-th prediction day at the i-th initial epoch, denotes the corresponding value from the IERS 20 C04 series, and n is the number of initial samples. A smaller MAE indicates a higher overall prediction accuracy of the corresponding model at that prediction length. In addition to the improvement relative to Case 4, this study also computed the percentage improvement relative to the IERS finals.daily product and the original NTSC UT1 predictions, which does not incorporate angular momentum data.
Figure 1.
UT1 prediction flowchart. Here, denotes Cases 1–4, and denotes the residual between GAM and .
3. Physical Analysis of Different Angular Momentum Combinations
To explain the forecast differences among different angular momentum combination models from the perspective of physical mechanisms, the correlation and periodic characteristics between each combination model and Earth rotation variations were first analyzed before performing the UT1 prediction experiments.
3.1. Correlation Analysis
The Liouville equation describes the relationship between LOD variations and the geodetic angular momentum function GAM. For variations along the Earth’s rotation axis, the mass and motion terms of angular momentum jointly affect the Earth’s rotation rate and therefore cause variations in LOD and UT1. The z-components of AAM, OAM, HAM, and SLAM are therefore directly relevant to UT1 predictions [6]. The commonly used relationship can be written as follows:
Here, denotes the GAM, is the mean angular velocity of the Earth’s rotation, UT1R is the tidal-corrected UT1, and LODR is the tidal-corrected LOD.
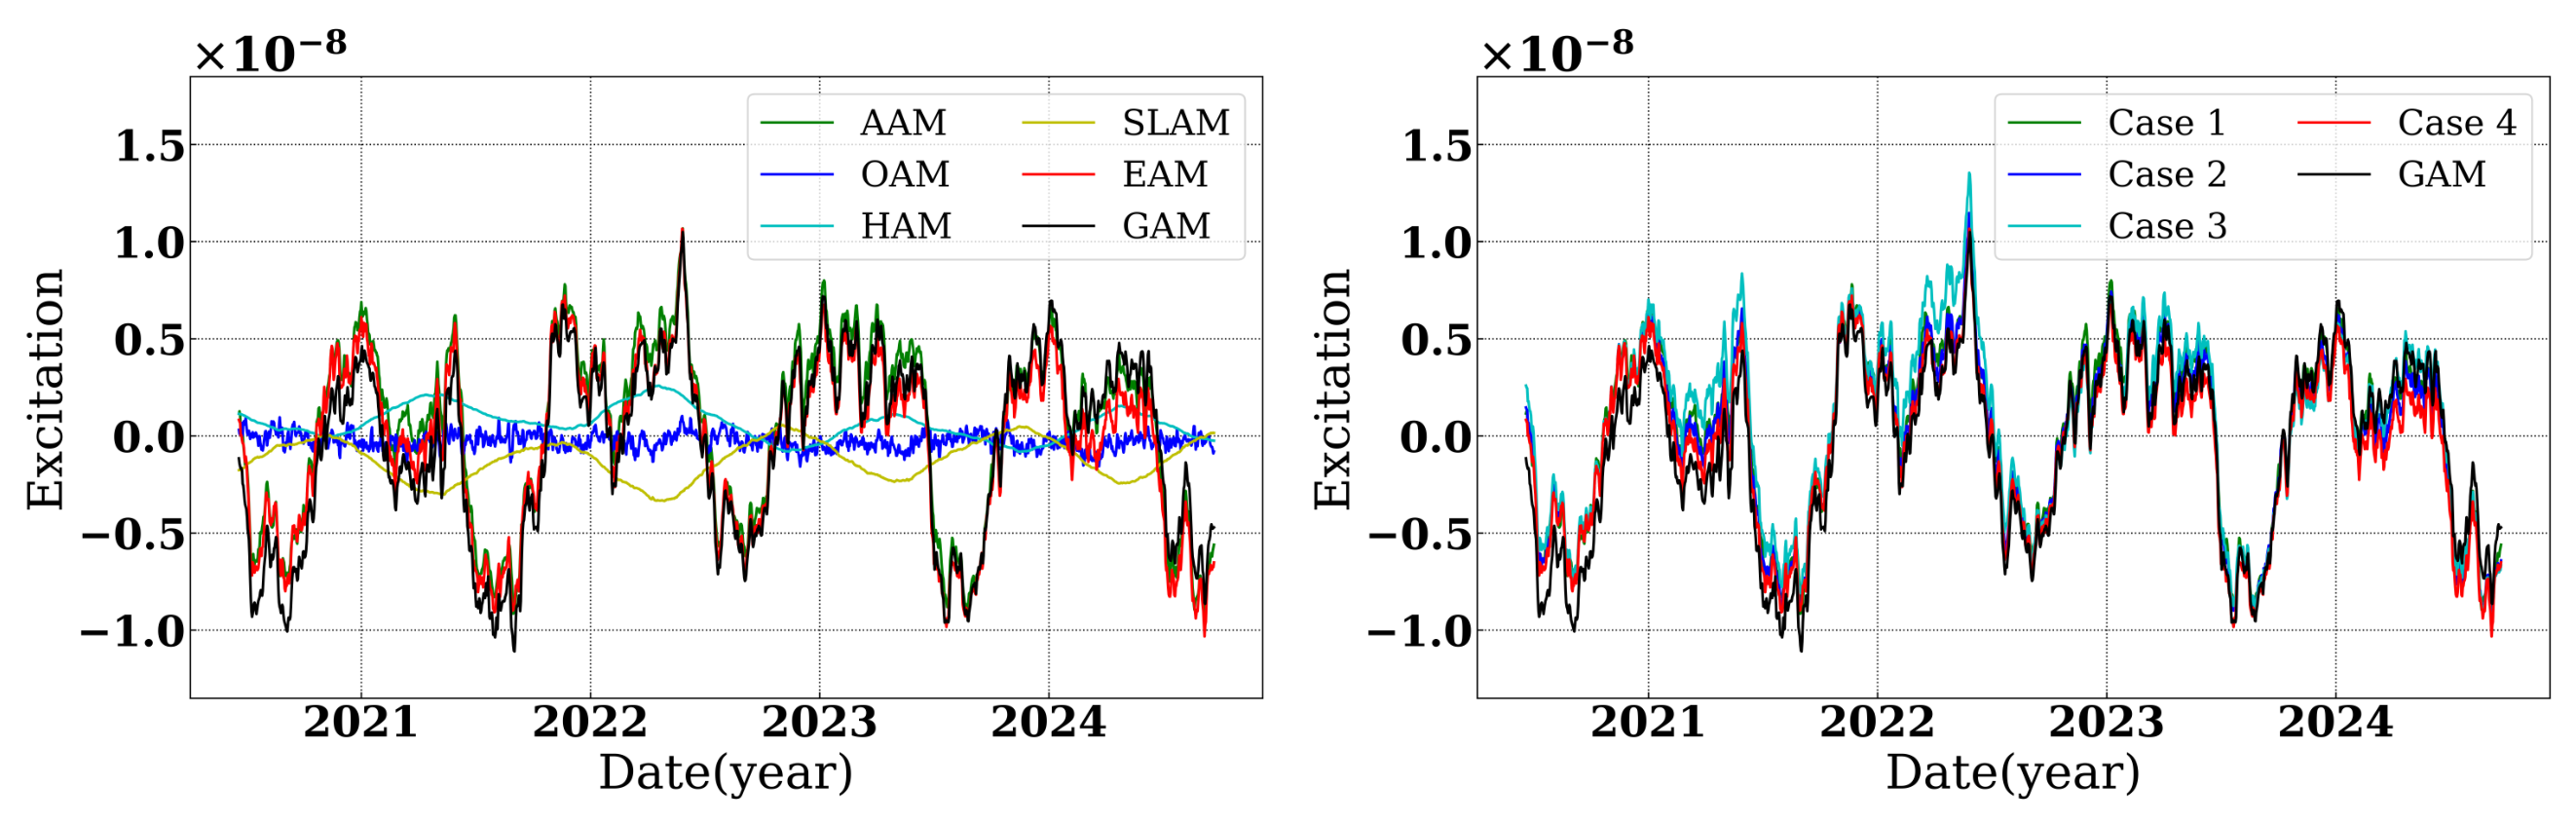
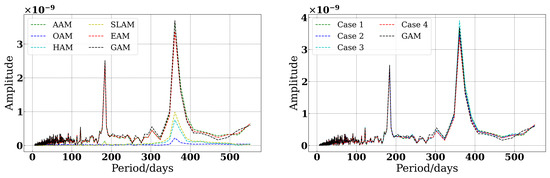
In this section, NTSC UT1 data from June 2021 to September 2025 are used to analyze its trend and periodicity. The four angular-momentum configurations were treated as Cases 1–4 as defined above. As illustrated by the phase variations in Figure 2, the four combination configurations show similar overall trends but differ in their local fluctuation amplitudes and phase synchronization. Among them, Case 1 shows the highest synchronization with GAM.
Figure 2.
Comparative analysis of different angular-momentum datasets. The (left) panel compares GAM with the individual components constituting EAM, while the (right) panel compares GAM with the four EAM combination schemes, Cases 1–4.
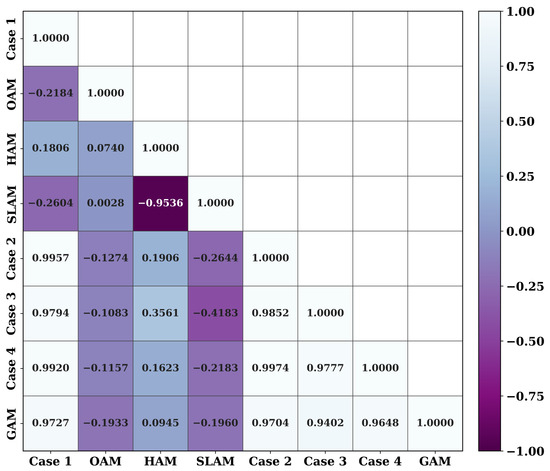
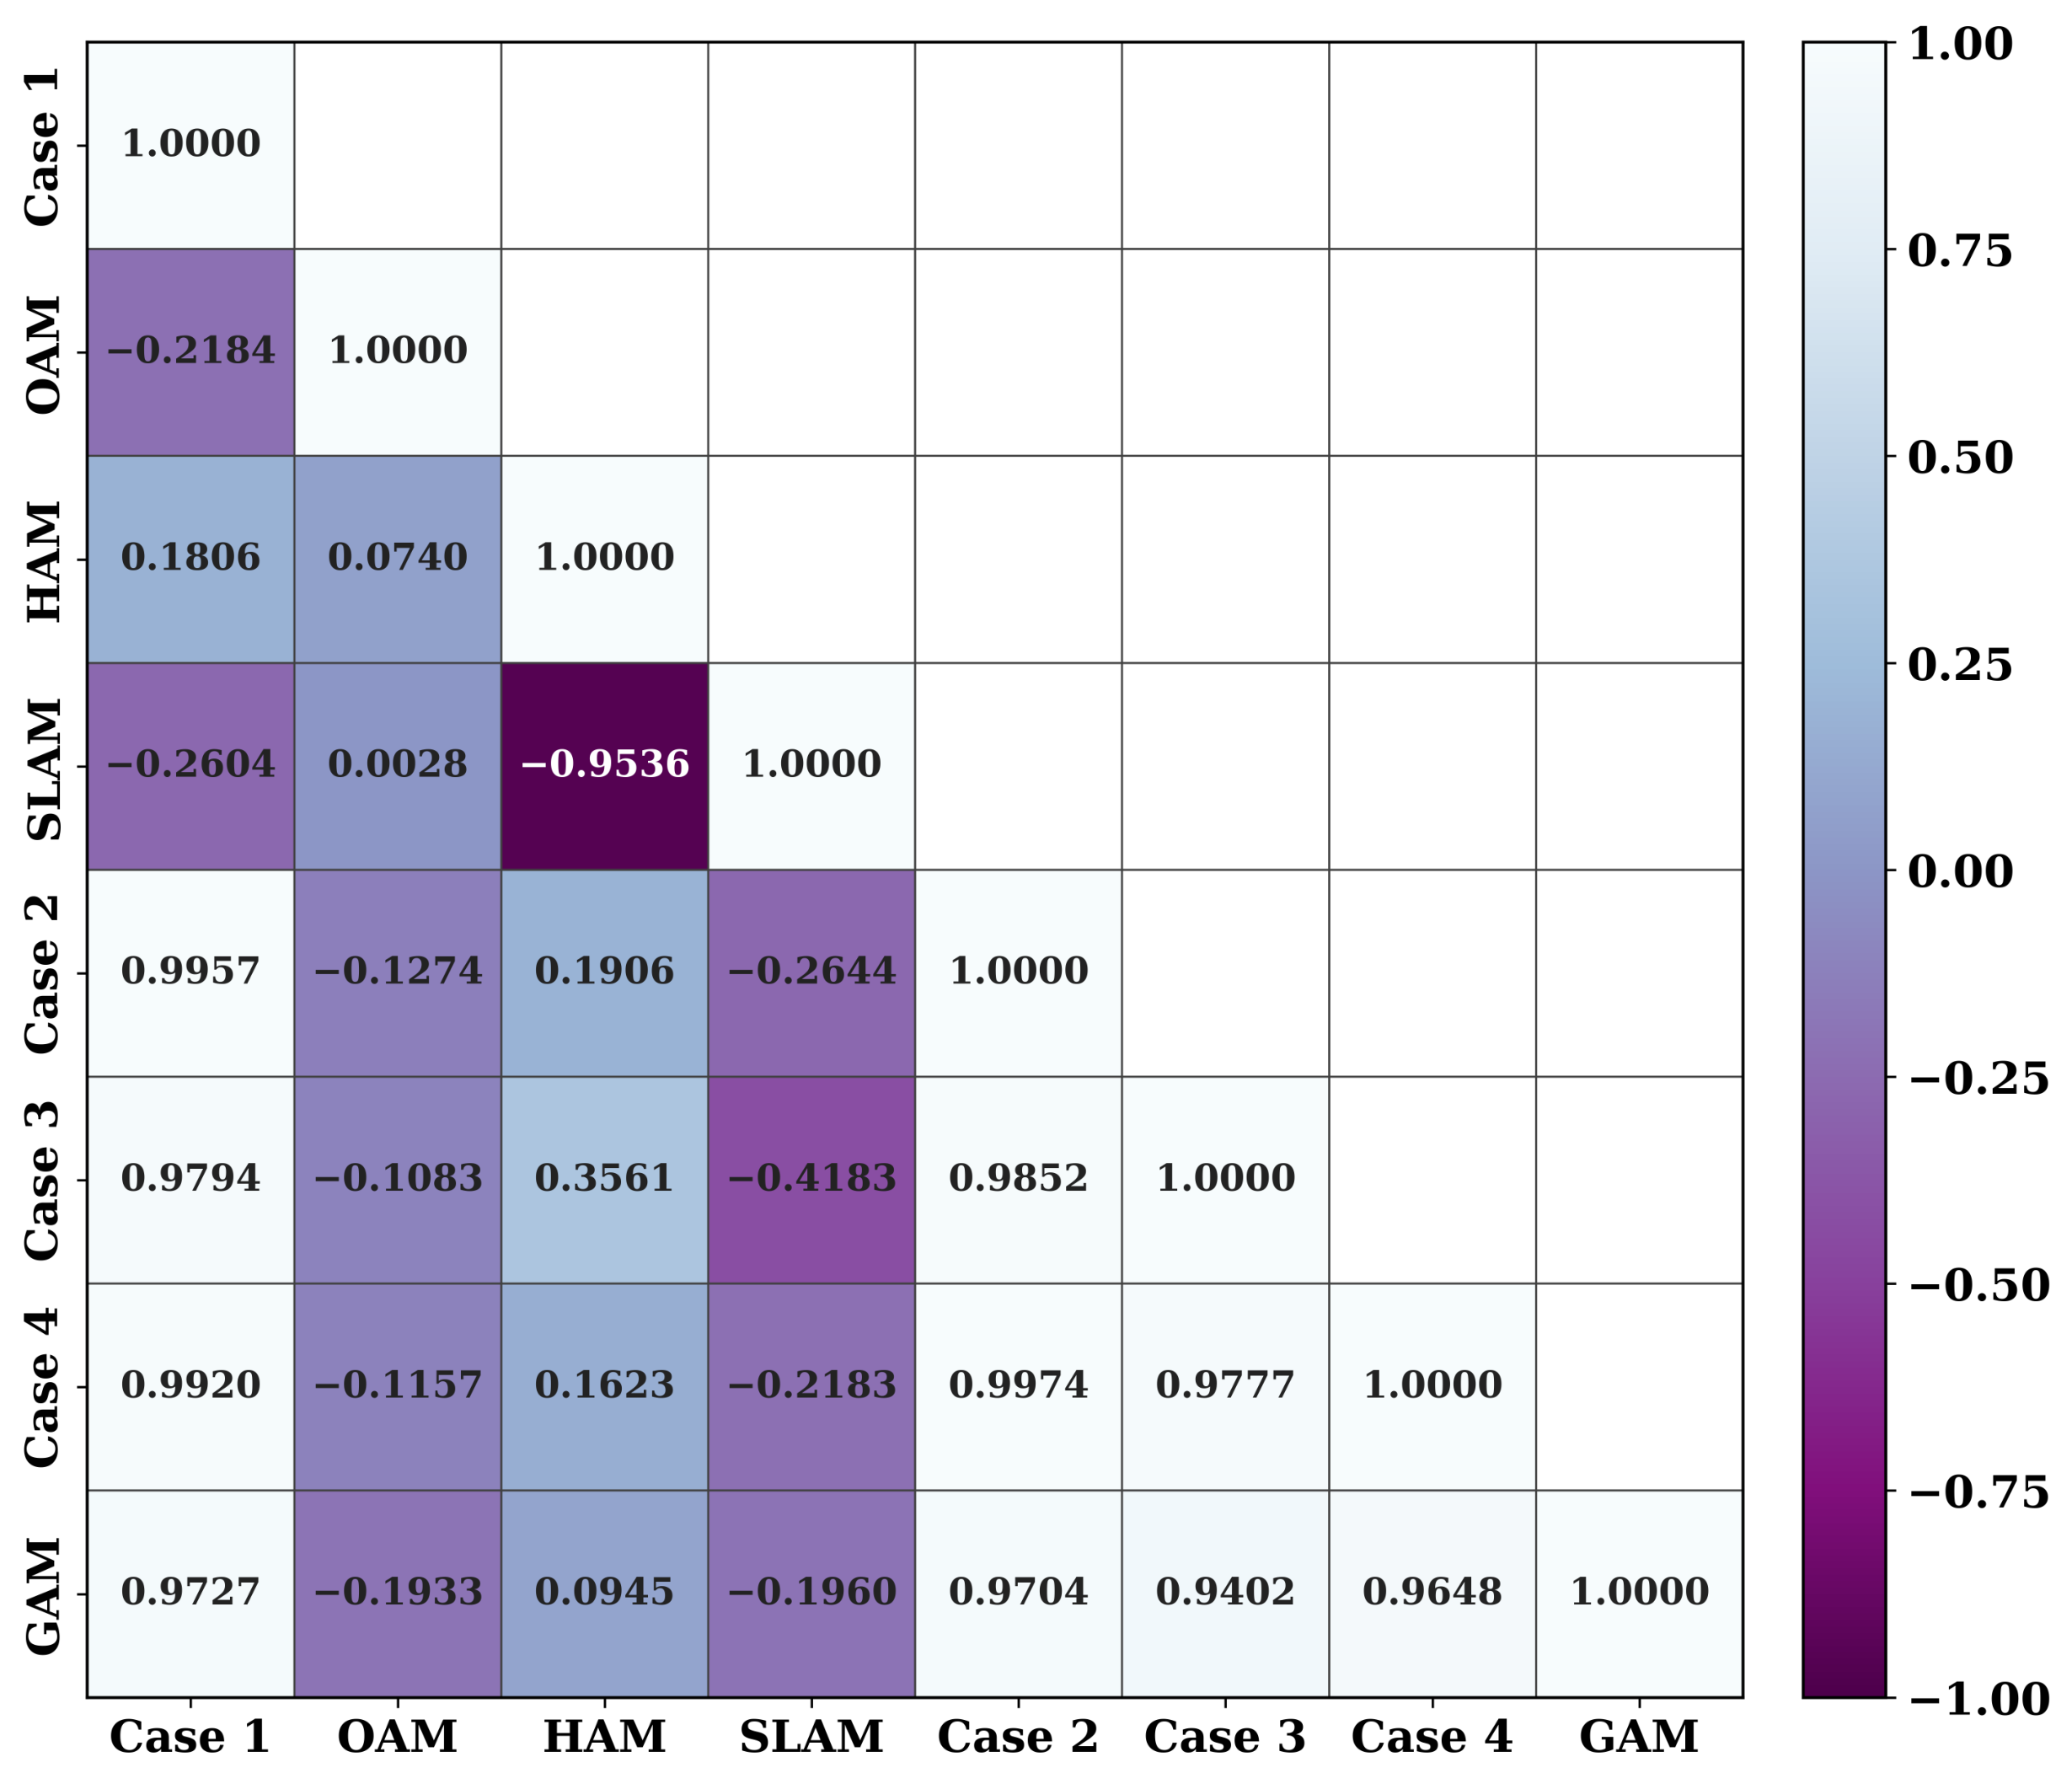
Figure 3 provides a quantitative comparison of the Pearson correlation coefficients between the different angular momentum combinations and the Earth rotation variation series. The results show that the correlation between Case 1 and GAM reaches 0.9727, followed by Case 2. Previous studies have shown that, on interannual and shorter time scales, AAM is one of the main excitation sources of LOD variations, and that atmospheric excitation explains a dominant fraction of the observed variability, whereas the additional contributions of oceanic and hydrological angular momentum are relatively limited [5]. Accordingly, the correlation results obtained here further reinforce that AAM is the primary driver of LOD and UT1 variations.
Figure 3.
Pearson correlation analysis between different angular momentum combinations and the GAM series.
3.2. Spectral Analysis
The purpose of the spectral analysis is to further examine the consistency between the dominant periodic components of different angular momentum combinations and those of Earth rotation. If a given combination not only exhibits a high correlation with GAM, but also matches the dominant periods of the GAM or LOD series, then it is more likely to provide a stable contribution to UT1 predictions.
Figure 4 shows the spectral characteristics of different angular momentum combinations and the GAM series based on fast Fourier transform analysis. Case 1 and Case 2 are closer to GAM in the annual, semiannual, and seasonal bands, whereas Case 3 and Case 4, although containing more physical components, do not exhibit a more obvious spectral advantage. In particular, Case 1 and Case 2 show the strongest consistency with GAM near the semiannual period of 182.60 d and the annual period of 365.25 d. Weaker periodic components are also present near 91.30 d and 121.71 d and are mainly associated with seasonal atmosphere-ocean variability. These results indicate that Case 1 and Case 2 are superior not only in terms of statistical correlation, but also in terms of periodic spectral structure. This is consistent with the subsequent forecast results showing that Case 2 performs best over short horizons, whereas Case 1 performs best over medium and long horizons.
Figure 4.
Spectral comparison between different angular momentum combinations and the GAM series.
4. Prediction Results
4.1. UT1 Prediction Accuracy
Four angular momentum combination schemes were used to generate 90-day UT1 forecasts based on the NTSC dataset for the period from June 2024 to September 2025.
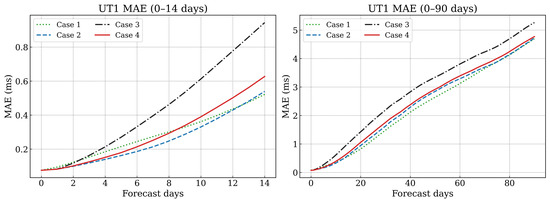
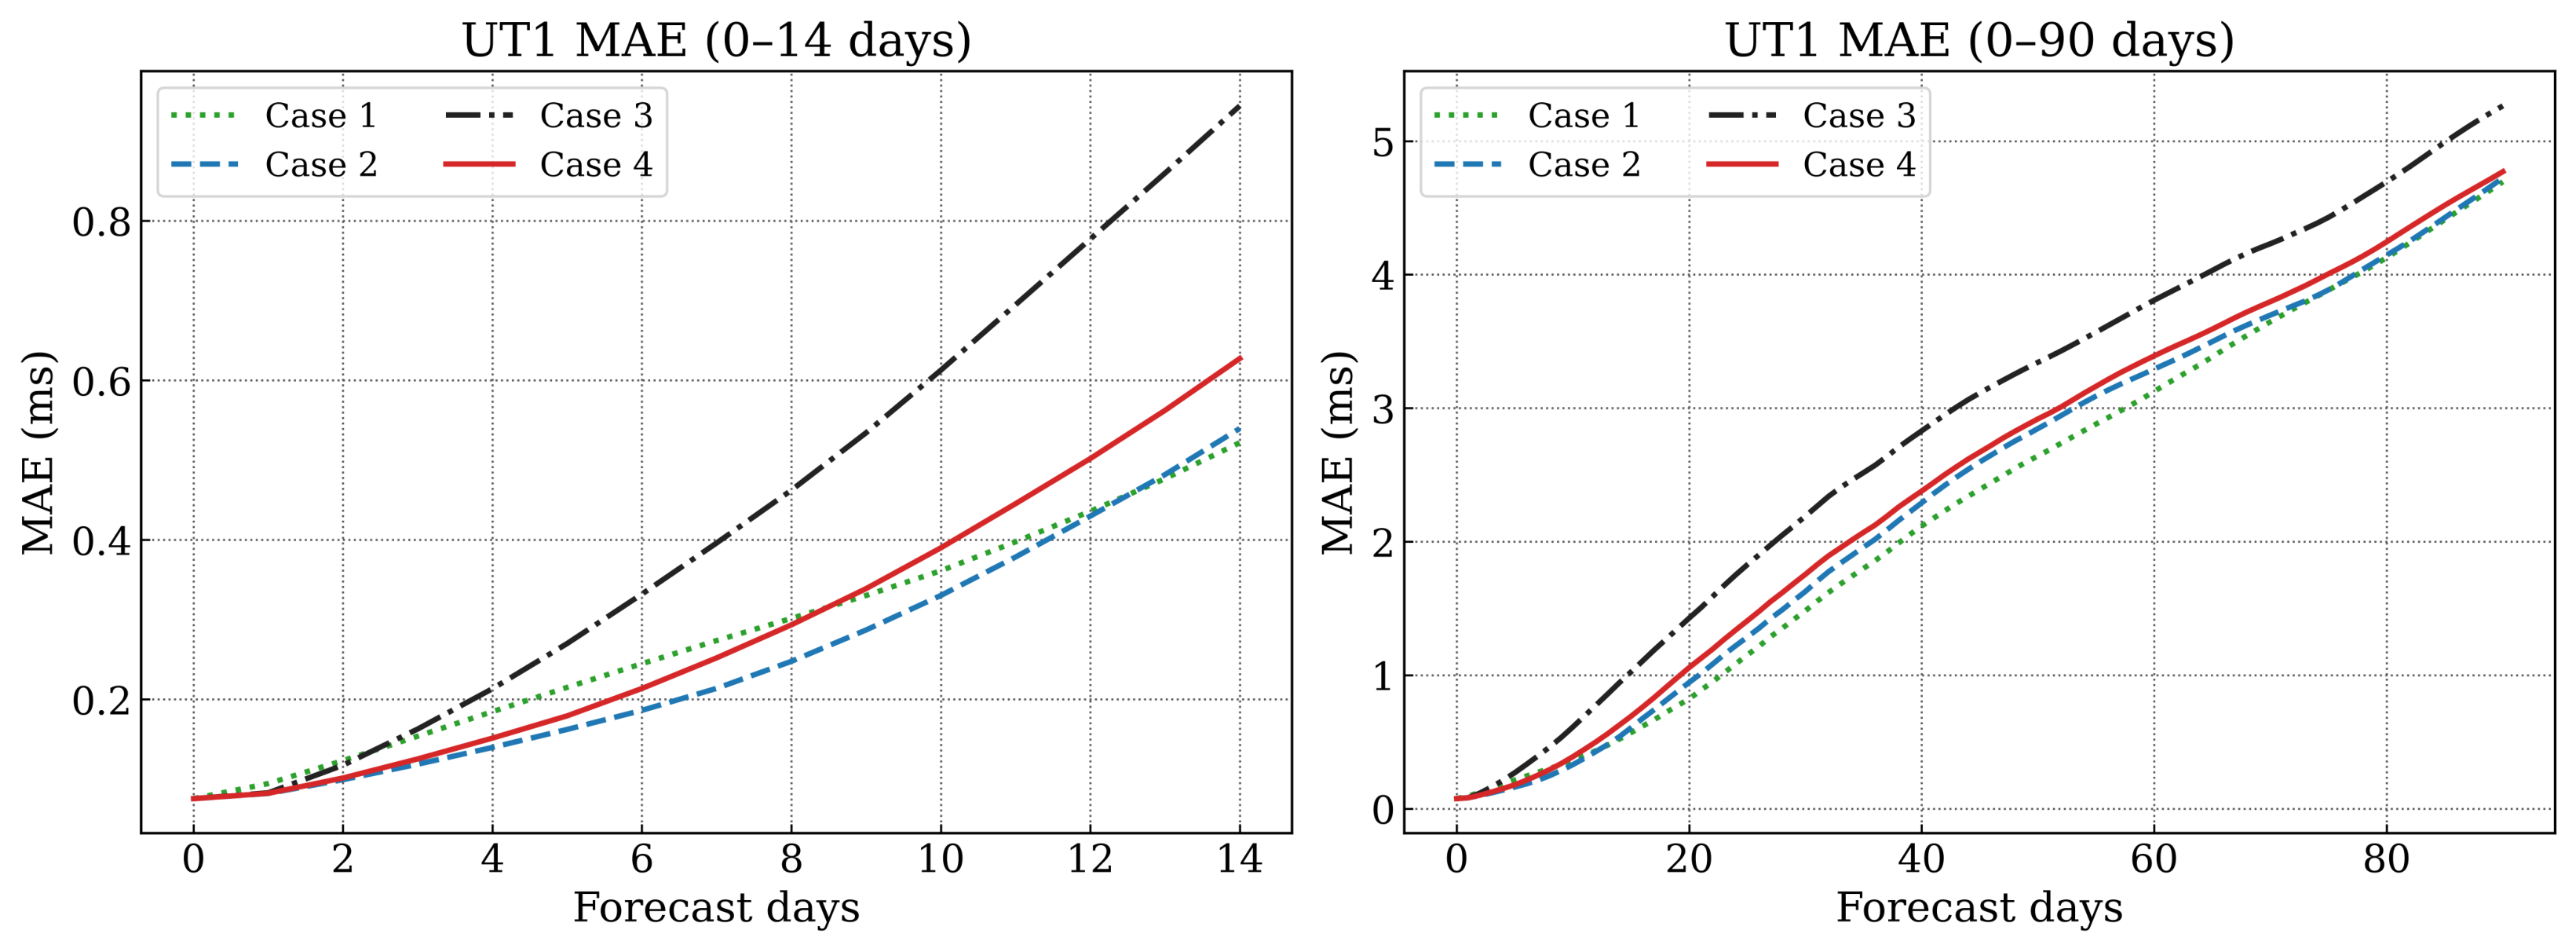
As shown in Figure 5, the errors of all four angular momentum combination schemes generally increase with forecast horizon because of the accumulation of time-series prediction errors. However, a clear segmented pattern is observed. Case 2 provides the best performance over short horizons of 1–12 days, whereas from day 13 onward Case 1 becomes more accurate and exhibits a slower error growth rate.
Figure 5.
Comparison of UT1 Prediction Accuracy for Different Angular Momentum Combinations. All MAE values are calculated against IERS EOP 20 C04.
Table 1 compares the UT1 MAE values of the four angular momentum combination schemes. Here, Improve1, Improve2, and Improve3 denote the improvements of Case 1, Case 2, and Case 3 relative to Case 4, respectively.
Table 1.
MAE of UT1 predictions for different angular momentum combinations.
For short-term predictions over 1–12 days, Case 2 achieves a maximum improvement of 15.6% and a mean improvement of 10.7% relative to Case 4. For predictions over 13–90 days, Case 1 performs best, with a maximum improvement of 22.2% and a mean improvement of 9.8% relative to Case 4.
4.2. LOD Prediction Accuracy
Because LOD directly reflects the rate of change of UT1 and is more sensitive to short-term fluctuations in Earth rotation, its forecast error propagates into UT1 through integration and thereby influences the long-term stability of UT1 predictions. Thus, it is useful to compare the behavior of different angular momentum combinations in LOD prediction as an independent check on the UT1 prediction results.
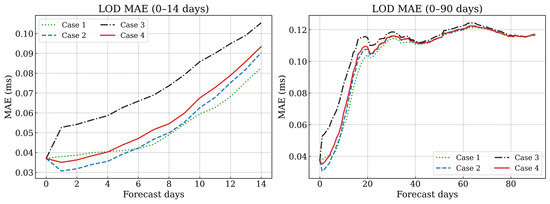
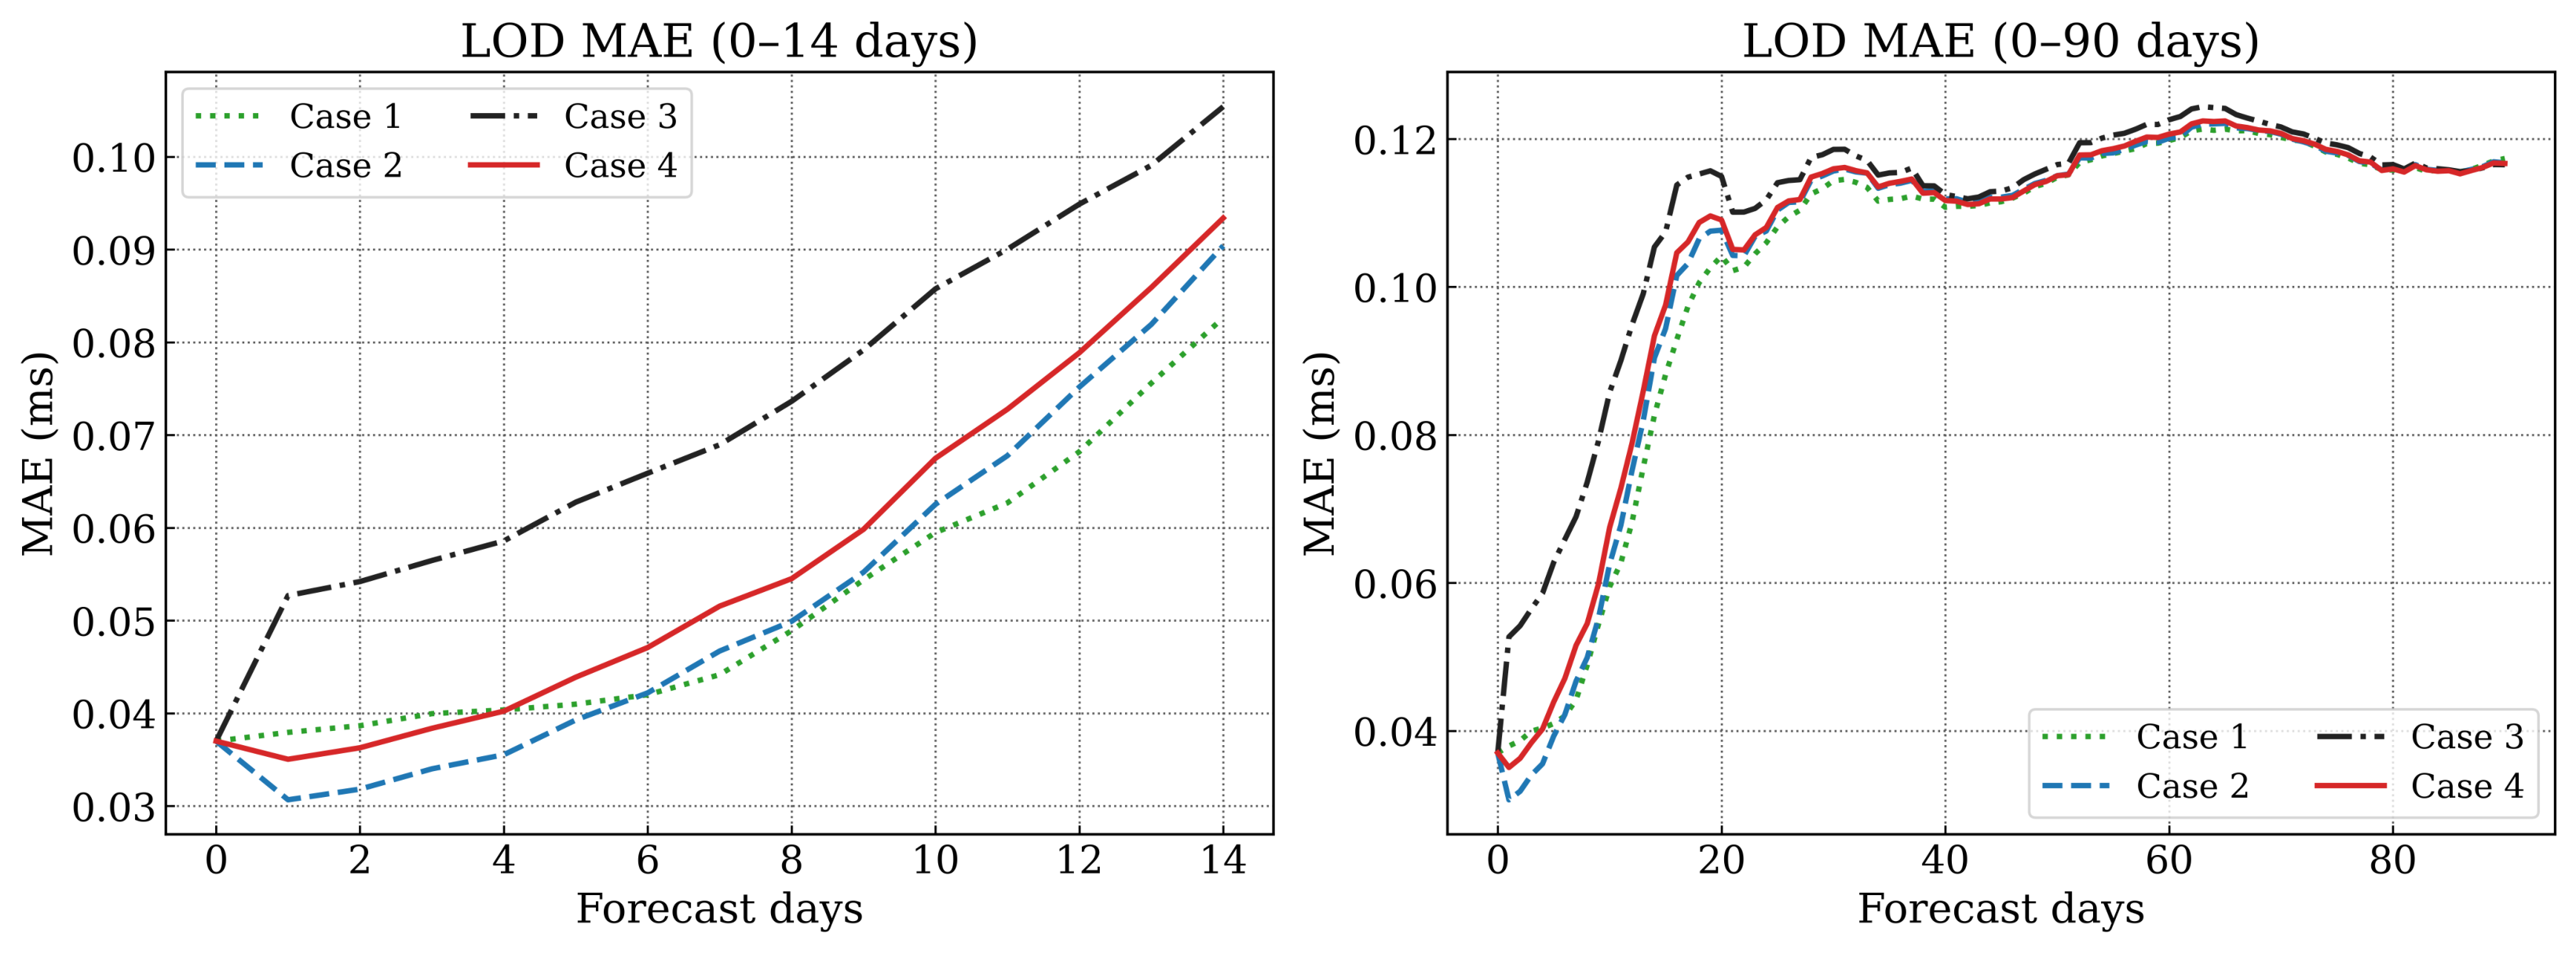
Figure 6 shows the MAE variation of different angular momentum combinations in LOD predictions. Overall, the same segmented pattern seen in UT1 predictions is also visible in LOD: Case 2 has an advantage over short forecast horizons, whereas Case 1 is more stable over medium and long horizons.
Figure 6.
Comparison of LOD prediction accuracy for different angular momentum combinations. All MAE values are calculated against IERS EOP 20 C04.
Table 2 summarizes the LOD MAE values of the four angular momentum combination schemes, with Improve1, Improve2, and Improve3 representing the improvements of Case 1, Case 2, and Case 3 relative to Case 4, respectively.
Table 2.
MAE of LOD predictions for different angular momentum combinations.
For short-term predictions over 1–5 days, Case 2 achieves a maximum improvement of 12.5% and a mean improvement of 11.7% relative to Case 4. From day 6 onward, Case 1 becomes more accurate than Case 2. For LOD predictions over 6–90 days, the Case 1 model achieves a maximum improvement of 14.3% and a mean improvement of 2.4% relative to Case 4. The differences among LOD schemes are noticeably smaller than those for UT1, mainly because UT1 is obtained by integrating LOD and the associated errors accumulate with forecast length. This also explains why the advantage of Case 1 becomes evident after day 6 for LOD predictions, whereas for UT1 the same advantage does not become clear until after day 12, confirming that Case 1 and Case 2 provide greater improvements in prediction accuracy than the use of the complete Case 4 dataset.
5. Discussion
5.1. Reasons for the High Accuracy of UT1 Prediction Using Cases 1 and 2
The results in the previous section show that, for short-term forecasts (1–12 days), Case 2 performs best, whereas for medium- to long-range forecasts (13–90 days), Case 1 performs best. By contrast, the prediction accuracy of Case 3 decreases markedly. After SLAM is further included, Case 4 performs better than Case 3, but it still does not reach the accuracy of Case 2 or Case 1. This suggests that the additional information contained in HAM and SLAM is accompanied by non-negligible model errors and uncertainties.
For HAM, differences in ERA precipitation forcing can lead to delayed responses and long-term inconsistencies in the HAM series, while its motion term is about three orders of magnitude smaller than its mass term. Comparisons with the Gravity Recovery and Climate Experiment (GRACE) further show that some seasonal amplitudes are overestimated and that certain decadal trends are not adequately reproduced [23]. Earlier studies also noted that global hydrological models still provide only a coarse representation of soil moisture, snow, deep groundwater, and ice-sheet-related processes, while evaporation and anthropogenic water use may introduce additional uncertainties. Accordingly, HAM has been regarded as a major, and possibly the largest, error source among AAM, OAM, and HAM [34,35,36].
For SLAM, the global water budget in the underlying numerical data sets is not strictly closed. Therefore, mass conservation among the atmosphere, land, and oceans is assumed, and the missing mass is assigned to the oceans [23]. From a physical point of view, this treatment may partly compensate for the ocean-mass response that is not explicitly represented in Case 3, thereby making the coupling between terrestrial water storage and ocean mass variations more complete. Previous studies have shown that the seasonal LOD excitations associated with land water and ocean water are nearly out of phase, implying a compensation effect between the two [34]. Furthermore, Figure 2 (left) also confirms that HAM and SLAM are anti-correlated. Therefore, the inclusion of SLAM does not necessarily provide fully independent new predictive information; rather, it more likely improves the performance of Case 4 relative to Case 3 by enhancing mass-balance consistency and partly offsetting HAM-related errors.
Therefore, within the GFZ EAM data set and the LS + AR prediction framework adopted in this study, adding HAM introduces substantial hydrological-model uncertainty and degrades the accuracy of Case 3. Although the further inclusion of SLAM can partly improve the mass-balance consistency of the combined excitation series, the associated model errors and trend biases remain, so Case 4 still underperforms relative to Case 2 or Case 1. Accordingly, the following analysis focuses mainly on Cases 1 and 2.
5.2. UT1 Comparison with IERS finals.daily and the Original NTSC Predictions
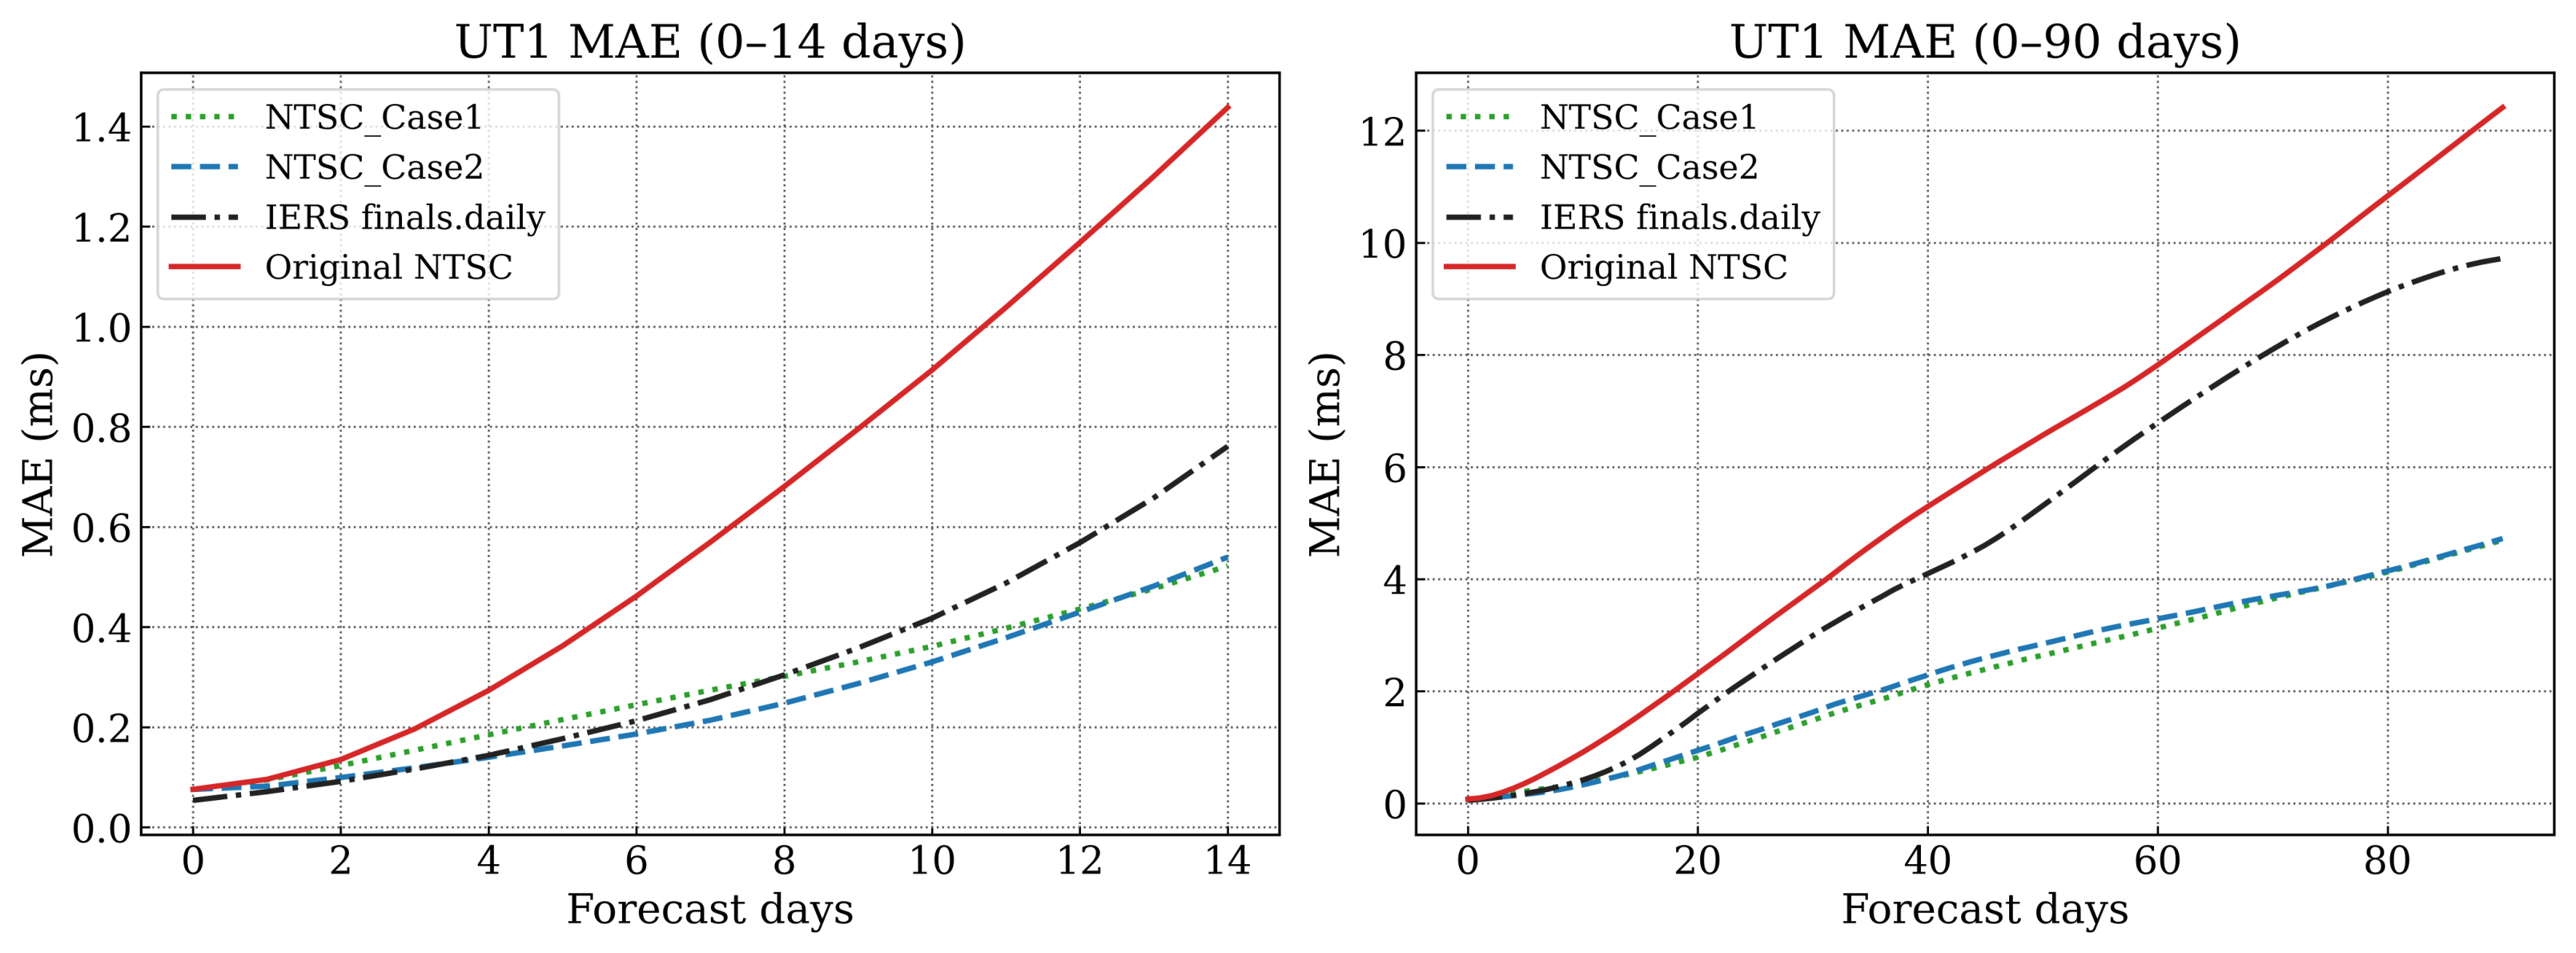
To show more directly how the different angular momentum combinations improve UT1 forecasting, Cases 1 and 2 were further compared with IERS finals.daily and the original NTSC UT1 prediction results. This comparison is intended to quantify the practical gains relative both to the current international prediction level and to the NTSC operational product.
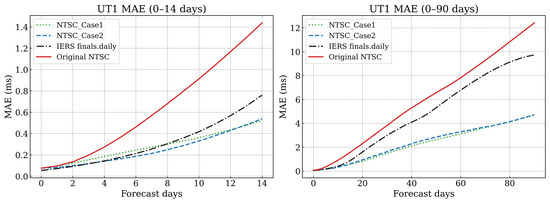
As can be clearly seen from Figure 7, both Case 1 and Case 2 improve the accuracy of UT1 predictions relative to the original NTSC prediction product. Case 2 performs better over days 1–12, whereas Case 1 becomes more accurate from day 13 onward. Compared with IERS finals.daily, the prediction accuracy of both cases generally improves with increasing forecast days.
Figure 7.
Comparison of UT1 prediction accuracy among different angular momentum combinations, IERS finals.daily, and NTSC predictions. All MAE values are calculated against IERS EOP 20 C04; IERS finals.daily and the original NTSC product are included only as operational comparison products.
Table 3 reports the UT1 MAE values obtained after introducing Case 1 and Case 2 into NTSC’s operational LOD/UT1 products. Here, NTSC_case1 and NTSC_case2 denote the two combination schemes; Improve1 and Improve2 represent their improvements relative to IERS finals.daily; and Improve3 and Improve4 represent their improvements relative to the original NTSC prediction product. For short-term predictions over 1–12 days, Case 2 performs best. Relative to IERS finals.daily, it achieves a maximum improvement of 24.4% and a mean improvement of 10.0%. Relative to the original NTSC predictions, it achieves a maximum improvement of 63.9% and a mean improvement of 52.0%. For medium- and long-term predictions over 13–90 days, Case 1 performs best. Relative to IERS finals.daily, it achieves a mean improvement of 50.7%, with representative improvements of 48.8% at day 20 and 51.7% at day 90. Relative to the original NTSC predictions, it achieves a mean improvement of 61.3%. These results indicate that, with an appropriate combination of angular momentum data, the UT1 predictions based on NTSC’s operational LOD/UT1 products show substantial improvement over the original NTSC predictions. Moreover, they can even outperform the IERS finals.daily predictions at many forecast horizons, particularly in the medium to long term. Over days 70–90, Case 1 remained slightly more accurate than Case 2. The mean UT1 MAE values were 4.14838 ms for Case 1 and 4.16697 ms for Case 2, corresponding to mean improvements of 2.7% and 2.3%, respectively, relative to Case 4.
Table 3.
UT1 prediction accuracy improvement of different angular momentum combinations relative to IERS finals.daily and NTSC predictions.
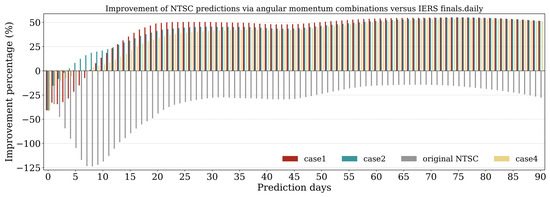
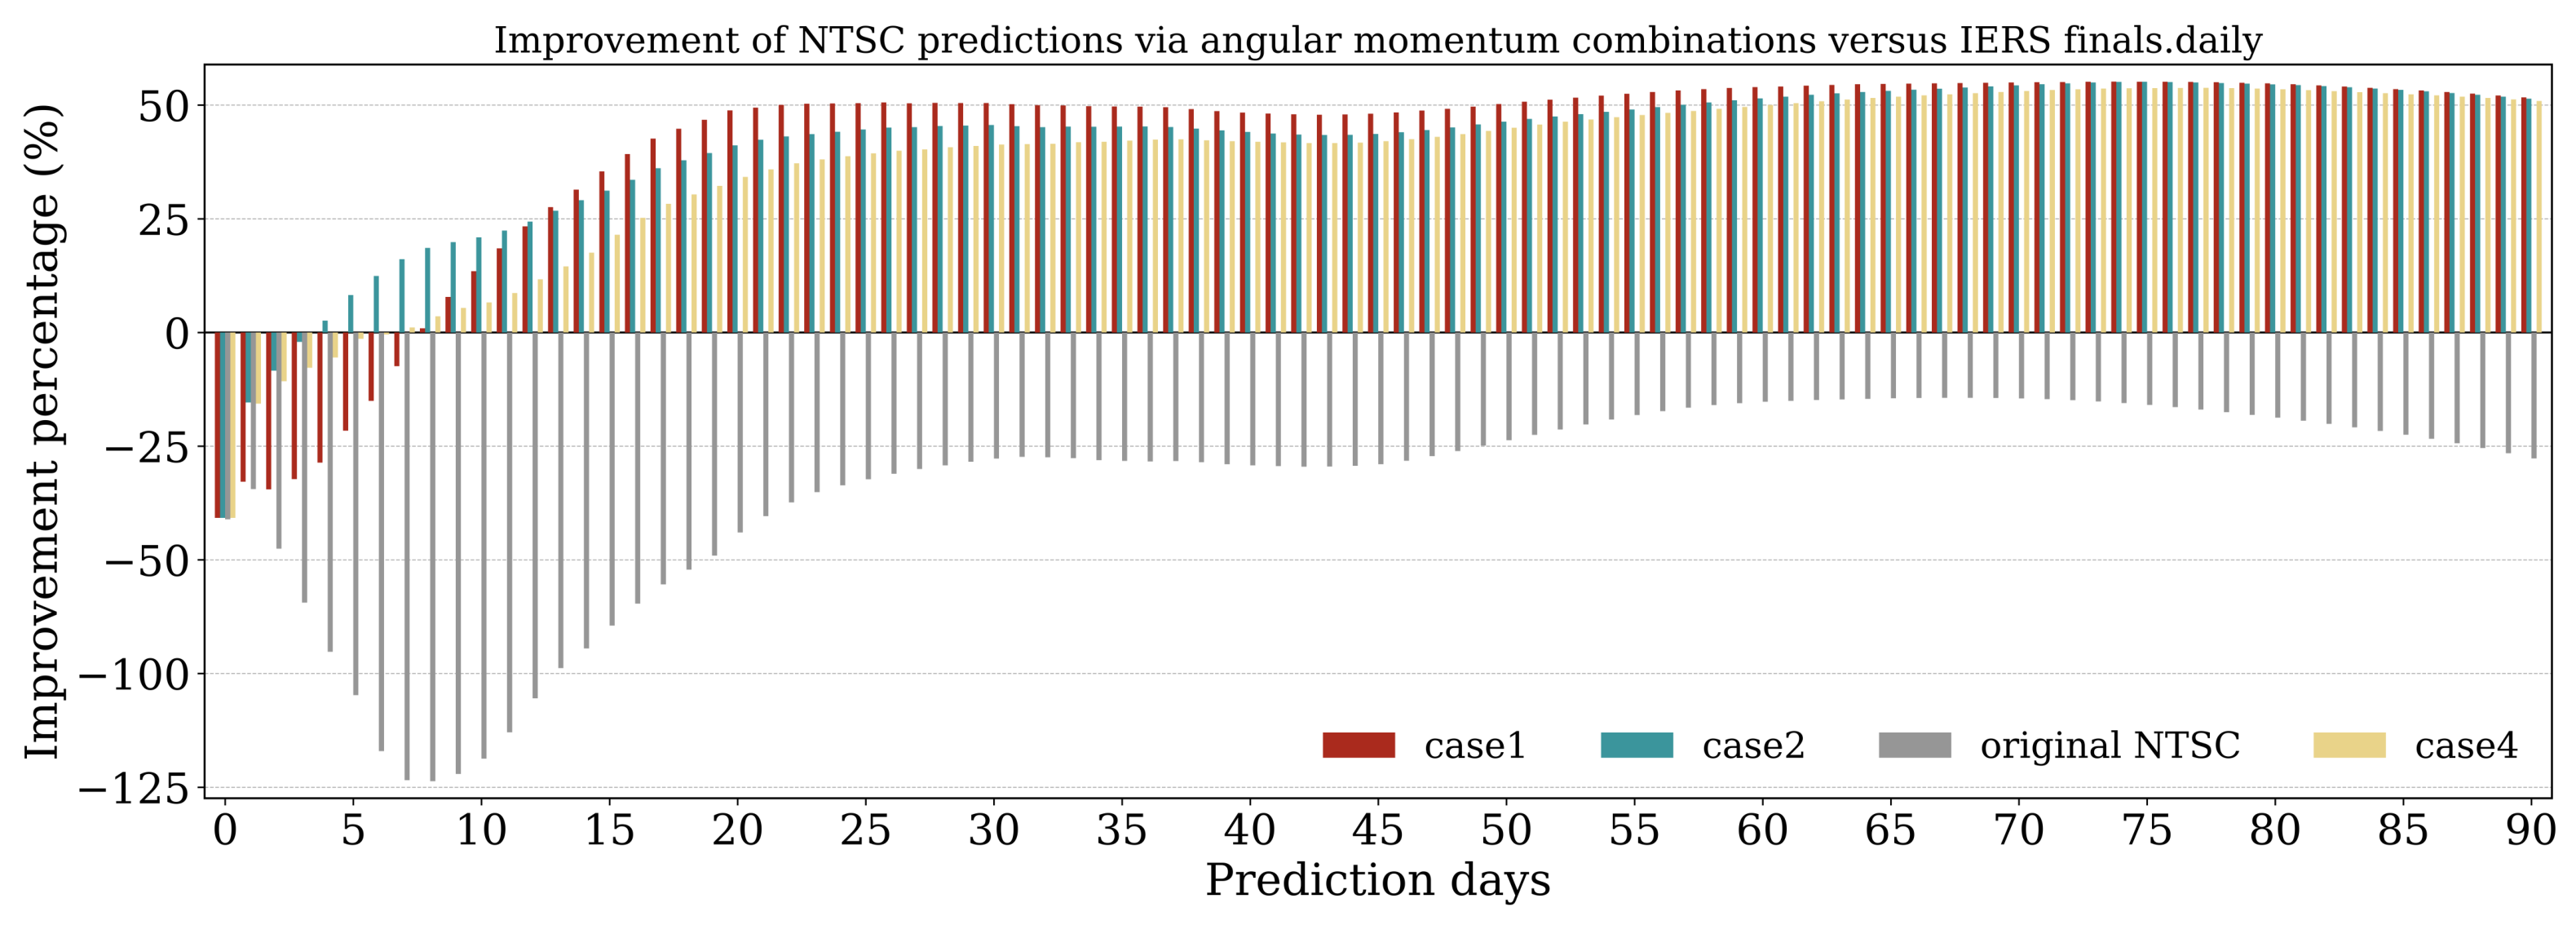
Figure 8 shows the improvement in prediction accuracy relative to IERS finals.daily for NTSC UT1 forecasts based on different angular momentum combinations. In each group of bars, Case 1, Case 2, and NTSC UT1 represent the respective changes in prediction accuracy relative to IERS finals.daily. The original NTSC predictions perform worse than IERS finals.daily over the entire forecast range, whereas the application of angular momentum information significantly improves UT1 prediction accuracy. Over the short-term range of 1–12 days, Case 2 performs best, with a mean improvement of 10.0% and a maximum improvement of 24.4% relative to IERS finals.daily. Over the medium- and long-term range of 13–90 days, Case 1 performs best, with a mean improvement of 50.7% and a maximum improvement of 55.2%.
Figure 8.
UT1 prediction accuracy improvement of different angular-momentum combinations relative to IERS finals.daily.
5.3. LOD Comparison with the Original NTSC Predictions
Because the forecast portion of the IERS finals.daily product does not include LOD values, a day-by-day comparison for LOD could not be made against IERS finals.daily. Instead, the original NTSC LOD predictions were used as the baseline to assess the improvements obtained by different angular momentum combinations. The same structural pattern remains evident, i.e., Case 2 is more effective at reducing short-term fluctuation errors, whereas Case 1 is more effective at suppressing error growth over medium and long forecast horizons.
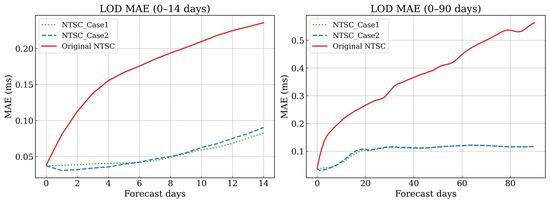
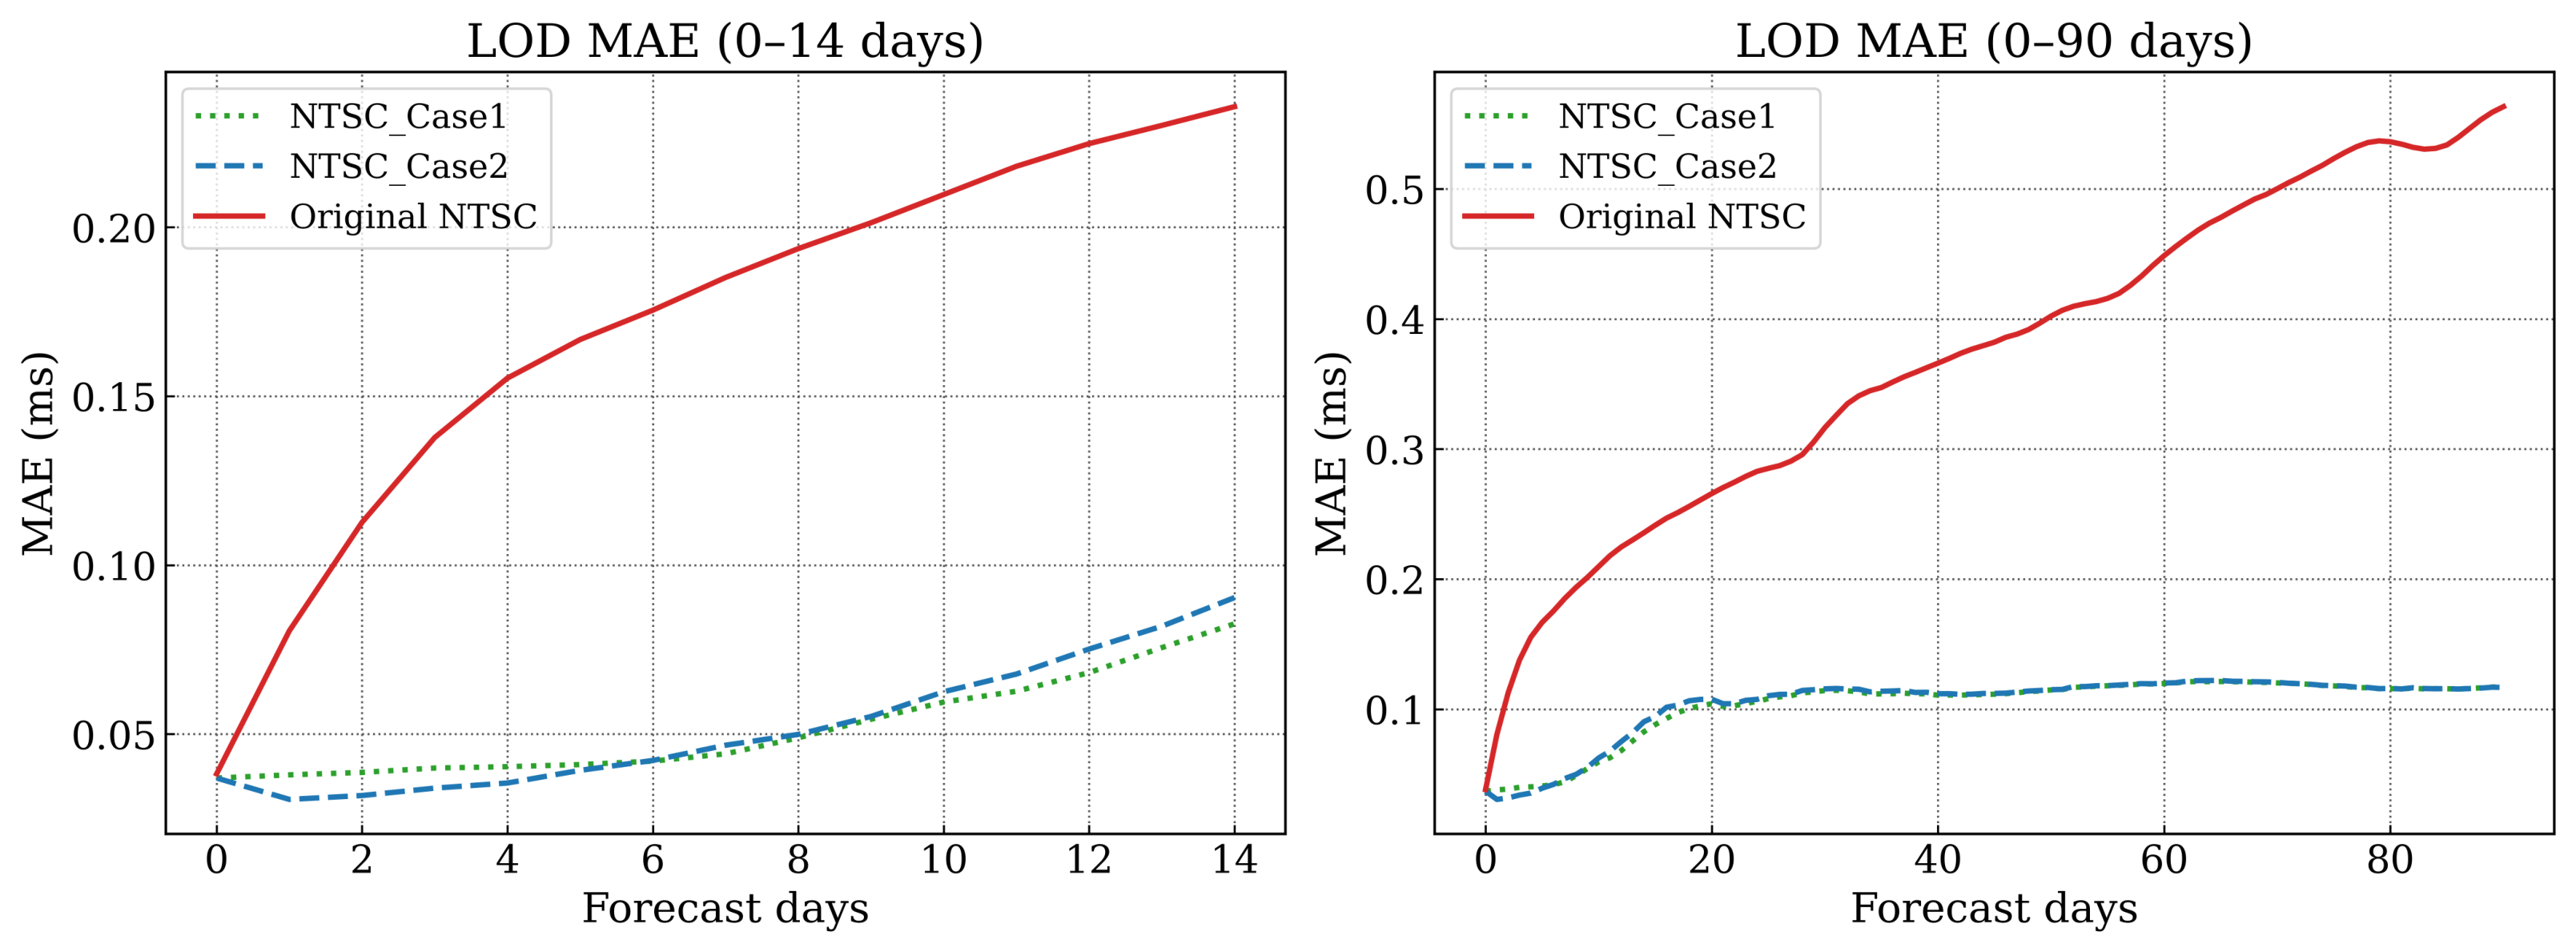
Figure 9 compares the LOD MAE values of NTSC_case1, NTSC_case2, and the original NTSC LOD predictions. Both angular-momentum-enhanced schemes outperform the original NTSC results over the full range of forecast horizons. Case 2 performs better in the short term, whereas Case 1 is more stable for longer prediction horizons, which is consistent with the behavior observed in UT1 predictions.
Figure 9.
Comparison of LOD prediction accuracy for Case 1, Case 2, and the original NTSC prediction product. All LOD MAE values are calculated against IERS EOP 20 C04, whereas the improvements are calculated relative to the original NTSC LOD prediction product.
Table 4 presents the LOD prediction improvements of NTSC_case1 and NTSC_case2 relative to the original NTSC predictions, represented by Improve1 and Improve2, respectively. Over 1–5 days, Case 2 performs best, with a maximum improvement of 77.1% and a mean improvement of 72.5%. Over 6–90 days, Case 1 provides the best overall mean performance, with a mean improvement of 71.2%; its improvement reaches 79.2% at day 90, while Case 2 remains very close at some horizons. This pattern is consistent with the segmented pattern found for UT1 predictions.
Table 4.
LOD prediction accuracy improvement of different angular momentum combinations relative to NTSC predictions.
5.4. Validation Using IERS Data
To further assess whether the findings of this study are specific to the NTSC operational input series, we conducted additional experiments using IERS data, while retaining the same LS + AR model combined with various angular momentum combinations. As shown in Figure 10, when IERS data are used as the input series for UT1 predictions, Case 2 still achieves the best performance over the short-term range of 1–9 days. This division follows the empirical crossover in the IERS-input experiment. At day 9, Case 2 is more accurate than Case 1, with MAE values of 0.29562 ms and 0.30036 ms, respectively. At day 10, Case 1 becomes more accurate, with MAE values of 0.33520 ms and 0.34247 ms for Cases 1 and 2, respectively. Therefore, days 1–9 and days 10–90 are used as the two forecast-horizon intervals in this experiment. Relative to Case 4, it achieves a maximum improvement of 11.0% and a mean improvement of 8.2%. Relative to the IERS finals.daily predictions, it achieves a maximum improvement of 17.5% and a mean improvement of 12.2%. For medium- and long-term predictions over 10–90 days, Case 1 again becomes the most stable scheme. Relative to Case 4, it achieves a maximum improvement of 18.9% and a mean improvement of 9.4%, while relative to IERS finals.daily it achieves a maximum improvement of 54.8% and a mean improvement of 49.5%.
Figure 10.
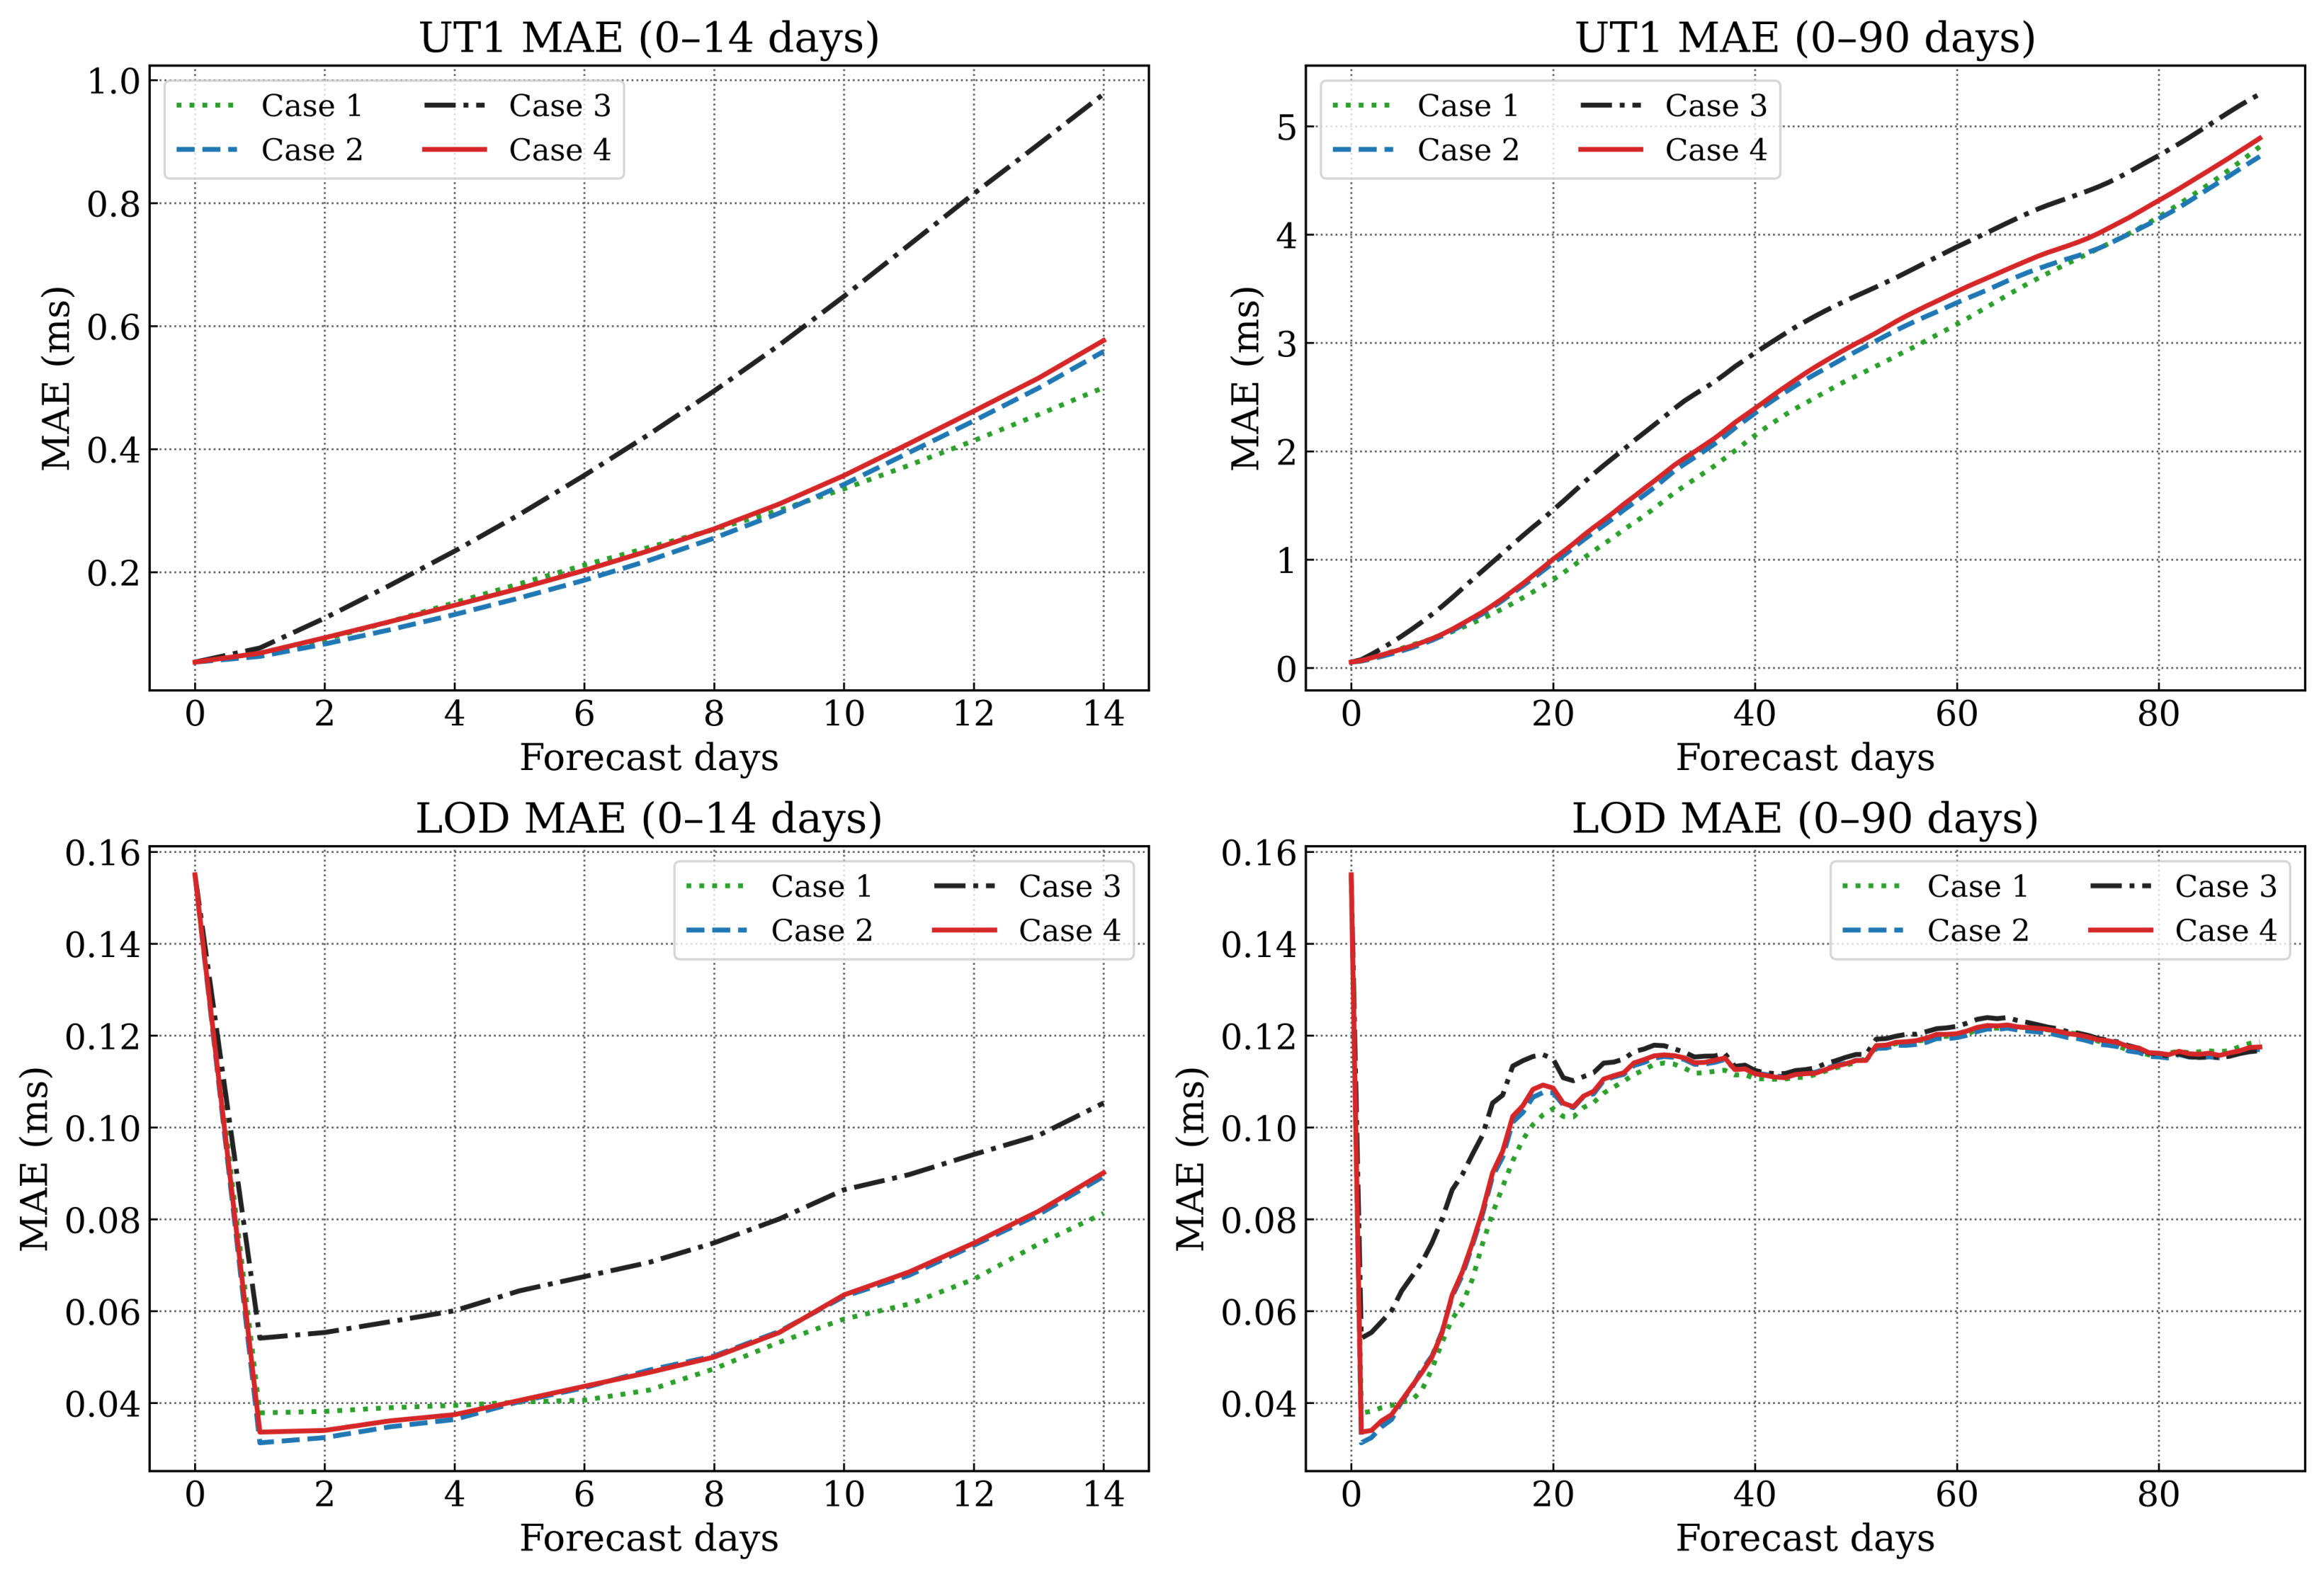
Comparison of UT1 and LOD prediction accuracy based on IERS data using different angular momentum combinations.
For LOD predictions, Case 2 also performs better over 1–5 days, with a maximum improvement of 6.9% and a mean improvement of 3.7% relative to Case 4, whereas Case 1 is more stable over 6–90 days, with a maximum improvement of 10.5% and a mean improvement of 1.9%. These additional experiments confirm that the complementary roles of Case 2 for short-term forecasting and Case 1 for medium- to long-term forecasting are not unique to the NTSC dataset, as they are likewise observed with the IERS dataset.
6. Conclusions
Based on the NTSC’s operational dataset, the GFZ 10-day angular momentum forecast data, and IERS products, this study systematically investigated how different angular momentum combination schemes affect the accuracy of UT1 predictions. The main conclusions are as follows:
- (a)
- Case 1 shows the strongest correlation with GAM, and both Case 1 and Case 2 are closest to GAM in the dominant periodic components. These results support the interpretation that the observed segmented optimality in the prediction experiments arises from a physical basis.
- (b)
- Using the NTSC data as the input series, Case 2 is preferable for short-term UT1 predictions over 1–12 days. Relative to Case 4, IERS finals.daily, and the original NTSC predictions, it achieves maximum improvements of 15.6%, 24.4%, and 63.9%, respectively, with corresponding mean improvements of 10.7%, 10.0%, and 52.0%. For predictions over 13–90 days, Case 1 is preferable. Relative to Case 4, IERS finals.daily, and the original NTSC predictions, it achieves maximum improvements of 22.2%, 55.2%, and 64.5%, respectively, with corresponding mean improvements of 9.8%, 50.7%, and 61.3%.
- (c)
- Using the IERS data as the input series, Case 2 remains preferable for short-term UT1 predictions over 1–9 days, whereas Case 1 remains preferable over 10–90 days. Relative to Case 4 and IERS finals.daily, Case 2 achieves mean improvements of 8.2% and 12.2%, respectively, in the short term. Over 10–90 days, Case 1 achieves mean improvements of 9.4% and 49.5%, respectively. These results show that the segmented suitability of different angular momentum combination schemes is not limited to one particular input data series.
In summary, including more angular momentum components does not necessarily improve prediction performance. The key is to select the angular momentum combination that best matches the forecast horizon. As demonstrated by our results, Case 2 is preferable for short-term predictions, whereas Case 1 is better suited for medium- to long-term predictions. These conclusions provide empirical evidence and practical guidance for the optimization and operational implementation of UT1 predictions based on the NTSC UT1 dataset and offer further insights into international EOP prediction.
Author Contributions
Z.Z. and X.L. performed material preparation, data collection, analysis, and algorithm implementation/validation. Z.Z. wrote the first draft. X.L. proposed the methodology and the overall framework of the paper and provided quality control and revision of the manuscript draft. H.Q. and Y.W. commented on the Section 5 of the earlier version and reviewed the full manuscript. H.L. reviewed the article and was responsible for funding. B.S., H.Y., Y.C., X.C. and X.Y. contributed to data checking and manuscript review. Q.K. and S.W. discussed the feasibility of the study. All authors have read and agreed to the published version of the manuscript.
Funding
This study was funded by the Strategic Priority Research Program of the Chinese Academy of Sciences (XDB1070301, XDB1070302) and the National Natural Science Foundation of China General Program (12173042, 12273047, 42374038). H.Q. is supported by the Youth Innovation Promotion Association, CAS.
Data Availability Statement
The NTSC EOP products can be downloaded at: http://www.ut1.ntsc.ac.cn/page/dataInfo?dataId=12446 (accessed on 4 August 2026). The IERS C04 can be downloaded at: http://hpiers.obspm.fr/iers/eop/eopc04_14/eopc04_IAU2000.62-now (accessed on 4 August 2026), and the finals.daily can be downloaded at: https://datacenter.iers.org/products/eop/rapid/daily/finals2000A.daily (accessed on 4 August 2026). The GFZ AAM, OAM, HAM, and SLAM products can be downloaded at: https://rz-vm480.gfz.de/files/ESMGFZ/EAM/archive_forecast/ (accessed on 4 August 2026).
Acknowledgments
We acknowledge the data resources from the National Space Science Data Center, National Science & Technology Infrastructure of China (http://www.nssdc.ac.cn), as well as the data provided by the NTSC, IERS, and GFZ.
Conflicts of Interest
The authors declare no conflicts of interest.
References
- Gambis, D.; Luzum, B. Earth rotation monitoring, UT1 determination and prediction. Metrologia 2011, 48, S165–S170. [Google Scholar] [CrossRef] [Scilit]
- Bradley, B.K.; Sibois, A.; Axelrad, P. Influence of ITRS/GCRS implementation for astrodynamics: Coordinate transformations. Adv. Space Res. 2016, 57, 850–866. [Google Scholar] [CrossRef] [Scilit]
- Ye, F.; Yuan, Y.; Deng, Z. Improved ultra-rapid UT1-UTC determination and its preliminary impact on GNSS satellite ultra-rapid orbit determination. Remote Sens. 2020, 12, 3584. [Google Scholar] [CrossRef] [Scilit]
- Holme, R.; De Viron, O. Characterization and implications of intradecadal variations in length of day. Nature 2013, 499, 202–204. [Google Scholar] [CrossRef] [Scilit] [PubMed]
- Dobslaw, H.; Dill, R. Predicting Earth orientation changes from global forecasts of atmosphere-hydrosphere dynamics. Adv. Space Res. 2018, 61, 1047–1054. [Google Scholar] [CrossRef] [Scilit]
- Gross, R.S. Earth rotation variations-long period. In Treatise on Geophysics, 2nd ed.; Elsevier: Amsterdam, The Netherlands, 2015; Volume 3, pp. 215–261. [Google Scholar] [CrossRef] [Scilit]
- Schuh, H.; Behrend, D. VLBI: A fascinating technique for geodesy and astrometry. J. Geodyn. 2012, 61, 68–80. [Google Scholar] [CrossRef] [Scilit]
- Zajdel, R.; Sośnica, K.; Bury, G.; Dach, R.; Prange, L. System-specific systematic errors in earth rotation parameters derived from GPS, GLONASS, and Galileo. GPS Solut. 2020, 24, 74. [Google Scholar] [CrossRef] [Scilit]
- Coulot, D.; Pollet, A.; Collilieux, X.; Berio, P. Global optimization of core station networks for space geodesy: Application to the referencing of the SLR EOP with respect to ITRF. J. Geod. 2010, 84, 31–50. [Google Scholar] [CrossRef] [Scilit]
- Moreaux, G.; Lemoine, F.G.; Capdeville, H.; Kuzin, S.; Otten, M.; Štěpánek, P.; Willis, P.; Ferrage, P. The international DORIS service contribution to the 2014 realization of the international terrestrial reference frame. Adv. Space Res. 2016, 58, 2479–2504. [Google Scholar] [CrossRef] [Scilit]
- Dieck, C.; Johnson, M.C.; MacMillan, D.S. The importance of co-located VLBI Intensive stations and GNSS receivers. J. Geod. 2023, 97, 21. [Google Scholar] [CrossRef] [Scilit]
- Wang, Q.; Hu, C.; Xu, T.; Chang, G.; Moraleda, A.H. Impacts of Earth rotation parameters on GNSS ultra-rapid orbit prediction: Derivation and real-time correction. Adv. Space Res. 2017, 60, 2855–2870. [Google Scholar] [CrossRef] [Scilit]
- Kehm, A.; Hellmers, H.; Bloßfeld, M.; Dill, R.; Angermann, D.; Seitz, F.; Hugentobler, U.; Dobslaw, H.; Thomas, M.; Thaller, D.; et al. Combination strategy for consistent final, rapid and predicted Earth rotation parameters. J. Geod. 2023, 97, 3. [Google Scholar] [CrossRef] [Scilit]
- Xu, X.Q.; Zhou, Y.H.; Liao, X.H. Short-term earth orientation parameters predictions by combination of the least-squares, AR model and Kalman filter. J. Geodyn. 2012, 62, 83–86. [Google Scholar] [CrossRef] [Scilit]
- Yang, Y.; Xu, T.; Sun, Z.; Nie, W.; Fang, Z. Middle-and long-term UT1-UTC prediction based on constrained polynomial curve fitting, weighted least squares and autoregressive combination model. Remote Sens. 2022, 14, 3252. [Google Scholar] [CrossRef] [Scilit]
- Śliwińska-Bronowicz, J.; Kur, T.; Wińska, M.; Dobslaw, H.; Nastula, J.; Partyka, A.; Belda, S.; Bizouard, C.; Boggs, D.; Bruni, S.; et al. Assessment of length-of-day and universal time predictions based on the results of the Second Earth Orientation Parameters Prediction Comparison Campaign. J. Geod. 2024, 98, 22. [Google Scholar] [CrossRef] [Scilit]
- Gambis, D.; Salstein, D.A.; Lambert, S. Use of atmospheric angular momentum forecasts for UT1 predictions: Analyses over CONT08. J. Geod. 2011, 85, 435–441. [Google Scholar] [CrossRef] [Scilit]
- Li, X.; Wu, Y.; Yao, D.; Liu, J.; Nan, K.; Ma, L.; Cheng, X.; Yang, X.; Zhang, S. Research on UT1-UTC and LOD prediction algorithm based on denoised EAM dataset. Remote Sens. 2023, 15, 4654. [Google Scholar] [CrossRef] [Scilit]
- Dill, R.; Dobslaw, H.; Thomas, M. Improved 90-day Earth orientation predictions from angular momentum forecasts of atmosphere, ocean, and terrestrial hydrosphere. J. Geod. 2019, 93, 287–295. [Google Scholar] [CrossRef] [Scilit]
- Bizouard, C.; Lambert, S.; Gattano, C.; Becker, O.; Richard, J.Y. The IERS EOP 14C04 solution for Earth orientation parameters consistent with ITRF 2014. J. Geod. 2019, 93, 621–633. [Google Scholar] [CrossRef] [Scilit]
- Li, X.; Yang, X.; Wu, Y.; Cheng, X.; Sun, B.; Yao, D.; Liu, J.; Zhang, Z.; Zhang, S. System architecture, accuracy evaluation, and service applications of the high-precision UT1 products developed by the National Time Service Center. Sci. China Earth Sci. 2026, 69, 2286–2298. [Google Scholar] [CrossRef] [Scilit]
- Kouba, J.; Vondrrak, J. Comparison of length of day with oceanic and atmospheric angular momentum series. J. Geod. 2005, 79, 256–268. [Google Scholar] [CrossRef] [Scilit]
- Dobslaw, H.; Dill, R. Product Description Document: Effective Angular Momentum Functions from Earth System Modelling at GeoForschungsZentrum in Potsdam; Technical Report; GeoForschungsZentrum: Potsdam, Germany, 2019. [Google Scholar]
- Chapanov, Y.; Gambis, D. Influence of AAM and OAM on the Universal Time Variations. In Proceedings of the AIP Conference Proceedings; American Institute of Physics: College Park, MD, USA, 2008; Volume 1043, pp. 218–219. [Google Scholar] [CrossRef] [Scilit]
- Li, X.; Wu, Y.; Kong, Q.; Qiao, H.H.; Ye, T.; Yang, H.; Zhang, Z.; Cheng, X.; Yang, X.; Li, X.; et al. Research on polar motion prediction accuracy based on ETH and GFZ angular momentum forecast products. Earth Space Sci. 2026, 13, e2026EA005028. [Google Scholar] [CrossRef] [Scilit]
- Niedzielski, T.; Kosek, W. Prediction of UT1-UTC, LOD and AAM χ3 by combination of least-squares and multivariate stochastic methods. J. Geod. 2008, 82, 83–92. [Google Scholar] [CrossRef] [Scilit]
- Dill, R.; Stumpe, L.; Saynisch-Wagner, J.; Thomas, M.; Dobslaw, H. Benefits of refined 10-day effective angular momentum forecasts for Earth rotation parameter prediction. J. Geod. 2025, 99, 15. [Google Scholar] [CrossRef] [Scilit]
- Altamimi, Z.; Rebischung, P.; Collilieux, X.; Métivier, L.; Chanard, K. ITRF2020: An augmented reference frame refining the modeling of nonlinear station motions. J. Geod. 2023, 97, 47. [Google Scholar] [CrossRef] [Scilit]
- Zheng, D.W.; Yu, N.H. Earth rotation and it’s relations to geophysical phenomena: The changes of length of the day. Adv. Geophys. 1996, 11, 81–101. [Google Scholar]
- Yu, N.; Liu, H.; Chen, G.; Chen, W.; Ray, J.; Wen, H.; Chao, N. Analysis of relationships between ENSO events and atmospheric angular momentum variations. Earth Space Sci. 2021, 8, e2021EA002030. [Google Scholar] [CrossRef] [Scilit]
- Yu, N.; Ray, J.; Li, J.; Chen, G.; Chao, N.; Chen, W. Intraseasonal variations in atmospheric and oceanic excitation of length-of-day. Earth Space Sci. 2021, 8, e2020EA001563. [Google Scholar] [CrossRef] [Scilit]
- Zhangzhen, S.; Tianhe, X. Prediction of earth rotation parameters based on improved weighted least squares and autoregressive model. Geod. Geodyn. 2012, 3, 57–64. [Google Scholar] [CrossRef] [Scilit]
- Kalarus, M.; Schuh, H.; Kosek, W.; Akyilmaz, O.; Bizouard, C.; Gambis, D.; Gross, R.; Jovanović, B.; Kumakshev, S.; Kutterer, H.; et al. Achievements of the Earth orientation parameters prediction comparison campaign. J. Geod. 2010, 84, 587–596. [Google Scholar] [CrossRef] [Scilit]
- Chen, J.L.; Wilson, C.R.; Chao, B.F.; Shum, C.K.; Tapley, B.D. Hydrological and oceanic excitations to polar motion and length-of-day variation. Geophys. J. Int. 2000, 141, 149–156. [Google Scholar] [CrossRef] [Scilit]
- Dill, R. Hydrological Model LSDM for Operational Earth Rotation and Gravity Field Variations; Technical Report; University of Bonn: Bonn, Germany, 2008. [Google Scholar]
- Chen, J.; Wilson, C.R.; Kuang, W.; Chao, B.F. Interannual oscillations in Earth rotation. J. Geophys. Res. Solid Earth 2019, 124, 13404–13414. [Google Scholar] [CrossRef] [Scilit]

Disclaimer/Publisher’s Note: The statements, opinions and data contained in all publications are solely those of the individual author(s) and contributor(s) and not of MDPI and/or the editor(s). MDPI and/or the editor(s) disclaim responsibility for any injury to people or property resulting from any ideas, methods, instructions or products referred to in the content. |
© 2026 by the authors. Licensee MDPI, Basel, Switzerland. This article is an open access article distributed under the terms and conditions of the Creative Commons Attribution (CC BY) license.