


Abstract
We investigate the correlations between IceCube high-energy neutrinos and Fermi-LAT -ray sources using an unbinned likelihood analysis. In previous analyses of the same IceCube public dataset, only the spatial information of neutrino events was utilized, while the energy term in the probability density functions (PDFs) was neglected, limiting the achievable sensitivity. In this work, we incorporate both spatial and energy terms into the likelihood, with the energy PDFs constructed from the effective areas and smearing matrices. We focus on the Third Catalog of Hard Fermi-LAT Sources (3FHL) and the Fourth LAT AGN Catalog (4LAC-DR2). To account for the significant difference in IceCube’s sensitivity between the two hemispheres, we perform stacking analyses for the all-sky, Northern hemisphere, and Southern hemisphere source subsets separately, under both equal weighting and flux weighting schemes. No statistically significant neutrino excess is found in any configuration. We therefore derive 95% confidence level upper limits on the total neutrino flux contributed by these source populations. For a spectral index of , the all-sky stacking analysis indicates that the 3FHL and 4LAC-DR2 populations contribute at most 3.12% and 2.83% (equal weighting), and 4.45% and 3.49% (flux weighting) of the IceCube diffuse neutrino flux, respectively. Compared to the spatial-only analysis, the inclusion of the energy term improves the constraints on hard-spectrum emission by over one order of magnitude. Our results further demonstrate that the 3FHL and 4LAC-DR2 sources are subdominant contributors to the diffuse astrophysical neutrino flux observed by IceCube.
1. Introduction
The detection of a diffuse astrophysical neutrino flux by IceCube established the existence of cosmic accelerators capable of producing neutrinos up to at least PeV energies [1,2,3,4]. However, the specific source populations responsible for the bulk of this flux remain largely unidentified. After more than a decade of data taking, time-integrated point-source searches have identified only a limited number of compelling candidates, most notably the blazar TXS 0506+056 and the Seyfert galaxy NGC 1068 [5,6,7,8]. While these detections confirm that active galactic nuclei (AGN) can emit high-energy neutrinos, these sources account for only a very small fraction of the total diffuse flux, leaving the dominant contributors to the neutrino sky uncertain.
Gamma-ray source catalogs provide a natural starting point for population studies, as hadronic interactions generically produce neutrinos and gamma rays in comparable proportions through both and channels [9,10]. Although source opacity and electromagnetic cascading can complicate a direct correspondence [11,12], GeV observations effectively trace the non-thermal power of AGN and remain a well-motivated guide for neutrino source searches. Many previous stacking analyses of Fermi-LAT blazar samples and related gamma-ray populations have consistently found no evidence that cataloged GeV-bright sources dominate the diffuse neutrino sky [13,14,15,16,17,18,19,20], though several studies have claimed tentative associations between IceCube neutrinos and particular blazar or radio-bright AGN samples [21,22,23,24]. Complementary constraints are further provided by time-dependent and spatio-temporal association analyses, particularly for blazar-like source populations [20,25,26,27]. In our earlier work [14], we performed a spatial-only stacking analysis of several Fermi-LAT catalogs using the public IceCube 10-year muon-track dataset. While that study placed meaningful constraints on the neutrino contribution from these populations, it utilized only the directional information of neutrino events, neglecting the energy term in the probability density functions (PDFs). This spatial-only approach does not fully exploit the sensitivity of the IceCube dataset, as the atmospheric background exhibits a significantly softer energy spectrum than the typical astrophysical signal.
In this work, we present a follow-up analysis that incorporates both spatial and energy terms into the unbinned likelihood analysis to enhance the discrimination power between atmospheric background and potential astrophysical signals. Furthermore, considering the different sensitivity and background of IceCube in the northern and southern sky, we perform separate stacking analyses for the all-sky, Northern hemisphere, and Southern hemisphere source subsets. This strategy allows for a more careful assessment of potential neutrino excesses. The neutrino analysis is built on the IceCube 10-year public muon-track data, which provides both the event sample and the detector-response products required for likelihood calculations [28].
We focus on two specific Fermi-LAT catalogs: the Third Catalog of Hard Fermi-LAT Sources (3FHL) [29] and the Fourth LAT AGN Catalog Data Release 2 (4LAC-DR2) [30,31]. We exclude the 4FGL catalog [32], which was included in our previous study [14]. At high galactic latitudes (), the extragalactic 4FGL source population overlaps largely with 4LAC, and the latter provides a more physically motivated classification of AGN subclasses. The 3FHL sources represent the hardest-spectrum GeV emitters observed by Fermi-LAT. The photon energies (up to 2 TeV) of these sources are closer to the energy regime (TeV–PeV) of the IceCube data, making them among the most motivated Fermi-LAT targets for hadronic acceleration and subsequent neutrino detection.
2. Data and Samples
2.1. IceCube 10-Year Public Muon-Track Data
The IceCube Neutrino Observatory detects high-energy neutrinos by observing the Cherenkov radiation emitted by relativistic secondary charged particles produced in neutrino interactions within the Antarctic ice. In this work, we utilize the publicly released 10-year muon-track data spanning from April 2008 to July 2018 [28]. These data comprise approximately reconstructed track-like events, predominantly arising from charged-current and interactions, as well as a substantial atmospheric-muon background that mimics the same topological signature. The dataset encompasses both through-going and starting tracks. Through-going tracks are primarily induced by muon neutrinos interacting outside the instrument volume, with the resulting muons traversing the detector, whereas starting tracks originate from neutrino interactions occurring within the fiducial volume. The data release is segmented into 10 distinct data-taking seasons, ranging from the 40-string configuration (IC 40) to the full 86-string configuration (IC86-II to IC86-VII), reflecting the progressive expansion of the detector array.
The dominant backgrounds for astrophysical neutrino searches in this dataset are atmospheric muons and atmospheric neutrinos generated by cosmic-ray interactions in the Earth’s atmosphere [7,28]. The composition and rate of these backgrounds exhibit a strong dependence on the declination, which is directly linked to the zenith angle at the South Pole. For events originating from the Northern celestial hemisphere, the Earth acts as a filter, effectively absorbing atmospheric muons and allowing only atmospheric neutrinos and potential astrophysical neutrinos to reach the detector. In contrast, for the Southern celestial hemisphere, atmospheric muons can penetrate the ice and reach the detector, resulting in a background rate that is orders of magnitude higher than the expected astrophysical signal. Consequently, more stringent event selection criteria are applied to the southern sky data to suppress this overwhelming muon background [7,28]. Atmospheric neutrinos, which possess a significantly softer energy spectrum compared to the astrophysical component, dominate the background at energies below ∼100 TeV across both hemispheres [33].
For each event in the dataset, the release provides the reconstructed equatorial coordinates (, ), the directional reconstruction uncertainty (), and the reconstructed muon energy proxy (). Additionally, the dataset includes binned detector response functions, specifically the effective area () and energy smearing matrices, as functions of true neutrino energy and declination. We restrict our search to the region and to minimize contamination from the complex diffuse emission along the galactic plane and to ensure reliable background estimation near the poles.
2.2. Fermi-LAT Source Samples
High-energy astrophysical neutrinos are expected to be produced via hadronic processes, such as or interactions, which inevitably accompany the production of high-energy gamma rays [9,10]. Therefore, catalogs of gamma-ray sources serve as promising candidates for searching for neutrino emission. In this work, we focus on two specific Fermi-LAT catalogs: 3FHL [29] and 4LAC-DR2 [30,31].
The 3FHL catalog is constructed from seven years of Fermi-LAT observations in the energy range of 10 GeV to 2 TeV. It represents a population of sources with relatively hard gamma-ray spectra, making them prime candidates for hadronic acceleration and subsequent neutrino production. The 4LAC-DR2 catalog (although a newer DR3 catalog is available, we adopt 4LAC-DR2 to facilitate a consistent comparison with our previous results and to better quantify the sensitivity gain achieved by incorporating energy information), derived from 10 years of Fermi-LAT data, provides a comprehensive list of active galactic nuclei detected by the LAT, which includes subclasses such as BL Lac objects and flat-spectrum radio quasars (FSRQs). In our previous analysis [14], we also considered the full 4FGL catalog. However, at high galactic latitudes (), the extragalactic source population in 4FGL overlaps largely with 4LAC. Since 4LAC is a catalog based on physical classification, while 4FGL is a comprehensive instrument-based catalog that includes all detected gamma-ray emitters regardless of physical type, we consider only the 4LAC-DR2 sample to avoid redundancy and to focus on well-classified extragalactic populations.
To mitigate potential contamination from galactic diffuse emission and unresolved sources near the galactic plane, we apply a uniform galactic latitude cut of to both catalogs. Furthermore, we exclude sources categorized as pulsars, as their gamma-ray emission is predominantly of leptonic origin and less likely to be associated with high-energy neutrino production. To consider the impact of IceCube’s declination-dependent sensitivity on the stacking results, we also partition each catalog into Northern and Southern hemisphere sub-samples based on equatorial coordinates, with the boundary defined at . Note that this boundary is defined according to the sensitivity of the IceCube muon-track data. Although the region with to geographically belongs to the Southern hemisphere, neutrinos arriving from these directions also traverse the Earth before reaching IceCube, resulting in a sensitivity similar to that of the region with [7,28]. After applying these selection criteria, the 3FHL sample contains a total of 1235 sources, with 754 located in the Northern hemisphere () and 481 in the Southern hemisphere (). The 4LAC-DR2 sample comprises 3131 sources, divided into 1935 Northern and 1196 Southern sources. These sub-samples are analyzed independently to derive constraints on the neutrino flux contributions.
3. Analysis Method
3.1. Unbinned Likelihood Analysis
The analysis follows the standard unbinned maximum-likelihood-ratio method extensively used in IceCube point-source searches [28,34,35]. For the single-source analysis, we directly use the SkyLLH package [36], while for the stacking analysis we use our own code. The likelihood is constructed as the product of probability density functions (PDFs) over all events,
where is the number of events in season k, is the expected number of signal events in that season, and and are the signal and background PDFs for event i, respectively. The signal PDF depends on the assumed neutrino spectral index , while the background PDF depends only on the event distributions.
The number of expected signal events in each season is determined by the detector acceptance and the assumed source spectrum. For a power-law spectrum
with spectral index and normalization , the expected signal count in season k is
where is the livetime of season k, is the public IceCube muon-neutrino effective area as a function of true neutrino energy and declination, and is the declination of the source. In the stacking analysis, the total expected signal is distributed across seasons according to the fractional acceptance of the full source population,
where is the model weight of source j encoding prior assumptions about relative source strengths. The test statistic is defined as the log-likelihood ratio
where the denominator corresponds to the background-only hypothesis, represents the best-fit spectral parameters with for single-source analysis and for stacking analysis. Under Wilks’ theorem [37], TS asymptotically follows a distribution with the degrees of freedom corresponding to the number of the additional free parameters in the signal hypothesis relative to the background-only case. For the stacking analysis, we perform the analysis at some fixed chosen spectral indices, so there is only one free parameter in the likelihood fit. The benchmark spectral indices are , , , and .
3.2. Signal PDF: Spatial and Energy Terms
The signal PDF describes the probability density for observing a given event i under the signal hypothesis that the event originates from a source or source population. The signal PDF is factorized into independent spatial and energy terms,
This factorization follows the standard convention used in IceCube point-source analyses [28,34,35].
For an individual point source at position , the spatial term is the detector point-spread function (PSF). We adopt the two-dimensional Gaussian form on the sphere [28,35],
where is the angular separation between event i and source j, and is the directional reconstruction uncertainty of the event.
The inclusion of the energy term is the key methodological improvement in this work relative to our previous spatial-only analysis [14]. The data release provides binned effective areas and smearing matrices as functions of true neutrino energy and declination [28]. The smearing matrix is a 5-dimension response table that maps each true-energy-declination bin to a 3-dimension distribution of reconstructed muon energy , angular deviation between neutrino and reconstructed muon directions (PSF), and estimated directional uncertainty (AngErr). The signal energy PDF in Equation (8) is obtained by marginalizing the smearing matrix over the PSF and AngErr dimensions, yielding the conditional density for reconstructed energy. For a source at declination and an assumed power-law spectrum with index , the signal energy PDF is
The energy PDF encodes the full detector response for the tested spectral hypothesis and provides discrimination between signal and background based on the reconstructed energy distribution, which is independent of the directional information already contained in the spatial term. As noted in our previous work [14], the inclusion of energy information is expected to improve the discovery potential by approximately a factor of several times [34].
3.3. Background PDF
The background PDF describes the probability density for observing a reconstructed event under the hypothesis that the event originates entirely from background processes, predominantly atmospheric muons and atmospheric neutrinos produced in cosmic-ray air showers. Because only a very small number of neutrino sources have been detected thus far, the IceCube data are almost entirely dominated by background events [28]. This justifies the direct data-driven approach to background estimation.
The background PDF is factorized into spatial and energy terms in analogy with the signal PDF
Given that IceCube is located at the South Pole, background events are uniformly distributed in right ascension. Consequently, the spatial background term depends only on declination. Following the standard procedure used in IceCube point-source searches [28,35], we estimate the spatial background PDF by counting events in declination bands:
where is the number of events in declination band i for season k, is the total number of events in season k, and is the solid angle of the declination band. The energy background term is also derived directly from the data and modeled as a declination-dependent distribution in reconstructed energy,
where is the number of events in declination band i and reconstructed energy bin j for season k, and is the width of the energy bin. The data-driven background estimation is a standard technique of IceCube likelihood analyses and avoids introducing a parametric background model [34,35].
3.4. Stacking Analysis
For stacking analyses, the contributions of all catalog sources are combined into a single composite signal PDF. This approach improves sensitivity by accumulating the potential signal from the full source population, which would otherwise be too weak to detect individually. The stacked signal PDF is written as the weighted sum of the contributions from all sources [38,39]:
where is the signal PDF for source j and event i in season k, is the model weight encoding prior assumptions about relative source strengths, and is the detector acceptance weight for source j in season k. The acceptance weight reflects the detector’s exposure to a source at declination for the assumed source spectrum. It is given by . This acceptance weighting naturally accounts for the declination-dependent exposure of the detector.
The model weight describes the expected relative signal intensity between sources at the reference energy , determined by the intrinsic properties of the sources. We consider two phenomenological weighting schemes: (1) Equal weighting: The high-energy neutrino flux is assumed to be independent of the source properties included in the catalog. We therefore set , so that all catalog sources contribute equally to the stacked signal. (2) γ-ray flux weighting: A more general assumption is that sources with higher -ray flux may also have higher neutrino flux, reflecting a possible hadronic connection between the two messengers. We therefore set , where is the -ray flux for source j taken from the catalog. This weighting scheme assigns larger model weights to brighter -ray sources, making the analysis more sensitive to a relatively small number of dominant emitters [14]. We emphasize that this weighting is adopted only as a phenomenological ranking of -ray brightness and does not imply a strict proportionality between neutrino and -ray luminosity; the actual relationship between neutrino and photon emission depends on the specific hadronic emission mechanism and source opacity.
4. Results
4.1. Signal Search
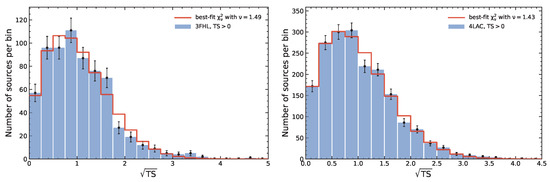
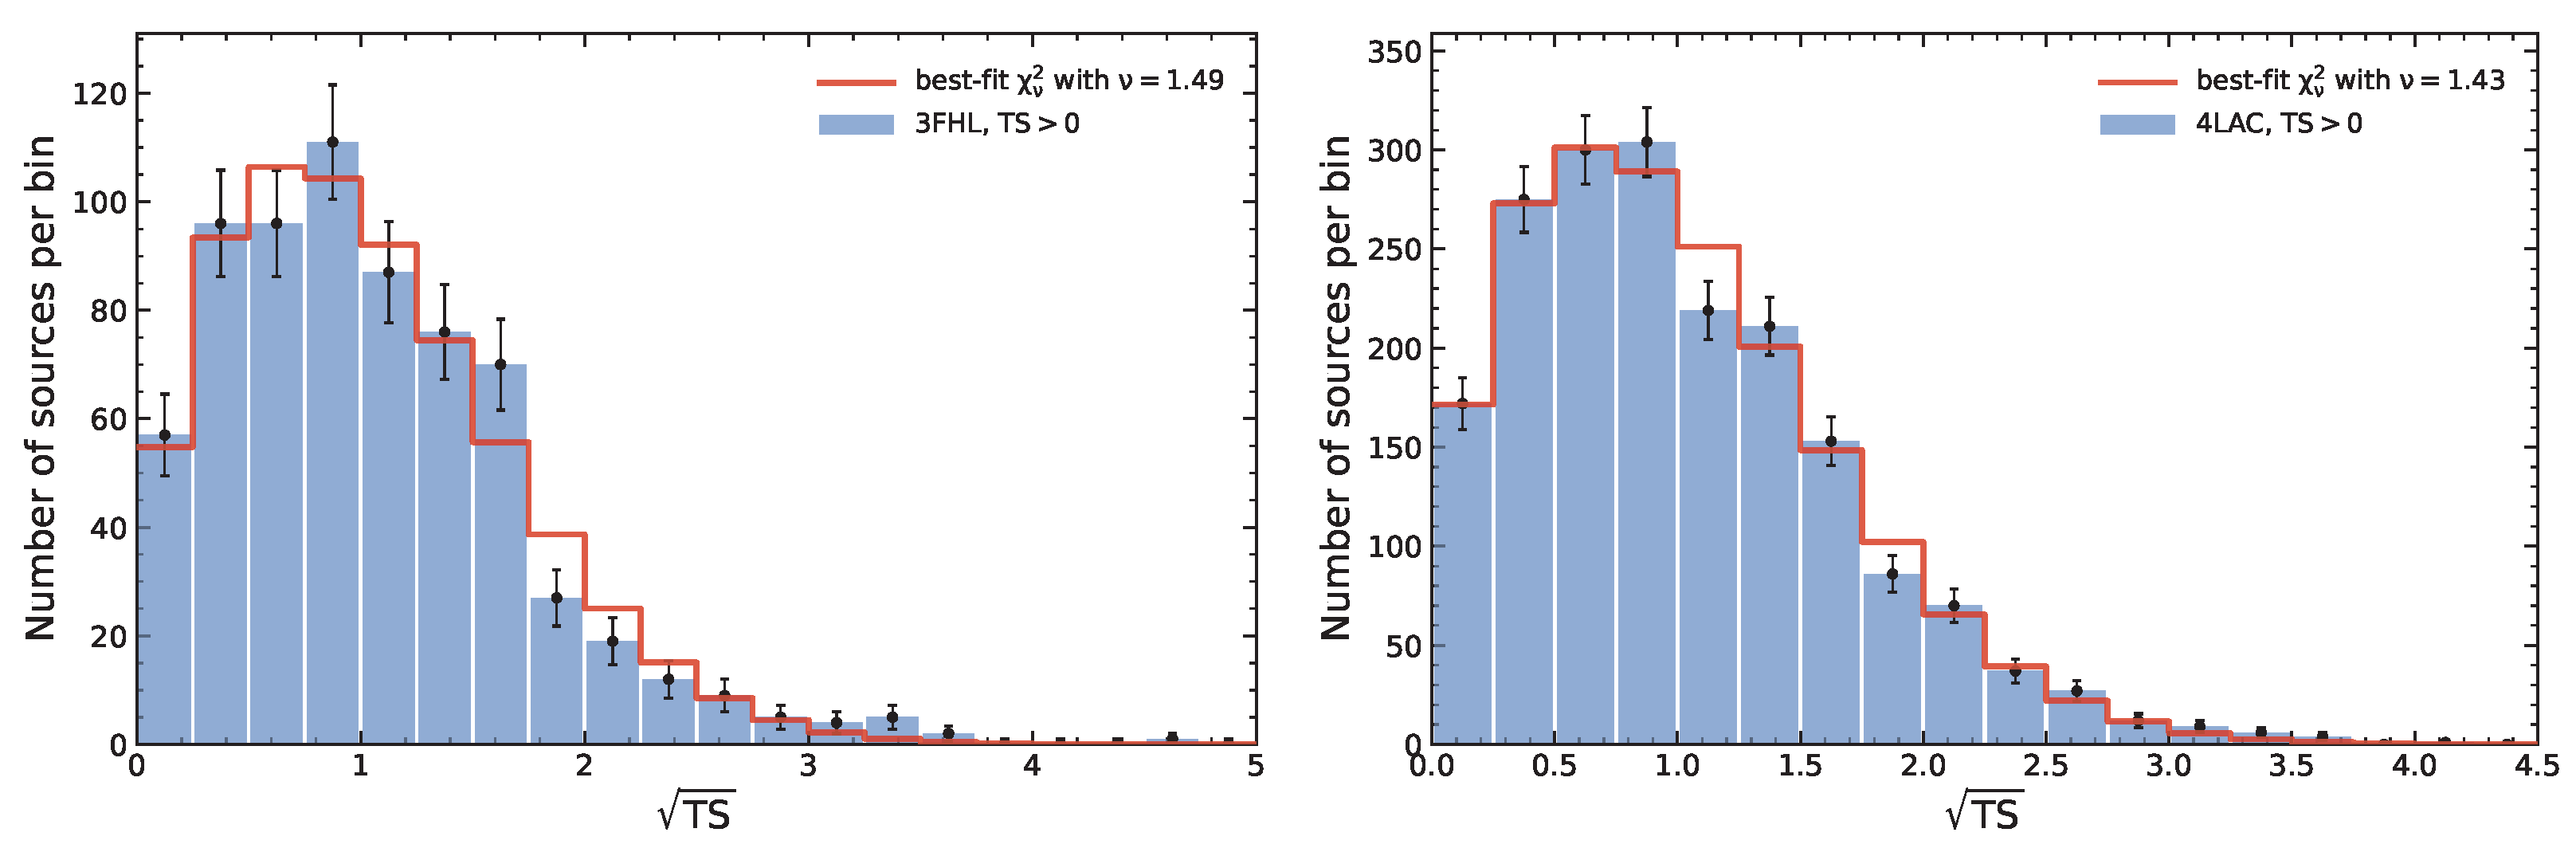
We first examine the outcome of the single-source analysis. For each source in the 3FHL and 4LAC-DR2 samples, we maximize the likelihood in Equation (1) over the signal normalization and the spectral index , obtaining the best-fit value for that source. Figure 1 shows the TS distributions for the sources in the 3FHL and 4LAC samples with from our single-source analysis. We fit this histogram with a distribution with a free number of degrees of freedom , which gives a best-fit value of – (red lines). Since we freed two parameters ( and ) during the fitting process, according to Wilks’ theorem [37], the TS distribution arising from background fluctuations should follow a distribution with two degrees of freedom. The fact that the actual distribution has fewer than two degrees of freedom may originate from the constrained range of imposed during the fitting process.
Figure 1.
TS distributions for the sources in the 3FHL (left) and 4LAC (right) samples with TS from our single-source analysis. The error bars are given by the square root of the source count in each bin. We fit the histogram with a distribution with a free number of degrees of freedom , which gives a best-fit value of – (red lines).
The TS values can be converted to local significances based on the distribution. Although in the above we found the degrees of freedom to be , we conservatively adopt a distribution with two degrees of freedom to derive the local significance. Furthermore, considering that we have searched for thousands of sources, we must also account for the trial factor. We use the following equation to calculate the trial-corrected global significances, with (There are 1049 overlapping sources between the 3FHL and 4LAC samples, resulting in a total of 3317 unique sources. We consider sources from the two catalogs to be the same source if their angular separation is less than .). For the top 15 sources, their TS values, best-fit spectral parameters, local and global significances are listed in Table 1. As can be seen, no statistically significant (>5) excess above the expected background fluctuations is observed for any individual source in either catalog. The non-detection of any individual source with significant neutrino excess is consistent with the results presented in the literature [35,39,40,41]. The most significant detections come from the sources NGC 1068 (TS = 20.6), 1E 1207.9+3945 (TS = 17.4, this source is only away from NGC 4151), PKS 1424+240 (TS = 13.2), TXS 0506+056 (TS = 13.1), and GB6 J1542+6129 (TS = 12.3), and they have all been reported in previous IceCube analyses [7,42,43,44]. Note that the TS value for NGC 1068 is lower than that reported by the IceCube group [8]; this difference may arise from the shorter observation period covered by the public dataset and from the fact that we do not scan the source position to maximize the TS. It is also worth noting that the global significance in Table 1 is defined specifically within the context of our analysis, which does not contradict the high significance (e.g., NGC 1068) reported by the IceCube Collaboration. For a source with a strong theoretical expectation like NGC 1068, many of the trials in our large-sample analysis are redundant and unnecessary.
Table 1.
Top sources ranked by TS values in the single-source likelihood analysis for the 3FHL and 4LAC-DR2 catalogs.
Since the single-source analysis does not detect any significant neutrino signal, we employ the stacking analysis described in Section 3.4 to search for neutrino emission from the entire source population. The profile likelihood curves are constructed for each catalog, sky partition, weighting scheme, and spectral hypothesis. Across all configurations, we also do not find any significant neutrino signal.
4.2. Upper Limits on Neutrino Fluxes
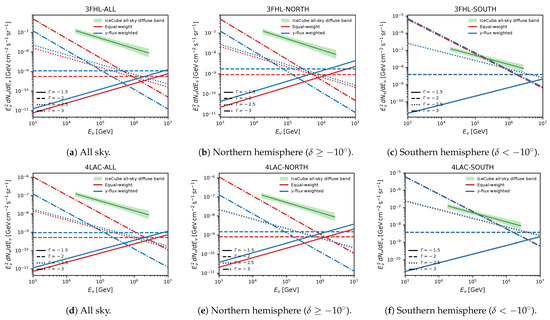
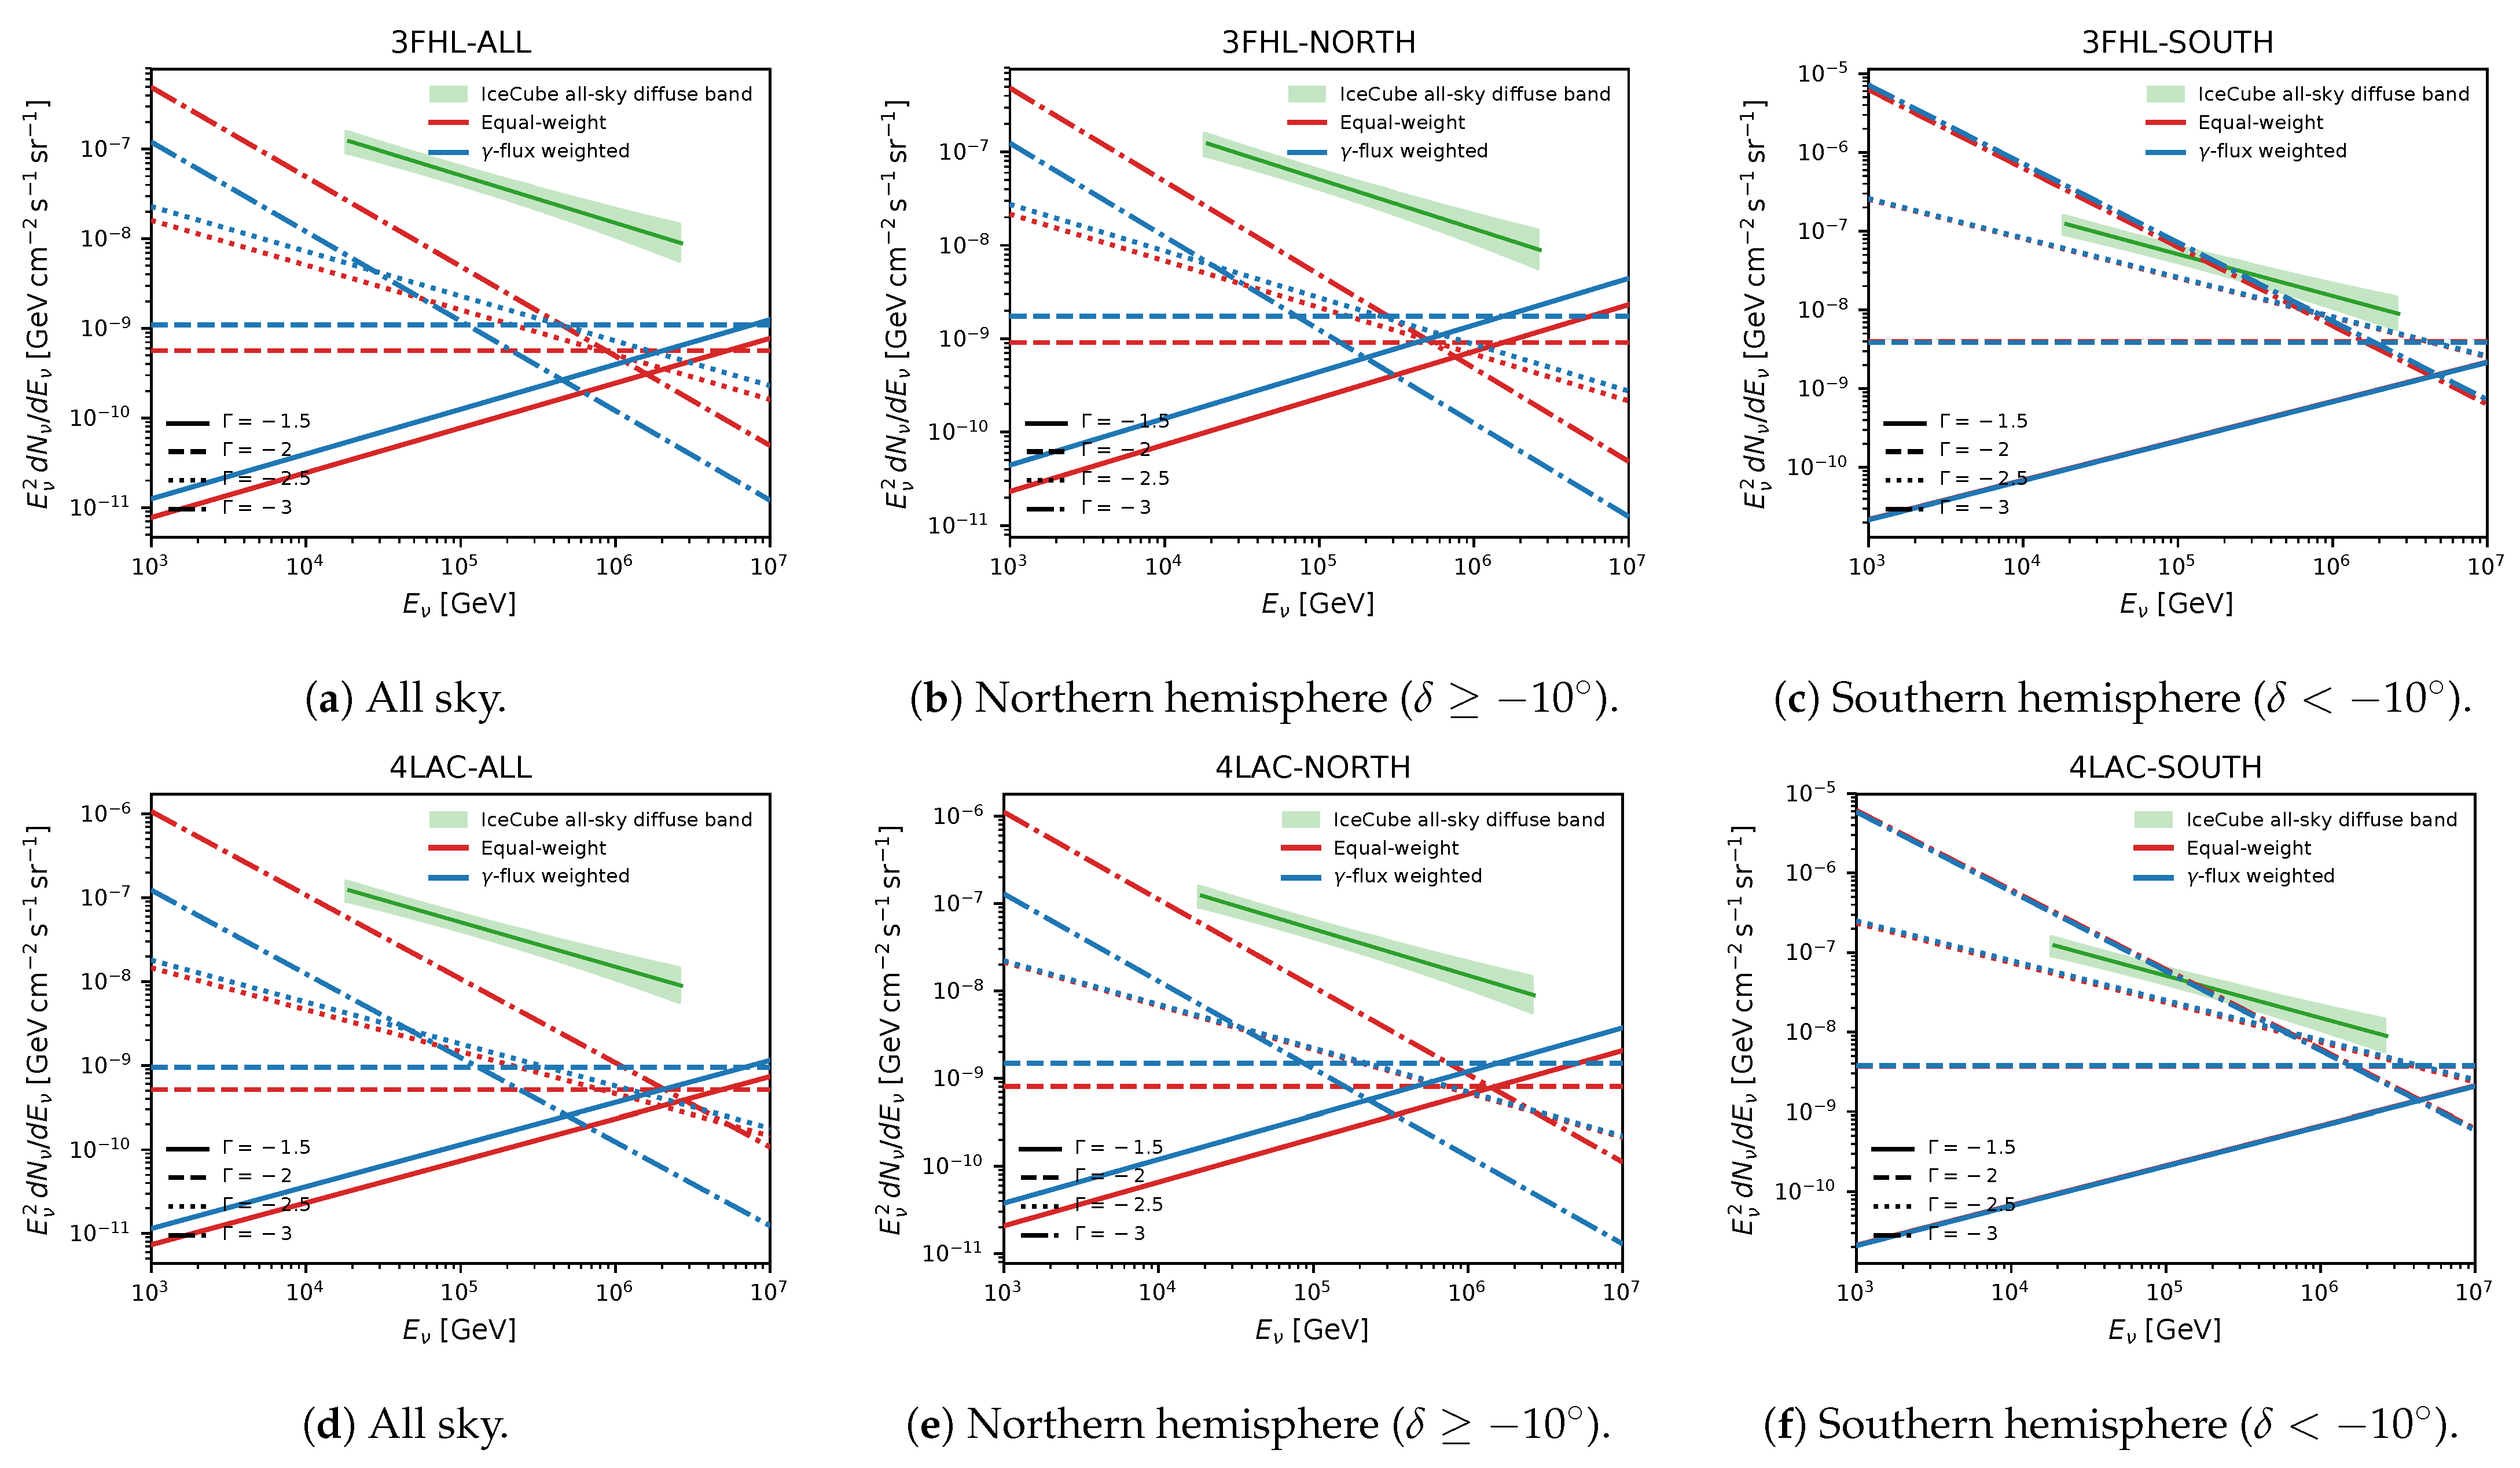
Therefore, we derive upper limits on the total neutrino flux contributed by each source population. Unlike in the single-source analysis, where we treat the spectral index as a free parameter, in the stacking analysis we adopt a set of fixed spectral indices (, , and ). For each fixed spectral index , we extract upper limits on the source-population flux using the likelihood analysis. We scan the signal normalization at the fixed and construct the profile likelihood curve . The 95% confidence level (C.L.) upper limit on the number of signal events, , is defined by the condition , which corresponds to the 95th percentile of the distribution under Wilks’ theorem [37]. The associated upper limit on the flux normalization follows directly from the linear relation between and in Equation (3). The upper-limit flux normalization is converted into a differential flux through the spectrum . To compare with the diffuse astrophysical neutrino flux, the differential flux shown in Figure 2 has been divided by the solid angle of the corresponding sky region (all-sky, Northern, or Southern hemisphere). We have also multiplied by a factor of three to convert the flux to the all-flavor flux (i.e., assuming after neutrino oscillations). We adopt the diffuse neutrino flux from Ref. [4] for comparison. Since they also report the flux, we multiply it by the same factor of 3 to convert it to the all-flavor neutrino flux (The flux upper limits obtained from our analysis of muon data are for muon neutrinos. Ref. [4] also reported the all-sky diffuse muon-neutrino flux. They are in fact directly comparable without the need for any conversion. However, for consistency with previous works [14,18], both were multiplied by a factor of 3 to convert to all-flavor neutrino fluxes.). The results in Figure 2 represent the sky-averaged all-flavor differential neutrino flux contributed by the source population under the assumed weighting scheme and spectral hypothesis.
Figure 2.
95% C.L. differential flux upper limit for the stacked 3FHL (upper panels) and 4LAC (bottom panels) source populations. Results are shown for all-sky, Northern hemisphere, and Southern hemisphere partitions (from left to right). Red and blue curves denote the equal-weighting and flux-weighting schemes, respectively; the four line styles within each color correspond to (solid), (dashed), (dotted), and (dash-dotted). The green band marks the all-flavor diffuse astrophysical neutrino flux derived from the IceCube measurement [4]. The percentages in Table 2 are obtained by integrating these curves over 16 TeV–2.6 PeV.
Figure 2 presents the 95% C.L. flux upper limits for the 3FHL and 4LAC-DR2 samples, respectively, for different sky regions and weighting schemes. The green band is the all-flavor diffuse astrophysical neutrino flux derived from the IceCube measurement [4]. For the all-sky samples at , the equal-weighting analysis returns integrated flux limits of 3.12% for 3FHL and 2.83% for 4LAC-DR2; under flux weighting, the corresponding limits are 4.45% and 3.49%. Table 2 lists the complete results for and , as well as for the Northern and Southern hemisphere partitions. Our results further confirm that the Fermi-LAT source populations are subdominant contributors to the diffuse astrophysical neutrino flux.
Table 2.
The 95% C.L. upper limits on the fraction that can be contributed by the tested source populations to the all-sky diffuse neutrino flux. These values represent the percentages of the solid-angle-averaged all-flavor integrated neutrino flux upper limits to the diffuse astrophysical neutrino flux measured by IceCube over 16 TeV–2.6 PeV.
The Southern hemisphere limits are generally weaker than the Northern hemisphere and all-sky limits, except for very hard spectra (e.g., ). This behavior is caused by the substantially higher atmospheric-muon contamination in the IceCube downgoing event sample [28]. To suppress this background, a significantly more stringent event selection is applied to southern data, which necessarily pushes the energy threshold of neutrino detection upward and makes the detector effective area at low energies drop to zero. Even so, the surviving background rate remains higher, while the loss of low-energy statistics further lowers the analysis sensitivity. By contrast, the Northern hemisphere benefits from the Earth acting as a natural filter that blocks atmospheric muons and only admits atmospheric neutrinos. Consequently, the likelihood analysis has less sensitivity in the Southern hemisphere, yielding weaker upper limits for a given source population.
We note that for the southern sky results, the lines for the two weighting schemes overlap. Upon investigation, this is primarily due to the following reasons: (1) the IceCube acceptance varies only moderately across the southern sky; (2) bright and faint sources are distributed relatively evenly in the southern sky; and (3) the number of signal events () corresponding to the 95% upper limit in the southern sky is small, which is insufficient to distinguish different spatial distributions of the signal PDF.
4.3. Improvement Relative to the Spatial-Only Results
We quantify the sensitivity gain from including the energy term by comparing our limits with the spatial-only results presented in Ref. [14]. The comparison is shown in Figure 3. The improvement is especially large for hard spectra. At , the energy term tightens the limits by more than one order of magnitude in the most favorable configurations. This large improvement is physically reasonable: the atmospheric neutrino background dominates below TeV and has a steeply falling spectrum that closely resembles a power law with effective index [28,33]. By providing additional information that distinguishes hard-spectrum signal events from soft-spectrum background events, the energy PDF efficiently downweights the large population of low-energy atmospheric events that would otherwise contribute to the profile likelihood in a spatial-only analysis.
Figure 3.
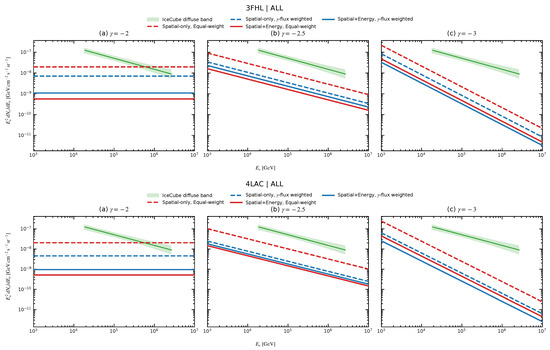
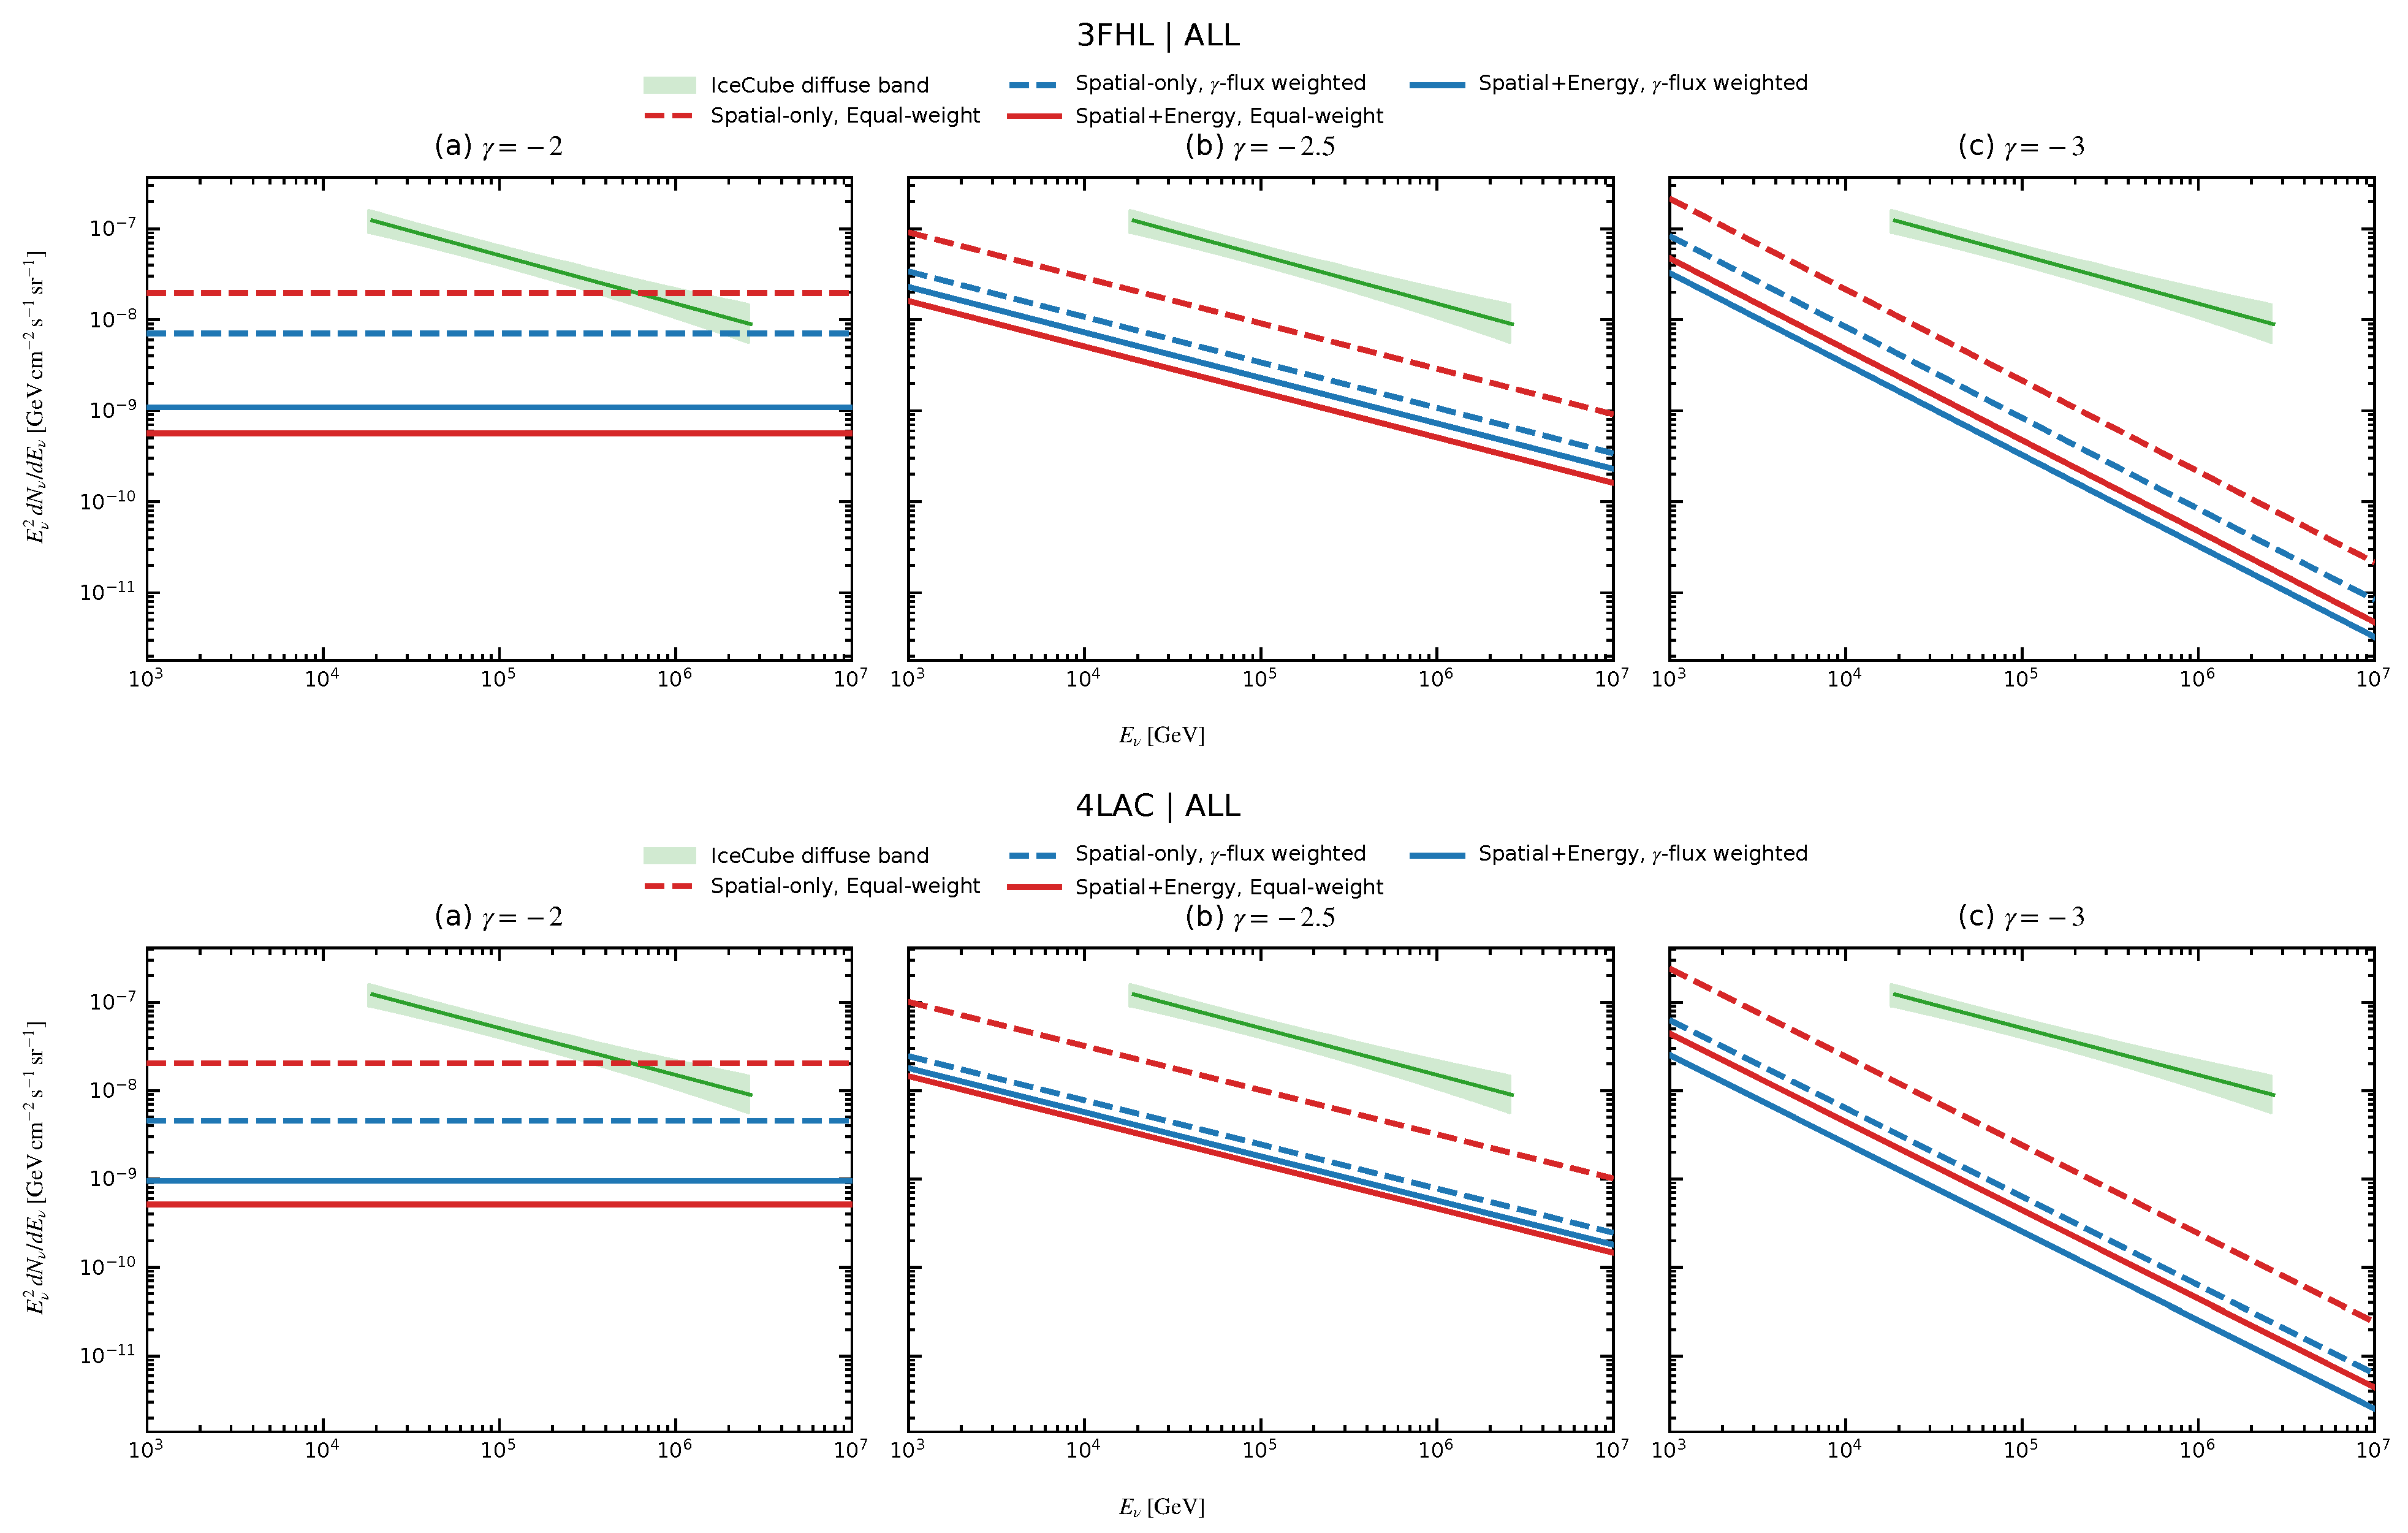
Comparisons between the flux upper limits derived in this work (solid lines) and the ones derived from a spatial-only analysis presented in Ref. [14] (dashed lines). The inclusion of the energy PDF term can effectively improve the previous constraints. The green band represents the all-flavor astrophysical diffuse neutrino flux derived from the IceCube measurement [4].
The improvement under equal weighting is generally larger than under flux weighting. This can be understood as follows: in the spatial-only analysis, flux weighting already provides a considerable degree of signal discrimination against the background because the weighted source distribution is less isotropic. In contrast, for an equal-weighted and approximately isotropic source population, the signal PDF more closely resembles the background, especially when the catalog contains a large number of sources. Consequently, the spatial-only analysis yields intrinsically weaker constraints for equal weighting, leaving more room for the energy information to enhance the sensitivity.
5. Conclusions
In this work, we performed a stacking search for high-energy IceCube neutrinos from the Fermi-LAT 3FHL and 4LAC-DR2 source populations using an unbinned likelihood analysis that incorporates both spatial and energy terms. This work is an update of our previous spatial-only analysis [14]. The main methodological improvements include the inclusion of an energy PDF term in the likelihood and the separate analysis of the Northern and Southern hemispheres. No statistically significant signal is found in any configuration. At the spectral index of , the all-sky equal-weighting analysis constrains the 3FHL and 4LAC-DR2 populations to contribute at most and of the IceCube diffuse astrophysical neutrino flux, respectively; the corresponding -ray–flux-weighted limits are and . Compared to the results of the spatial-only analysis, the inclusion of the energy term effectively improves the previous limits. The improvement from the energy term is not uniform across all configurations. The largest gains are achieved for hard spectra under equal weighting, where the energy PDF efficiently downweights the dominant population of low-energy atmospheric background events. The new analysis improves the hard-spectrum limits (e.g., and ) by more than one order of magnitude in the most favorable configurations.
These limits further reveal that the cataloged 3FHL and 4LAC-DR2 populations are subdominant contributors to the diffuse astrophysical neutrino flux. This conclusion is consistent with previous similar studies [13,14,15,16]. However, it should be noted that the conclusion here does not exclude hadronic emission from unresolved faint sources, transient emitters, or populations with neutrino luminosities weakly correlated with cataloged GeV -ray flux, which remain important targets for future analyses and require dedicated tests beyond the steady GeV-catalog stacking framework adopted in this work. The next major advance in high-energy neutrino astronomy requires larger neutrino statistics and improved angular resolution. Currently under construction and next-generation neutrino observatories such as KM3NeT [45,46], IceCube-Gen2 [47], TRIDENT [48] and HUNT [49,50] will provide critical tests of whether improved sensitivity will reveal previously unseen neutrino sources or instead confirm that cataloged GeV-bright populations remain undetected even with substantially improved exposure.
Author Contributions
Conceptualization, Y.-F.L.; methodology, Y.-F.L.; software, X.-R.O. and S.-H.W.; validation, X.-R.O., M.-X.L. and Y.-F.L.; formal analysis, S.-H.W. and X.-R.O.; investigation, S.-H.W.; data curation, S.-H.W.; writing—original draft preparation, S.-H.W.; writing—review and editing, Y.-F.L.; visualization, S.-H.W.; supervision, M.-X.L. and Y.-F.L.; project administration, Y.-F.L.; funding acquisition, Y.-F.L. All authors have read and agreed to the published version of the manuscript.
Funding
This work is supported by the special funding for Guangxi Bagui Youth Scholars.
Data Availability Statement
The IceCube 10-year public data used in this analysis are publicly available at the IceCube Data Archive (https://icecube.wisc.edu/science/data, accessed on 18 June 2026) and are described in detail in Ref. [28]. The Fermi source catalogs used in this paper are available from the Fermi Science Support Center (https://fermi.gsfc.nasa.gov/ssc/data/, accessed on 18 June 2026). The processed data presented in the figures and tables of this paper are available upon reasonable request.
Acknowledgments
We thank Rong-Lan Li and Shi-Qi Yu for the helpful discussions. We thank the IceCube Collaboration for making their 10-year muon-track data publicly available.
Conflicts of Interest
The authors declare no conflicts of interest.
References
- Aartsen, M.G. et al. [IceCube Collaboration] First observation of pev-energy neutrinos with icecube. Phys. Rev. Lett. 2013, 111, 021103. [Google Scholar] [CrossRef] [Scilit] [PubMed]
- Aartsen, M.G. et al. [IceCube Collaboration] Observation of high-energy astrophysical neutrinos in three years of icecube data. Phys. Rev. Lett. 2014, 113, 101101. [Google Scholar] [CrossRef] [Scilit] [PubMed]
- Aartsen, M.G. et al. [IceCube Collaboration] Evidence for astrophysical muon neutrinos from the northern sky with icecube. Phys. Rev. Lett. 2015, 115, 081102. [Google Scholar] [CrossRef] [Scilit] [PubMed]
- Abbasi, R. et al. [IceCube Collaboration] Improved characterization of the astrophysical muon-neutrino flux with 9.5 years of icecube data. Astrophys. J. 2022, 928, 50. [Google Scholar] [CrossRef] [Scilit]
- IceCube; Fermi-LAT; MAGIC; AGILE; ASAS-SN; HAWC; H.E.S.S; INTEGRAL; Kanata; Kiso; et al. Multimessenger observations of a flaring blazar coincident with high-energy neutrino IceCube-170922a. Science 2018, 361, eaat1378. [Google Scholar] [CrossRef] [Scilit] [PubMed]
- IceCube Collaboration. Neutrino emission from the direction of the blazar TXS 0506+056 prior to IceCube-170922a. Science 2018, 361, 147–151. [Google Scholar] [CrossRef] [Scilit] [PubMed]
- Aartsen, M.G. et al. [IceCube Collaboration] Time-Integrated Neutrino Source Searches with 10 Years of IceCube Data. Phys. Rev. Lett. 2020, 124, 051103. [Google Scholar] [CrossRef] [Scilit] [PubMed]
- Abbasi, R. et al. [IceCube Collaboration] Evidence for neutrino emission from the nearby active galaxy NGC 1068. Science 2022, 378, 538–543. [Google Scholar] [CrossRef] [Scilit] [PubMed]
- Kelner, S.R.; Aharonian, F.A.; Bugayov, V.V. Energy spectra of gamma-rays, electrons, and neutrinos produced at proton-proton interactions in the very high energy regime. Phys. Rev. D 2006, 74, 034018. [Google Scholar] [CrossRef] [Scilit]
- Kelner, S.R.; Aharonian, F.A. Energy spectra of gamma-rays, electrons and neutrinos produced at interactions of relativistic protons with low energy radiation. Phys. Rev. D 2008, 78, 034013. [Google Scholar] [CrossRef] [Scilit]
- Murase, K.; Guetta, D.; Ahlers, M. Hidden cosmic-ray accelerators as an origin of TeV–PeV cosmic neutrinos. Phys. Rev. Lett. 2016, 116, 071101. [Google Scholar] [CrossRef] [Scilit] [PubMed]
- Murase, K.; Kimura, S.S.; Mészáros, P. Hidden cores of active galactic nuclei as the origin of medium-energy neutrinos: Critical tests with the mev gamma-ray connection. Phys. Rev. Lett. 2020, 125, 011101. [Google Scholar] [CrossRef] [Scilit] [PubMed]
- Aartsen, M.G. et al. [IceCube Collaboration] The contribution of Fermi-2lac blazars to diffuse tev–pev neutrino flux. Astrophys. J. 2017, 835, 45. [Google Scholar] [CrossRef] [Scilit]
- Li, R.-L.; Zhu, B.-Y.; Liang, Y.-F. Investigating the correlations between IceCube high-energy neutrinos and Fermi-lat gamma-ray observations. Phys. Rev. D 2022, 106, 083024. [Google Scholar] [CrossRef] [Scilit]
- Hooper, D.; Linden, T.; Vieregg, A. Active Galactic Nuclei and the Origin of IceCube’s Diffuse Neutrino Flux. J. Cosmol. Astropart. Phys. 2019, 2, 012. [Google Scholar] [CrossRef] [Scilit]
- Smith, D.; Hooper, D.; Vieregg, A. Revisiting AGN as the source of IceCube’s diffuse neutrino flux. J. Cosmol. Astropart. Phys. 2021, 3, 031. [Google Scholar] [CrossRef] [Scilit]
- Yuan, C.; Murase, K.; Mészáros, P. Complementarity of stacking and multiplet constraints on the blazar contribution to the cumulative high-energy neutrino intensity. Astrophys. J. 2020, 890, 25. [Google Scholar] [CrossRef] [Scilit]
- Zhou, B.; Kamionkowski, M.; Liang, Y.-F. Search for High-Energy Neutrino Emission from Radio-Bright AGN. Phys. Rev. D 2021, 103, 123018. [Google Scholar] [CrossRef] [Scilit]
- Lu, M.-X.; Liang, Y.-F.; Ouyang, X.; Li, R.-L.; Wang, X.-G. Investigating the correlations between IceCube high-energy neutrinos and Fermi-LAT γ-ray observations. II. Phys. Rev. D 2025, 112, 103013. [Google Scholar] [CrossRef] [Scilit]
- Abbasi, R.; Ackermann, M.; Adams, J.; Agarwalla, S.K.; Aguilar, J.A.; Ahlers, M.; Alameddine, J.M.; Amin, N.M.; Andeen, K.; Argüelles, C.; et al. A Search for Millimeter-bright Blazars as Astrophysical Neutrino Sources. Astrophys. J. 2026, 999, 98. [Google Scholar] [CrossRef] [Scilit]
- Buson, S.; Tramacere, A.; Pfeiffer, L.; Oswald, L.; de Menezes, R.; Azzollini, A.; Ajello, M. Beginning a journey across the universe: The discovery of extragalactic neutrino factories. Astrophys. J. Lett. 2022, 933, L43. [Google Scholar] [CrossRef] [Scilit]
- Plavin, A.V.; Kovalev, Y.Y.; Kovalev, Y.A.; Troitsky, S.V. Observational evidence for the origin of high-energy neutrinos in parsec-scale nuclei of radio-bright active galaxies. Astrophys. J. 2020, 894, 101. [Google Scholar] [CrossRef] [Scilit]
- Plavin, A.V.; Kovalev, Y.Y.; Kovalev, Y.A.; Troitsky, S.V. Directional association of TeV to PeV astrophysical neutrinos with radio blazars. Astrophys. J. 2021, 908, 157. [Google Scholar] [CrossRef] [Scilit]
- Giommi, P.; Glauch, T.; Padovani, P.; Resconi, E.; Turcati, A.; Chang, Y.L. Dissecting the regions around IceCube high-energy neutrinos: Growing evidence for the blazar connection. Mon. Not. R. Astron. Soc. 2020, 497, 865–878. [Google Scholar] [CrossRef] [Scilit]
- Abbasi, R. et al. [IceCube Collaboration] A Search for Time-dependent Astrophysical Neutrino Emission with IceCube Data from 2012 to 2017. Astrophys. J. 2021, 911, 67. [Google Scholar] [CrossRef] [Scilit]
- Kouch, P.M.; Lindfors, E.; Hovatta, T.; Liodakis, I.; Koljonen, K.I.I.; Nilsson, K.; Kiehlmann, S.; Max-Moerbeck, W.; Readhead, A.C.S.; Reeves, R.A.; et al. Association of the IceCube neutrinos with blazars in the CGRaBS sample. Astron. Astrophys. 2024, 690, A111. [Google Scholar] [CrossRef] [Scilit]
- Kouch, P.M.; Hovatta, T.; Lindfors, E.; Liodakis, I.; Koljonen, K.I.I.; Paggi, A. Association of the IceCube neutrinos with CAZ blazar light curves. Astron. Astrophys. 2025, 708, A383. [Google Scholar] [CrossRef] [Scilit]
- Abbasi, R. et al. [IceCube Collaboration] IceCube Data for Neutrino Point-Source Searches Years 2008–2018. arXiv 2021, arXiv:2101.09836. [Google Scholar] [CrossRef]
- Fermi-LAT Collaboration. 3FHL: The third catalog of hard Fermi-lat sources. Astrophys. J. Suppl. Ser. 2017, 232, 18. [Google Scholar] [CrossRef] [Scilit]
- Ajello, M. et al. [Fermi-LAT Collaboration] The Fourth Catalog of Active Galactic Nuclei Detected by the Fermi Large Area Telescope. Astrophys. J. 2020, 892, 105. [Google Scholar] [CrossRef] [Scilit]
- Lott, B.; Gasparrini, D.; Ciprini, S. The fourth catalog of active galactic nuclei detected by the Fermi large area telescope data release 2. arXiv 2020, arXiv:2010.08406. [Google Scholar]
- Abdollahi, S. et al. [Fermi-LAT Collaboration] Fermi Large Area Telescope Fourth Source Catalog. Astrophys. J. Suppl. 2020, 247, 33. [Google Scholar] [CrossRef] [Scilit]
- Aartsen, M.G.; Ackermann, M.; Adams, J.; Aguilar, J.A.; Ahlers, M.; Ahrens, M.; Samarai, I.A.; Altmann, D.; Andeen, K.; Anderson, T.; et al. Measurement of the νμ energy spectrum with IceCube-79. Eur. Phys. J. C 2017, 77, 692. [Google Scholar] [CrossRef] [Scilit] [PubMed]
- Braun, J.; Dumm, J.; Palma, F.D.; Finley, C.; Karle, A.; Montaruli, T. Methods for point source analysis in high energy neutrino telescopes. Astropart. Phys. 2008, 29, 299–305. [Google Scholar] [CrossRef] [Scilit]
- Aartsen, M.G. et al. [IceCube Collaboration] All-sky search for time-integrated neutrino emission from astrophysical sources with 7 years of IceCube data. Astrophys. J. 2017, 835, 151. [Google Scholar]
- IceCube Collaboration. SkyLLH Documentation. Available online: https://icecube.github.io/skyllh/master/html/index.html (accessed on 18 June 2026).
- Wilks, S.S. The large-sample distribution of the likelihood ratio for testing composite hypotheses. Ann. Math. Stat. 1938, 9, 60–62. [Google Scholar] [CrossRef] [Scilit]
- Abbasi, R. et al. [IceCube Collaboration] Time-integrated searches for point-like sources of neutrinos with the 40-string icecube detector. Astrophys. J. 2011, 732, 18. [Google Scholar] [CrossRef] [Scilit]
- Aartsen, M.G. et al. [IceCube Collaboration] Search for time-independent neutrino emission from astrophysical sources with 3 yr of icecube data. Astrophys. J. 2013, 779, 132. [Google Scholar] [CrossRef] [Scilit]
- Aartsen, M.G. et al. [IceCube Collaboration] Search for steady point-like sources in the astrophysical muon neutrino flux with 8 years of IceCube data. Eur. Phys. J. C 2019, 79, 234. [Google Scholar] [CrossRef] [Scilit]
- Abbasi, R.; Ackermann, M.; Adams, J.; Agarwalla, S.K.; Aguilar, J.A.; Ahlers, M.; Alameddine, J.M.; Amin, N.M.; Andeen, K.; Argüelles, C.; et al. Time-integrated Southern-sky Neutrino Source Searches with 10 yr of IceCube Starting-track Events at Energies Down to 1 TeV. Astrophys. J. 2026, 998, 37. [Google Scholar] [CrossRef] [Scilit]
- Abbasi, R. et al. [IceCube Collaboration] Search for Multi-flare Neutrino Emissions in 10 yr of IceCube Data from a Catalog of Sources. Astrophys. J. Lett. 2021, 920, L45. [Google Scholar] [CrossRef] [Scilit]
- Abbasi, R. et al. [IceCube Collaboration] IceCube Search for Neutrino Emission from X-Ray Bright Seyfert Galaxies. Astrophys. J. 2025, 988, 141. [Google Scholar] [CrossRef] [Scilit]
- Neronov, A.; Savchenko, D.; Semikoz, D.V. Neutrino signal from a population of seyfert galaxies. Phys. Rev. Lett. 2024, 132, 101002. [Google Scholar] [CrossRef] [Scilit] [PubMed]
- Adrián-Martínez, S.; Ageron, M.; Aharonian, F.; Aiello, S.; Albert, A.; Ameli, F.; Anassontzis, E.; Andre, M.; Androulakis, G.; Anghinolfi, M.; et al. Letter of intent for KM3NeT 2.0. J. Phys. G 2016, 43, 084001. [Google Scholar] [CrossRef] [Scilit]
- The KM3NeT Collaboration. Observation of an ultra-high-energy cosmic neutrino with KM3NeT. Nature 2025, 638, 376–382. [Google Scholar] [CrossRef] [Scilit] [PubMed]
- Aartsen, M.G. et al. [IceCube-Gen2 Collaboration] IceCube-gen2: The window to the extreme universe. J. Phys. G 2021, 48, 060501. [Google Scholar] [CrossRef] [Scilit]
- Ye, Z.P.; Hu, F.; Tian, W.; Chang, Q.C.; Chang, Y.L.; Cheng, Z.S.; Gao, J.; Ge, T.; Gong, G.H.; Guo, J.; et al. A multi-cubic-kilometre neutrino telescope in the western Pacific Ocean. Nat. Astron. 2023, 7, 1497–1505. [Google Scholar] [CrossRef] [Scilit]
- Chen, M. et al. [HUNT Collaboration] HUNT: An ultra-large-scale neutrino astronomy telescope. Nucl. Instrum. Methods Phys. Res. A 2026, 1086, 171374. [Google Scholar] [CrossRef] [Scilit]
- Liu, C. et al. [HUNT Collaboration] Analysis of attitude sensors in the prototype string of HUNT project. Proc. Sci. 2025, 501, 1101. [Google Scholar] [CrossRef] [Scilit]

Disclaimer/Publisher’s Note: The statements, opinions and data contained in all publications are solely those of the individual author(s) and contributor(s) and not of MDPI and/or the editor(s). MDPI and/or the editor(s) disclaim responsibility for any injury to people or property resulting from any ideas, methods, instructions or products referred to in the content. |
© 2026 by the authors. Licensee MDPI, Basel, Switzerland. This article is an open access article distributed under the terms and conditions of the Creative Commons Attribution (CC BY) license.