


Abstract
This study presents the relationship between the typical parameters of the solar energetic protons (SEPs) and their solar origin—solar flares (SFs) and coronal mass ejections (CMEs) in solar cycles (SCs) 23 and 24 (1996–2019). In this study, the calculated onset-to-peak SEP and reported SF fluences are preferred over the peak SEP intensity and SF class, respectively. The energy dependence of the proton fluence is quantitatively assessed in terms of correlation analyses (Pearson and partial) with the parameters of the solar origin, i.e., SF fluence, CME speed and angular width. The energy trends of the results are investigated as a function of the SC (SC23 vs. SC24), helio-longitude (Eastern vs. Western), SEP magnitude (high vs. low) and SEP profile type (fast vs. slow-rising). The possible applications to space weather research are discussed.
1. Introduction
The conventional definition for solar energetic particles (SEPs) is an assembly of electrons, protons and heavy ions, accelerated by solar activity processes from keV to the MeV energies [1]. A long-standing body of research on the SEP topic is already available—see, e.g., recent reviews on observations [2], modeling and forecasting [3]. A number of comprehensive archives are also freely available, considering mostly energetic protons from a number of near-Earth detectors, e.g., GOES: https://www.ngdc.noaa.gov/stp/satellite/goes/doc/SPE.txt, https://umbra.nascom.nasa.gov/SEP/, http://sepem.eu/help/event_ref.html (accessed on 16 June 2026); Wind: ref. [4]; https://sepserver.eu/index.php (accessed on 16 June 2026). To date, electron event lists are rare, see e.g., https://www.nriag.sci.eg/ace_electron_catalog/ [5] (accessed on 16 June 2026), based on data from the from the ACE mission [6]. With the launch of the twin STEREO satellites [7], particle data from multiple instruments was simultaneously collected and the analyzed cases cover a time span of more than one solar cycle (SC) (2006–2023) [8].
Nowadays, with the progress of SC25 (since 2020) https://sidc.be/SILSO/dayssnplot (accessed on 16 June 2026), the research focus is shifting exclusively towards multi-instrument observations, e.g., ref. [9] and the resulting catalog, https://data.serpentine-h2020.eu/catalogs/sep-sc25/ (accessed on 16 June 2026). This is mainly facilitated by the new fleet of solar-dedicated missions with close approach (Parker Solar Plus (PSP) [10], Solar Orbiter (SolO) [11]) together with other spacecraft, either in the inner-heliosphere, e.g., BepiColombo [12], or en route and around Mars. Together with the close range observations of the Sun and solar activity, a number of spacecraft is still operational close to Earth (e.g., Solar Dynamics Observatory (SDO) https://science.nasa.gov/mission/sdo/, accessed on 16 June 2026), L1 (e.g., SOHO [13]) and 1 AU (e.g., only STEREO Ahead, after 2014, https://stereo-ssc.nascom.nasa.gov/, accessed on 16 June 2026).
Although the debate on the particle acceleration was scrutinized by a number of works, to date, there is no definitive separation between the individual contribution of solar flares (SFs: a complex process of magnetic field reconfiguration in the corona resulting in particle acceleration, emissions and mass motions [14]) and coronal mass ejections (CMEs: a large volume of magnetized plasma expelled from the corona [15,16,17]) to the particle flux [18]. An oversimplified, bi-modal classification is often mentioned in the literature, where SEPs are separated into ‘impulsive’ and ‘gradual’ types based on their intrinsic characteristics and postulated solar driver [19]. Specifically, the impulsive SEPs are regarded as SF-generated, based on, e.g., their fast-rising profile, compact longitudinal distribution of their source, high ionization states and being 3He-rich. The gradual-SEPs are expected to be CME-driven due to their contrasting properties to the impulsive ones, longer overall duration and plateau-like profile. Nevertheless, a number of follow-up revisions were also proposed, e.g., [20] and the discussion therein. This is why such ad hoc assumptions based on the SEP-driver will not be followed here, due to numerous observational and statistical deviations from the rule, e.g., ref. [21,22,23]. Namely, in this study we will explore both SFs and CMEs as probable particle accelerators, where the associations between the SEPs and the driver are based only on timing and location constrains.
In contrast to the multi-point approach, this study contributes to the L1 perspective of the SEP topic. We use SOHO/ERNE measurements https://srl.utu.fi/erne_data/ (accessed on 16 June 2026), thus building upon on a proton catalog we previously compiled https://catalogs.astro.bas.bg/ (accessed on 16 June 2026), described in [24], denoted as ‘Paper I’ henceforth.
Furthermore, contrary to the majority of the previous particle catalogs, our proton list covers an extended energy range (14–131 MeV) split into 10 energy channels. In such a way, the energy distribution of the correlations between SEPs and the solar phenomena can be explored. Previous works (in SC23) indicated a CME influence at low proton energies and preferable SF influence at the high-energy proton limit [25]. The later results could not be entirely confirmed within Paper I covering SC23 and SC24. With this work, we redo the statistical analyses, but using instead the integrated values for the proton and solar flare intensities.
The integrated fluxes (known as ‘fluences’) are an important parameter used to designate the severity of a given phenomenon (as a combination of intensity and duration). Nevertheless, the calculation of proton fluences (i.e., integrated intensity) is still largely omitted from many SEP catalogs. Thus, the usage of fluences can serve as an important leverage for the development of a new catalog. Furthermore, we calculated the dependencies (trends) between the SEPs and their solar origin not only as a function of the proton energy, but also exploring the effects of the SC, helio-location of the parent SF/CME, proton flux magnitude and profile shape.
In addition, the SEP parameters provided in catalogs can also be used for re-analysis of historical events. This is because the technological risks on the space-borne devices due to elevated fluxes of the energetic particles have long been identified, e.g., [26,27]. The SEP (episodic, in-phase with the SC) and galactic cosmic ray (constant, modulated out-of-phase with the SC) components also pose a radiation exposure hazard, ranging from low levels during the air traffic operations [28,29] to extreme risks during future human space flights [30,31,32]. Nowadays, the causal link between solar activity events and the response by the terrestrial environment, technology, human health are described with the generic term ’space weather’ (SW) [33,34,35] with recognized socio-economic risks [36,37] and negative effects to satellites [38,39,40]. Thus, tabulated parameters of SW drivers are useful side-products of large statistical studies.
In summary, this study offers a comprehensive statistical analysis, from a single point-of view, on the multi-energy trends of the (onset-to-peak) fluence of the proton events and the SF and CME parameters. In particular, we focus on the SF integrated flux instead of its peak value. Apart from the SEP energy and SC dependences, we explored the influence of the SEP location, magnitude and profile on the Pearson-type correlations (e.g., zero, first and second order). Namely, within the assumption of linear dependencies, we explore the results while removing inter-correlations between some of the parameters. The utilized data and methodology are explained in Section 2, whereas the results are structured in Section 3 according to the various dependencies under consideration. The results are discussed in view of previous findings in Section 4 and the study concludes with a short summary in Section 5.
2. Data and Methodology
2.1. Solar Energetic Protons
The procedure for the compilation of SOHO/ERNE catalog together with the association of their solar origin was recently described in Paper I [24]. For the current study SEP data is taken from high-energy detector (HED) https://export.srl.utu.fi/ (accessed on 16 June 2026). We performed the calculation of the onset-to-peak fluences by integration of the time profiles of the SEP amplitude (or flux) based on daily plots. The onset and peak times are calculated based on the respective pre-event and peak-time intervals selected by an observer. An earlier version of the analysis can be found in [41]. In addition to the latter, in this study the fluence of long-duration events is re-evaluated considering a maximum duration of two days. Thus, only a lower limit for the proton fluence can be estimated for such cases. For this study we use fluences in all 10 HED energy channels denoted as to , (cm2 sr MeV)−1, distributed over the energy ranges (where mean values are given in parenthesis) as listed below:
- HED01: 14–17 (15.5) MeV;
- HED02: 17–22 (19.5) MeV;
- HED03: 21–28 (24.5) MeV;
- HED04: 26–32 (29.0) MeV;
- HED05: 32–40 (36.0) MeV;
- HED06: 40–51 (45.5) MeV;
- HED07: 51–67 (59.0) MeV;
- HED08: 64–80 (72.0) MeV;
- HED09: 80–101 (90.5) MeV;
- HED10: 101–131 (116) MeV.
The study starts with a list of 664 proton events in total. Their fluences will be made publicly available via https://catalogs.astro.bas.bg/ (accessed on 16 June 2026).
2.2. Solar Eruptive Phenomena
The solar origin of the proton events are adopted from Paper I, while using the following catalogs, which are widely used in solar physics and SW research:
- SFs: ftp://ftp.swpc.noaa.gov/pub/warehouse/, https://solarmonitor.org/ and https://www.ncei.noaa.gov/data/goes-space-environment-monitor/access/avg/ (accessed on 16 June 2026);
- CMEs: https://cdaw.gsfc.nasa.gov/CME_list/ [42] (accessed on 16 June 2026).
In this study, for the SFs we use: the (reported and corrected) GOES soft X-ray (SXR) flux in Wm−2 of the SFs, commonly regarded as SF class, https://solar-center.stanford.edu/sid/activities/flare.html (accessed on 16 June 2026); SF fluence [43] in Jm−2; onset and peak timings; and helio-longitude. For the CMEs we use: the time of first appearance of the CME front above the oculting disk; (linear/projected on the plane of the sky) speed in kms−1; and angular width (AW) in degrees The latter parameters are calculated from white-light images, in this case when viewed from Earth. When the CME completely encircles the solar disk, the AW is 360 degrees and the CME is denoted as halo. The solar origin parameters used in the correlation analyses are SF fluence, CME speed and AW. The inter-correlation between the reported and re-calculated values for the SF class, on one side, and the SF fluence, on another, are discussed in Appendix A.
Below we summarize the calculated by us mean/median values of the proton-associated SF and CME parameters in the three time periods of interest:
- SF class (reported): M1.9/M1.6 (SC23); M1.5/M1.5 (SC24); M1.8/M1.6 (SC23+24);
- SF class (corrected): M2.2/M2.2 in all cases;
- SF fluence ×: 2810/426.7 (SC23); 1815.3/463.2 (SC24); 2516.8/462.7 (SC23+24);
- CME projected speed: 1026/899 (SC23); 984/902 (SC24); 1012/899 (SC23+24);
- CME AW: 217/182 (SC23); 272/360 (SC24); 236/245 (SC23+24).
3. Results
3.1. SEP Fluence Properties
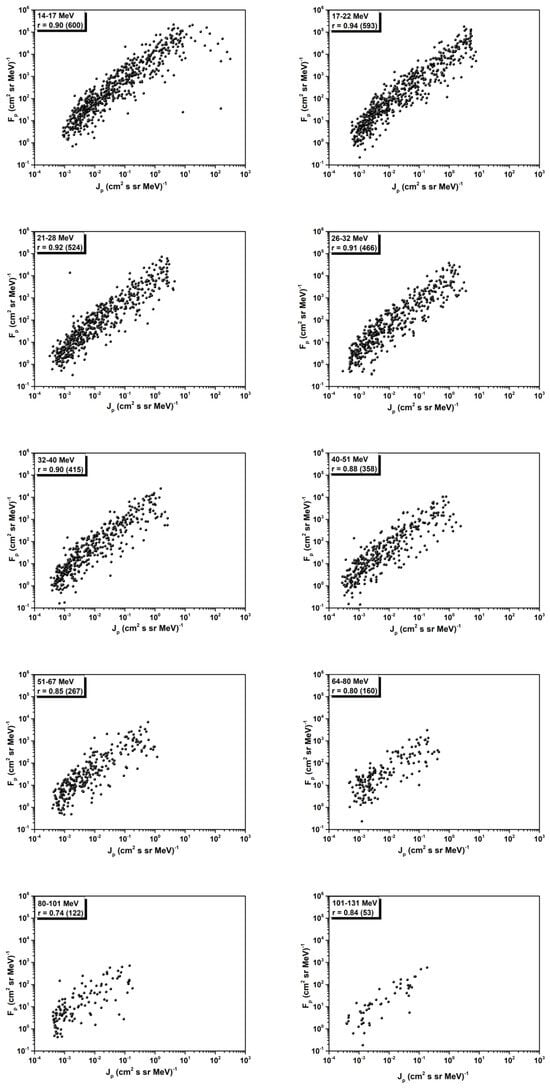
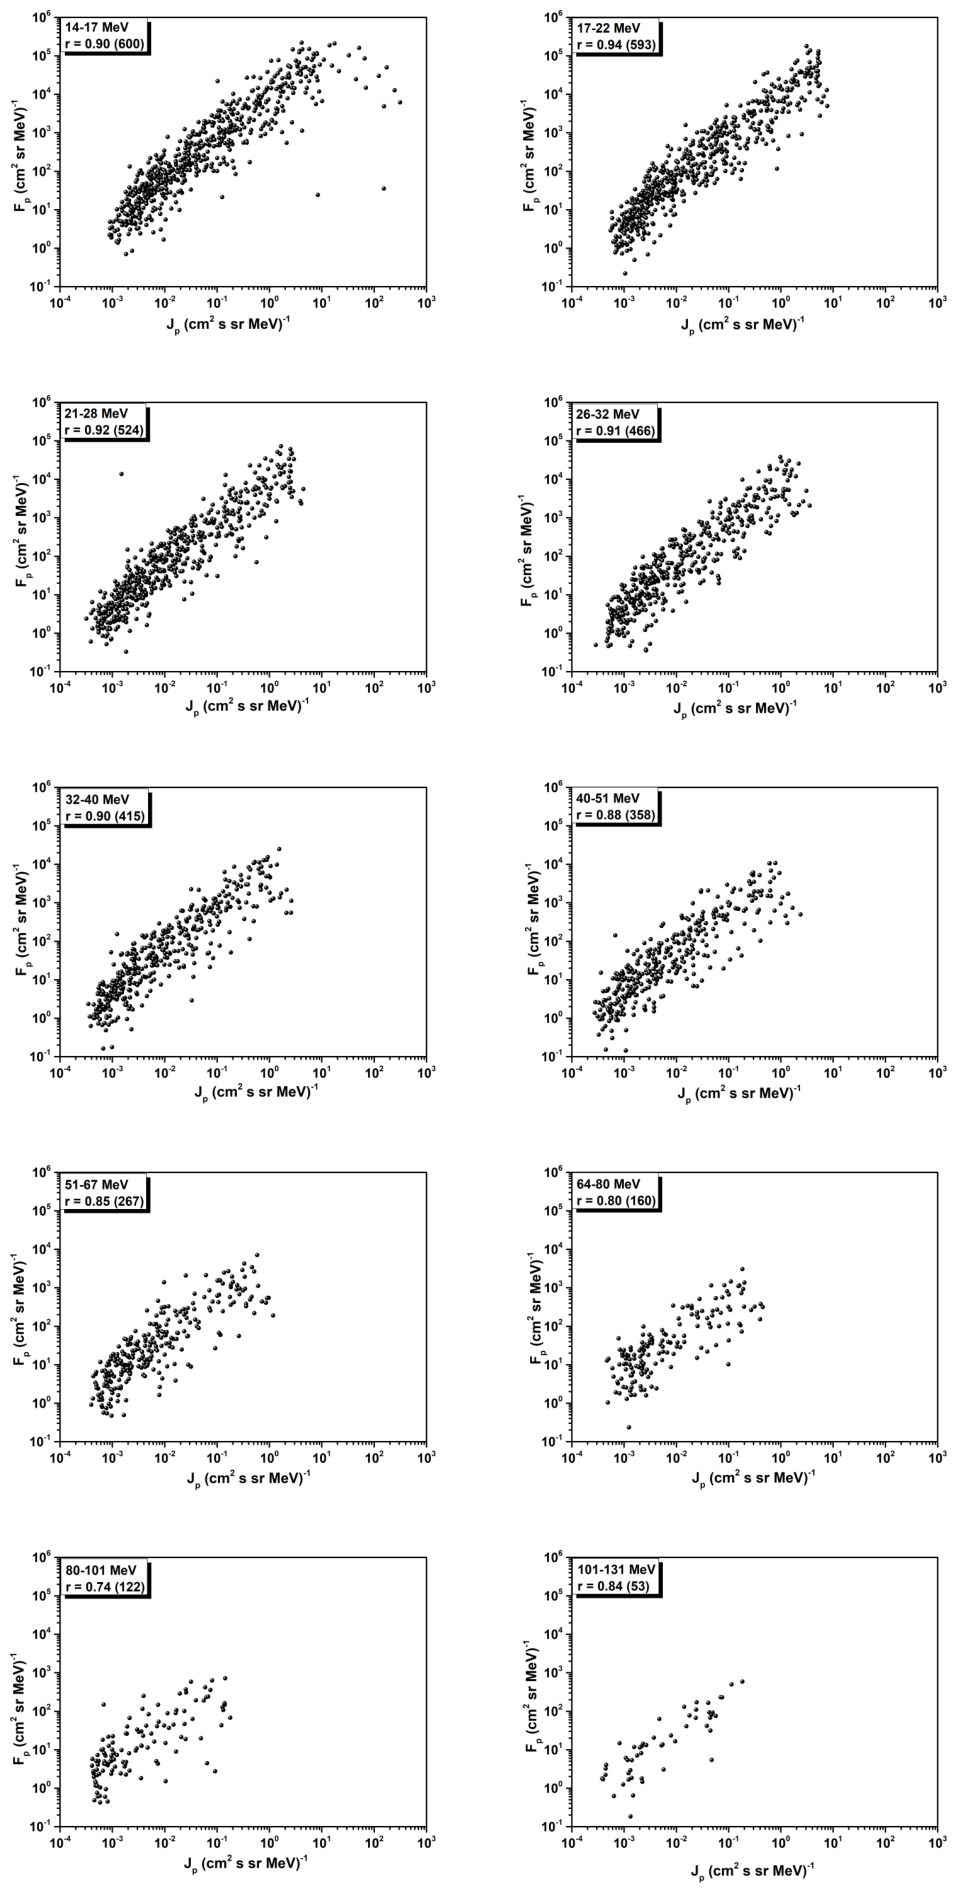
Firstly, the calculated proton fluence () is cross-checked with its peak intensity (, in (cm2 s sr MeV)−1) for consistency. Namely we plotted the fluence–intensity pairs as log10-log10 scatter plots, see Figure 1 for the event sample in SC23+24 in each energy channel.
Figure 1.
Scatter plots between the peak proton intensity and the onset-to-peak proton fluence for a given energy channel.
The scatter is small in all channels, with occasional outliers at HED01. The Pearson correlation coefficients range from slightly over 0.9 (at low energies with 1–2% uncertainty) to around 0.8 (at higher energies, where the errors are within 5%), namely:
- HED01: (600);
- HED02: (593);
- HED03: (523);
- HED04: (466);
- HED05: (414);
- HED06: (358);
- HED07: (267);
- HED08: (160);
- HED09: (121);
- HED10: (53).
The Pearson correlations are reported together with their uncertainty range (calculated based on bootstrapping method [44]), whereas the number of events is given in parenthesis. This presentation will be followed throughout the paper.
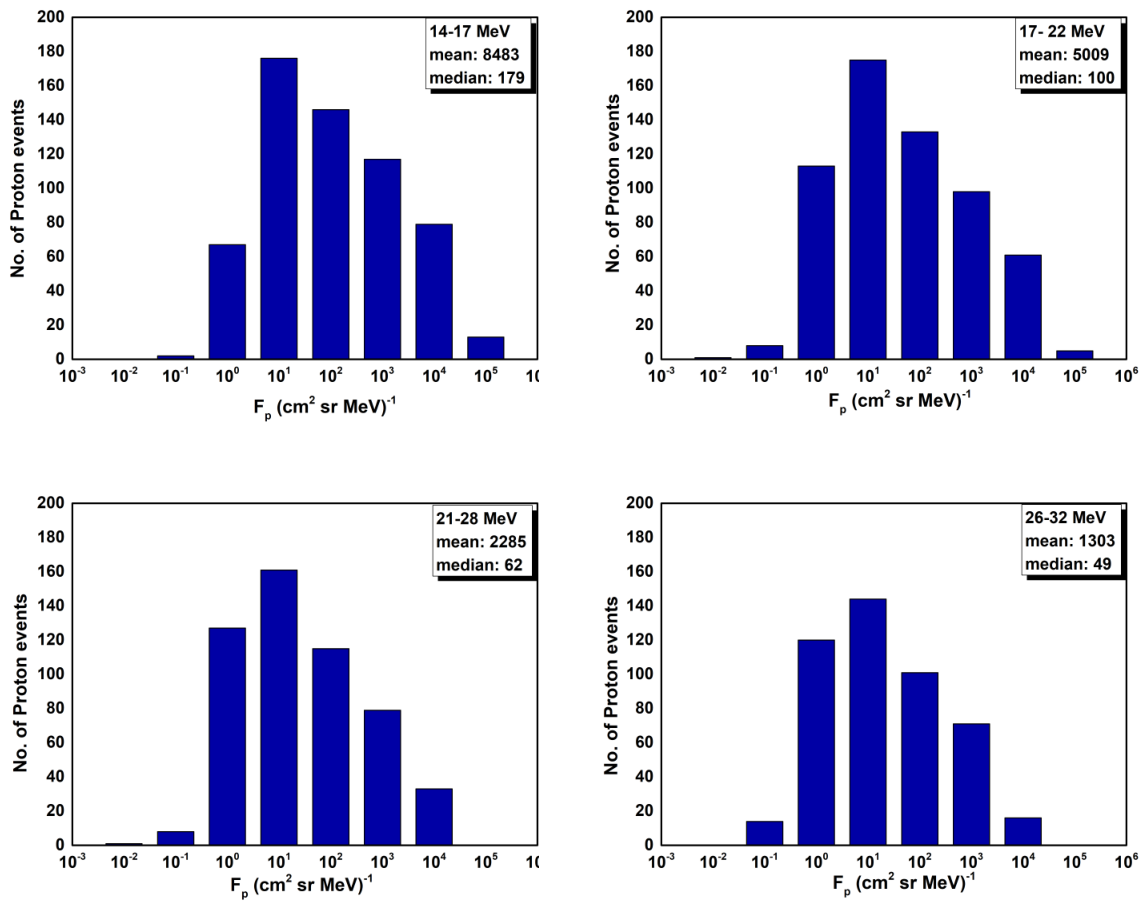
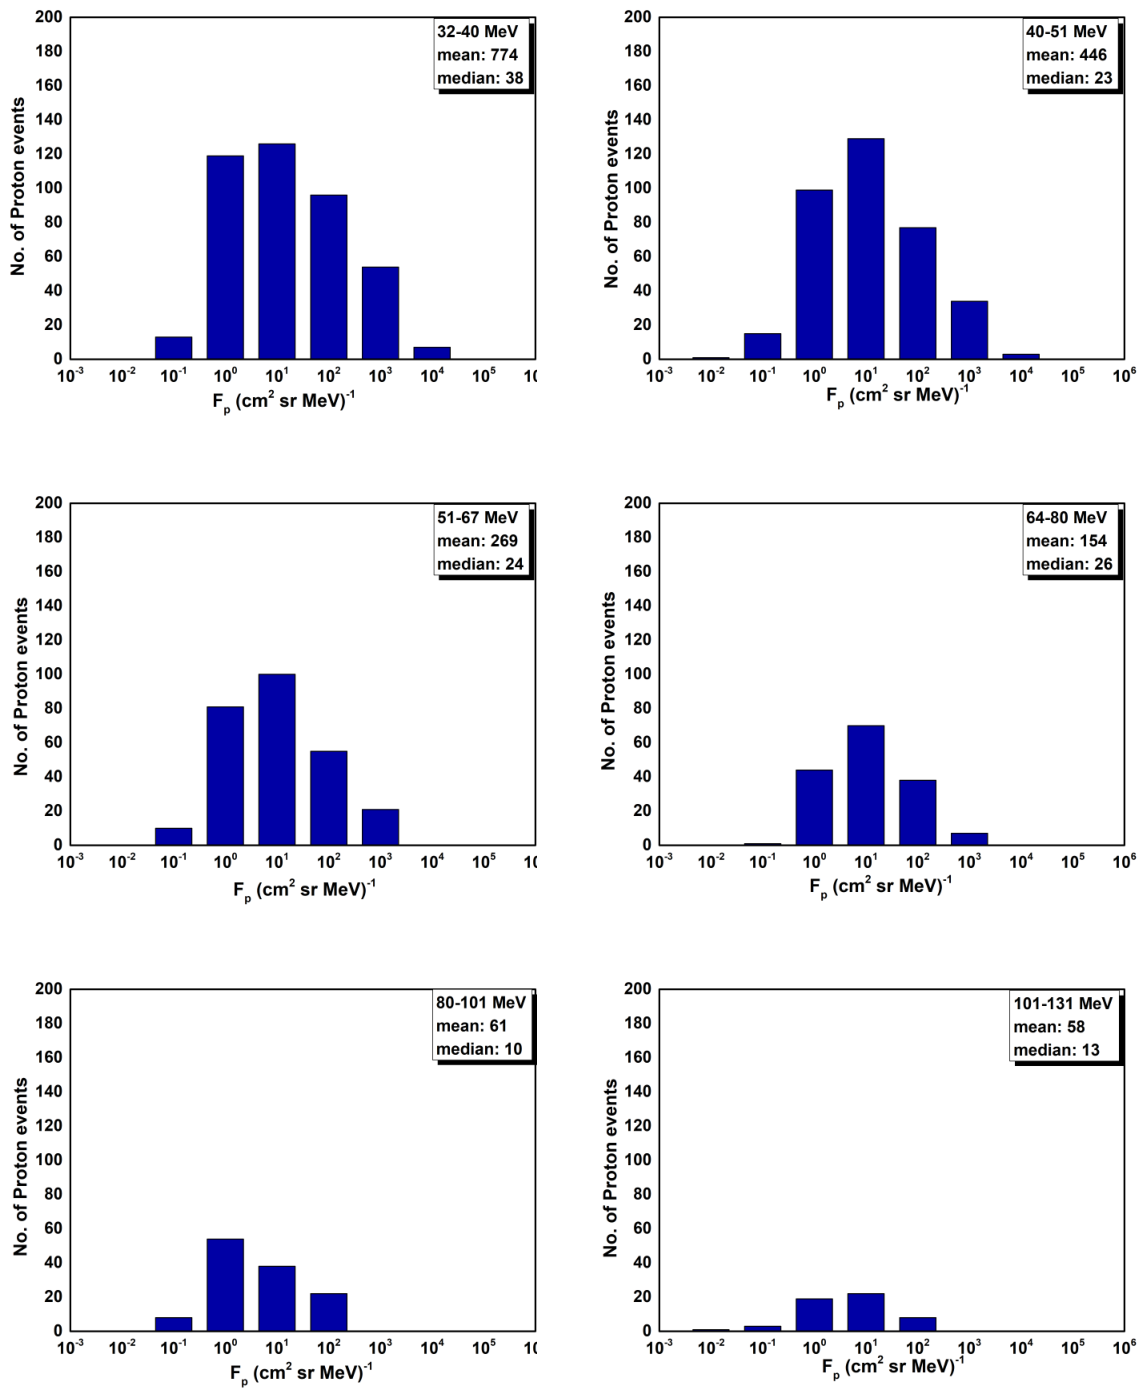
Similarly to proton intensity histograms (Paper I), for completeness, we show in Appendix B the distributions for the proton fluence, Figure A2. The shapes of the distributions are consistent.
3.2. SEP Fluence Correlations with the Solar Origin
The quantitative evaluation on the contribution of SF vs. CME acceleration to the proton fluence is done with the aid of correlation coefficients. We calculated the following correlations of the log10 values of the proton fluence with the SXR fluence (), on one side, and CME speed ()/CME AW, on another:
- Zero-order (Pearson) correlations;
- First-order partial correlations (between x and y after removing the effect of one control parameter, e.g., z): as ;
- Second-order partial correlations (between a and b after removing the effect of two control parameters, e.g., c and d): .
As the partial correlations are based on multiple Pearson ones, the calculation of an error range is not unique but consists of several values. This is why no uncertainty range is given for the partial correlations. Moreover, they will be used as a confirmation of the overall energy trend given by the Pearson correlation coefficients.
3.2.1. Solar Cycle Dependence
Considering the entire proton sample, the SC distribution (of the peak proton intensities) is in fact provided in Paper I. Even considering the onset-to-peak proton fluences, we obtain consistent results for the fraction of the protons in SC23 vs. SC24 compared to the entire sample size, namely:
- HED01: 65 vs. 35% (601);
- HED02: 64 vs. 36% (594);
- HED03: 66 vs. 34% (523);
- HED04: 63 vs. 37% (466);
- HED05: 66 vs. 34% (415);
- HED06: 64 vs. 36% (358);
- HED07: 67 vs. 33% (267);
- HED08: 71 vs. 29% (160);
- HED09: 72 vs. 28% (122);
- HED10: 70 vs. 30% (53).
where the entire event sample in the given HED is given in parenthesis. The protons during SC23 are nearly twice as numerous, compared to their occurrence in SC24, which is more pronounced at the high energy limit. Furthermore, due to a data gap in 2001 and occasional issues during integration, the event number while considering the fluences is less than the event number reflected by proton intensity.
The next phase of the analysis is the calculation of the correlation coefficients between and , shown in Table 1. There, each set is starting with the Pearson () and continuing with the first-order partial (, excluding the CME speed) and second-order partial correlation coefficient (, excluding both the CME speed and CME AW). Each case is calculated for all 10 HED channels, if the number of the pairs is at least larger than 10. With the increase in the proton energy, the event size decreased and the uncertainty increases. Finally, the results are organized for SC23 (second), SC24 (third) and SC23+24 (last column).
Table 1.
Correlation coefficients in SC23, SC24 and SC23+24 between the proton fluence () with the SF fluence (), for the Pearson () and the partial (first, and second-order, ) correlations excluding the effects of the CMEs ( and/or ). The event size is given in parentheses.
Similarly, the results between the SEP fluence and the CME speed are listed in Table 2, for the Pearson (), first-order partial (, excluding the SF fluence) and second-order partial (, excluding both the SF fluence and the CME AW) correlation coefficients. In addition to the table form, the results are also visualized, by selecting two different sets of correlation coefficients.
Table 2.
Correlation coefficients in SC23, SC24 and SC23+24 between the proton fluence () with the CME speed (), for the Pearson () and the partial (first-, , and second-order, ) correlations when excluding the effects of the SF fluence () and/or . The event size is given in parentheses.
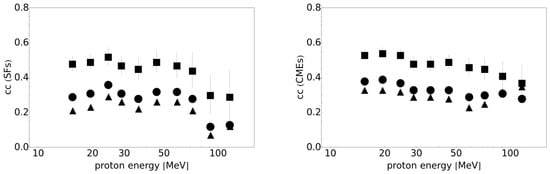
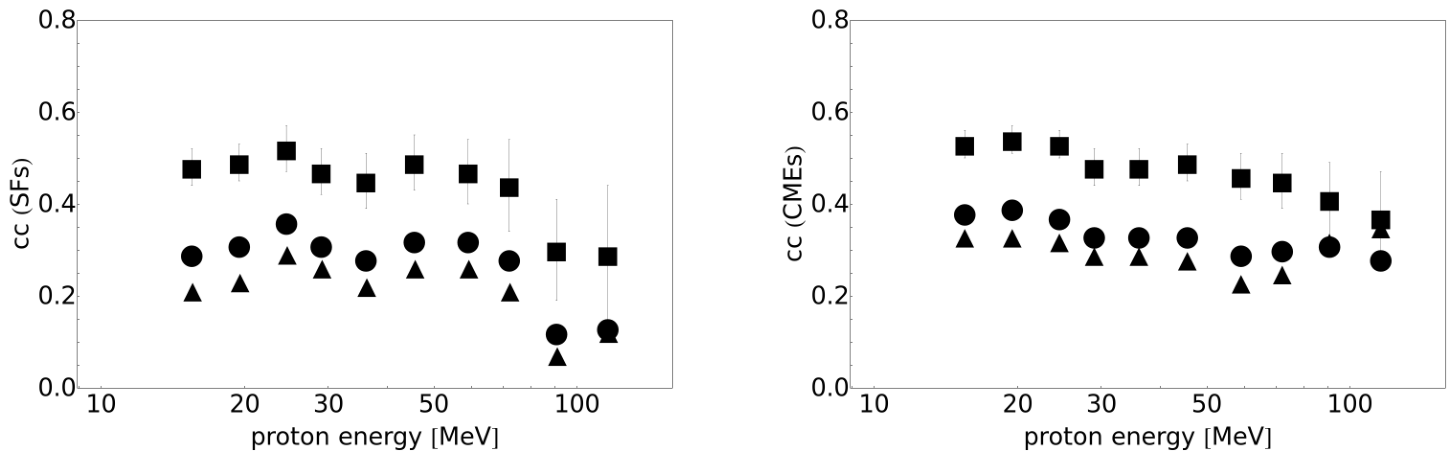
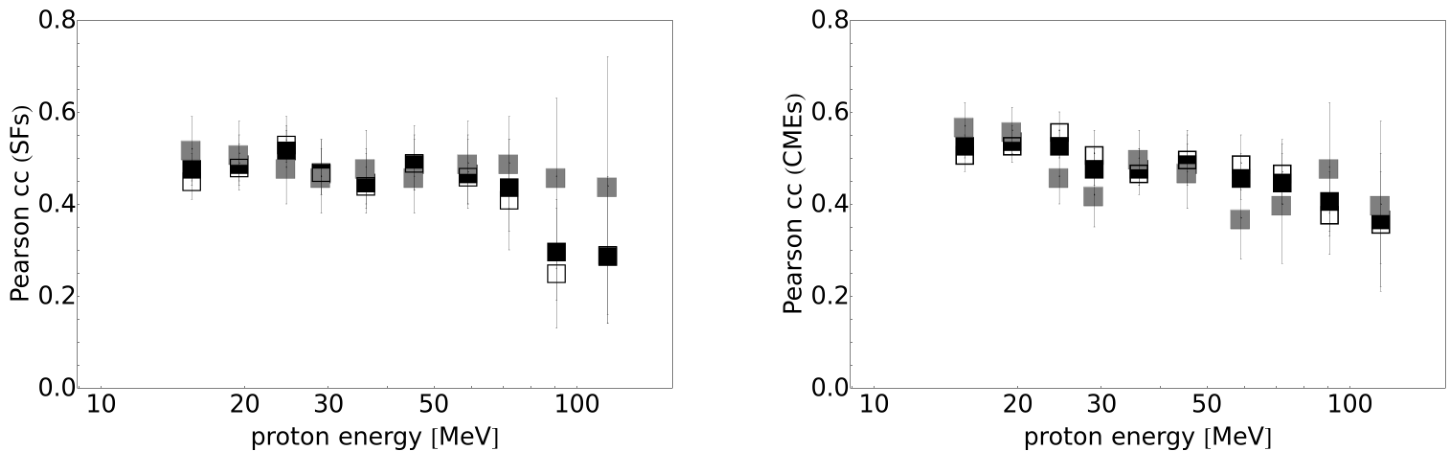
On one hand, the three different types of correlations are selected to be shown (i.e., Pearson and dual partial) over the entire time period (SC23+24, last column), in order to obtain representative distributions for the proton sample. The trends are shown as a function of the proton energy and separately for the SFs in Figure 2(left) and for the CMEs in Figure 2(right). The symbol denotes the type of the correlation coefficients. Overall, declining trends are obtained for all three types of correlation coefficients as a function of the proton energy, consistent with the results using proton peak intensities (for the Pearson correlations only, Paper I).
Figure 2.
Proton energy trends of the correlation coefficients with SFs (left) and CMEs (right) for the entire SEP sample in SC23+24 from Table 1 and Table 2, respectively. The symbols denote the type of correlations: squares for Pearson, circles for first-order, and triangles for the second-order correlation coefficients.
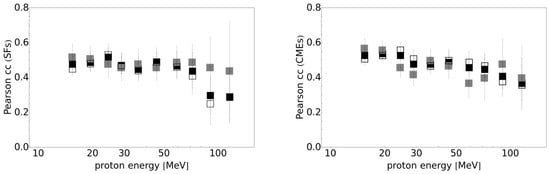
Alternatively, only the energy trend of the Pearson correlations could be given, but for the three different time periods, see Figure 3. The symbol is the same, whereas the shading denotes the specific SC. For the SFs (left plot), the SC23 trends tend to be mostly around the values for the entire sample (SC23+24), and only at the highest HED energies the correlations are slightly lower in SC23 and slightly higher for SC24. The trend of the correlations with CMEs (right plot) is declining, with no clear SC-preferences. The differences in the Pearson correlation coefficients are not statistically significant though.
3.2.2. Longitude Dependence
The dependencies on the heliolongitude of the proton-associated solar origin is provided in Table A1 and Table A2. There, the entire proton sample was divided into Eastern (E) and Western (W) groups, with respect to the reported longitude of the SF. When no value is provided by the flare catalogs (or no SF could be identified by us), the longitudinal separation is done according to the measurement position angle (MPA, measured counterclockwise, in degrees from the North) of the proton-associated CME (if any): E-events when the MPA ranges between 0 and 180 degrees, and W-events from 181 to 360 degrees. The remaining cases have uncertain location due to multiple eruptions, data gaps, or uncertain solar source identification. This is why the sum of E- and W-events (per energy channel) is always smaller than the initial proton sample (i.e., less than 100%, see below). For completeness, the longitudinal dependence (E vs. W) calculated as a fraction of the overall event size (given in parenthesis) is listed below for each proton channel:
- HED01: 22 vs. 59% (601);
- HED02: 22 vs. 59% (594);
- HED03: 22 vs. 62% (523);
- HED04: 22 vs. 63% (466);
- HED05: 22 vs. 64% (415);
- HED06: 21 vs. 67% (258);
- HED07: 18 vs. 72% (267);
- HED08: 18 vs. 78% (160);
- HED09: 15 vs. 83% (122);
- HED10: 17 vs. 83% (53).
With the proton energy increase, the fraction of W-origin event increases from ∼60 to over 80%, whereas the E-events slightly decrease from over 20% down to 15%.
For the dependence on the longitude, all three correlation coefficients are calculated in every time period and separately for E- and W-samples. As expected, the values of the partial correlations are lower compared to the Pearson ones. Although no uncertainty ranges could be given for the first and second order correlation coefficients, the following overall trends are identified based on the results from all three correlations. Due to low sampling and large uncertainties, the correlations at the highest energy channels needs to be considered with caution.
- SFs: The overall correlations between the proton fluence with SFs (Table A1) is predominantly stronger for the E-sample, compared to the W-SEP events (although not statistically significant), in all three time periods.
- CMEs: The respective correlations with the CME speed (Table A2) also tends to be stronger for the E-sample, but only in SC23 and SC23+24 and for the mid-to-high energy channels (HED03/HED04–HED06). At lower-to-mid energies (HED01–HED04), the correlation in SC24 is in fact reversed, showing W-proton events being dominated by CMEs (with marginally statistically significant difference at HED01 and HED02). There is no clear correlation trend at low proton energies in SC23 and SC23+24.
3.2.3. Magnitude Dependence
The dependence on the magnitude of the intensity of the proton events can be inspected in Table A3 and Table A4. The separation into high- and low-proton samples is performed according to the median value of the HED01 proton intensity sample, namely 183.8 (cm2 sr MeV)−1 based on 601 cases. Since all intensities are background-subtracted, this is in fact the amplitude of the SEPs. The overall behavior is summarized below:
- SFs: The overall trend of the correlations between the proton fluence and SF fluence is significantly larger for the high-proton sample, compared to the low-proton sample (Table A3). This is true for nearly all low-to-mid energy channels and all time periods (with regard to the SCs).
- CMEs: The correlations with the CMEs are also significantly larger for the high-fluence sample, compared to the low-fluence sample, but for the SC23 and SC23+24 (Table A4). These values are also larger than the respective ones with the SFs for the same energy channel. The trend in SC24 is, however, unclear, and the values for the obtained correlation coefficients with the CMEs for the high-sample are smaller to the respective once with the SFs.
3.2.4. Profile Dependence
For this part of the analyses, each proton event is identified either as having a slow- or fast-rising profile, based on the onset-to-peak time of the proton profile, termed ’rise time’ henceforth. Since other parameters (i.e., elemental abundances, presence of type II/IV radio burst emission, etc.) are also required for the ’impulsive vs. gradual’ definition of the SEPs, one could use the definition of the fast- vs. slow-rising profile only as a rough proxy. Alternatively, one could argue that such profile separation is more applicable as a proxy for the acceleration at the solar source and/or transport to the detector. Namely, during the initial phase of the SEP event, its profile is expected to be less affected by any diffusion processes in the interplanetary (IP) space and in such a way the dominant accelerator to be identified.
The rise time is just one of the many criteria used for the separation of the proton events into ‘impulsive vs. gradual’; however, exact values are usually not given. For example, from [45] (Figure 2 there), one could visually extract the rise time of selected examples for (e.g., Fe-rich) impulsive events, ranging between less than 2 and less than 4 h. Recently [46] reported the value of 3 h for the impulsive SEP event in their single-case study. Thus, we explored a threshold of 2, 3 and 4 h for the split into fast- and slow-rising proton samples and then calculated the fraction of the E- vs. W-origin for each sub-group. This was performed in order to test for over-representation with respect to helio-longitude. For the 2 h threshold we obtained 13 (E) vs. 68% (W) for the fast sample and 24 vs. 57% for the slow sample. The 3 h threshold produced 14 vs. 60% and 26 vs. 59%, whereas the 4 h limit gave 15 vs. 60% and 27 vs. 58%, respectively. As the fractions are rather consistent with the profile type, the middle value of 3 h will be adopted by us in this study.
The calculated correlations with respect to the profile type are listed in Appendix C (Table A5 and Table A6). The trends can be summarized as follows:
- SFs: The correlation with SFs is stronger for the fast compared to the slow-rising proton sample for SC23 and SC23+24 and for all energy channels (in HED01, HED02, HED04 this is true for the partial correlations only). In SC24 this dependence is reversed; namely stronger correlations are obtained for the slow-rising proton sample.
- CMEs: The correlations with the CMEs are reversed as for the SFs. The correlation coefficients between the proton fluence with CMEs for the slow sample in SC23 and SC23+24 are stronger than those with the SFs.
4. Discussion
Considering the entire proton sample, a declining energy trend is found for the correlations between the proton fluences and the SFs/CMEs during all time periods. This reflects the obtained dependencies in Paper I (as we use the same data) and is different to the increasing trend at high proton energies with the SFs reported by [25]. We note that the similar trends obtained in SC23 and SC23+24 can be easily explained with the domination, in all HED channels, of SC23 events (63–72%), compared to the proton event size in SC24 (28–37%).
The results from the performed statistical analyses support the premise that, overall, both SFs and CMEs have a share into the particle fluences, as the differences are mostly not statistically significant. Slightly larger values for the correlations are obtained with the CMEs over SC23, whereas in SC24 there are some occasional exception in some of the mid-energy channels. These conclusions are based on the adopted here assumption of linear inter-dependencies between the investigated parameters. Thus, we used Pearson correlations (even after excluding the inter-dependencies between the parameters as the partial correlations are composed by a combination of Pearson correlation coefficients) in order to be able to compare the current results with previous research.
Prior to discerning the reason for the differences in the explored trends obtained in this study, we need to take into consideration the existing intrinsic differences between the solar activity phenomena in the two SCs. Apart from the over-representation of SEP events in SC23, as described above, SC23 also hosts stronger (proton-associated) SFs in terms of their (mean/median) reported class and fluence. However, the latter two parameters were found to be strongly correlated (see Appendix A). With regard to the parameters of the (proton-related) CMEs, they are found to be faster in SC23 (in projected velocities), but wider in SC24.
The magnetic connection to the solar source (or acceleration site) is investigated via the differences in the E- vs. W-event sampling. The E-sample (used as a proxy for the poor magnetic connection between the acceleration site and the spacecraft detector) shows strong correlations with SFs in SC23 and SC23+24 at all proton energies, compared to the W-sample (used as a proxy for well-connected protons). Contribution to the E-proton sample, in the same time periods, is also obtained from the CMEs but for mid-to-large proton energies. The W-sample shows stronger correlation with the CMEs in SC24 and at lower-to-mid proton energies. The SF influence in SC24 are less clear, with occasionally larger correlations for the E-sample, that are also larger in values compared to the CME correlations in the E-sample. The obtained different trends with respect to the SC is not previously known and needs future confirmation using an alternative proton data (provided by an independent detector). SC24 is known for its overall weaker activity, though the CMEs tend to be wider in AW compared to SC23.
We then compare these trends with the recent results obtained by [47] (using Spearman correlations). The well-connected events there are found to be a mixture of both accelerators. In part, there is an agreement with our results, as the low-to-mid energy W-sample is clearly dominated by CMEs only in SC24, whereas the SF influence is not prominent. On the other hand [47] found the poorly connected events to be associated with shocks only. The agreement with our findings are again partial, as for the E-cases in SC23 the correlation coefficients are stronger with the CMEs, whereas in SC24 the correlations with the SFs are stronger than those with the CMEs. Potential differences can be explained with the different data, time coverages and statistical analyses used. We explored SC23 vs. SC24 dependencies, whereas the results in [47] are representative of the rising phase of SC25 and for specific energy channels.
As a function of the magnitude, high amplitude proton events have always stronger correlations with the SFs, compared to the weaker sample, providing a constant input to the proton fluences. The latter trend is true for all HED channels and all SC periods. The trend with the CMEs is similar however only during SC23 and SC23+24 and with larger values for the correlation coefficients compared to the SFs. This argues in favor of an additional contribution to the proton fluence by faster CMEs. No clear trend of the correlations with the CMEs is evident during SC24, and their values are also smaller than the respective ones with the SFs. Thus the contribution (if any) of wider, but slower CMEs to the magnitude of proton fluences in SC24 is not evident.
The final dependence investigated in this study is with regard to the profile shape (onset-to-peak) of the protons, recognizing fast- and slow-rising events based on a 3 h threshold. In SC23, the slowly rising events (a rough proxy for gradual SEPs) tend to be CME-dominated, whereas the fast-rising events are SF-driven which is consistent with the bi-modal SEP definition. However, the rule is reversed in SC24, where the correlations for the slowly rising sample are larger with the SFs and those for the fast-rising sample are larger with the CMEs.
5. Conclusions
In this study we explored in full the energy (10 HED channels) and SC (SC23, SC24 and SC23+24) dependencies of the correlations between the proton fluences, on one side, and the SF fluence and CME speed and AW, on another. In addition, the dependencies on the helio-longitude (Eastern vs. Western), proton magnitude (strong vs. weak) and proton profile (fast- vs slow-rising) are also explored. The statistical significance of the results (for the Pearson correlation coefficients), however, need to be inspected from the accompanying tables throughout the study and are mostly not or only marginally different. This is why we report them only as overall trends (see below).
- Energy trend: There is an overall declining trend with the increase in proton energy for the correlations with both SFs and CMEs and over all time periods.
- Longitude trend: In SC23 proton events with E-origin have strong correlations with SFs (over all HED channels) and to a degree also with CMEs (over mid-to-large energies). In SC24, W-events are better correlated with CMEs.
- Magnitude trend: The contribution of CMEs to strong in amplitude proton events during SC23 is prevailing, whereas during SC24 is questionable, as SFs tend to be the prominent driver.
- Profile trend: In SC23, the slowly rising events tend to be CME-dominated, whereas the fast-rising events are SF-driven and vice versa in SC24.
The different behaviour during SC24 is not entirely clear at this point, as the solar drivers in SC24 are in general weaker compared to their mean/median values in SC23, apart from larger values for the CME AW. This finding points toward the need for more long-term SEP statistical analyses, namely covering at least two SCs. Furthermore, there are some indications for different acceleration efficiency (based on SF vs. CME correlations) in the different energy channels. Namely, different solar drivers may become prominent at different proton energy ranges, which has an important implication for the SW research, where large amplitude and long-in-duration SEP events (namely large fluences) constitute a larger risk for radiation exposure. These trends should be investigated with alternative multi-energy SEP studies, which are still an exception due to instrument limitations.
Author Contributions
Conceptualization, R.M.; methodology, R.M.; software, all; validation, R.M. and S.W.S.; formal analysis, all; writing—original draft preparation, R.M.; writing—review and editing, all; visualization, S.W.S. and R.M.; project administration, M.D.; funding acquisition, M.D. All authors have read and agreed to the published version of the manuscript.
Funding
Support from the Bulgarian Academy of Sciences (Bilateral grant agreement between BAS and Astronomical Observatory, Belgrade) under project ‘Solar Drivers of Space Weather: Building Cross-Border Observatory Facilities and Network’ is gratefully acknowledged.
Data Availability Statement
The following open data sources were used: https://www.ngdc.noaa.gov/stp/space-weather/solar-data/solar-features/solar-flares/x-rays/goes/xrs/; ftp://ftp.swpc.noaa.gov/pub/warehouse/; https://solarmonitor.org/; https://cdaw.gsfc.nasa.gov/CME_list/; https://umbra.nascom.nasa.gov/SEP/; https://cdaw.gsfc.nasa.gov/CME_list/sepe/; http://www.sepem.eu/help/event_ref.html; http://www.stil.bas.bg/SEPcatalog/ (accessed on 16 June 2026).
Acknowledgments
The CME catalog is generated and maintained at the CDAW Data Center by NASA and The Catholic University of America in cooperation with the Naval Research Laboratory. SOHO is a project of international cooperation between ESA and NASA.
Conflicts of Interest
The authors declare no conflicts of interest. The funders had no role in the design of the study; in the collection, analyses, or interpretation of data; in the writing of the manuscript; or in the decision to publish the results.
Abbreviations
The following abbreviations are used in this manuscript:
| ACE | Advanced Composition Explorer |
| AU | astronomical unit |
| AW | angular width |
| CME | coronal mass ejection |
| ERNE | Energetic and Relativistic Nuclei and Electron |
| GOES | Geostationary Operational Environmental Satellite |
| HED | high-energy detector |
| IP | interplanetary |
| MPA | measurement position angle |
| PSP | Parker Solar Plus |
| SC | solar cycle |
| SDO | Solar dynamics Observatory |
| SEP | solar energetic proton |
| SF | solar flare |
| SOHO | Solar and Heliospheric Observatory |
| SolO | Solar Orbiter |
| SXR | soft X-ray |
| SW | space weather |
Appendix A. Solar Flares: GOES SXR Reported Flux, Corrected Flux and Fluence
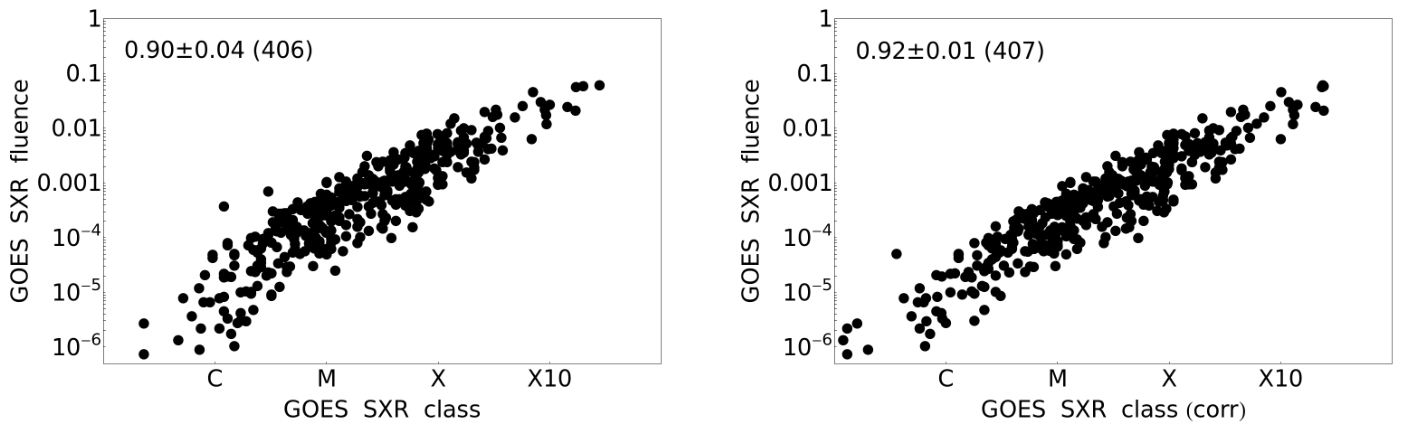
From the new GOES SXR flare catalog reported by [43], throughout our analyses we used the GOES SXR fluence, denoted as ‘flux_int_corrected’ in their online flare catalog, https://github.com/helio-unitov/ASR_cat (accessed on 16 June 2026). Below we show a comparative scatter plots between the values of the flare fluence and, on one side, the reported GOES SXR flare class (see Figure A1(left)) and with the corrected GOES SXR flare class (see Figure A1(left)), on another. The latter value is denoted as ’fclass_full’ in the flare catalog by [43]. A weak change in the trend of the scatter with the reported flare class could be argued for; however, no such break is noticed in the trend with the corrected flare class. The Pearson correlation between the reported and corrected flare classes is calculated to be , based on 406 pairs (scatter plot not shown). The correlations in Figure A1 are slightly weaker, but are, nevertheless, among the largest ever calculated in this study.
Figure A1.
Scatter plots between the GOES SXR fluence with the reported GOES SXR flux (left) and with the corrected GOES SXR class (right), respectively.
Appendix B. Proton Fluence Distributions
The histograms for the SEP fluence are given in Figure A2 for all 10 HED energy channels. The mean and median values for are shown on the respective plots.
Figure A2.
Histograms of the onset-to-peak proton fluence for a given energy channel.
Appendix C. Correlation Coeficient Trends for the SEP Fluence
Below are summarized (in table form) the computed correlation coefficients (zero (or Pearson), first and second-order) of the proton fluence, separately with the SFs and CMEs, investigated for the following dependencies:
Each trend is further calculated separately during SC23, SC24 and SC23+24.
Table A1.
Correlation coefficients of the SEP fluence with the SF fluence with and without the CME influence (as in Table 1) but for Eastern (E) and Western (W) event samples.
Table A2.
Correlation coefficients of the SEP fluence with the CME speed, with and without the SF influence (as in Table 2) but for Eastern (E) and Western (W) event samples.
Table A3.
Correlation coefficients as in Table 1 for high and low magnitude event samples.
Table A4.
Correlation coefficients as in Table 2 for high- and low-magnitude event samples.
Table A5.
Correlation coefficients as in Table 1 for fast- and slow-rising SEP profile event samples.
Table A6.
Correlation coefficients as in Table 2 for fast- and slow-rising SEP profile event samples.
References
- Desai, M.; Giacalone, J. Large gradual solar energetic particle events. Living Rev. Sol. Phys. 2016, 13, 3. [Google Scholar] [CrossRef] [Scilit] [PubMed]
- Reames, D.V. Review and outlook of solar energetic particle measurements on multispacecraft missions. Front. Astron. Space Sci. 2023, 10, 1254266. [Google Scholar] [CrossRef] [Scilit]
- Whitman, K.; Egeland, R.; Richardson, I.G.; Allison, C.; Quinn, P.; Barzilla, J.; Kitiashvili, I.; Sadykov, V.; Bain, H.M.; Dierckxsens, M.; et al. Review of Solar Energetic Particle Prediction Models. Adv. Space Res. 2023, 72, 5161–5242. [Google Scholar] [CrossRef] [Scilit]
- Miteva, R.; Samwel, S.W.; Costa-Duarte, M.V. The Wind/EPACT Proton Event Catalog (1996–2016). Sol. Phys. 2018, 293, 27. [Google Scholar] [CrossRef] [Scilit]
- Samwel, S.W.; Miteva, R. Catalogue of in situ observed solar energetic electrons from ACE/EPAM instrument. Mon. Not. R. Astron. Soc. 2021, 505, 5212–5227. [Google Scholar] [CrossRef] [Scilit]
- Stone, E.C.; Frandsen, A.M.; Mewaldt, R.A.; Christian, E.R.; Margolies, D.; Ormes, J.F.; Snow, F. The Advanced Composition Explorer. Space Sci. Rev. 1998, 86, 1–22. [Google Scholar] [CrossRef] [Scilit]
- Müller-Mellin, R.; Böttcher, S.; Falenski, J.; Rode, E.; Duvet, L.; Sanderson, T.; Butler, B.; Johlander, B.; Smit, H. The Solar Electron and Proton Telescope for the STEREO Mission. Space Sci. Rev. 2008, 136, 363–389. [Google Scholar] [CrossRef] [Scilit]
- Richardson, I.G.; von Rosenvinge, T.T.; St. Cyr, O.C.; Lario, D.; Mitchell, J.G.; Christian, E.R. Solar Energetic Proton Events Observed by the High Energy Telescopes on the STEREO Spacecraft or at the Earth During the First Solar Orbit of STEREO A (2006–2023). Sol. Phys. 2026, 301, 37. [Google Scholar] [CrossRef] [Scilit]
- Dresing, N.; Yli-Laurila, A.; Valkila, S.; Gieseler, J.; Morosan, D.E.; Farwa, G.U.; Kartavykh, Y.; Palmroos, C.; Jebaraj, I.; Jensen, S.; et al. The solar cycle 25 multi-spacecraft solar energetic particle event catalog of the SERPENTINE project. Astron. Astrophys. 2024, 687, A72. [Google Scholar] [CrossRef] [Scilit]
- Fox, N.J.; Velli, M.C.; Bale, S.D.; Decker, R.; Driesman, A.; Howard, R.A.; Kasper, J.C.; Kinnison, J.; Kusterer, M.; Lario, D.; et al. The Solar Probe Plus Mission: Humanity’s First Visit to Our Star. Space Sci. Rev. 2016, 204, 7–48. [Google Scholar] [CrossRef] [Scilit]
- Müller, D.; St. Cyr, O.C.; Zouganelis, I.; Gilbert, H.R.; Marsden, R.; Nieves-Chinchilla, T.; Antonucci, E.; Auchère, F.; Berghmans, D.; Horbury, T.S.; et al. The Solar Orbiter mission. Science overview. Astron. Astrophys. 2020, 642, A1. [Google Scholar] [CrossRef] [Scilit]
- Sánchez-Cano, B.; Hadid, L.Z.; Aizawa, S.; Murakami, G.; Bamba, Y.; Chiba, S.; Hara, T.; Heyner, D.; Ho, G.; Iwai, K.; et al. BepiColombo cruise science: Overview of the mission contribution to heliophysics. Earth Planets Space 2025, 77, 114. [Google Scholar] [CrossRef] [Scilit] [PubMed]
- Domingo, V.; Fleck, B.; Poland, A.I. The SOHO Mission: An Overview. Sol. Phys. 1995, 162, 1–37. [Google Scholar] [CrossRef] [Scilit]
- Benz, A.O. Flare Observations. Living Rev. Sol. Phys. 2017, 14, 2. [Google Scholar] [CrossRef] [Scilit]
- Chen, P.F. Coronal Mass Ejections: Models and Their Observational Basis. Living Rev. Sol. Phys. 2011, 8, 1. [Google Scholar] [CrossRef] [Scilit]
- Webb, D.F.; Howard, T.A. Coronal Mass Ejections: Observations. Living Rev. Sol. Phys. 2012, 9, 3. [Google Scholar] [CrossRef] [Scilit]
- Savić, M.; Veselinović, N.; Maričić, D.; Šterc, F.; Banjanac, R.; Travar, M.; Dragić, A. Further Study of the Relationship between Transient Effects in Energetic Proton and Cosmic Ray Fluxes Induced by Coronal Mass Ejections. Universe 2024, 10, 283. [Google Scholar] [CrossRef] [Scilit]
- Klein, K.L.; Dalla, S. Acceleration and Propagation of Solar Energetic Particles. Space Sci. Rev. 2017, 212, 1107–1136. [Google Scholar] [CrossRef] [Scilit]
- Reames, D.V. Particle acceleration at the Sun and in the heliosphere. Space Sci. Rev. 1999, 90, 413–491. [Google Scholar] [CrossRef] [Scilit]
- Cliver, E.W. A Revised Classification Scheme for Solar Energetic Particle Events. Cent. Eur. Astrophys. Bull. 2009, 33, 253–270. [Google Scholar]
- Kahler, S.W.; Reames, D.V.; Sheeley, N.R., Jr. Coronal Mass Ejections Associated with Impulsive Solar Energetic Particle Events. Astrophys. J. 2001, 562, 558–565. [Google Scholar] [CrossRef] [Scilit] [PubMed]
- Cane, H.V.; Richardson, I.G.; von Rosenvinge, T.T. A study of solar energetic particle events of 1997–2006: Their composition and associations. J. Geophys. Res. (Space Phys.) 2010, 115, A08101. [Google Scholar] [CrossRef] [Scilit]
- Trottet, G.; Samwel, S.; Klein, K.L.; Dudok de Wit, T.; Miteva, R. Statistical Evidence for Contributions of Flares and Coronal Mass Ejections to Major Solar Energetic Particle Events. Sol. Phys. 2015, 290, 819–839. [Google Scholar] [CrossRef] [Scilit]
- Miteva, R.; Samwel, S.W.; Dechev, M. Energy Dependence of Solar Energetic Protons and Their Origin in Solar Cycles 23 and 24. Atmosphere 2024, 15, 1016. [Google Scholar] [CrossRef] [Scilit]
- Dierckxsens, M.; Tziotziou, K.; Dalla, S.; Patsou, I.; Marsh, M.S.; Crosby, N.B.; Malandraki, O.; Tsiropoula, G. Relationship between Solar Energetic Particles and Properties of Flares and CMEs: Statistical Analysis of Solar Cycle 23 Events. Sol. Phys. 2015, 290, 841–874. [Google Scholar] [CrossRef] [Scilit]
- Fry, E.K. The risks and impacts of space weather: Policy recommendations and initiatives. Space Policy 2012, 28, 180–184. [Google Scholar] [CrossRef] [Scilit]
- Miteva, R.; Samwel, S.W.; Tkatchova, S. Space Weather Effects on Satellites. Astronomy 2023, 2, 165–179. [Google Scholar] [CrossRef] [Scilit]
- Miyake, S.; Kataoka, R.; Sato, T. Cosmic ray modulation and radiation dose of aircrews during the solar cycle 24/25. Space Weather 2017, 15, 589–605. [Google Scholar] [CrossRef] [Scilit]
- Saito, S.; Wickramasinghe, N.K.; Sato, T.; Shiota, D. Estimate of economic impact of atmospheric radiation storm associated with solar energetic particle events on aircraft operations. Earth Planets Space 2021, 73, 57. [Google Scholar] [CrossRef] [Scilit]
- Durante, M.; Cucinotta, F.A. Physical basis of radiation protection in space travel. Rev. Mod. Phys. 2011, 83, 1245–1281. [Google Scholar] [CrossRef] [Scilit]
- Schwadron, N.A.; Cooper, J.F.; Desai, M.; Downs, C.; Gorby, M.; Jordan, A.P.; Joyce, C.J.; Kozarev, K.; Linker, J.A.; Mikíc, Z.; et al. Particle Radiation Sources, Propagation and Interactions in Deep Space, at Earth, the Moon, Mars, and Beyond: Examples of Radiation Interactions and Effects. Space Sci. Rev. 2017, 212, 1069–1106. [Google Scholar] [CrossRef] [Scilit]
- Semkova, J.; Koleva, R.; Benghin, V.; Dachev, T.; Matviichuk, Y.; Tomov, B.; Krastev, K.; Maltchev, S.; Dimitrov, P.; Mitrofanov, I.; et al. Charged particles radiation measurements with Liulin-MO dosimeter of FREND instrument aboard ExoMars Trace Gas Orbiter during the transit and in high elliptic Mars orbit. Icarus 2018, 303, 53–66. [Google Scholar] [CrossRef] [Scilit]
- Schwenn, R. Space Weather: The Solar Perspective. Living Rev. Sol. Phys. 2006, 3, 2. [Google Scholar] [CrossRef] [Scilit]
- Temmer, M. Space weather: The solar perspective. Living Rev. Sol. Phys. 2021, 18, 4. [Google Scholar] [CrossRef] [Scilit]
- Buzulukova, N.; Tsurutani, B. Space Weather: From Solar Origins to Risks and Hazards Evolving in Time. Front. Astron. Space Sci. 2022, 9, 429. [Google Scholar] [CrossRef] [Scilit]
- Eastwood, J.P.; Biffis, E.; Hapgood, M.A.; Green, L.; Bisi, M.M.; Bentley, R.D.; Wicks, R.; McKinnell, L.A.; Gibbs, M.; Burnett, C. The Economic Impact of Space Weather: Where Do We Stand? Risk Anal. 2017, 37, 206–218. [Google Scholar] [CrossRef] [Scilit] [PubMed]
- Oughton, E.J.; Skelton, A.; Horne, R.B.; Thomson, A.W.P.; Gaunt, C.T. Quantifying the daily economic impact of extreme space weather due to failure in electricity transmission infrastructure. Space Weather 2017, 15, 65–83. [Google Scholar] [CrossRef] [Scilit]
- Iucci, N.; Levitin, A.E.; Belov, A.V.; Eroshenko, E.A.; Ptitsyna, N.G.; Villoresi, G.; Chizhenkov, G.V.; Dorman, L.I.; Gromova, L.I.; Parisi, M.; et al. Space weather conditions and spacecraft anomalies in different orbits. Space Weather 2005, 3, S01001. [Google Scholar] [CrossRef] [Scilit]
- Green, J.C.; Likar, J.; Shprits, Y. Impact of space weather on the satellite industry. Space Weather 2017, 15, 804–818. [Google Scholar] [CrossRef] [Scilit]
- Berger, T.E.; Dominique, M.; Lucas, G.; Pilinski, M.; Ray, V.; Sewell, R.; Sutton, E.K.; Thayer, J.P.; Thiemann, E. The Thermosphere Is a Drag: The 2022 Starlink Incident and the Threat of Geomagnetic Storms to Low Earth Orbit Space Operations. Space Weather 2023, 21, e2022SW003330. [Google Scholar] [CrossRef] [Scilit]
- Miteva, R.; Samwel, S.W.; Dechev, M. SOHO/ERNE Proton Fluence in Solar Cycles 23 and 24. Publ. L’Obs. Astron. Beogr. 2025, 107, 29–36. [Google Scholar] [CrossRef] [Scilit]
- Gopalswamy, N.; Yashiro, S.; Michalek, G.; Stenborg, G.; Vourlidas, A.; Freeland, S.; Howard, R. The SOHO/LASCO CME Catalog. Earth Moon Planets 2009, 104, 295–313. [Google Scholar] [CrossRef] [Scilit]
- Berretti, M.; Mestici, S.; Giovannelli, L.; Del Moro, D.; Stangalini, M.; Giannattasio, F.; Berrilli, F. ASR: Archival Solar Flares Catalog. Astrophys. J. Suppl. Ser. 2025, 278, 9. [Google Scholar] [CrossRef] [Scilit]
- Wall, J.V.; Jenkins, C.R. Practical Statistics for Astronomers; Cambridge University Press: Cambridge, UK, 2003; Volume 3. [Google Scholar]
- Reames, D.V.; Cliver, E.W.; Kahler, S.W. Abundance Enhancements in Impulsive Solar Energetic-Particle Events with Associated Coronal Mass Ejections. Sol. Phys. 2014, 289, 3817–3841. [Google Scholar] [CrossRef] [Scilit]
- Wang, M.; Chen, B.; Knuth, T.; Cohen, C.; Lee, J.; Wang, H.; Yu, S. Two Phases of Particle Acceleration of a Solar Flare Associated with In Situ Energetic Particles. Astrophys. J. 2025, 983, 33. [Google Scholar] [CrossRef] [Scilit]
- Farwa, G.U.; Dresing, N.; Gieseler, J.; Vuorinen, L.; Richardson, I.G.; Palmroos, C.; Valkila, S.; Heber, B.; Jensen, S.; Kühl, P.; et al. Electron and proton peak intensities as observed by a five-spacecraft fleet in solar cycle 25. Astron. Astrophys. 2025, 693, A198. [Google Scholar] [CrossRef] [Scilit]

Disclaimer/Publisher’s Note: The statements, opinions and data contained in all publications are solely those of the individual author(s) and contributor(s) and not of MDPI and/or the editor(s). MDPI and/or the editor(s) disclaim responsibility for any injury to people or property resulting from any ideas, methods, instructions or products referred to in the content. |
© 2026 by the authors. Licensee MDPI, Basel, Switzerland. This article is an open access article distributed under the terms and conditions of the Creative Commons Attribution (CC BY) license.