1. Introduction
Classical Be stars constitute a prominent laboratory for studying the interplay between rapid stellar rotation, pulsational phenomena, and the formation of circumstellar disks in hot stars. They are defined as non-supergiant B-type stars that show, or have shown at some stage of their evolution, Balmer line emission arising from a gaseous circumstellar environment. A comprehensive overview of their observational properties and physical interpretation is provided in the review of [
1], which established the current consensus that classical Be stars host viscous, dust-free, quasi-Keplerian decretion disks fed by episodic or continuous mass loss from the central star.
Rapid rotation is widely recognized as a necessary ingredient of the Be phenomenon, with typical rotation rates approaching a substantial fraction of the critical velocity [
2,
3]. However, rotation alone cannot account for the observed variability and recurrent disk-feeding events. Several physical mechanisms have therefore been proposed to explain how mass and angular momentum are transferred from the stellar surface into orbit. Among these, non-radial pulsations (NRPs) have gained strong observational support, as multi-periodic pulsation patterns are commonly detected in Be stars and are often temporally associated with outbursts and disk variability [
1]. Alternative or complementary scenarios, including magnetic activity or binary interaction, have also been discussed. However, large-scale organized magnetic fields appear to be rare among classical Be stars, and binarity alone cannot account for the phenomenon as a whole [
4,
5,
6].
Photometric variability is one of the most conspicuous manifestations of the Be phenomenon and spans a large range of timescales and amplitudes, reflecting the complex interplay between stellar pulsations, rapid rotation, and circumstellar disk activity. While ground-based observations had long revealed complex and often irregular light curves in Be stars, space-based photometry has fundamentally transformed this field by providing uninterrupted, high-precision time series over extended periods.
Observations from missions such as Convection, Rotation and planetary Transits (CoRoT) [
7], Kepler [
8], and more recently Transiting Exoplanet Survey Satellite (TESS) [
9] have shown that many Be stars exhibit rich frequency spectra characterized by groups of closely spaced peaks, amplitude modulation, and frequency beating [
10,
11,
12,
13]. These pulsational signatures probe the stellar interior and thus serve as key diagnostics of the physical processes at work in rapidly rotating massive stars. In addition to coherent multi-periodic variability, Be stars frequently display transient photometric events (outbursts) marked by sudden brightness changes associated with enhanced mass loss and the feeding or restructuring of the circumstellar disk [
13,
14].
This coexistence of persistent pulsational signals with stochastic or quasi-cyclic variability highlights the need for long, continuous photometric monitoring. Such datasets enable not only the identification of dominant frequencies but also the investigation of their temporal stability and possible connections to disk formation, evolution, and dissipation processes. As a result, space-based photometry plays a central role in disentangling stellar and circumstellar contributions to the observed variability in Be stars.
In the specific context of Kepler/K2 observations, recent systematic analyses have demonstrated that variability among B-type stars forms a continuum shaped primarily by stellar mass, rotation, and internal mixing, rather than by sharply separated instability classes. A detailed spectroscopic and seismic characterization of 122 B-type stars observed during K2 Campaign 11 was presented by [
15], while an extended variability classification of 73 B-type stars observed in Campaigns 13–18 was carried out by [
16]. Together, these studies provided a homogeneous classification of nearly 200 B-type stars based on high-precision space photometry combined with ground-based spectroscopy. In both works, stars exhibiting classical Be characteristics were deliberately identified and excluded from the statistical samples owing to the additional complexity introduced by circumstellar disk variability and emission-line phenomena.
Following the failure of its second reaction wheel, the Kepler mission was reconfigured into the K2 mission, operating as a sequence of observing campaigns along the ecliptic plane. Although originally designed for exoplanet detection, K2 retained the key strengths of the original mission, including high photometric precision and the ability to obtain long, nearly continuous time series spanning several tens of days per campaign. For massive stars, including Be stars, this observational strategy provides a unique opportunity to investigate variability on short-to-intermediate timescales, from hours to months, enabling the detection of low-amplitude pulsation modes, amplitude modulation, and transient events that are difficult or impossible to characterize from the ground. Despite the reduced pointing stability relative to the original Kepler mission phase, advances in data-reduction pipelines have rendered K2 light curves well suited for detailed frequency and time–frequency analyses [
17,
18,
19].
Crucially, K2’s campaign-based observing strategy facilitates coordinated ground-based follow-up. When combined with spectroscopy, K2 photometric data allow a direct comparison between stellar brightness variations and contemporaneous changes in spectroscopic diagnostics, such as emission-line variability tracing circumstellar disks (e.g., [
1,
20]). This synergy makes K2 particularly valuable for studies aimed at disentangling stellar and circumstellar contributions to the observed variability in Be stars.
Despite the major advances brought by space-based photometry, which have firmly established the ubiquity and complexity of variability in Be stars, coordinated photometric and spectroscopic studies of individual Be stars (e.g., [
1,
21]) with long temporal baselines remain comparatively limited. In particular, simultaneous or closely coordinated analyses of high-precision light curves and H
variability remain scarce, limiting our ability to directly associate photometric signatures with disk-related phenomena and mass-loss processes. This observational gap is further emphasized by the systematic exclusion of Be stars from large-scale K2 variability classifications, owing to the additional complexity introduced by circumstellar emission and disk variability [
15,
16].
In this study, we report the identification and analysis of four previously unclassified Be-type variable stars observed by the Kepler/K2 mission: HD 155291, HD 159571, HD 138872, and HD 315823. These objects have not previously been identified in the literature as Be-type variables (i.e., exhibiting both Be-type H
emission and associated photometric variability [
17,
18,
19]). We complement the photometric analysis with multi-epoch H
spectroscopy at the Observatório Pico dos Dias, Brazil. The primary objectives are: (i) to delineate their short-term photometric variability, (ii) to investigate long-term circumstellar disk evolution via H
diagnostics, and (iii) to explore possible connections between stellar pulsational behavior and disk-associated variability. This coordinated approach enables a qualitative comparison between structural changes occurring over years and variability observed on timescales of hours to days.
Because Be stars are frequently excluded from large-scale variability classifications owing to their circumstellar complexity, detailed case studies that combine space photometry with long-term disk monitoring remain comparatively scarce. This study therefore contributes to addressing this observational gap by providing robust frequency catalogs, multi-year H equivalent-width time series, a systematic characterization of amplitude modulation and low-frequency variability consistent with stochastic processes, and reproducible analysis procedures that can serve as a reference framework for future investigations of pulsation–disk coupling in classical Be stars.
2. Materials and Methods
2.1. Kepler/K2 Photometric Observations
The photometric data analyzed in this work were obtained by the Kepler space telescope during its K2 mission, which provides high-precision space-based photometry using a single broad-bandpass filter spanning approximately 420–900 nm. This spectral response overlaps with the classical Johnson B, V, R, and I bands, making the data well suited for variability studies of hot stars.
Because this bandpass encompasses a wide spectral range, it also includes features relevant for Be stars, such as Balmer emission lines (e.g., H and H) originating in the circumstellar disk. Variability in these lines could therefore contribute to the measured photometric signal. However, their equivalent widths are small compared to the width of the broadband filter, so their contribution to the integrated flux is typically minor relative to the stellar continuum. The periodic variability detected in the K2 light curves, characterized by stable frequencies and beating patterns, is therefore most naturally interpreted as arising from stellar non-radial pulsations rather than direct modulation of disk emission.
Among the four Be-type stars analyzed in this study, three were observed during K2 Campaign 11 and one during Campaign 15. Campaign 11 was conducted between September and December 2016 and provided nearly continuous photometric monitoring for approximately 71 days. These observations were obtained under the Guest Observer program GO11127 (PI: M. Emilio), which targeted 122 candidate B-type stars with spectral types ranging from O9 to A0 selected from the SIMBAD database. The observations were acquired predominantly in long-cadence mode, with an effective integration time of approximately 30 min per exposure, and the Be stars analyzed here are part of the 32,884 long-cadence targets observed during this campaign. Owing to an error in the initial roll-angle configuration adopted to minimize the spacecraft’s solar torque, Campaign 11 was divided into two observational segments.
The fourth Be-type star analyzed in this work was observed during K2 Campaign 15, conducted between August and November 2017 under the Guest Observer program GO15099 (PI: M. Emilio). This campaign targeted a field toward the constellation of Scorpius and included 23,279 standard long-cadence targets, along with a smaller number of short-cadence observations. The field encompasses the outskirts of the Upper Scorpius association, one of the nearest OB associations, with an estimated age of approximately 11 Myr, making it particularly favorable for studies of variability in young and massive stars. As in Campaign 11, the observations used in this work were obtained predominantly in long-cadence mode.
In this study, we used publicly available K2 light curves processed through the standard Kepler data reduction pipeline [
22]. The resulting Pre-search Data Conditioning (PDC) light curves were adopted for the photometric analysis presented here for all targets except HD 159571, for which a custom aperture extraction was performed to mitigate flux contamination (see below). All observation times are given in Barycentric Julian Date (BJD), accounting for the motion of the spacecraft relative to the Solar System barycenter. The light curves were then adjusted for systematic errors using the K2 Systematics Correction (K2SC, version 2.0) software package Aigrain et al. [
18], which minimizes the effect of spacecraft jitter on the data. This method uses a Gaussian process to correlate the star’s two-dimensional CCD position with its photometric variability. The K2SC method provides performance comparable to the K2 self-flatfielding method of Vanderburg and Johnson [
17], but is better suited for studies of stellar variability.
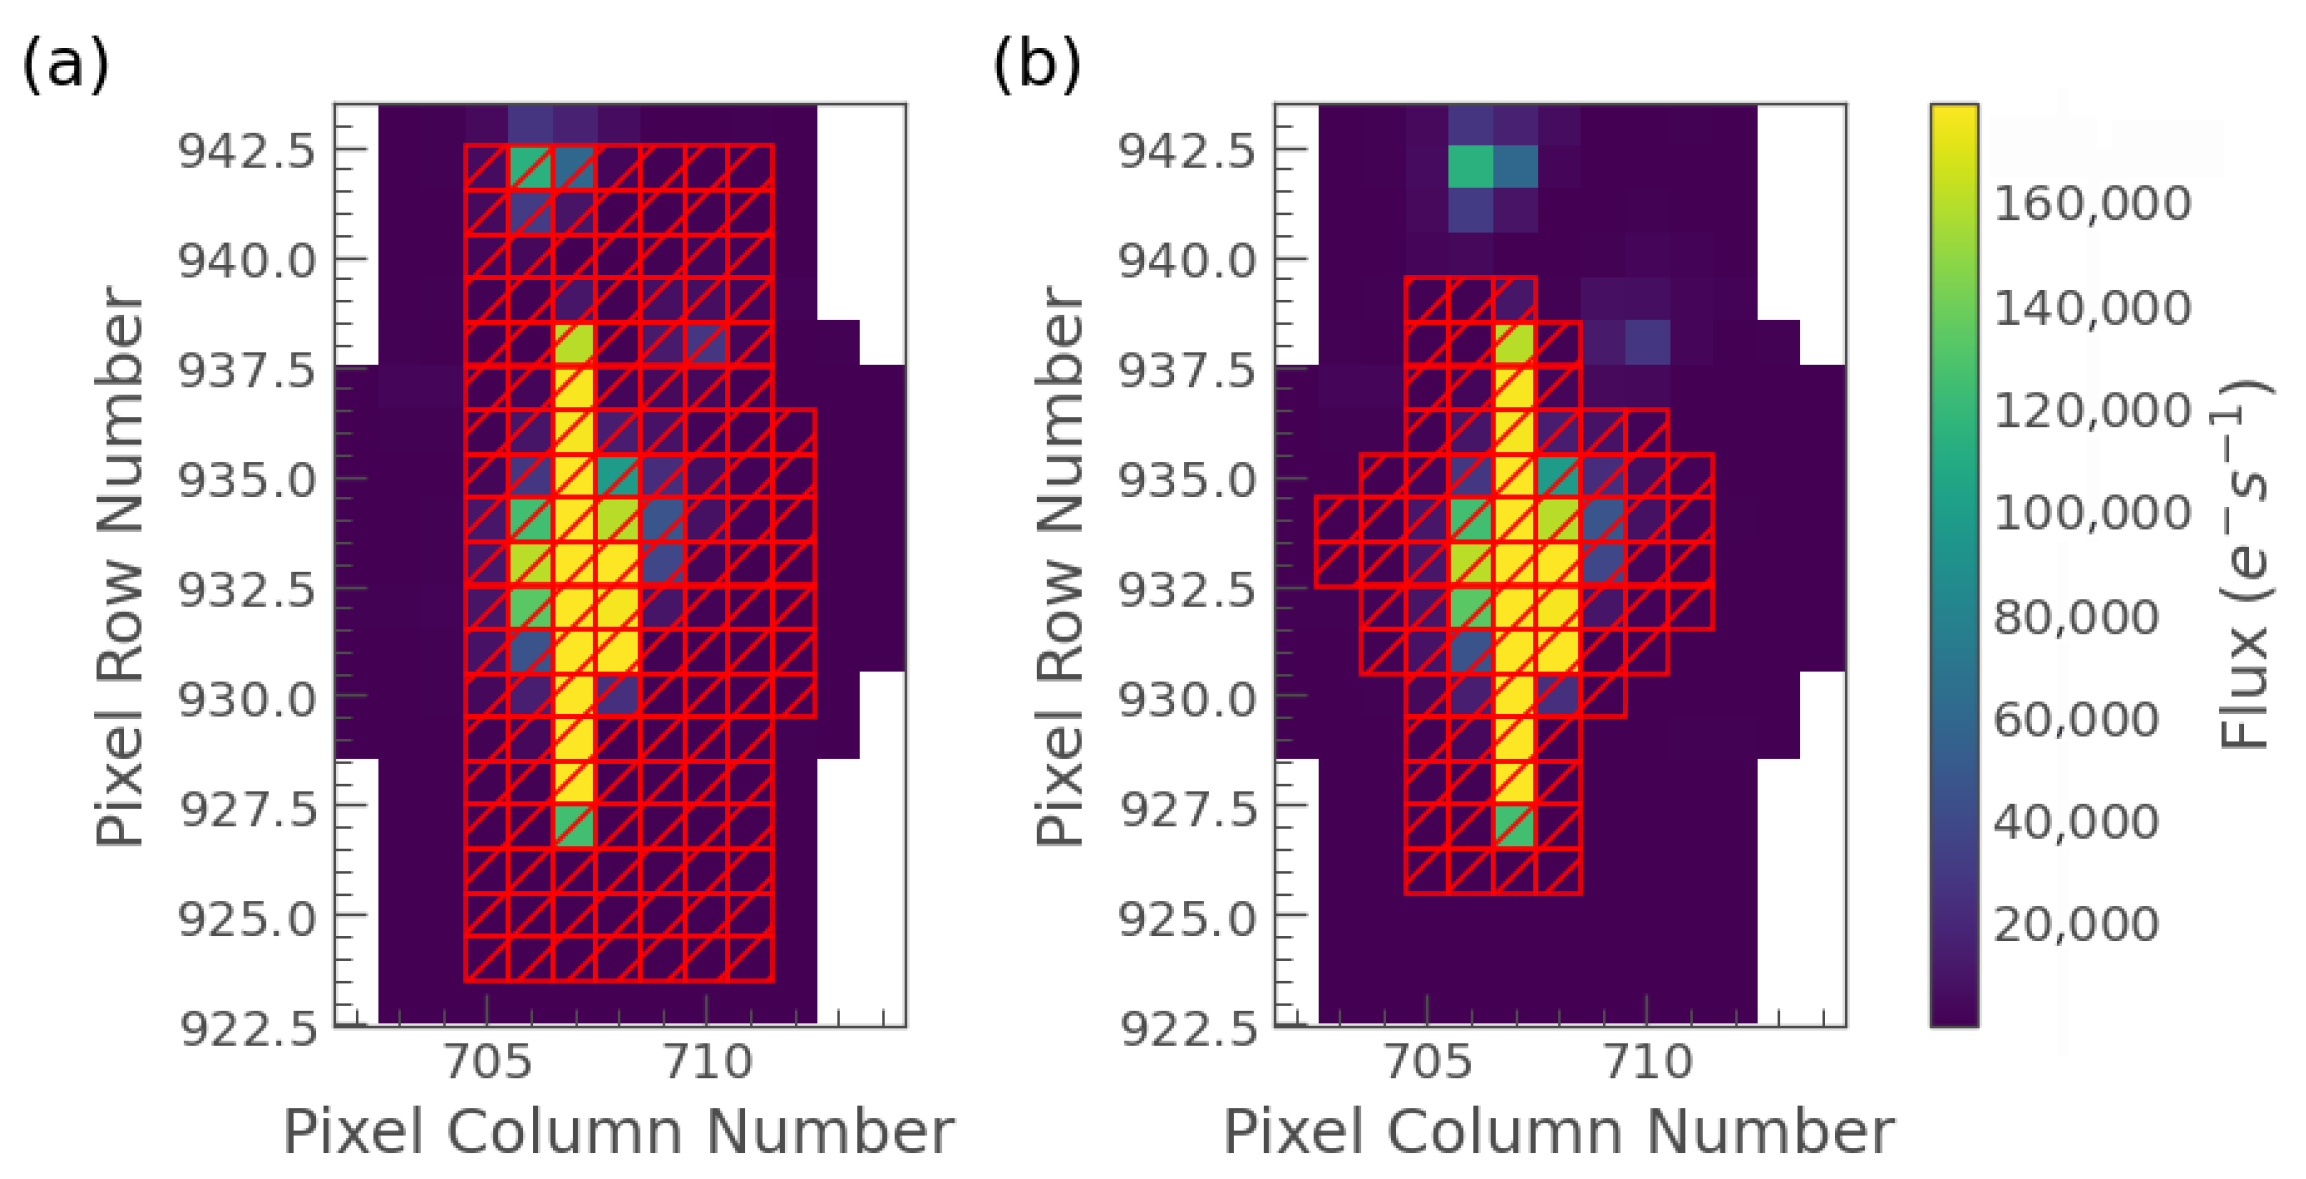
We examined the default aperture masks for the four targets analyzed in this study to assess potential contamination from nearby sources. Significant contamination from two neighboring stars was identified only for HD 159571 (EPIC 240541552), located in a crowded field. For this target, a custom aperture mask was therefore generated using the lightkurve v. 2.5.1 software package to minimize flux contamination.
Figure A1 compares the original pipeline mask with the custom-defined aperture. For the remaining targets, the default masks were adopted.
2.2. Photometric Data Processing and Frequency Analysis
After describing the observational characteristics of the K2 data, we now outline the procedures adopted for light-curve processing and frequency extraction. The PDC light curves used in this work were obtained from the public archive after processing by the standard Kepler Science Pipeline, which applies a sequence of calibration and correction steps at the pixel and light-curve levels to mitigate instrumental effects related to detector response, spacecraft pointing, and thermal variations.
For targets observed during K2 Campaign 11, the segmentation caused by the change in spacecraft roll angle introduces a discontinuity in the raw time series. This effect is largely mitigated in the pipeline-processed PDC light curves used here. A visual inspection of all light curves was nevertheless performed to identify any remaining discontinuities or artifacts that could affect the frequency analysis.
The analysis of photometric variability was carried out using Fourier-based techniques, following the same general procedure adopted in our previous analyses of K2 B-type stars [
15,
16]. Frequency spectra were computed using the Lomb–Scargle periodogram [
23], and individual periodic components were extracted through an iterative prewhitening procedure [
24]. At each step, the frequency corresponding to the highest peak in the periodogram was identified and fitted together with previously detected frequencies using a non-linear least-squares approach. The fitted signal was then subtracted from the original light curve, and the procedure was repeated on the residuals.
The iterative process was stopped when the signal-to-noise ratio of the highest remaining peak dropped below a threshold of S/N = 5. This conservative criterion, previously adopted in K2 asteroseismic studies [
25], is also applied here to minimize the inclusion of spurious frequencies and ensure the robustness of the detected signals. Frequencies associated with unusually large formal uncertainties were also discarded. The resulting set of frequencies, therefore, represents a balance between sensitivity to low-amplitude variability and the reliability of the detections.
The effective frequency range accessible in our analysis is constrained by the time sampling and total duration of the observations. For the long-cadence K2 data, the long-cadence sampling implies a Nyquist frequency of 24.47 day−1, corresponding to a minimum recoverable period of approximately 59 min. Periods comparable to or longer than the total duration of the observing campaigns were not considered. In practice, this corresponds to maximum detectable periods of about 75 days for Campaign 11 and about 89 days for Campaign 15. In contrast, the spectroscopic monitoring spans an eight-year baseline.
2.3. Spectroscopic Observations
Spectroscopic observations were conducted to characterize the atmospheric properties of the targets and to monitor variability in the H line as a tracer of circumstellar disk activity. The data were obtained between March 2017 and March 2025 at the Observatório Pico dos Dias (OPD), operated by the National Laboratory of Astrophysics (LNA) in Brazópolis, Minas Gerais, Brazil.
Observations were carried out with the 1.6 m Perkin–Elmer Ritchey–Chrétien telescope at the Observatório Pico dos Dias (OPD), Brazil. Spectra obtained before 2020 were acquired with the Cassegrain slit spectrograph coupled to a CCD detector, providing a typical spectral resolving power of R∼10,000 and a signal-to-noise ratio of approximately 100 in the continuum. From 2020 onwards, additional spectra with higher resolving power, up to R∼25,000, were obtained using the Coudé slit spectrograph for selected targets.
Two main wavelength configurations were employed. The first covered the blue spectral region, approximately 3990–5110 Å, including diagnostic lines of hydrogen, neutral helium (He I), and magnesium (Mg II), which are commonly used for spectral classification and atmospheric parameter determination in B-type stars. The second configuration focused on the red spectral region, from about 6040 to 6950 Å, encompassing the H line, and was specifically designed to investigate emission-line variability associated with the circumstellar disks of Be stars.
2.4. Spectroscopic Data Reduction and H Measurements
The spectroscopic data were reduced using standard procedures implemented in the Image Reduction and Analysis Facility (IRAF v2.18.1) software package [
26]. The reduction steps included bias subtraction, flat-field correction, cosmic-ray removal, and one-dimensional spectral extraction. Wavelength calibration was performed using comparison lamp spectra acquired with the same instrumental configuration as the science observations. Th–Ar lamps were used for the Coudé spectra, while He–Ar and Ne–Ar lamps were used for the Cassegrain spectra.
After extraction and wavelength calibration, all spectra were normalized to the local continuum. Continuum normalization was achieved by fitting low-order polynomial functions to line-free regions adjacent to the spectral features of interest, with particular care taken in the vicinity of the H line to avoid contamination from emission wings or nearby absorption features. This approach enables a consistent comparison of line profiles obtained at different epochs and with different instrumental setups.
The variability of the circumstellar disk was investigated by measuring the H
line profile. For each spectrum, the equivalent width (EW) of the H
line was measured from the continuum-normalized spectra using the equivalent_width routine from the specutils package (part of the Astropy project; Astropy Collaboration et al. [
27,
28]). The EW was computed by direct numerical integration of the line profile relative to the local continuum, without assuming any parametric line-shape model. We adopted the convention that positive EW values indicate absorption and negative values indicate emission. To minimize contamination from adjacent spectral features, continuum reference regions on both sides of the H
line were manually defined for each spectrum, and the integration limits were chosen to encompass the full emission profile, including the line wings when present.
The measured H equivalent widths include the contribution of the underlying photospheric absorption. Since this component is expected to remain approximately constant over the observation period, it does not affect the temporal variability discussed here. Our analysis, therefore, focuses on the relative variability of the emission line rather than on the absolute strength of the disk emission.
The resulting EW measurements provide a quantitative proxy for changes in the kinematic and structural properties of the emitting circumstellar material, and all measurements were performed consistently to ensure internal homogeneity across the dataset.
When multiple spectra were available for a given target, the temporal evolution of the H EW was examined over the full spectroscopic monitoring interval, which in several cases extends well beyond the time span covered by the K2 photometric observations. This long-term spectroscopic information provides context for the state and evolution of the circumstellar disk and is used to qualitatively compare disk-related variability with the photometric behavior observed during the K2 campaigns, as discussed in the following sections.
3. Results
The sample analyzed in this work consists of four classical Be stars observed by K2 and followed up with ground-based spectroscopy. Three targets were observed during Campaign 11 and one during Campaign 15. All four stars show clear variability in both photometric and spectroscopic data.
High-precision K2 photometry reveals brightness variability in all targets during the campaigns. In parallel, multi-epoch optical spectroscopy obtained over several years shows persistent H emission and temporal changes in line strength, shape, and width, indicating variability in the kinematic structure of the circumstellar disk.
The results for each star are presented individually below.
Table 1 lists the significant frequencies identified through the pre-whitening procedure, together with their corresponding amplitudes, for all four stars.
3.1. HD 155291
HD 155291 (EPIC 230653391, TIC 101669617) has been classified as a B9IV star with a visual magnitude of
mag [
29]. The star was observed by the Kepler space telescope during K2 Campaign 11, in a field projected toward the constellation Ophiuchus. To our knowledge, no previous study has combined space-based photometry with long-term spectroscopic monitoring for this object.
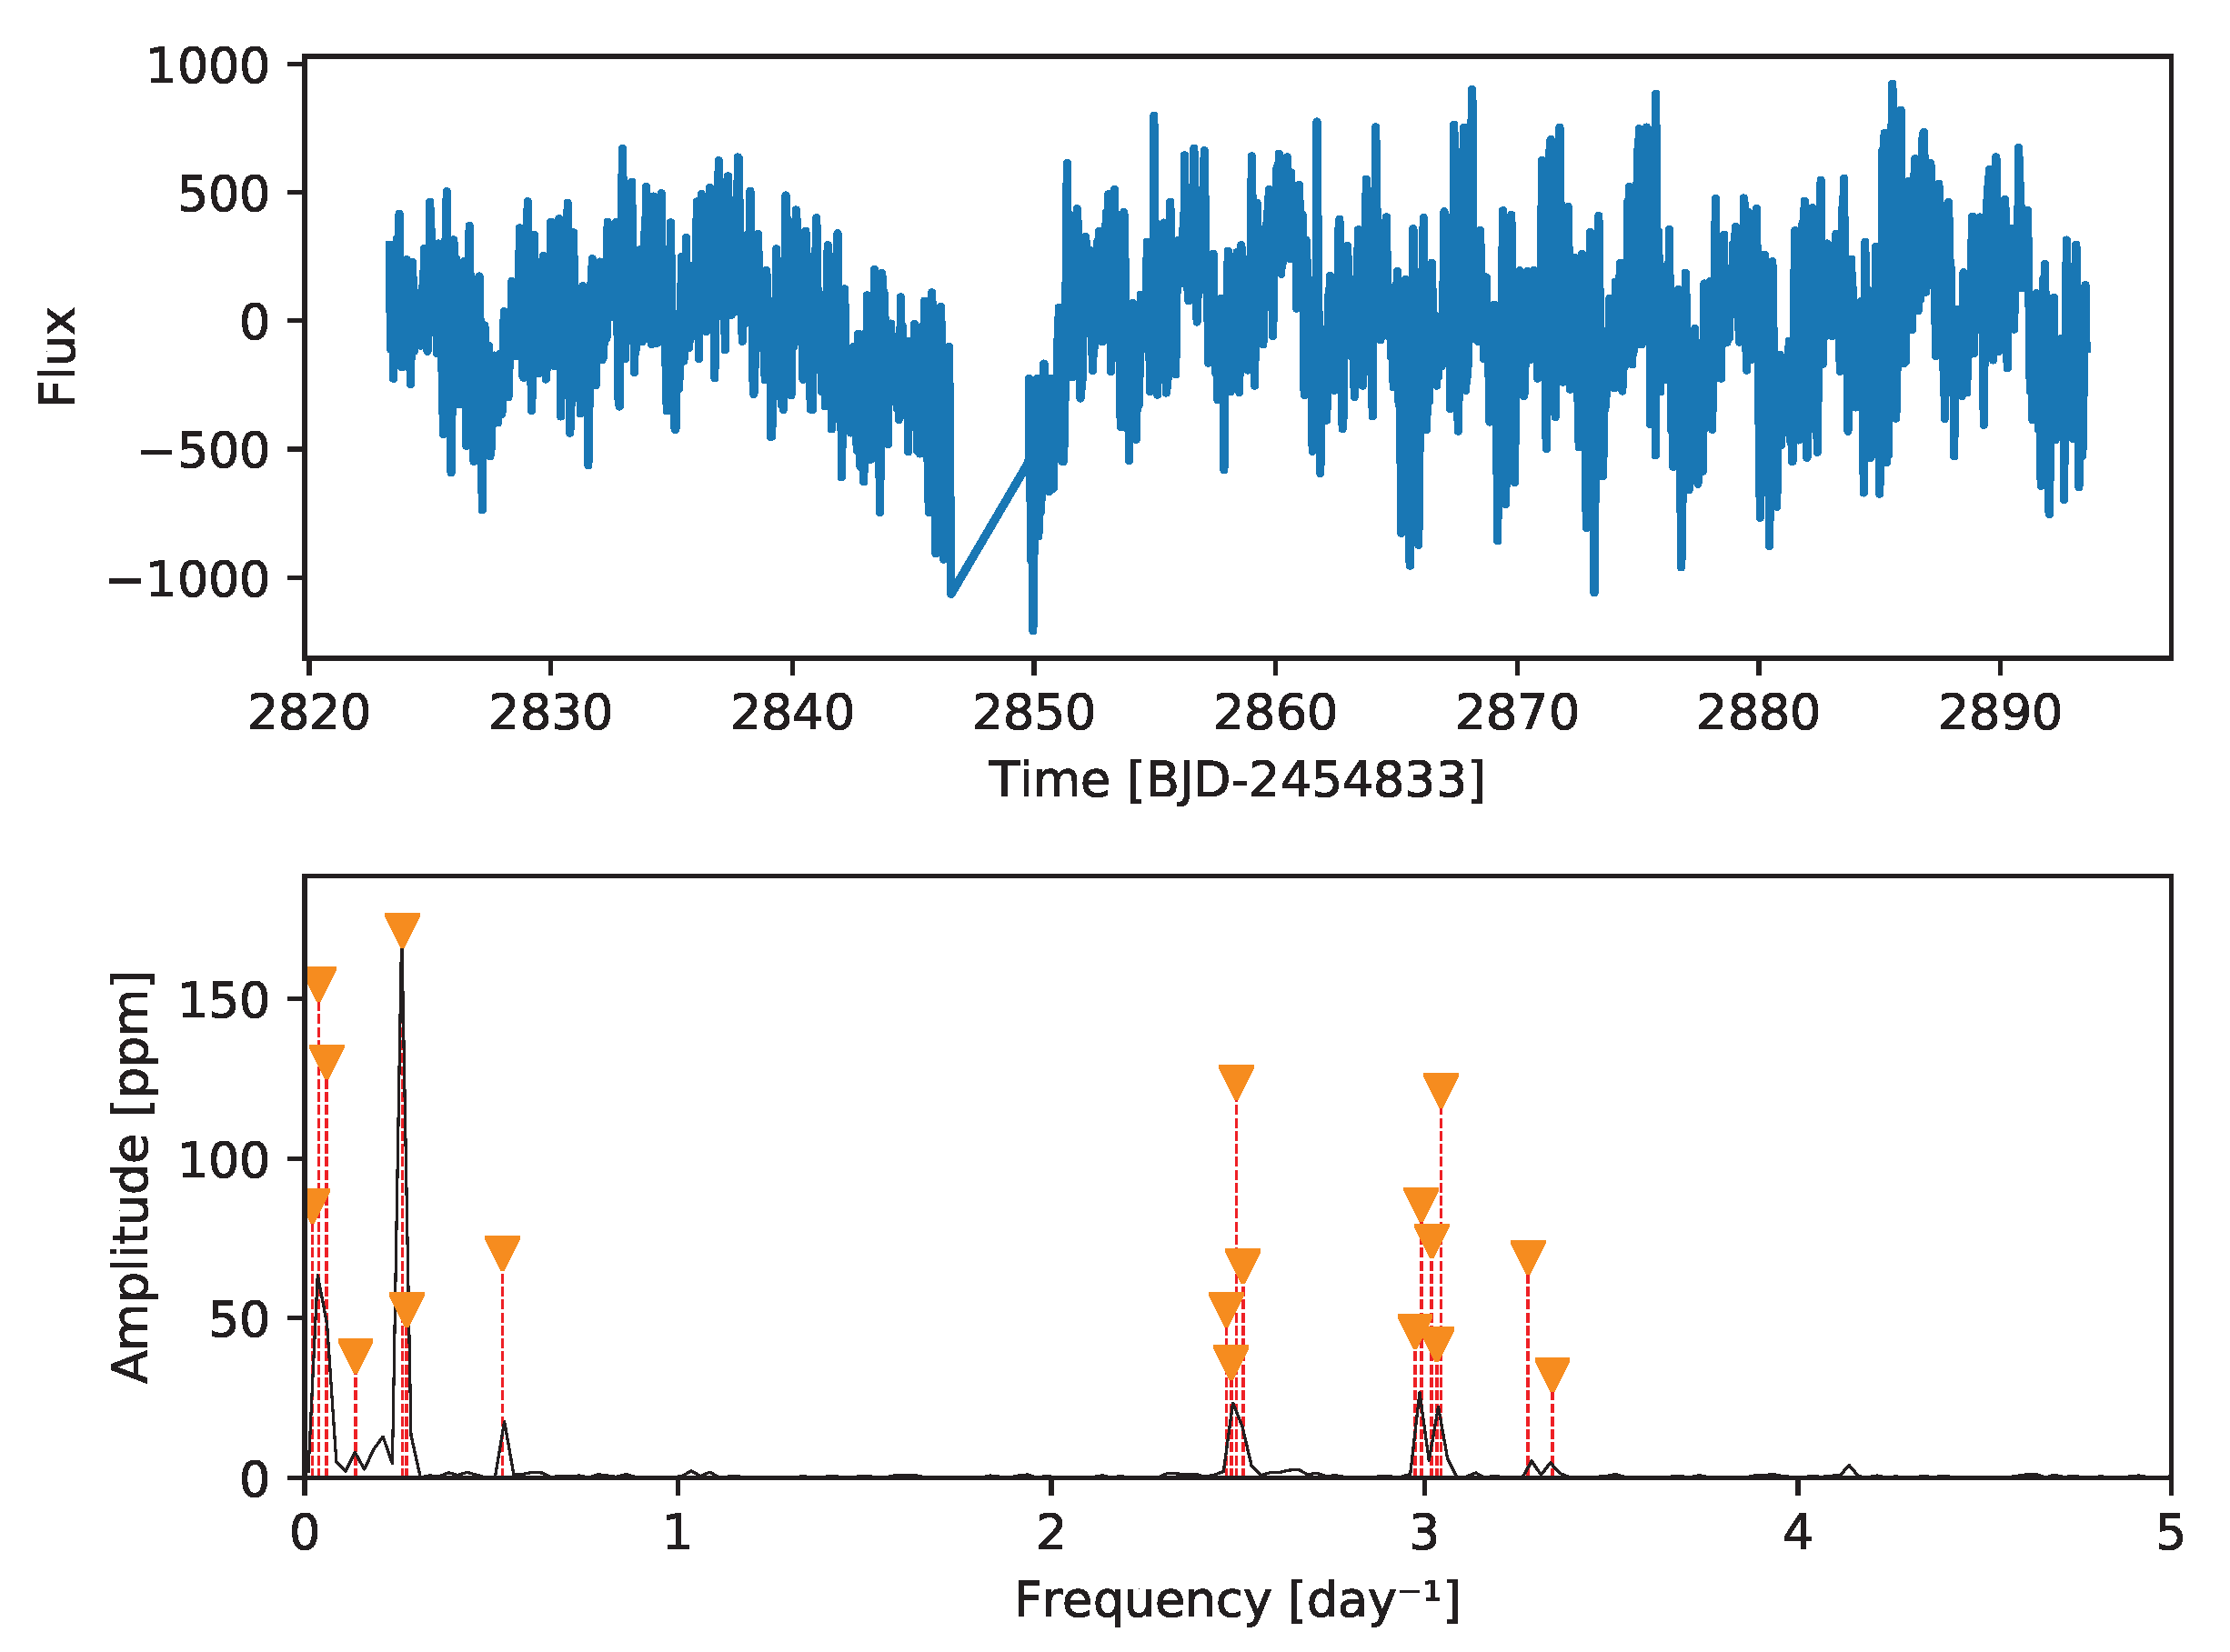
The K2 light curve of HD 155291 exhibits clear variability over the duration of Campaign 11. The Fourier analysis reveals multiple significant frequencies, indicative of a multi-periodic signal rather than simple rotational modulation. The detected variability is characterized by low-amplitude brightness fluctuations with stable periodic components throughout the campaign, as illustrated in the light curve and corresponding frequency spectrum (
Figure 1). No large-amplitude transient events are observed in the photometric data during the K2 time span.
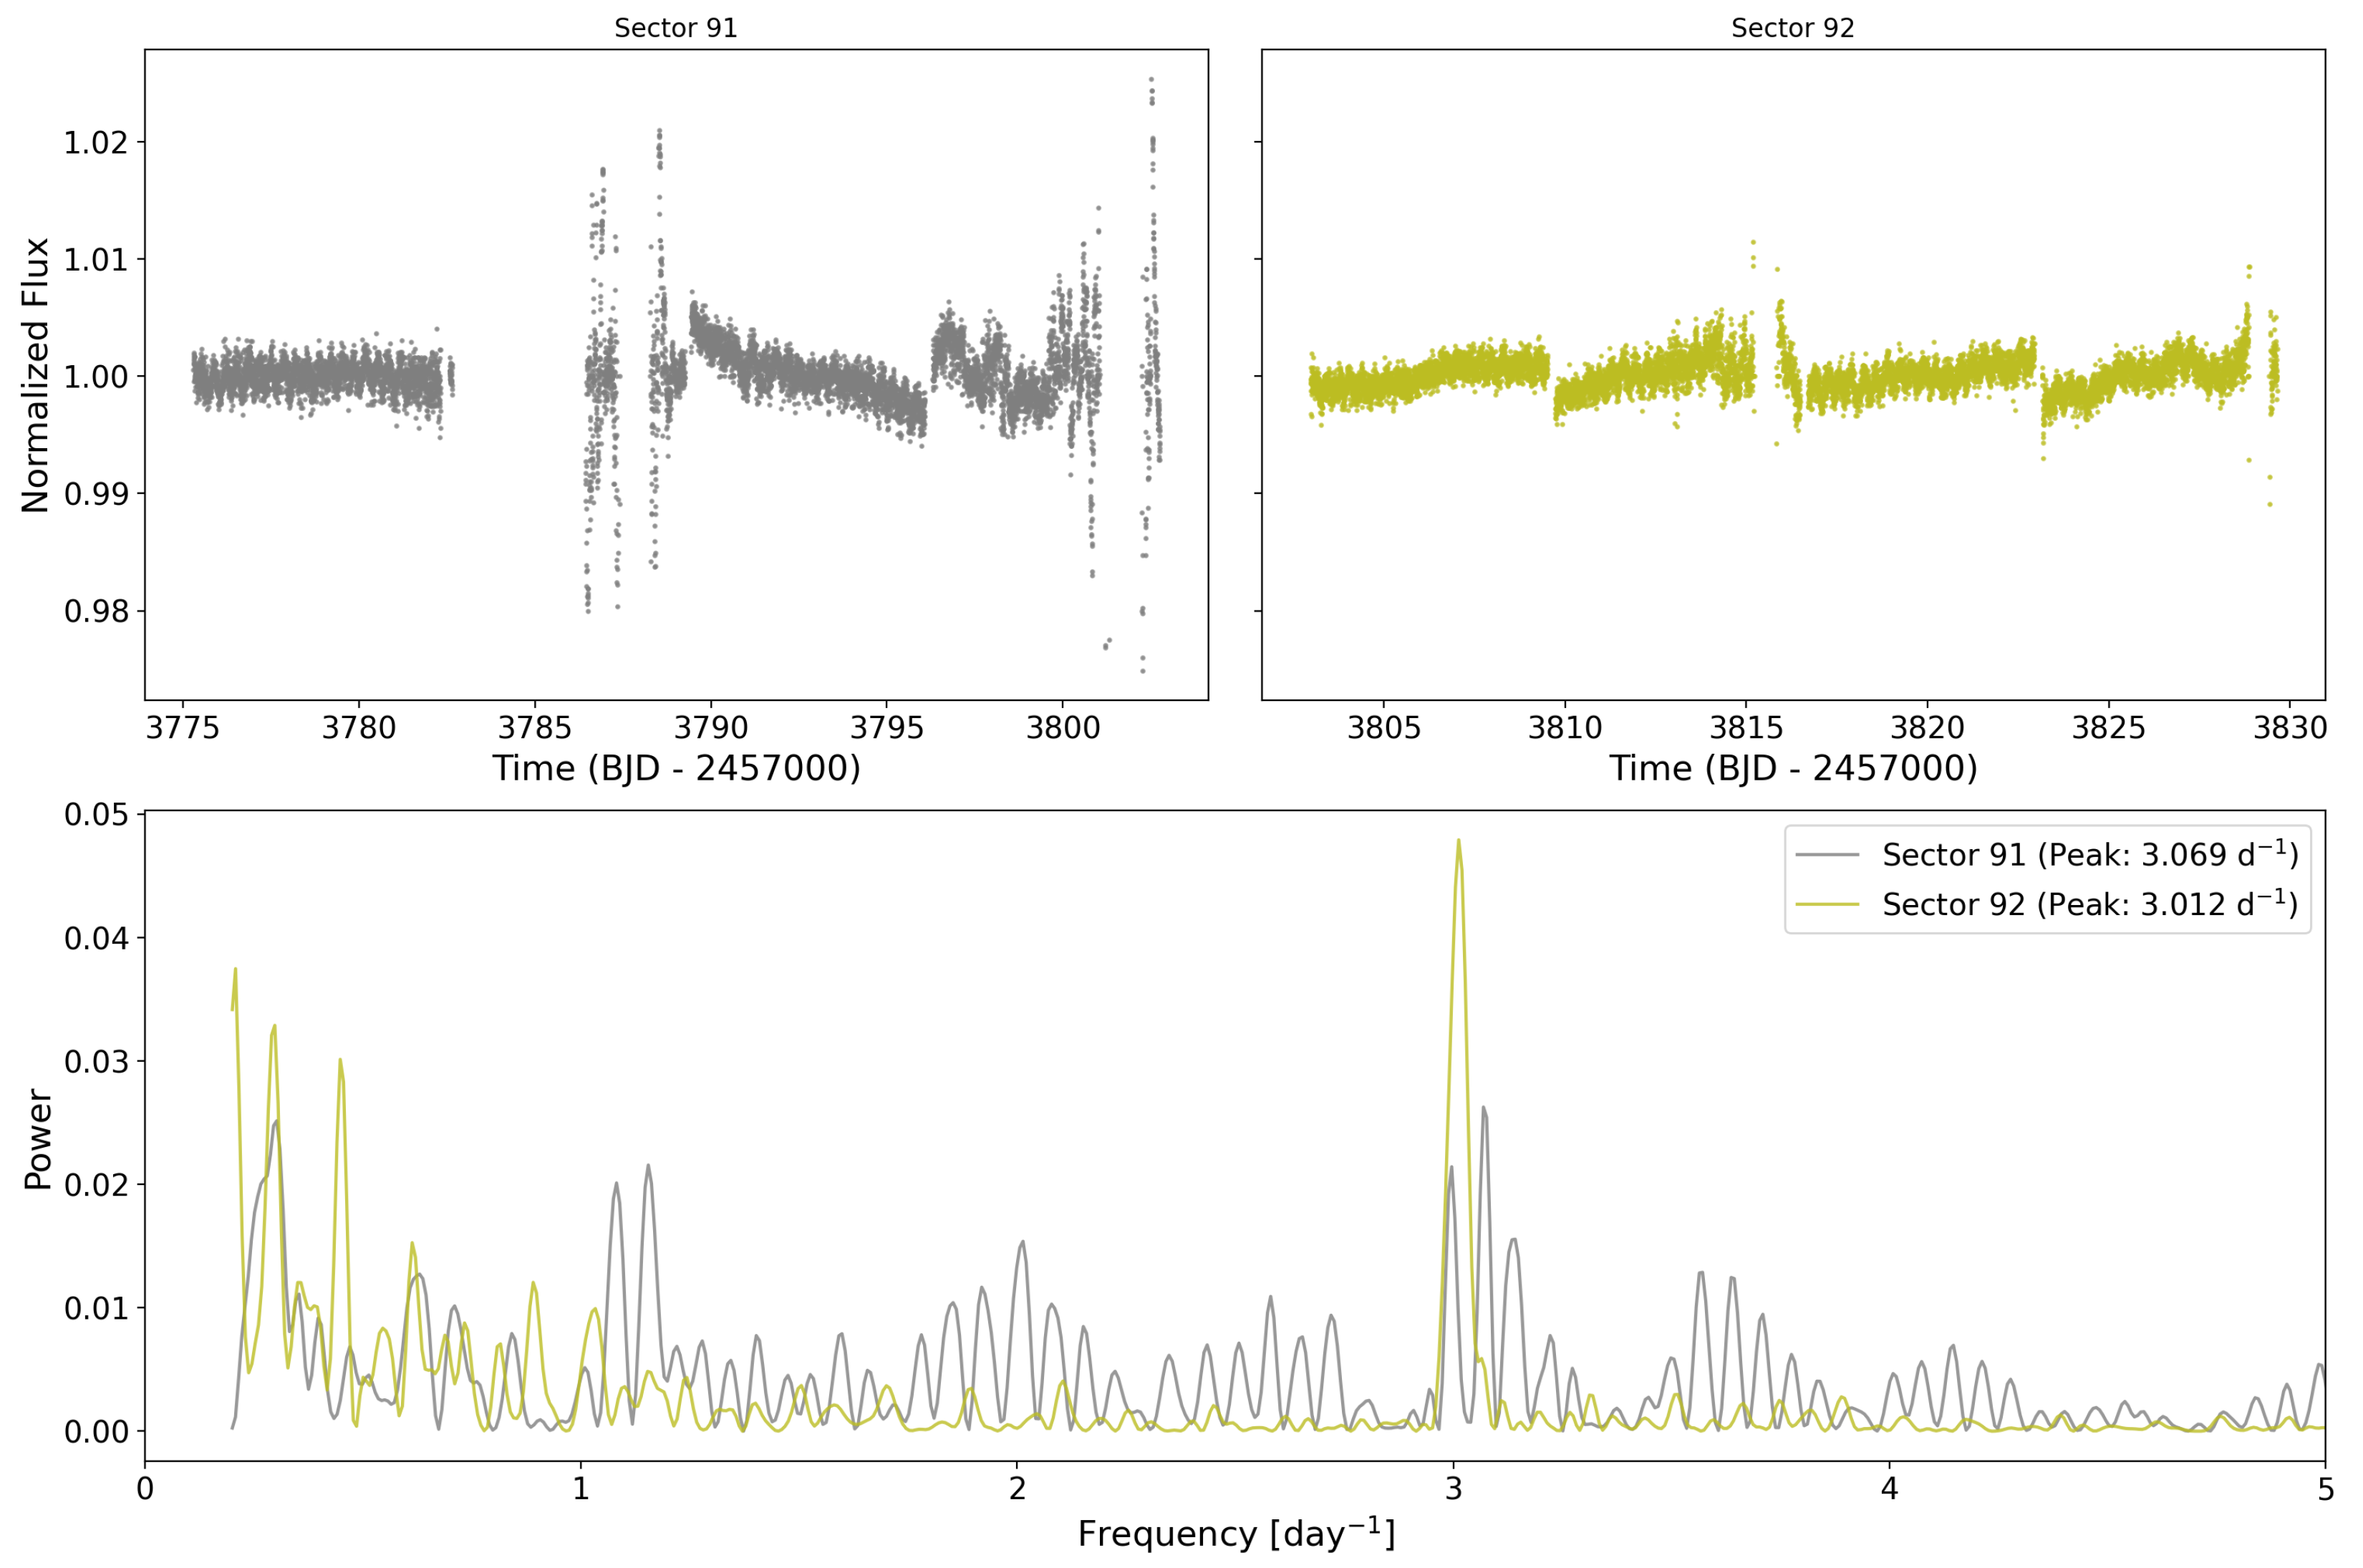
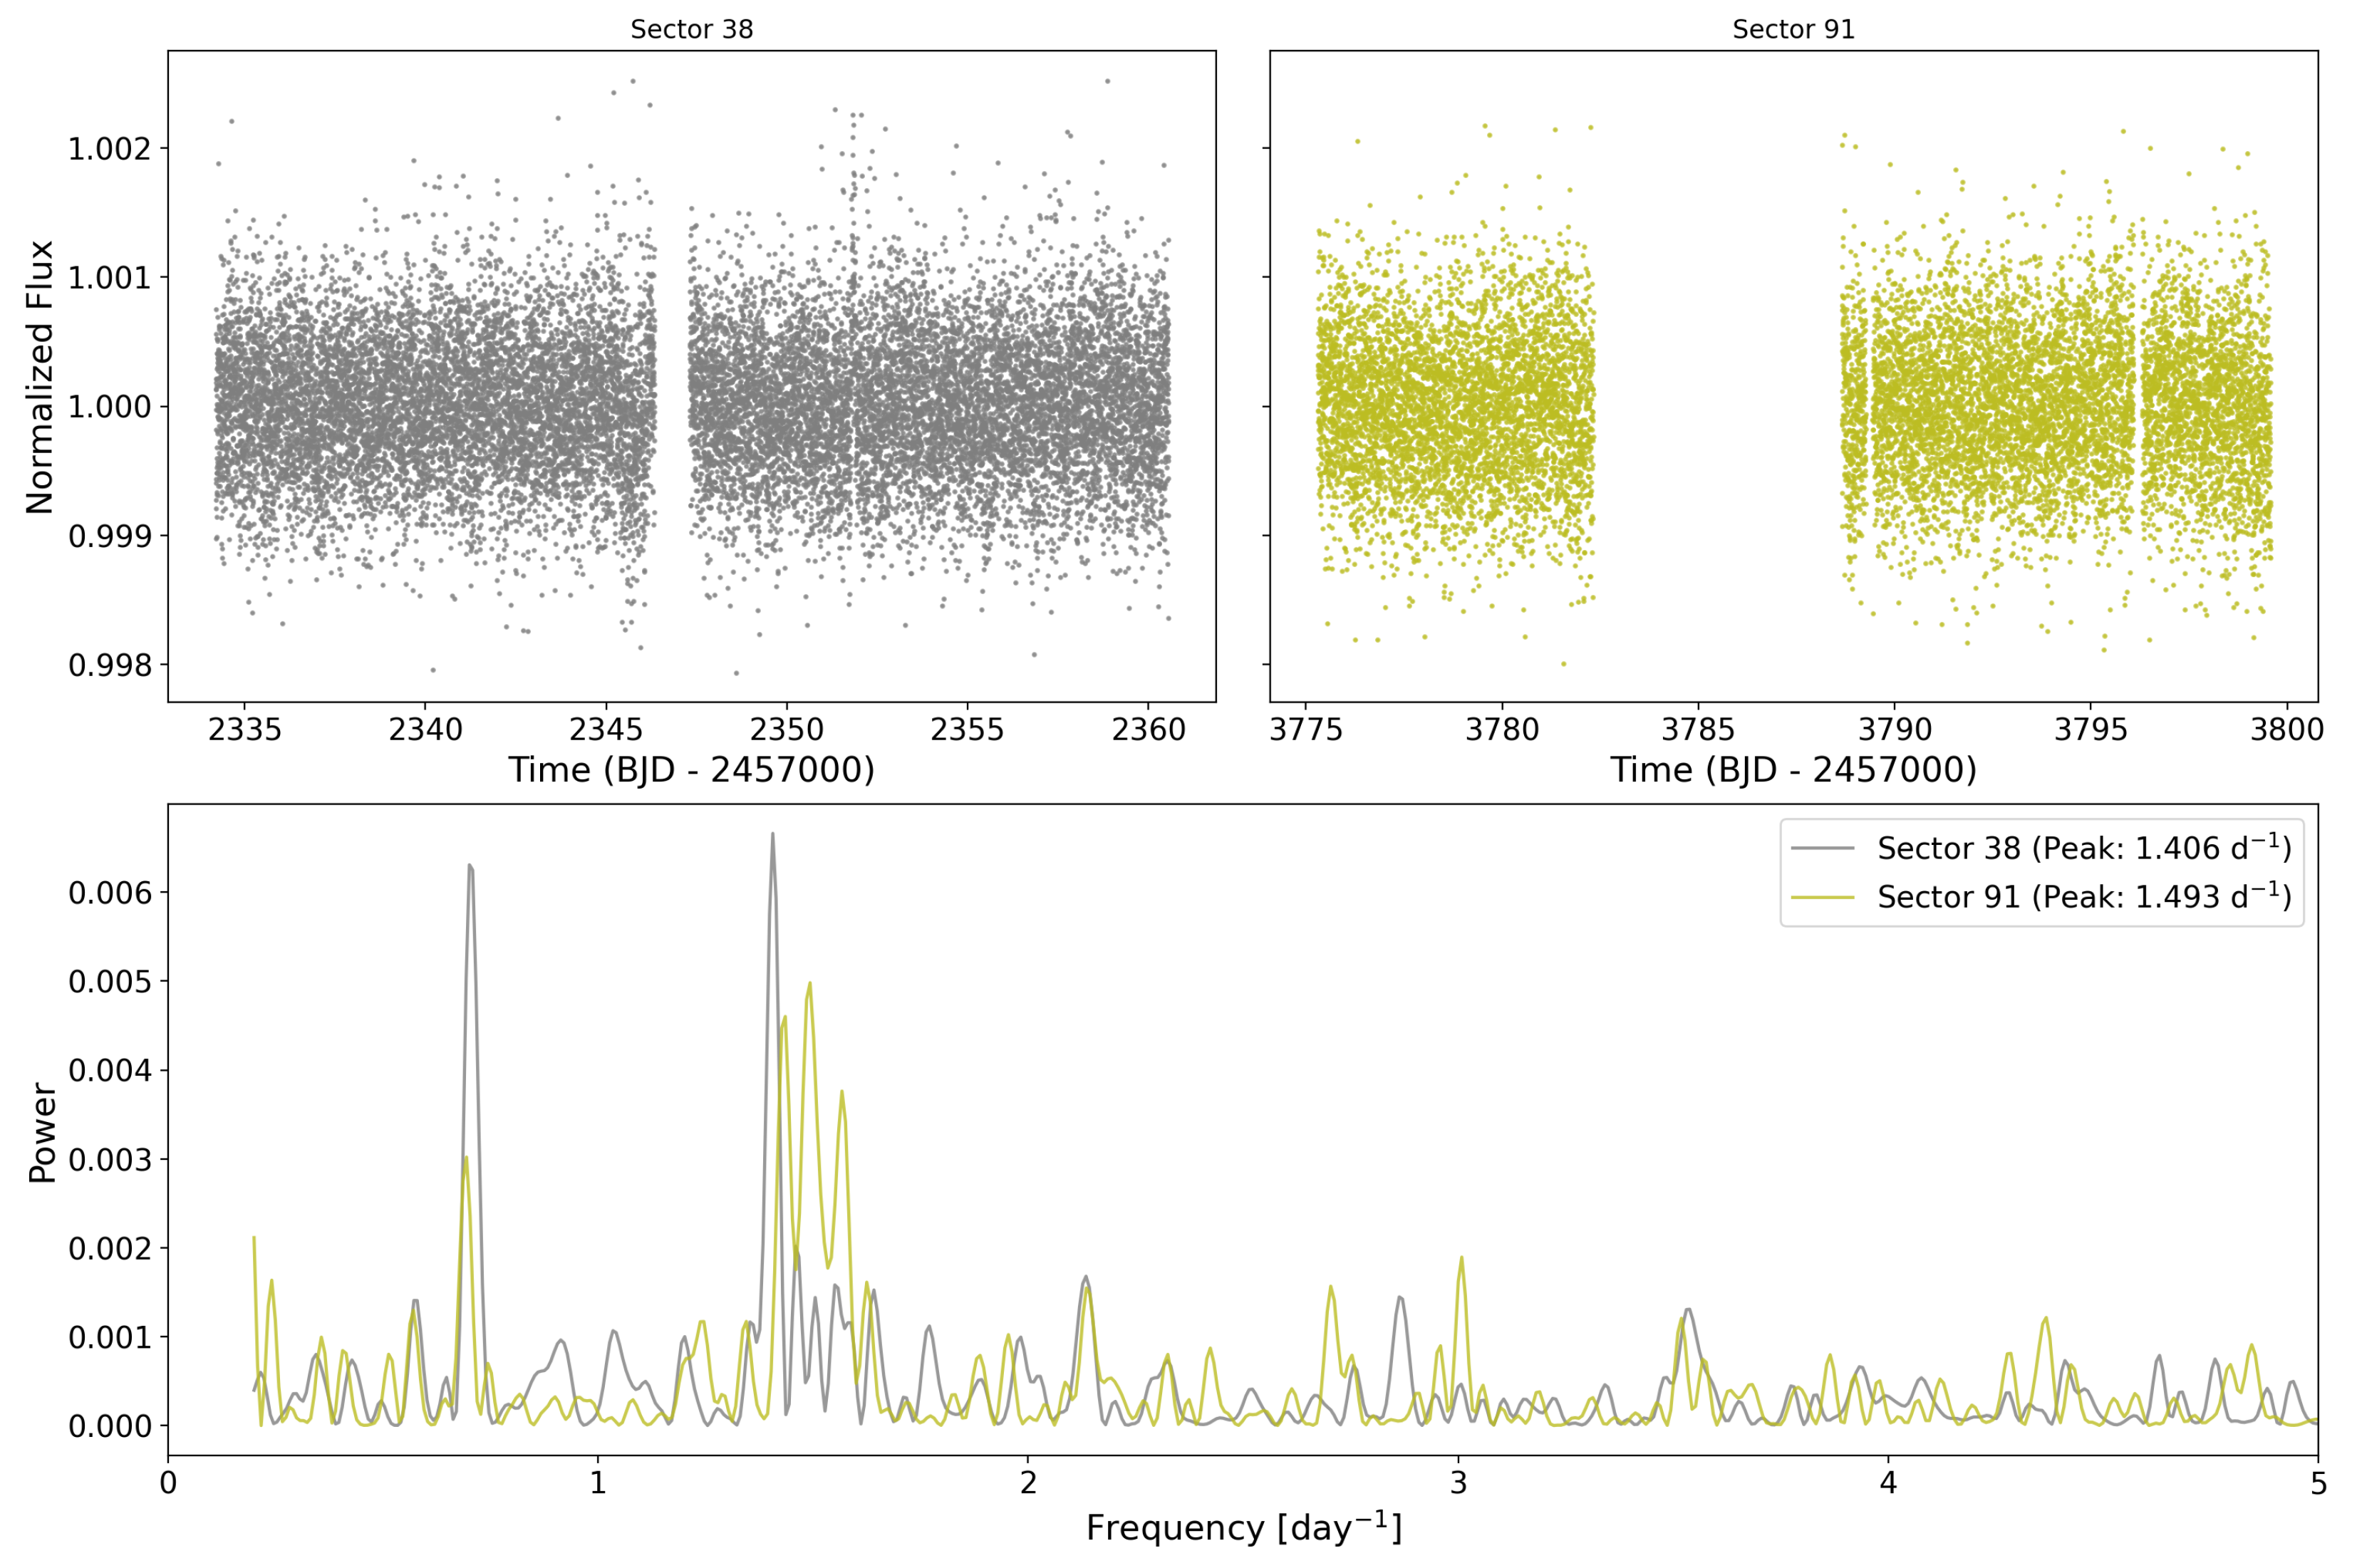
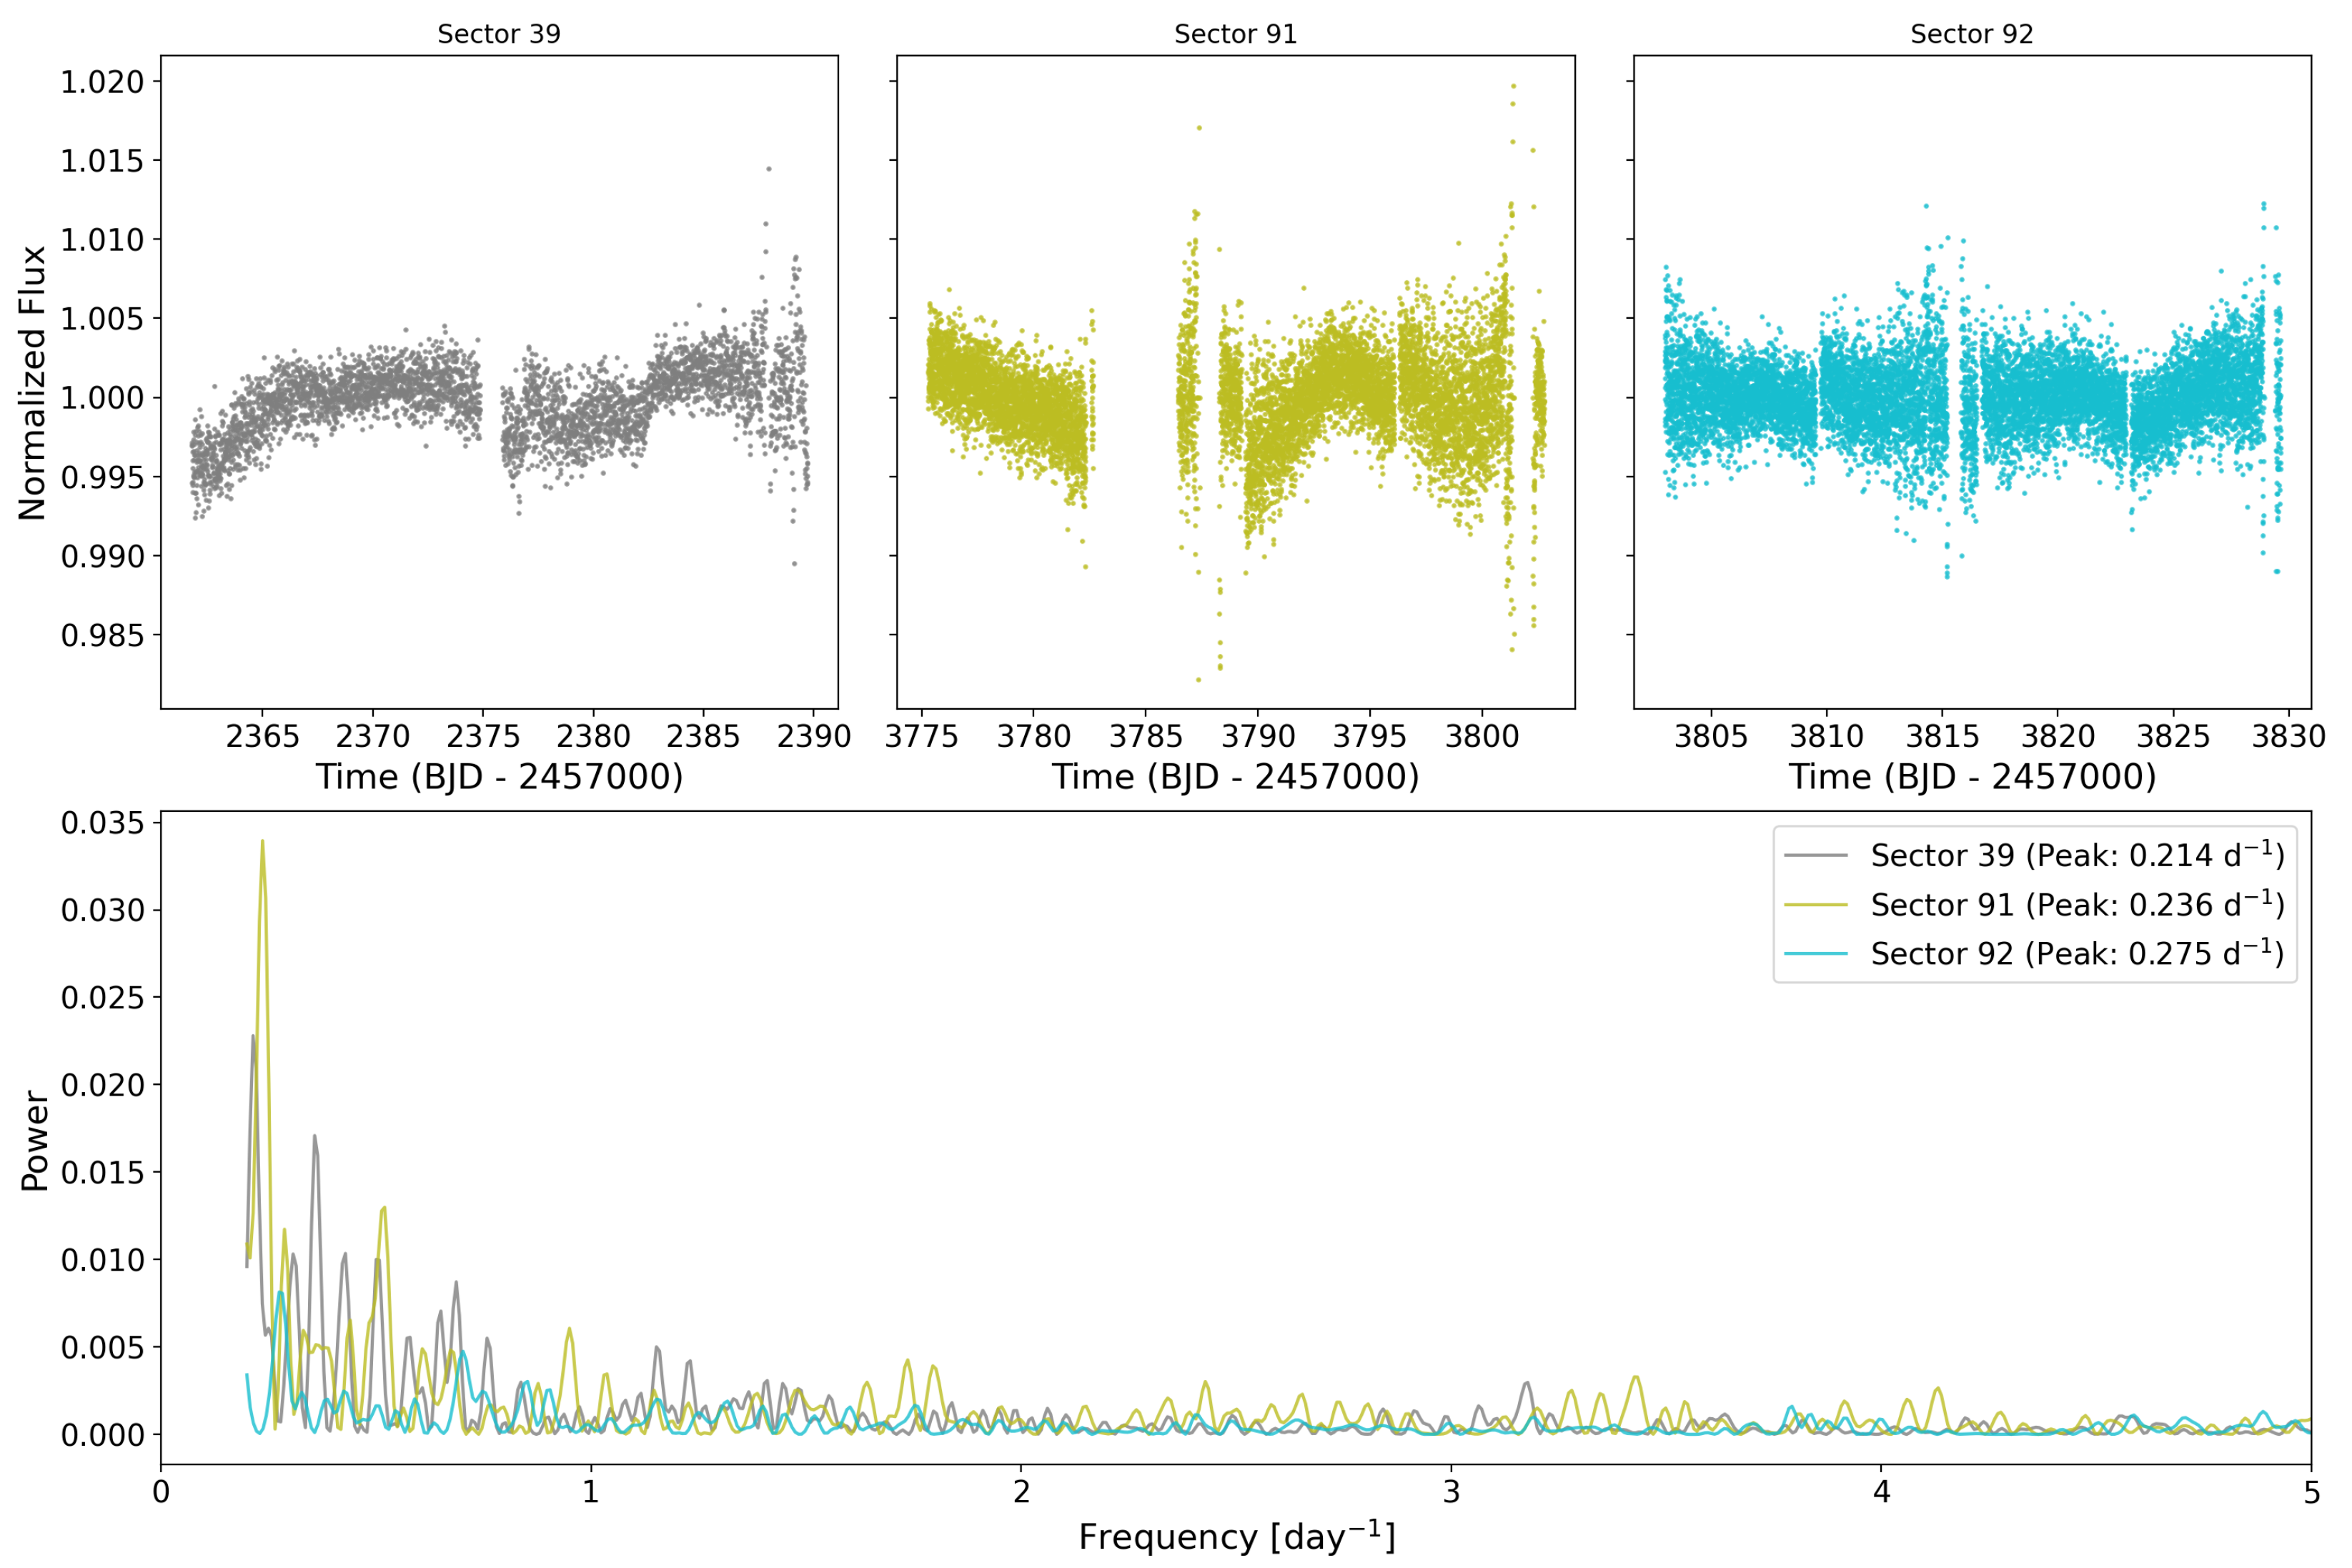
TESS photometry also reveals the same dominant pulsation frequencies identified in the K2 data, although with lower photometric precision (see
Appendix B).
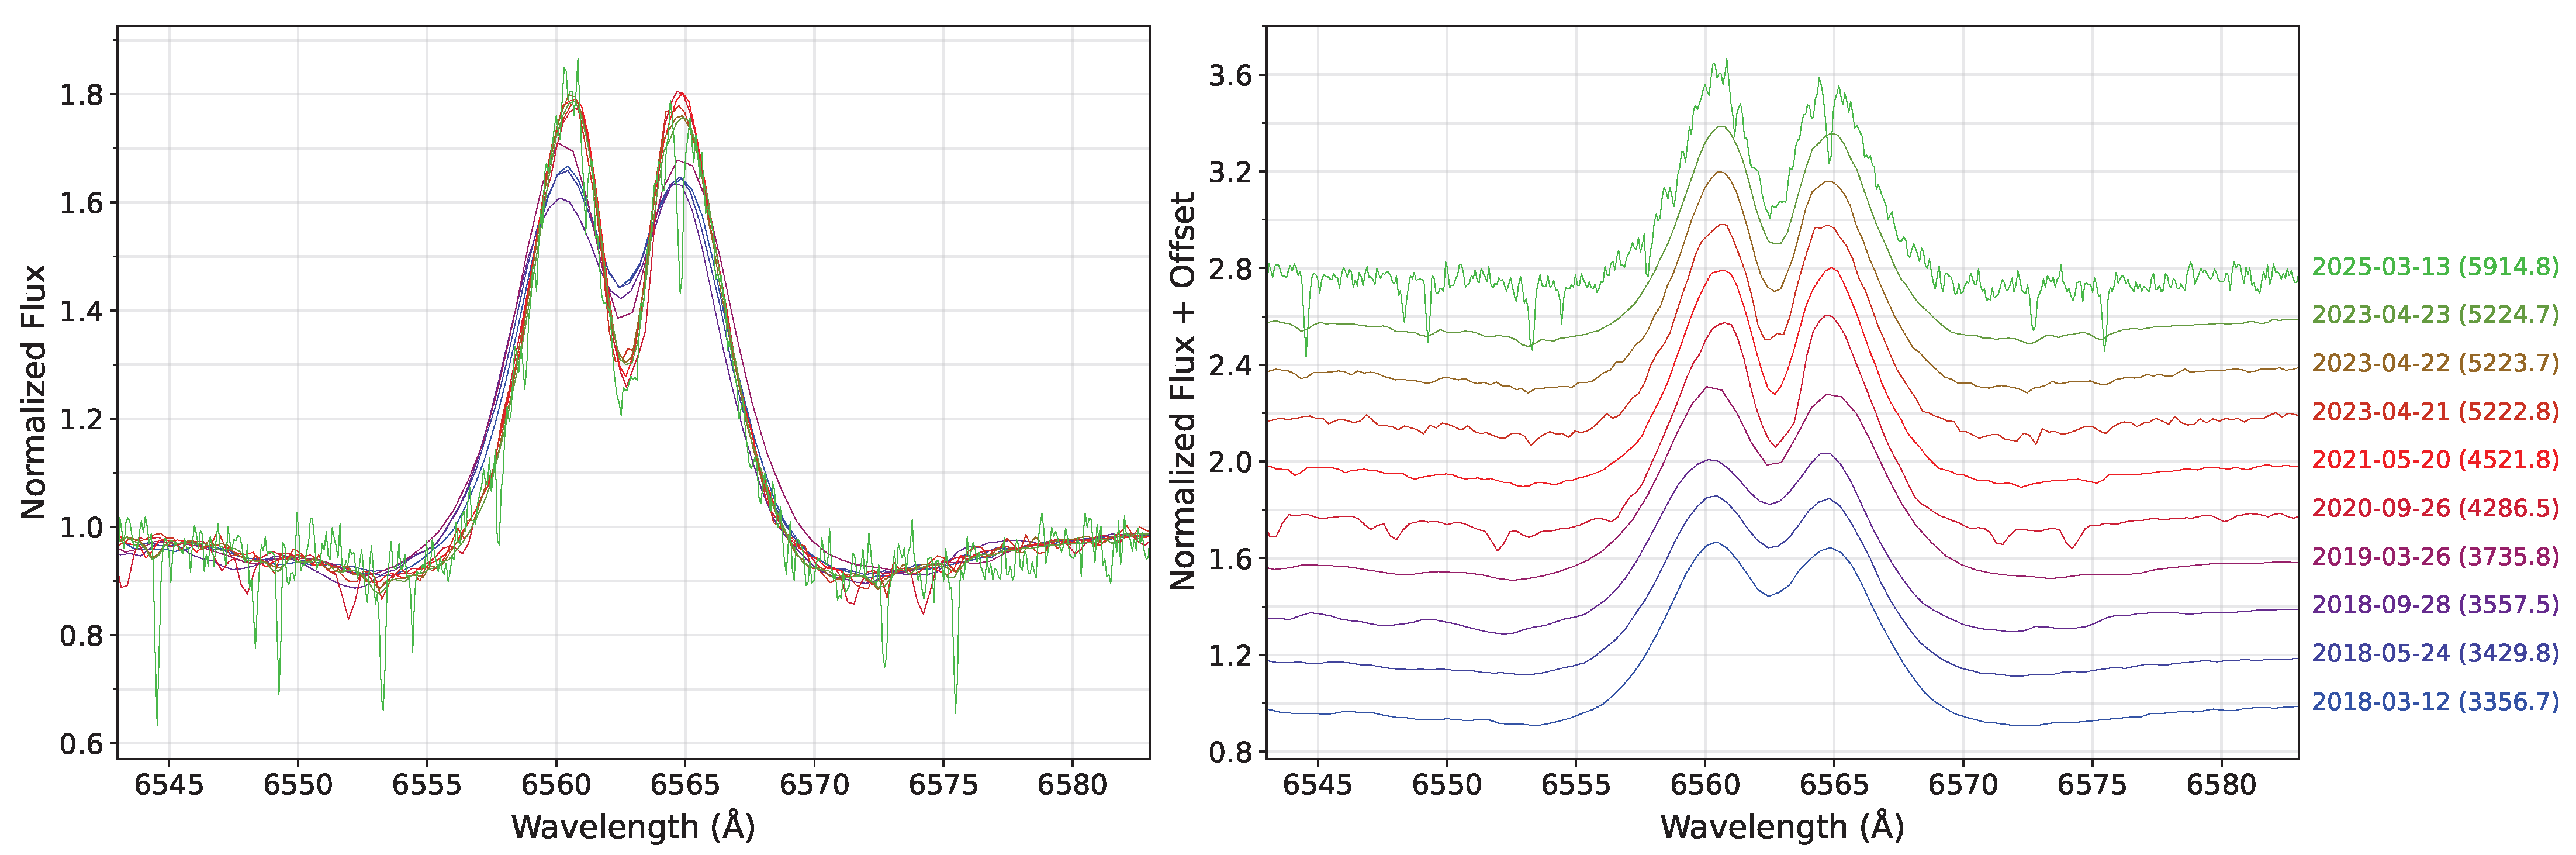
Multi-epoch spectroscopic observations of HD 155291 obtained over a multi-year baseline reveal persistent H
emission, confirming its Be-star nature. The first H
spectrum of this star was obtained in March 2018, when a strong emission profile was observed. Subsequent observations were obtained at eight distinct epochs over the following years, with the last observation carried out in March 2025. Over this interval, the H
line profile exhibits measurable variability in both width and shape. The temporal evolution of the H
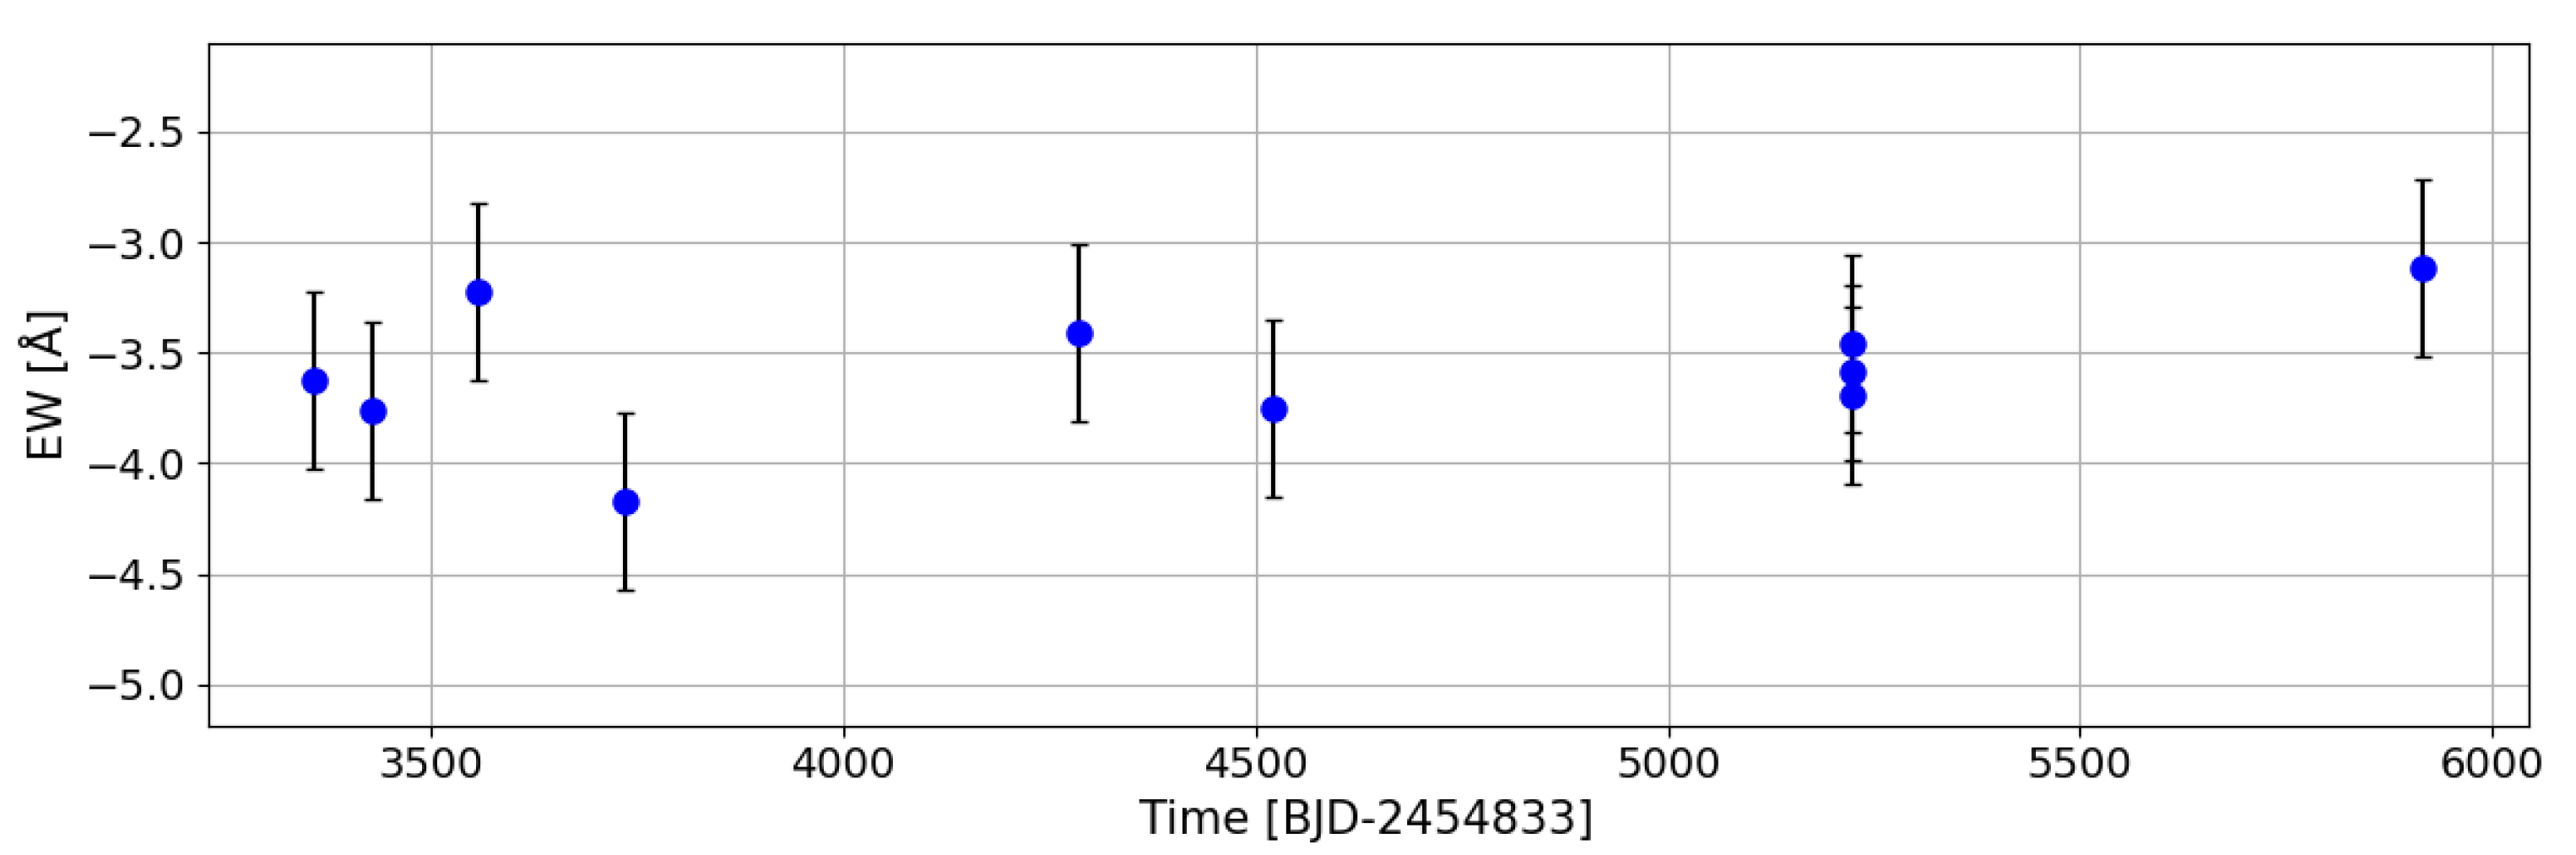
equivalent width (EW) indicates systematic variations on timescales much longer than those sampled by the K2 photometry, providing evidence for long-term changes in the circumstellar environment rather than a static emission configuration (
Figure 2).
HD 155291 exhibits photometric variability on timescales of hours, as revealed by K2 observations, and long-term spectroscopic variability of the H line monitored over several years. The frequency spectrum of the K2 light curve is dominated by two closely spaced frequencies around 1.7 cycles per day, corresponding to characteristic periods of approximately 14 h. The proximity of these frequencies produces a clear beating pattern in the time-domain light curve, characterized by periodic modulation of the variability amplitude. In addition to the fundamental frequencies, significant power is detected at the first harmonic, consistent with coherent pulsational variability.
While the photometric signal’s frequency content remains stable throughout the K2 campaign, the light curve exhibits pronounced amplitude modulation due to beating between closely spaced frequencies. In contrast, the H
measurements reveal substantial variations in the equivalent width (EW) (
Figure 3) of the emission line over the seven-year spectroscopic baseline, indicating long-term changes in the circumstellar disk. Taken together, the photometric and spectroscopic observations establish HD 155291 as a Be star exhibiting variability on multiple temporal scales, providing observational context for exploring possible links between short-term stellar variability and longer-term disk evolution.
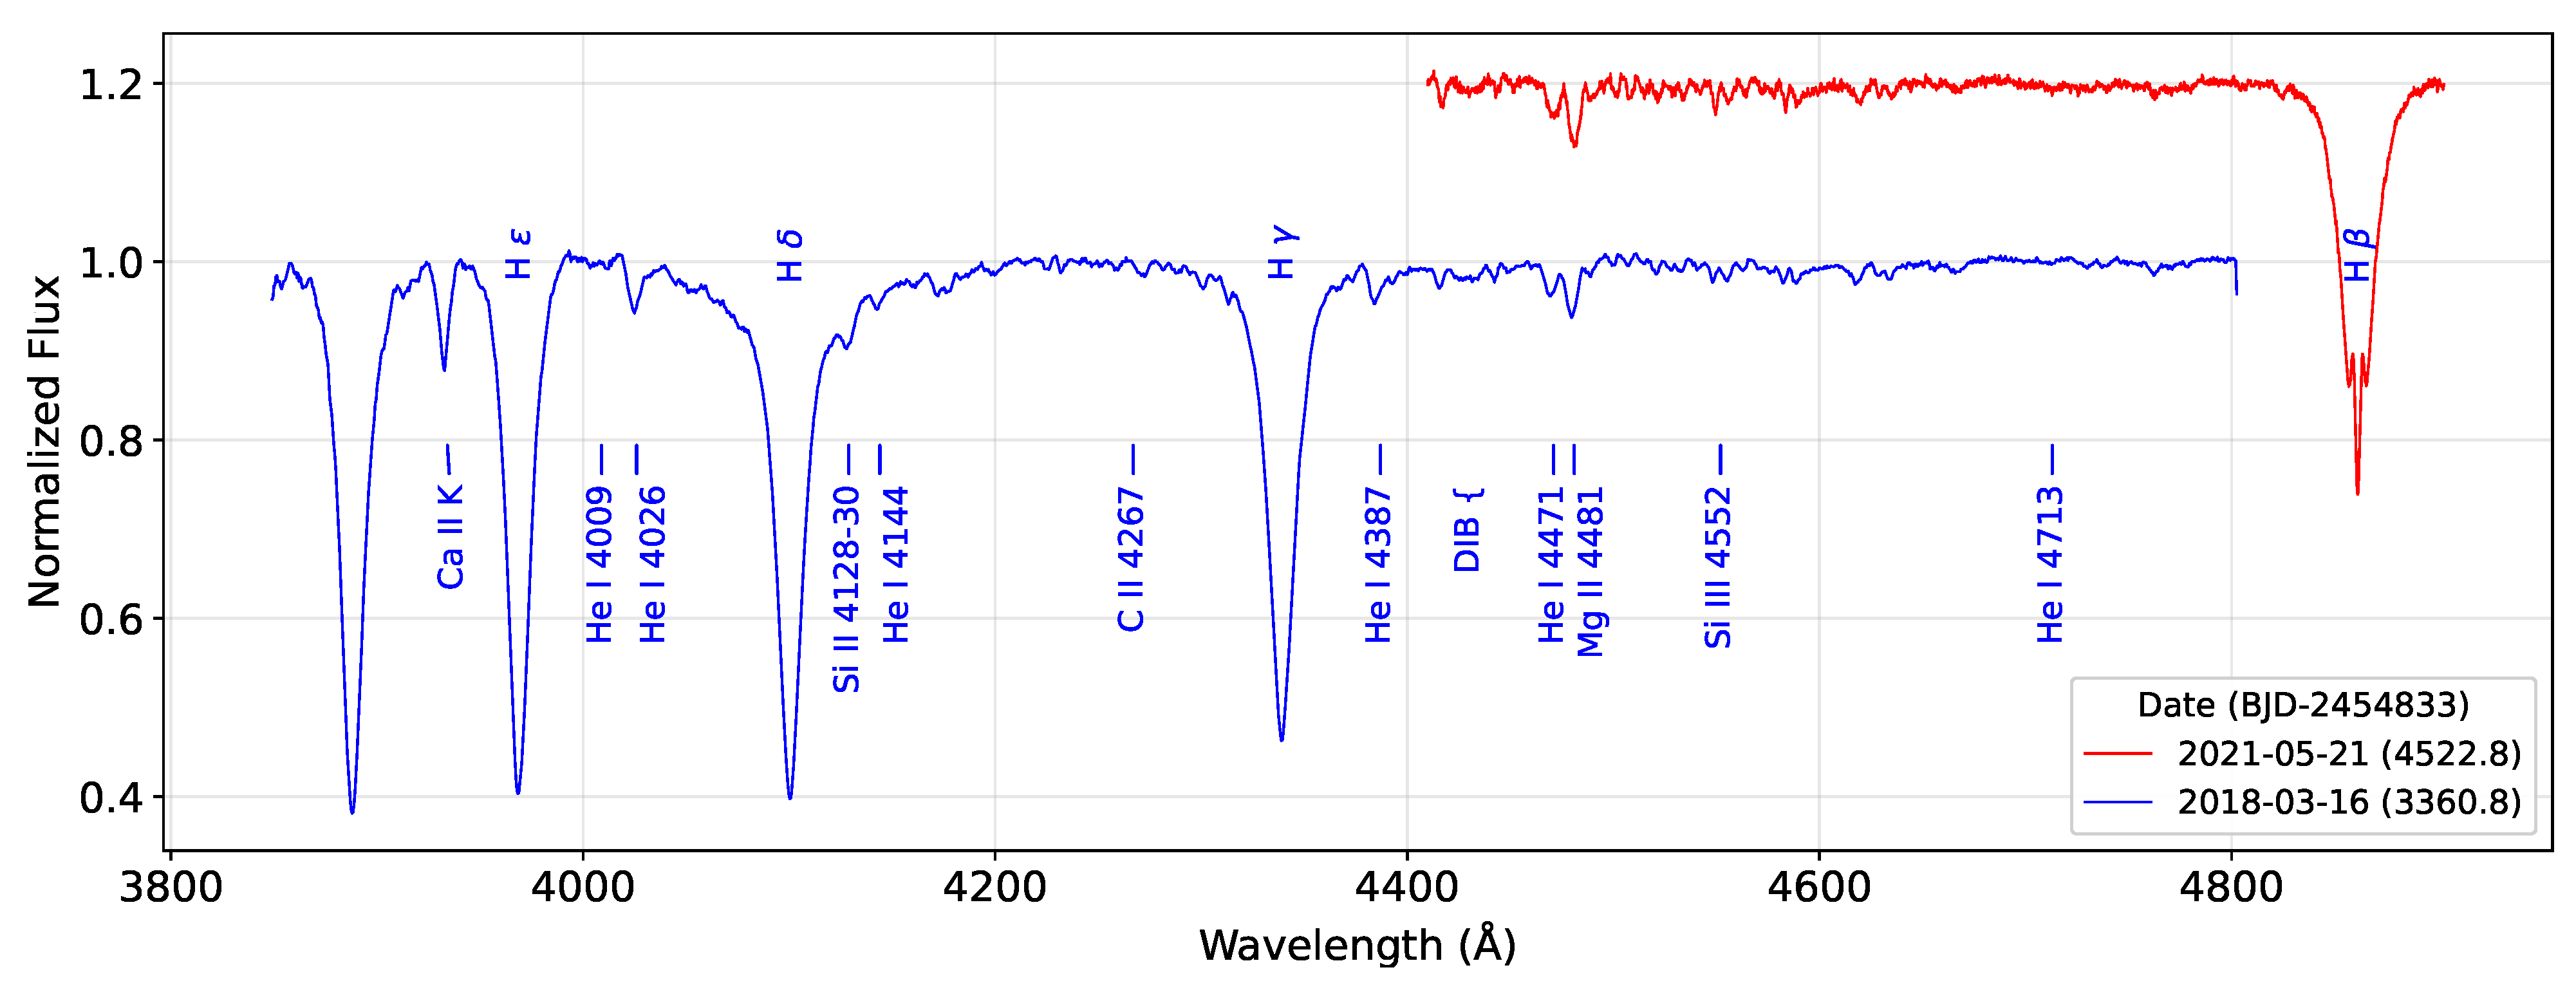
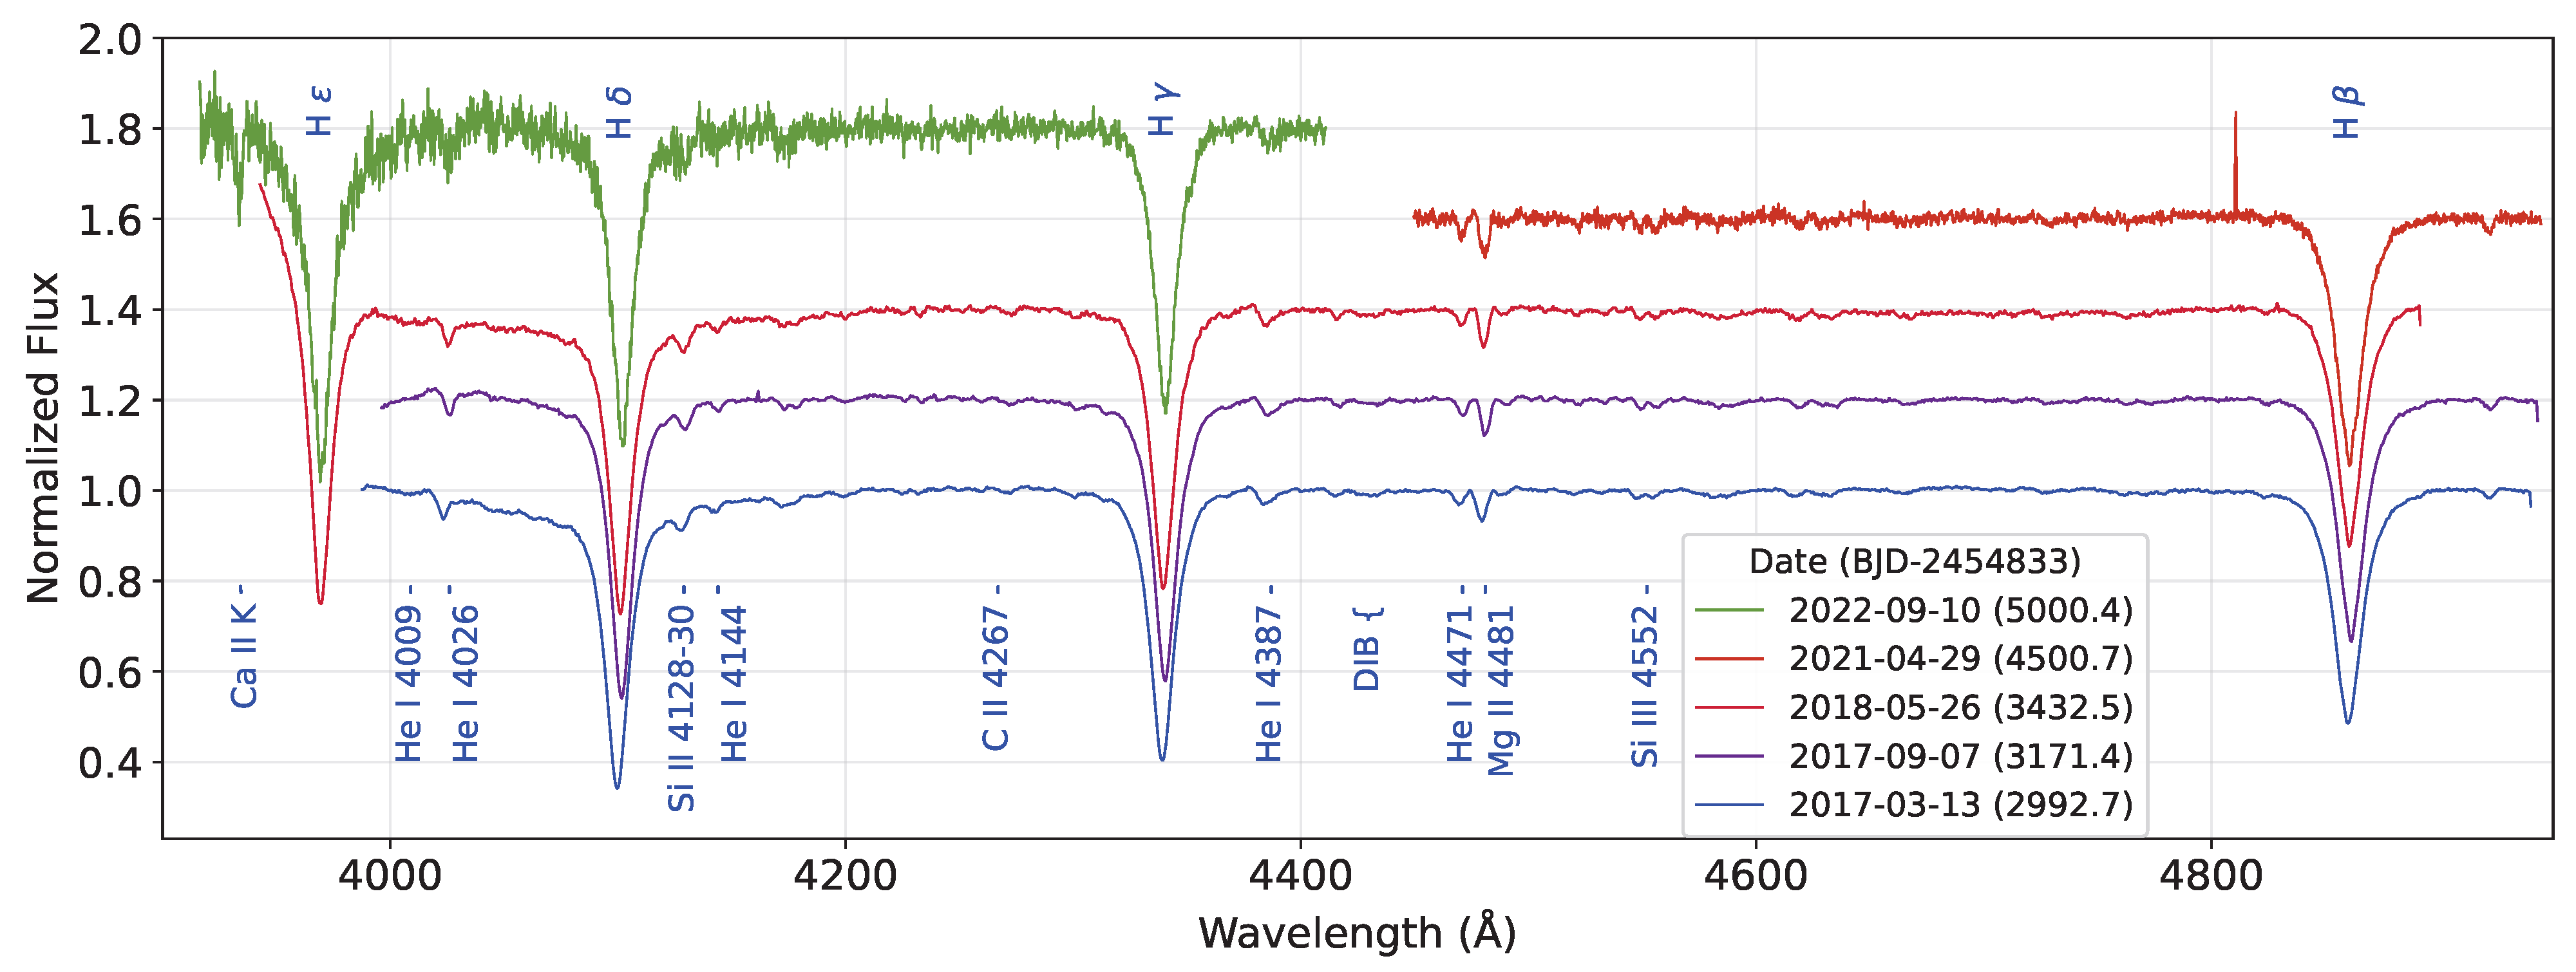
Additional information on the stellar photospheric properties of HD 155291 is provided by blue-region spectroscopy obtained at different epochs.
Figure 4 shows representative normalized spectra covering key diagnostic lines of hydrogen and helium commonly used for spectral classification and atmospheric analysis in B-type stars. These data allow a qualitative assessment of the photospheric line profiles. Classical stellar classification criteria based on the appearance of the Balmer line wings and He I, OII, Si III and Mg II line ratios ([
30,
31,
32] and references in these papers) were applied to the blue spectrum of
Figure 4. Our classification indicates a B8III stellar type.
3.2. HD 159571
HD 159571 (EPIC 240541552, TIC 199983403) is classified as a B8V star [
29] with apparent visual magnitude
mag. The Kepler space telescope observed the star during K2 Campaign 11.
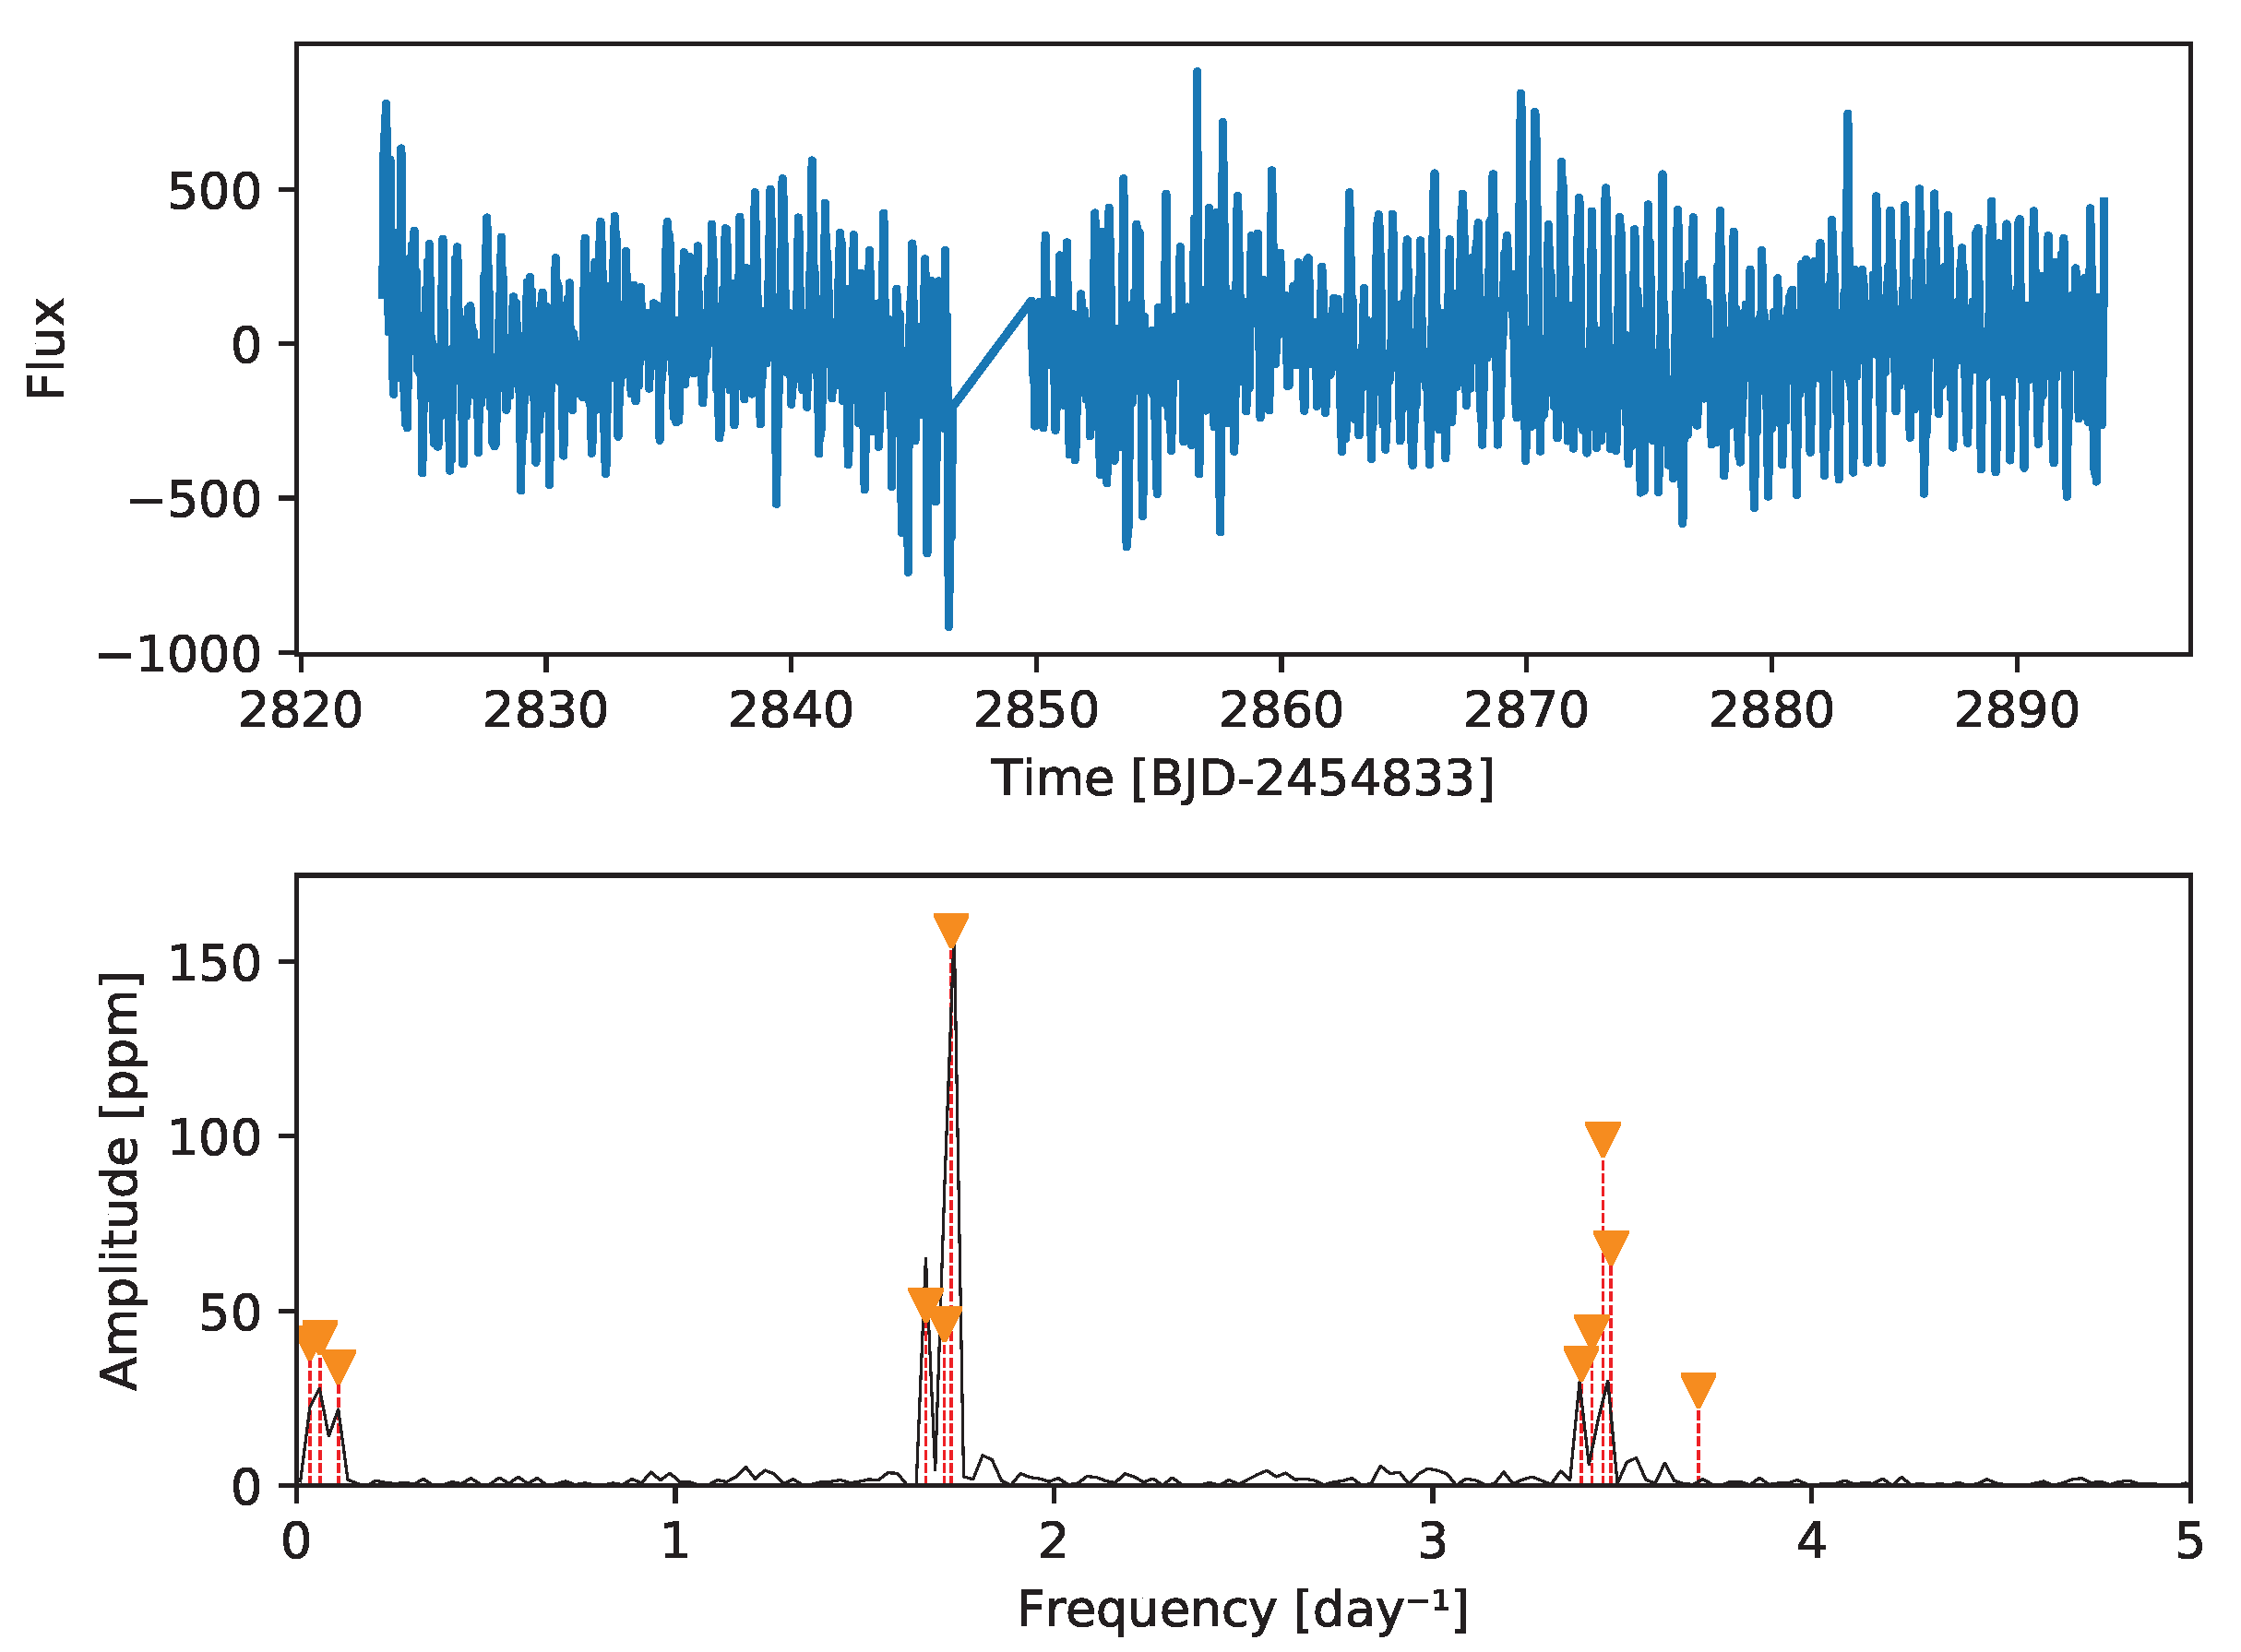
High-precision K2 photometry reveals clear brightness variability in HD 159571 on timescales of hours to a few days. The K2 light curve and corresponding Lomb–Scargle frequency spectrum are shown in
Figure 5. The frequency spectrum is dominated by low-frequency power, with additional significant peaks around 2.5 and 3 day
−1 which are characteristic of non-radial pulsations commonly observed in classical Be stars and can produce beating patterns in the light curve through the interference of closely spaced pulsation modes [
1,
12,
33].
The main pulsation frequencies detected in the K2 data are also recovered in the available TESS observations, albeit with lower photometric precision (see
Appendix B).
Stochastic low-frequency variability (SLF) refers to a type of photometric variability characterized by a broad excess of power at low frequencies in the Fourier spectrum, typically between about 0.1 and 10 day
−1, without clearly defined coherent peaks. In the time domain, SLF variability appears as low-amplitude brightness fluctuations occurring on timescales from hours to weeks. This phenomenon was first reported in massive O-type stars observed by the CoRoT mission [
34] and has since been detected in a wide range of upper main-sequence stars observed with space missions such as CoRoT, Kepler/K2, and TESS [
35,
36,
37]. SLF-type variability was also observed in nearly half of a sample of SPB stars analyzed from K2 Campaign 11 by Pereira et al. [
15]. The physical origin of SLF variability remains under investigation, but it is commonly interpreted as the photometric signature of internal gravity waves excited by turbulent core convection or subsurface convection zones. The excess low-frequency power observed in the K2 periodogram of HD 159571 may therefore reflect SLF-type variability, although contributions from rotational modulation, residual instrumental systematics, or long-term trends that were not fully removed by the pipeline cannot be completely excluded.
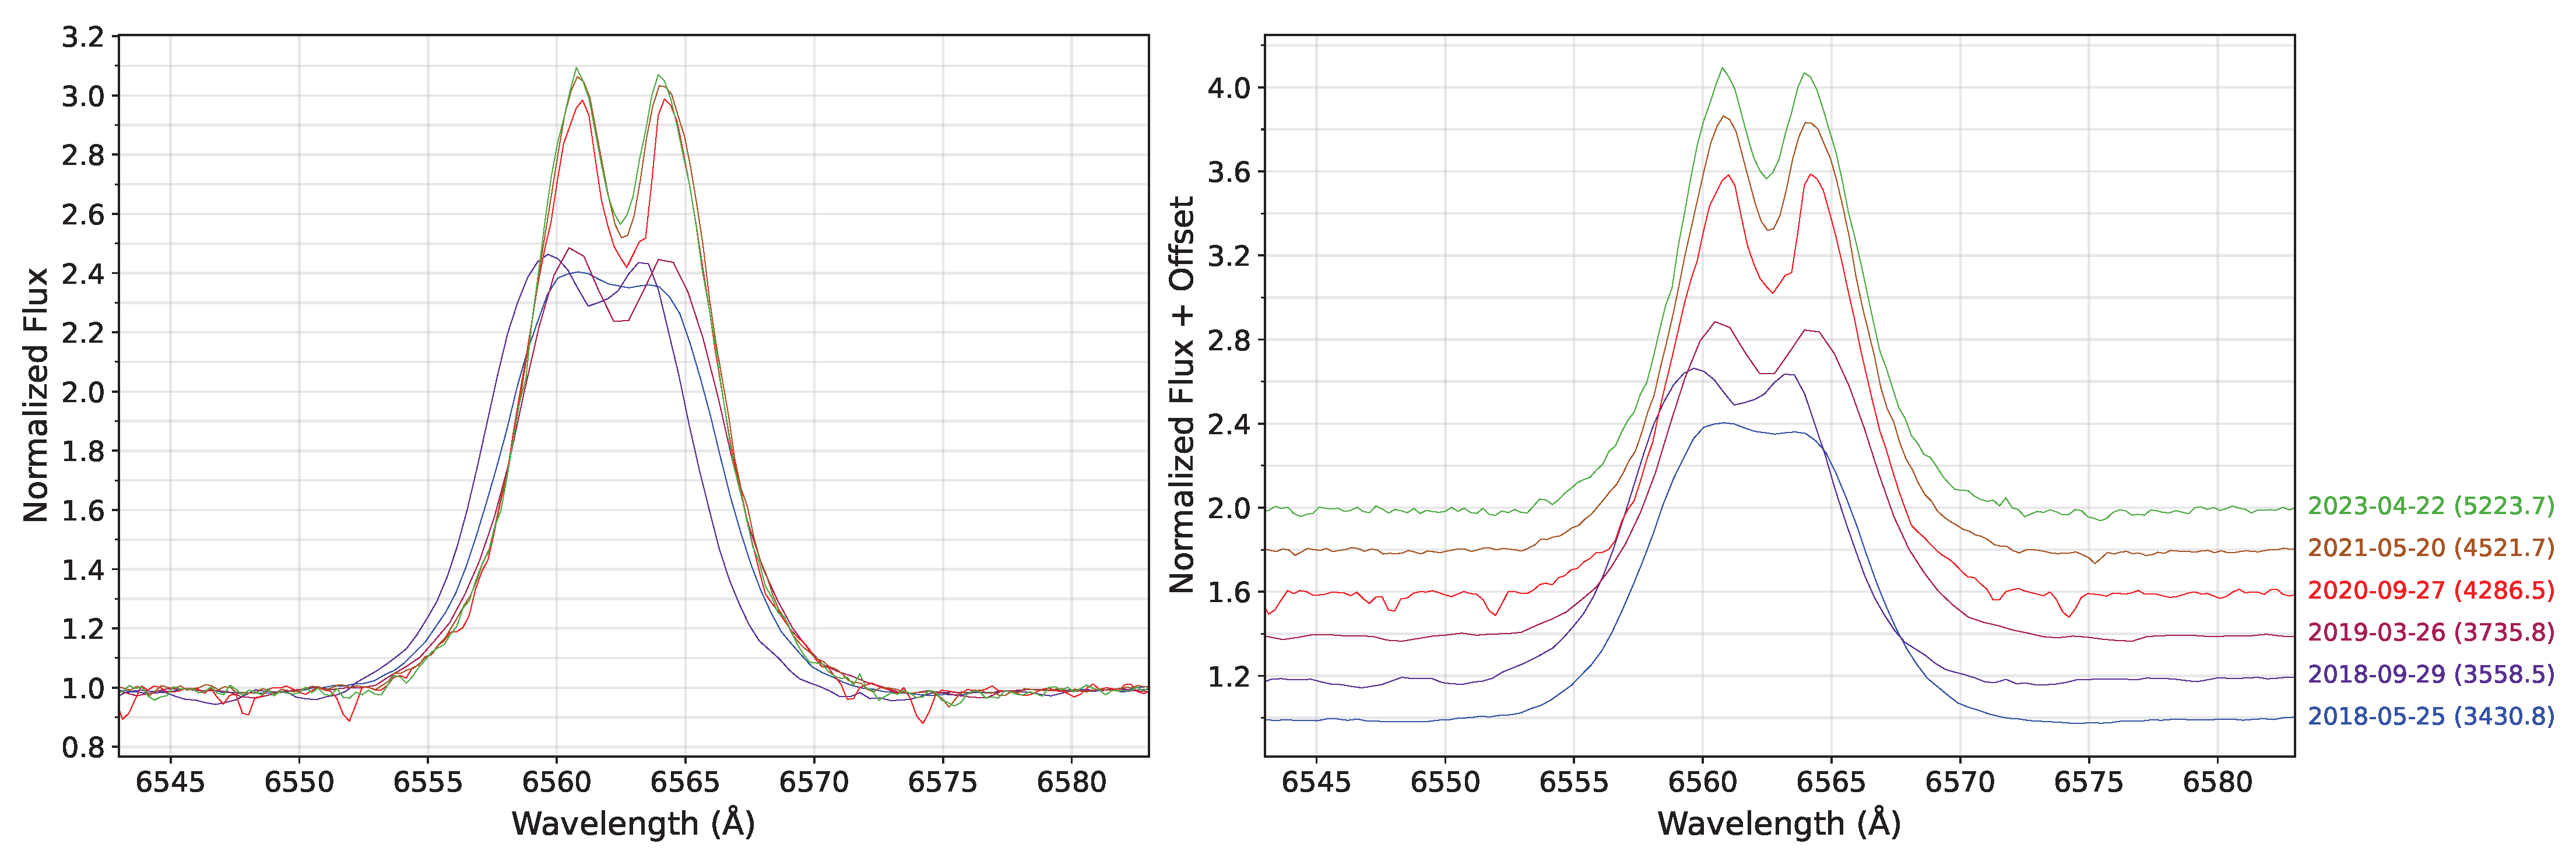
Multi-epoch spectroscopic observations of HD 159571 obtained over several years reveal persistent H
emission, confirming its Be-star nature. The H
line was first observed in emission in May 2018 and subsequently monitored at six epochs until April 2023. The normalized H
profiles are presented in
Figure 6, where clear variations in line shape and width are evident across the observing period.
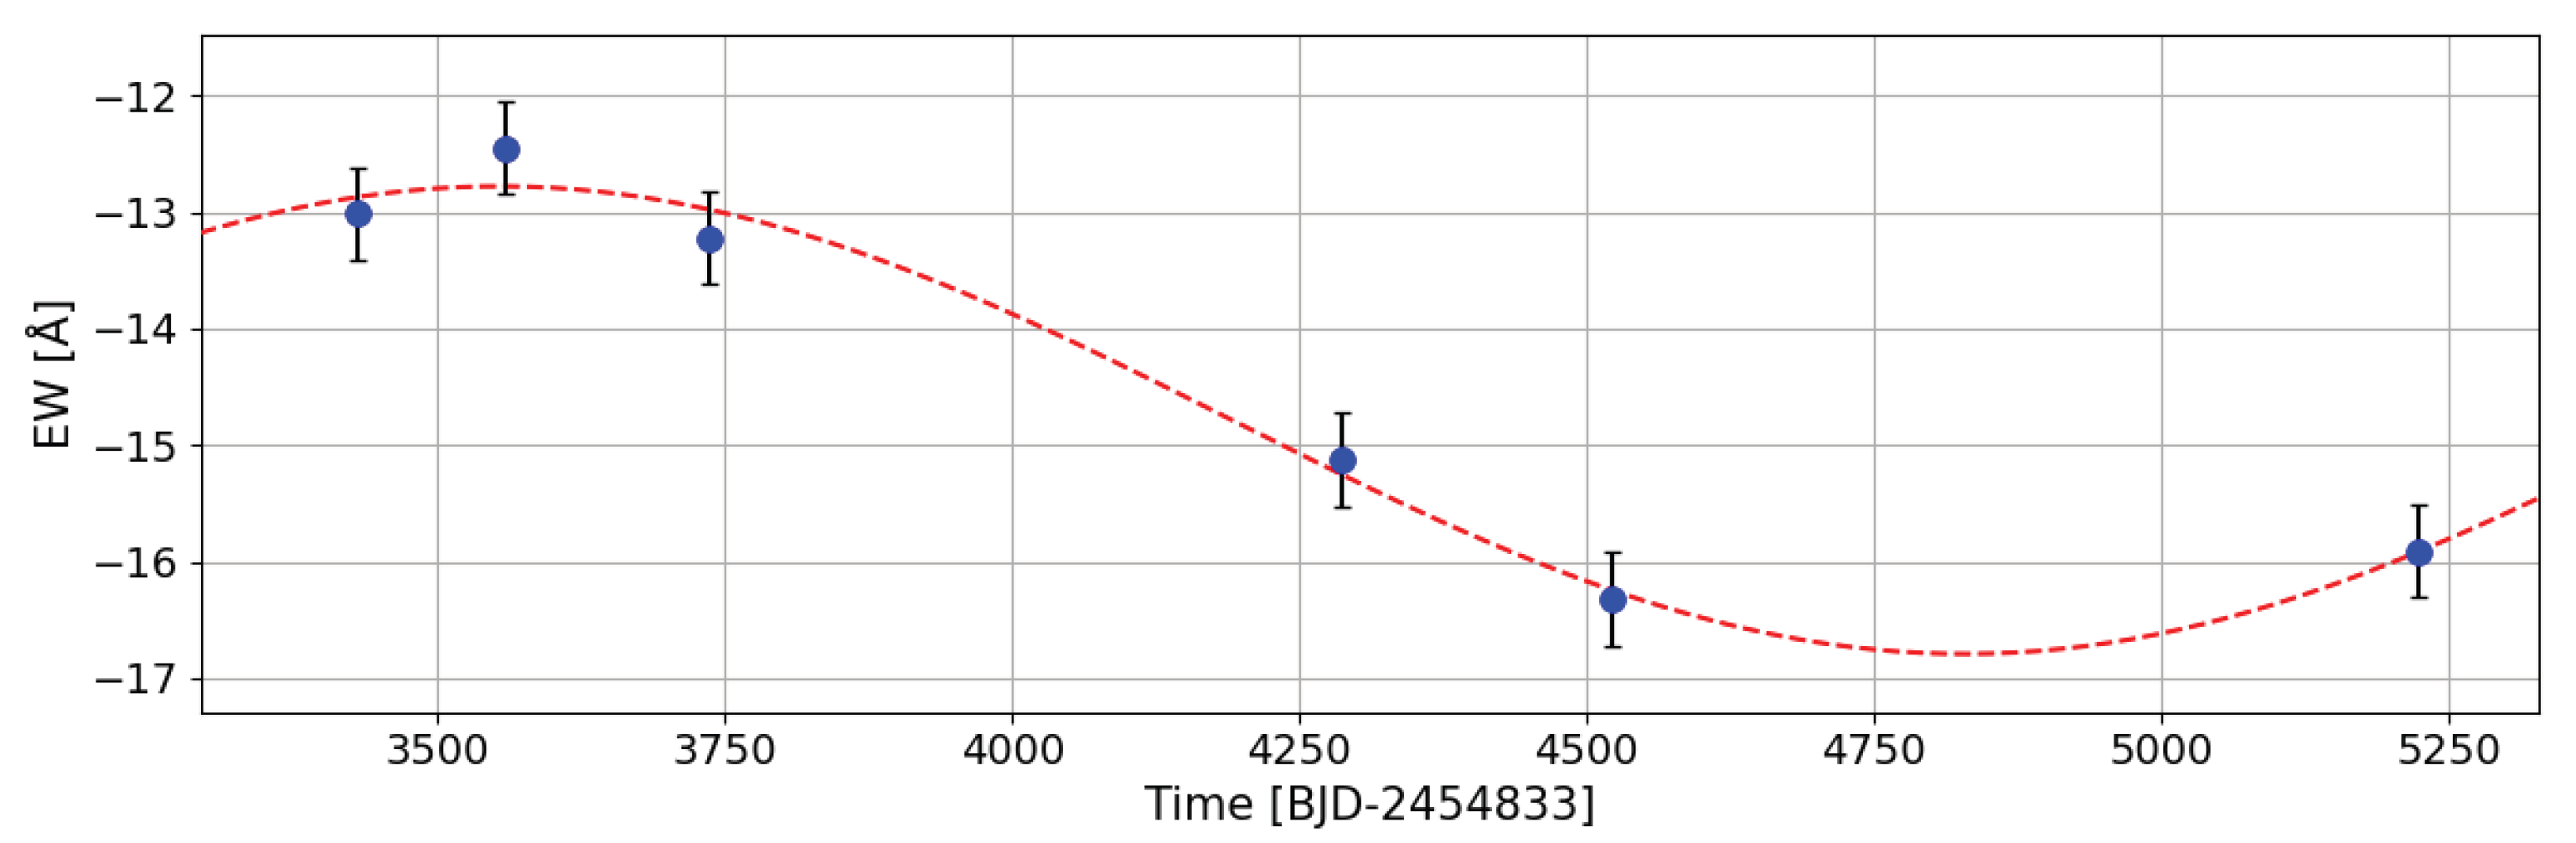
The temporal evolution of the H
equivalent width, shown in
Figure 7, indicates variability on timescales of years. A sinusoidal function with a period of approximately 2550 days can be fitted to the current dataset (
), but this should be regarded primarily as a descriptive representation rather than evidence for a stable periodic cycle, particularly given the limited temporal coverage and the relatively small number of spectroscopic epochs. Long-term quasi-cyclic variations in H
emission have been reported in several Be stars, including Pleione [
38,
39], although such behavior may arise from different mechanisms, including intrinsic disk evolution. At present, there is insufficient evidence to attribute the apparent modulation to binarity or any specific external influence. The spectroscopic data obtained in this study were optimized for monitoring H
emission and do not provide radial-velocity measurements of sufficient precision to test the binarity hypothesis. Continued spectroscopic monitoring will therefore be necessary to determine whether the observed pattern reflects a stable physical cycle or a transient manifestation of the complex, potentially stochastic variability inherent to Be-star disks.
A representative blue-region spectrum of HD 159571 obtained in 2018 is shown in
Figure 8. Applying the classical classification criteria described above results in a B8V spectral type, consistent with the literature classification [
29].
HD 159571 exhibits variability on multiple temporal scales, combining short-timescale photometric variability dominated by pulsational frequencies with long-term spectroscopic variability associated with changes in its circumstellar disk. The K2 photometry probes stellar variability on timescales of hours to days, while the multi-year H monitoring traces the slower evolution of the disk structure and kinematics. Together, these observations establish HD 159571 as a representative Be star in which stellar pulsations and circumstellar disk variability coexist, providing observational context for exploring possible links between short-term stellar variability and long-term disk evolution.
3.3. HD 138872
HD 138872 (EPIC 249150896, TIC 186902398) is classified as a B9 III star [
40] with apparent visual magnitude
mag. The star was observed by the Kepler space telescope during K2 Campaign 15, in a field located toward the constellation of Libra.
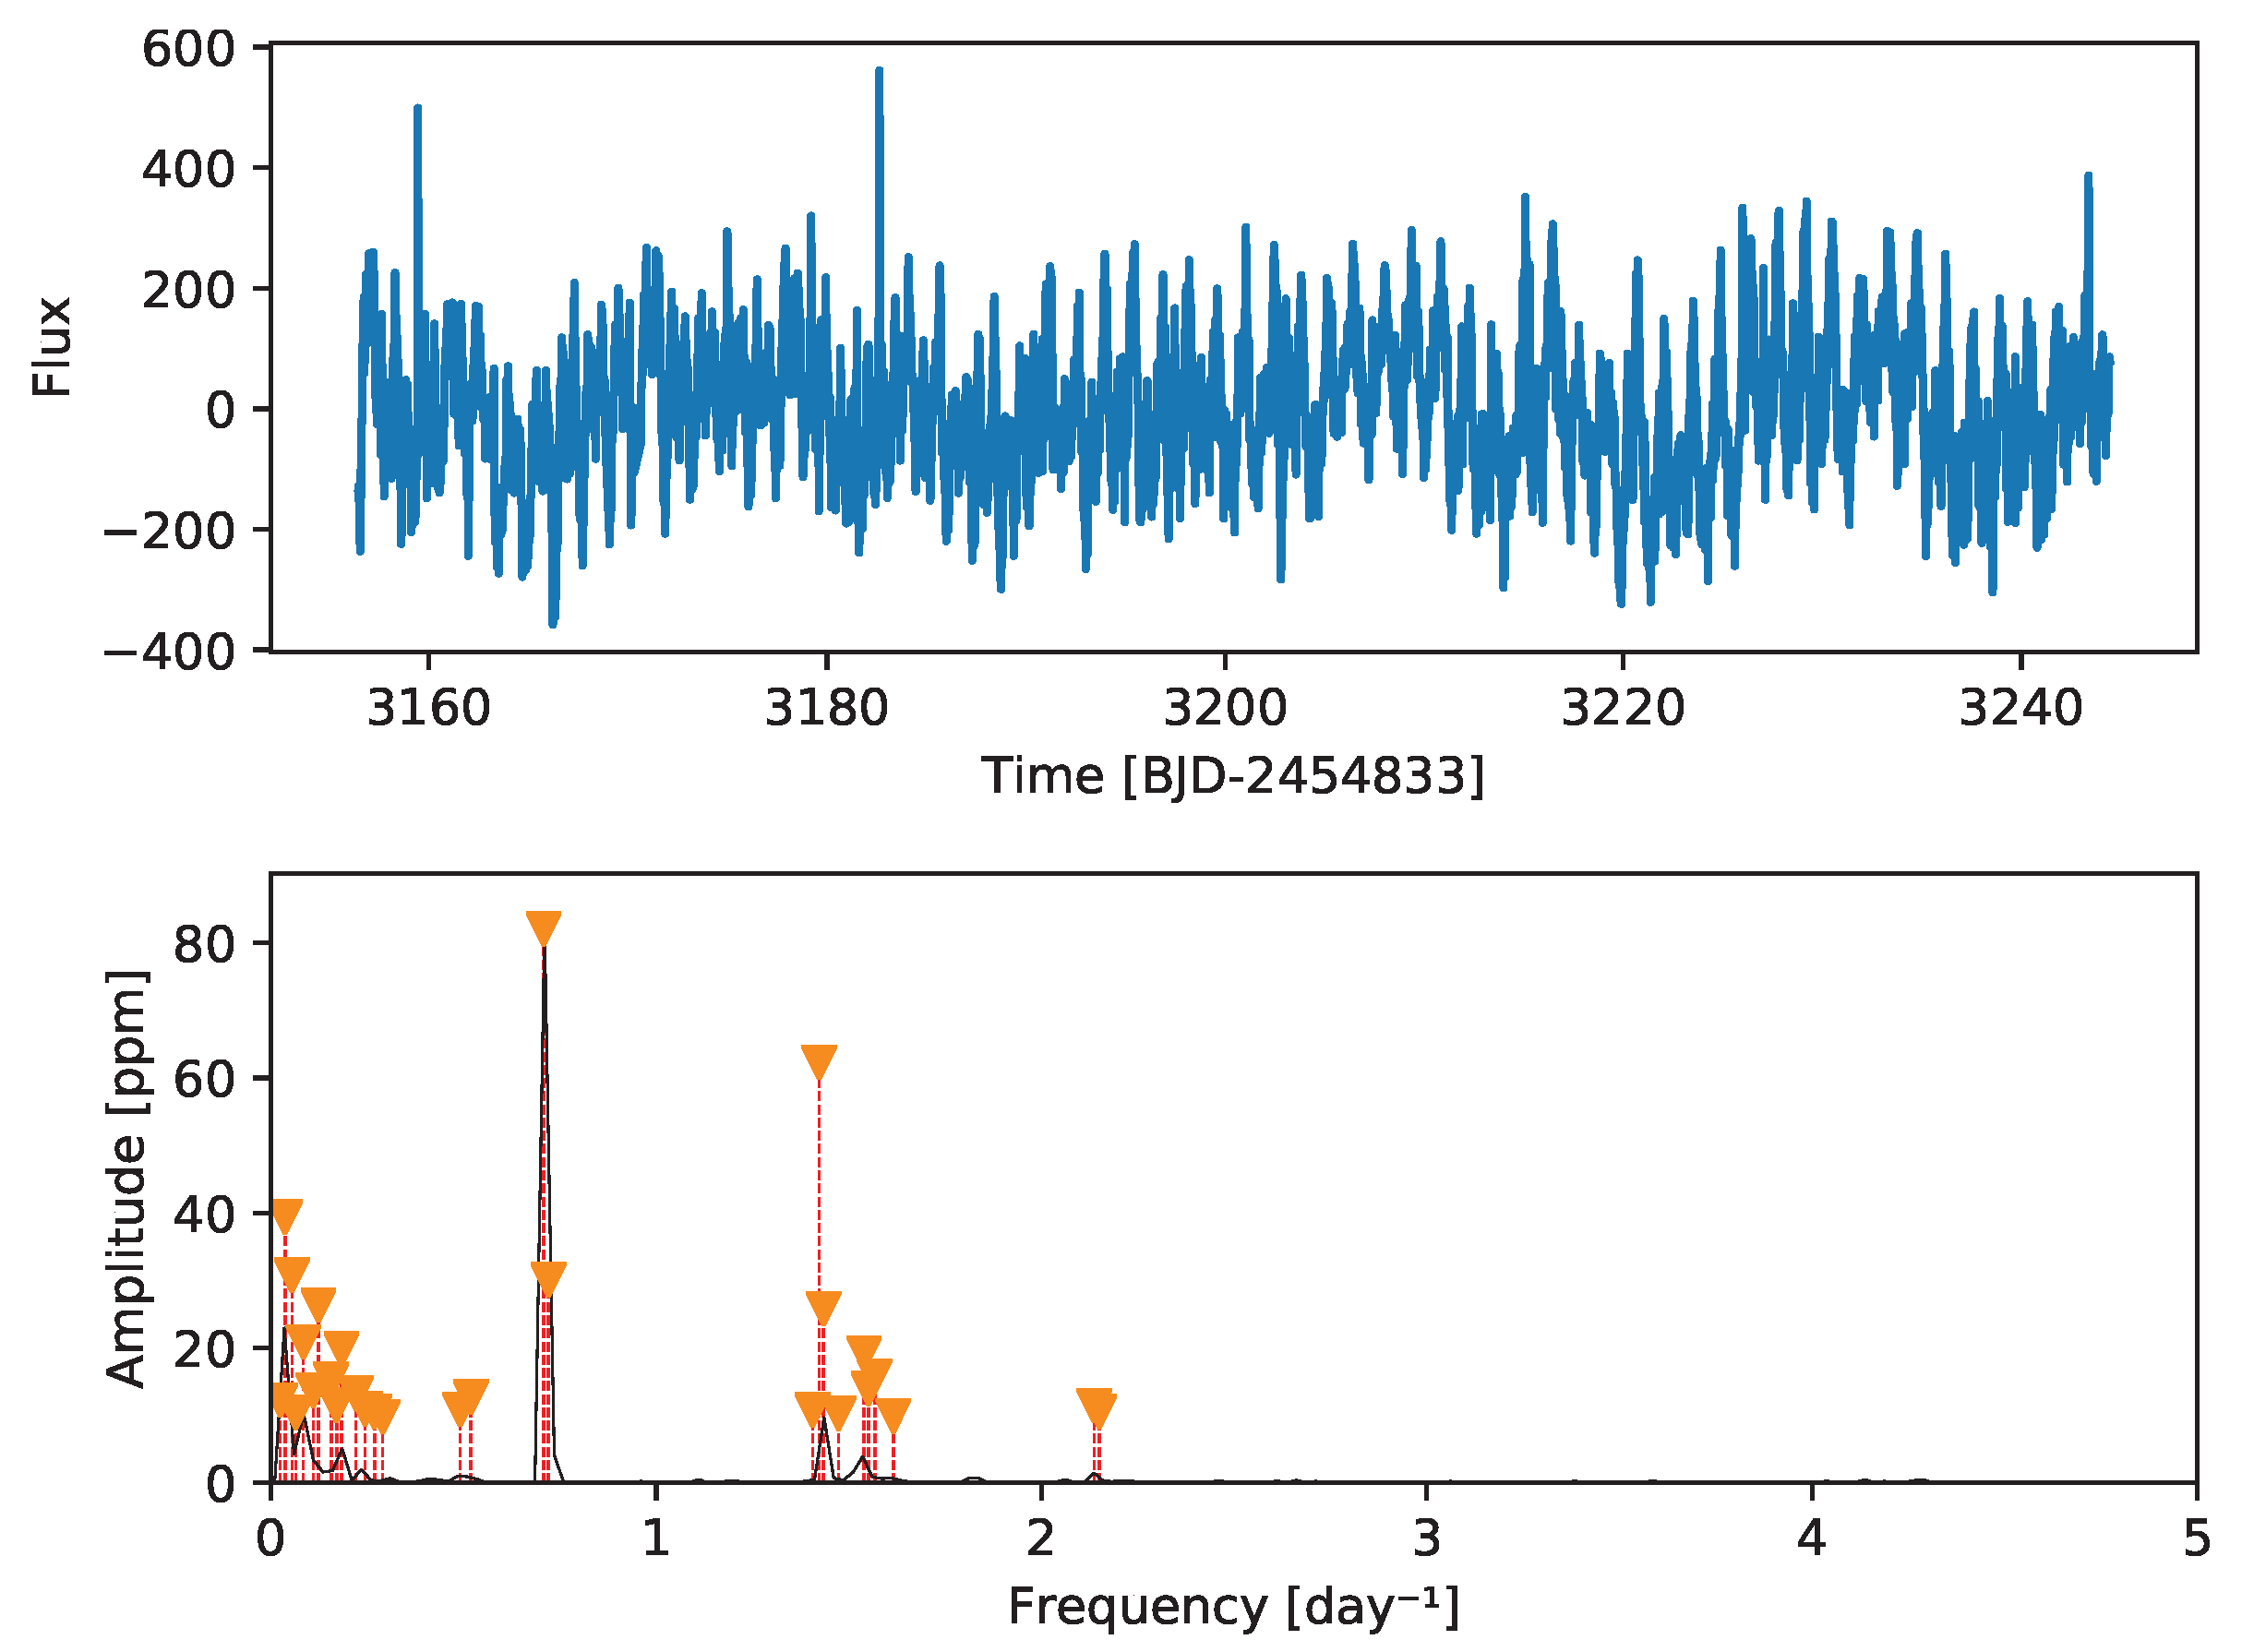
The K2 light curve of HD 138872 reveals photometric variability over the duration of Campaign 15, as shown in
Figure 9. The star exhibits only a few significant frequencies, and a prominent peak dominates the Lomb–Scargle frequency spectrum at 0.71 cycles day
−1, corresponding to a characteristic timescale of about 1.4 days. This frequency corresponds to the strongest photometric signal detected during the campaign. It is consistent with the variability commonly observed in Be stars, potentially due to non-radial pulsations or rotational modulation. Additional low-frequency power is also present, indicating the possible presence of SLF variability as discussed for HD 159571 above.
The dominant pulsation frequencies are likewise present in the available TESS photometry, although the overall data quality is lower than that of the K2 observations (see
Appendix B).
Multi-epoch spectroscopic monitoring of HD 138872 shows H
emission, confirming its Be-star nature.
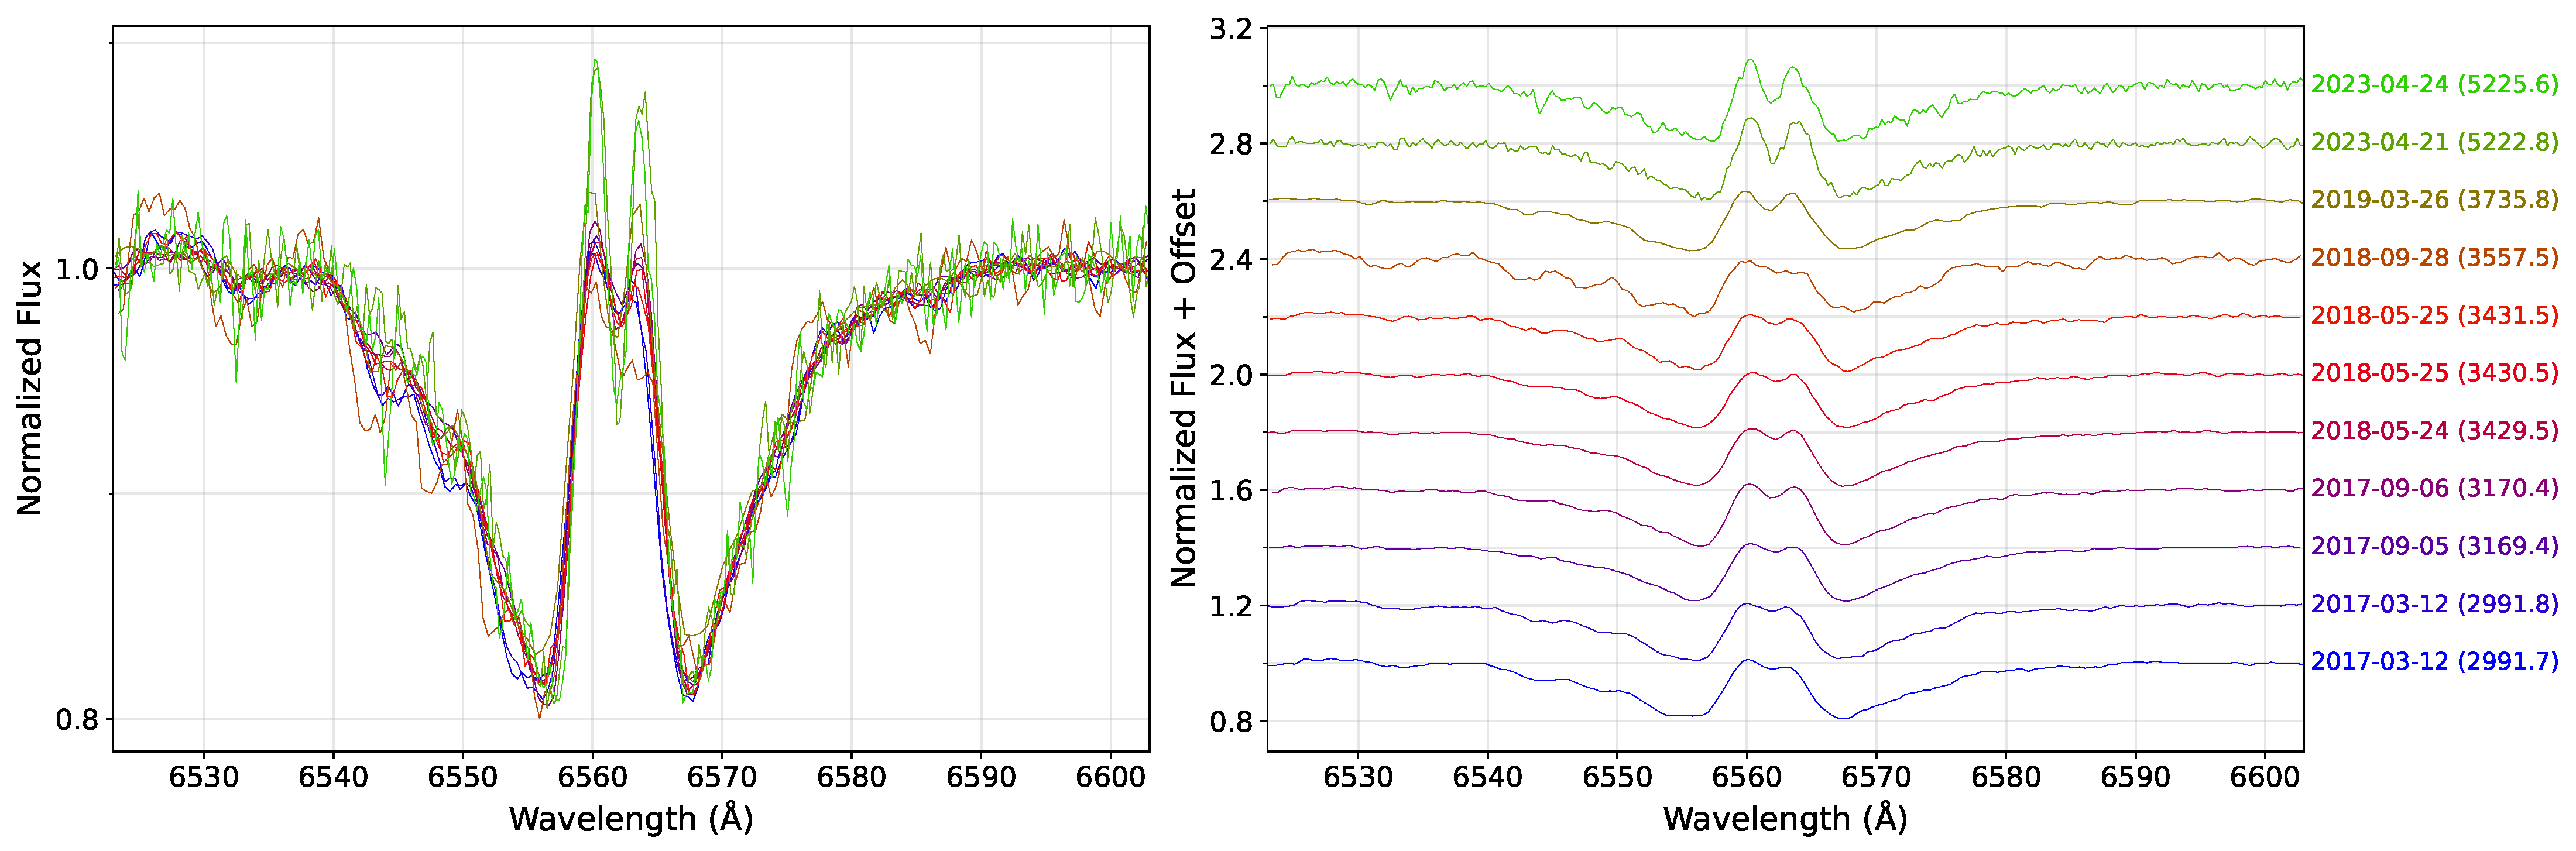
Figure 10 presents eleven normalized H
line profiles obtained between March 2017 and April 2023. The line profiles exhibit clear variations in both shape and width across epochs, indicating changes in the kinematic and structural properties of the circumstellar disk over timescales of several years. Although the double-peaked emission peaks occasionally rise above the continuum at some epochs, the bulk of the area of this very broad line remains below the continuum, indicating that the absorption component dominates over the emission contribution.
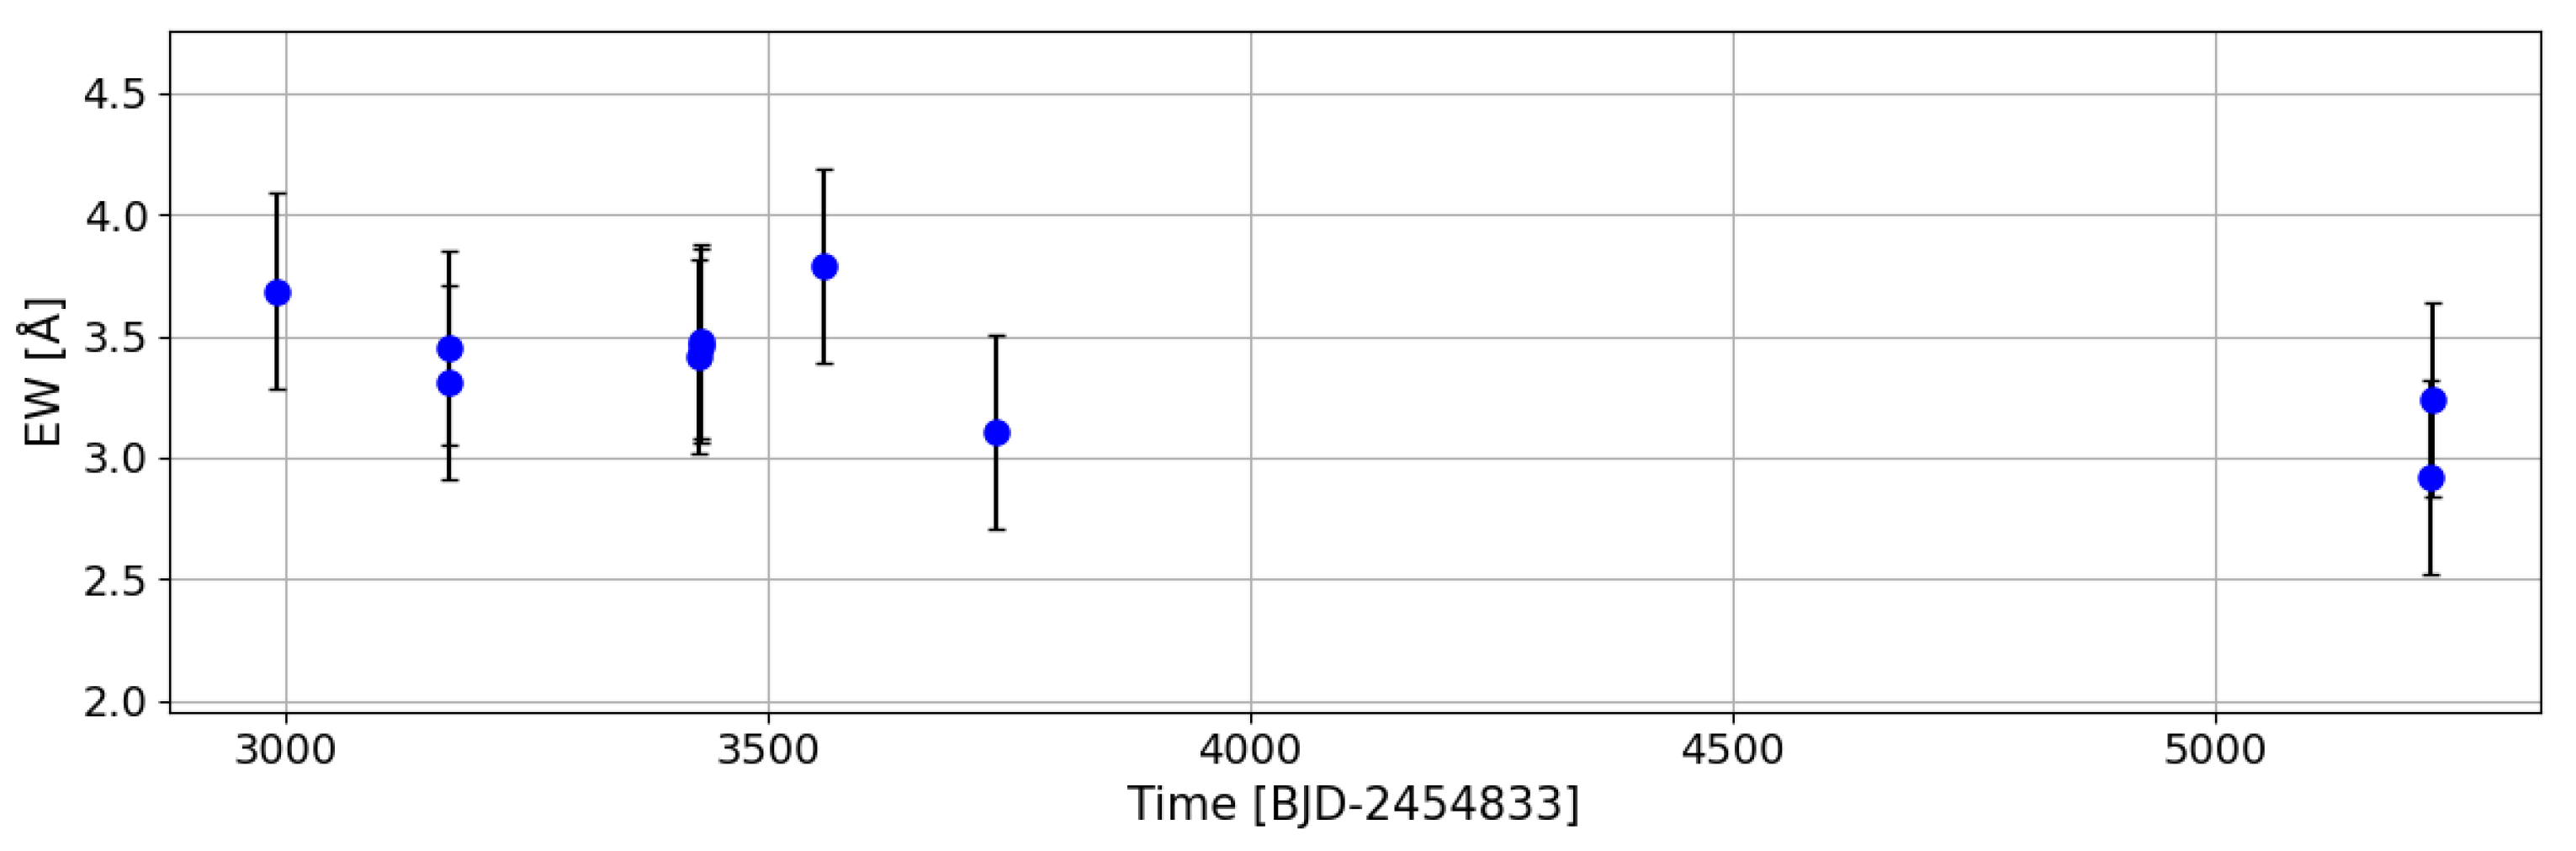
The temporal evolution of the H
equivalent width (EW), shown in
Figure 11, further illustrates this long-term variability. The EW measurements exhibit significant fluctuations throughout the monitoring interval, reflecting variations in the density and extent of the emitting circumstellar material rather than a static disk configuration.
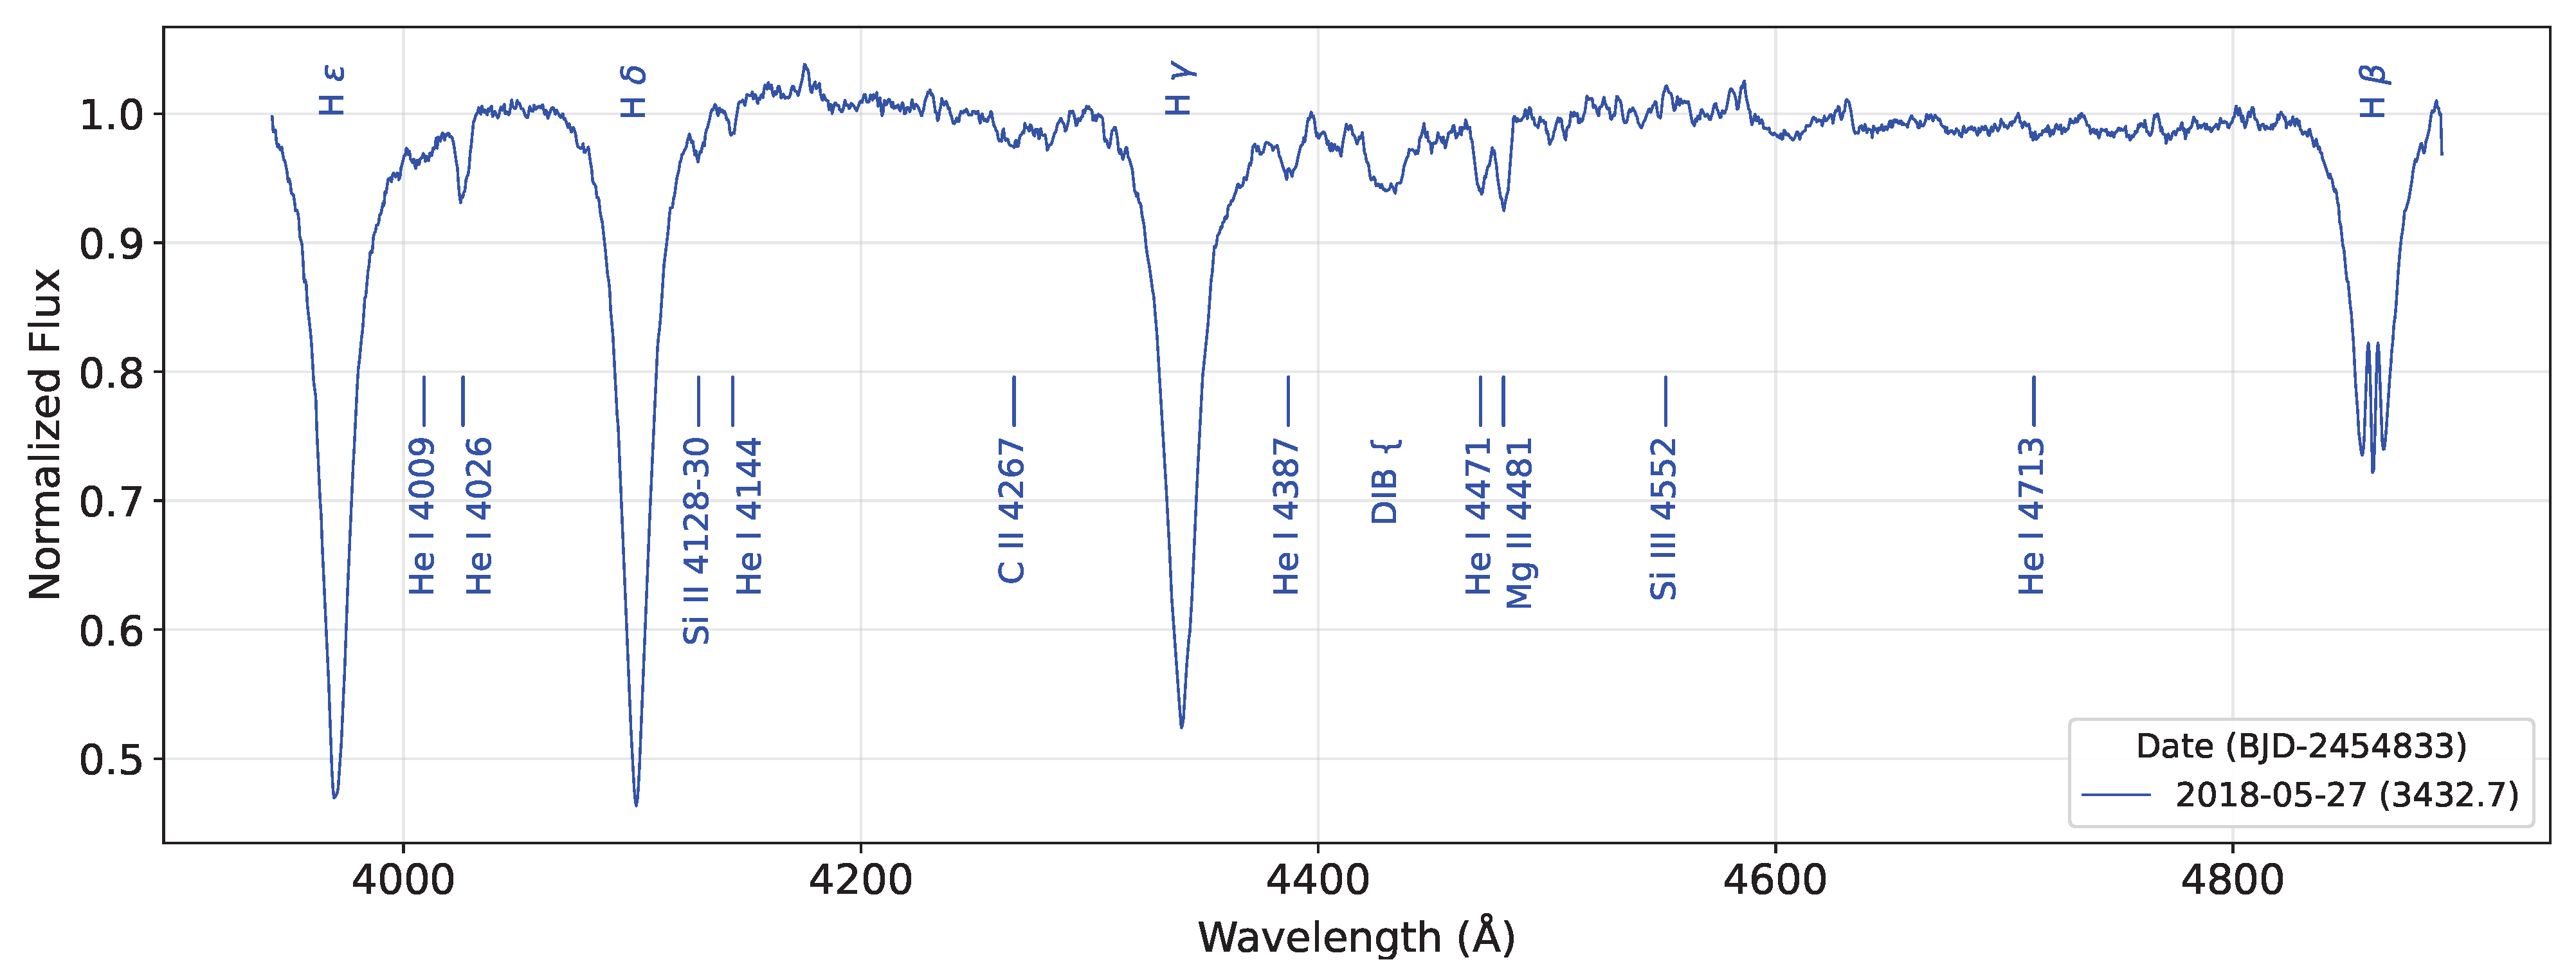
Figure 12 shows normalized blue-region spectra of HD 138872 obtained at multiple epochs between March 2017 and September 2022, covering the wavelength range from approximately 3900 to 4900 Å. Again, we applied the spectral classification criteria mentioned above to HD 138872 and concluded that it is a B8III star.
HD 138872 exhibits detectable photometric variability on timescales of order one day, as revealed by high-precision K2 observations, together with pronounced long-term spectroscopic variability of the H line over several years. The combination of SLF, short-timescale photometric variability and multi-year evolution of the emission-line profiles indicates an active and evolving circumstellar disk.
3.4. HD 315823
HD 315823 (EPIC 240426061, TIC 187134762) is classified as a B8-type star [
41] with apparent visual magnitude
mag. The star was observed by the Kepler space telescope during K2 Campaign 11.
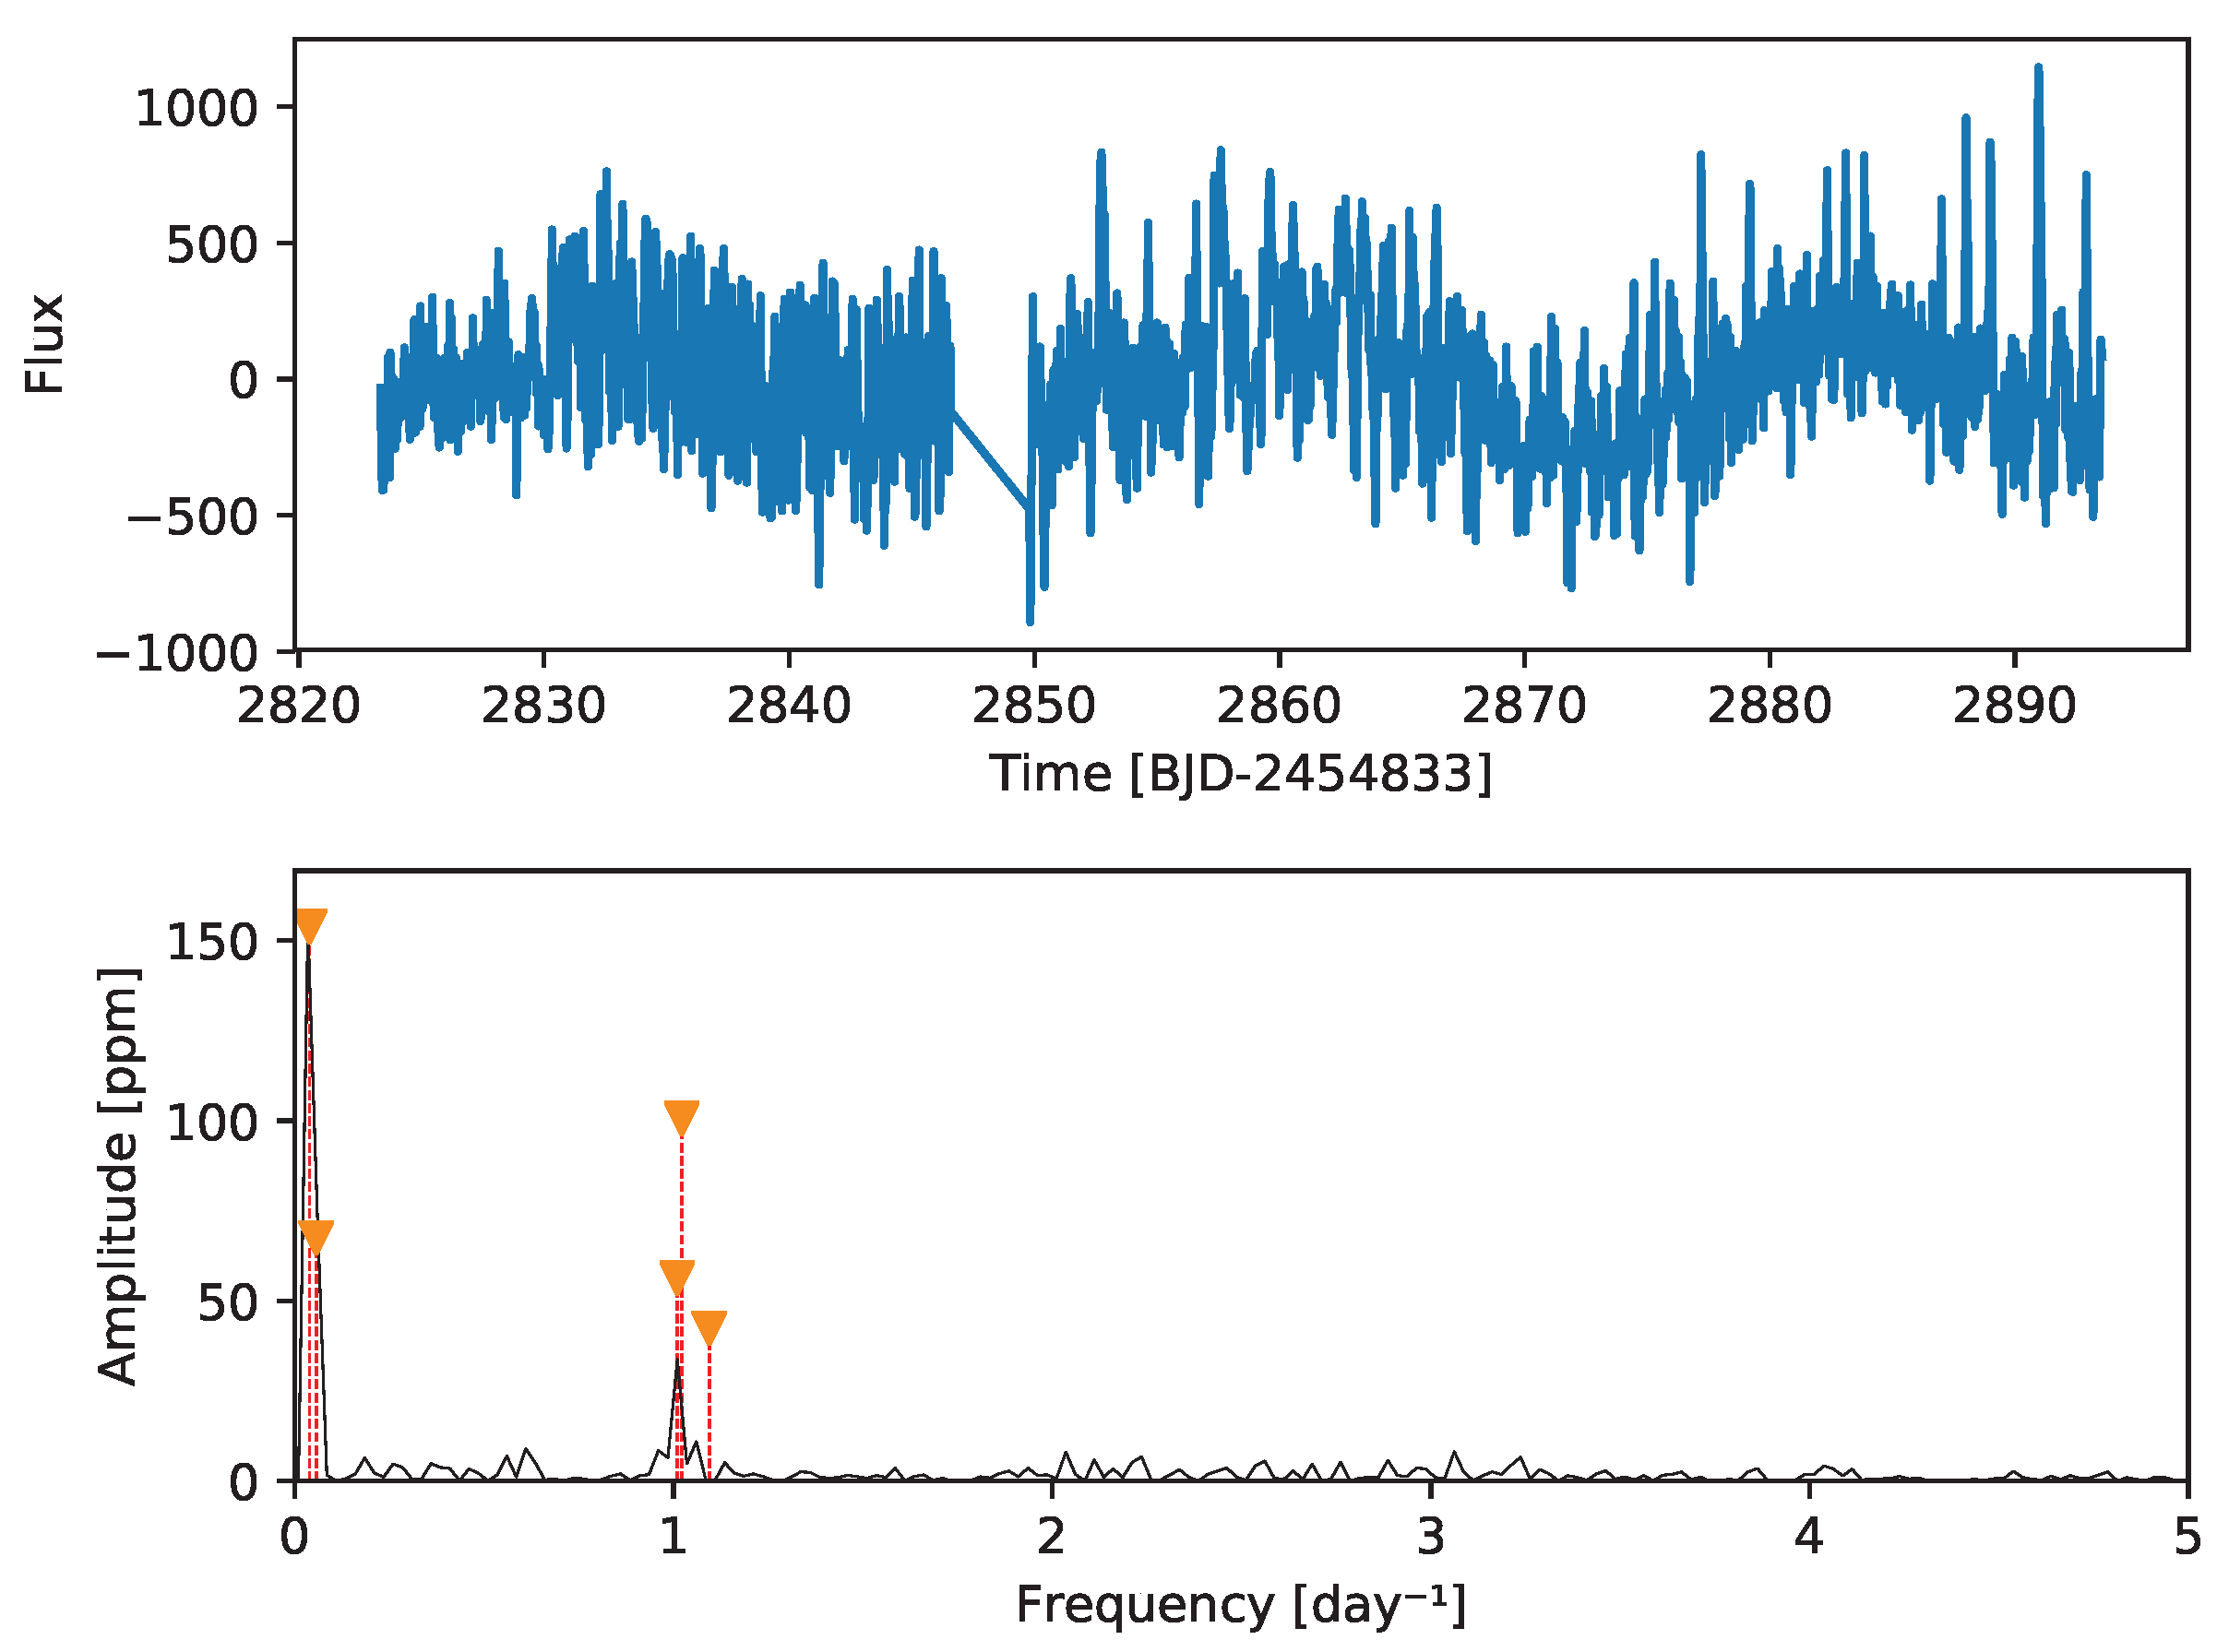
The K2 light curve of HD 315823 exhibits clear photometric variability over the duration of Campaign 11, as shown in
Figure 13. The Lomb-Scargle frequency spectrum shows just a few frequencies, dominated by low-frequency components with the highest amplitudes, indicating variability on timescales of several days that could be due to the SLF phenomenon (see above). Such low-frequency signals may also be related to rotational modulation. In addition, significant peaks are detected at frequencies around 1 cycle day
−1, a characteristic timescale commonly observed in classical Be stars and often associated with non-radial pulsations.
In contrast, the available TESS photometry is dominated by noise and does not reveal coherent periodic signals (see
Appendix B).
Spectroscopic observations of HD 315823 reveal H
emission at two epochs, confirming the presence of a circumstellar disk.
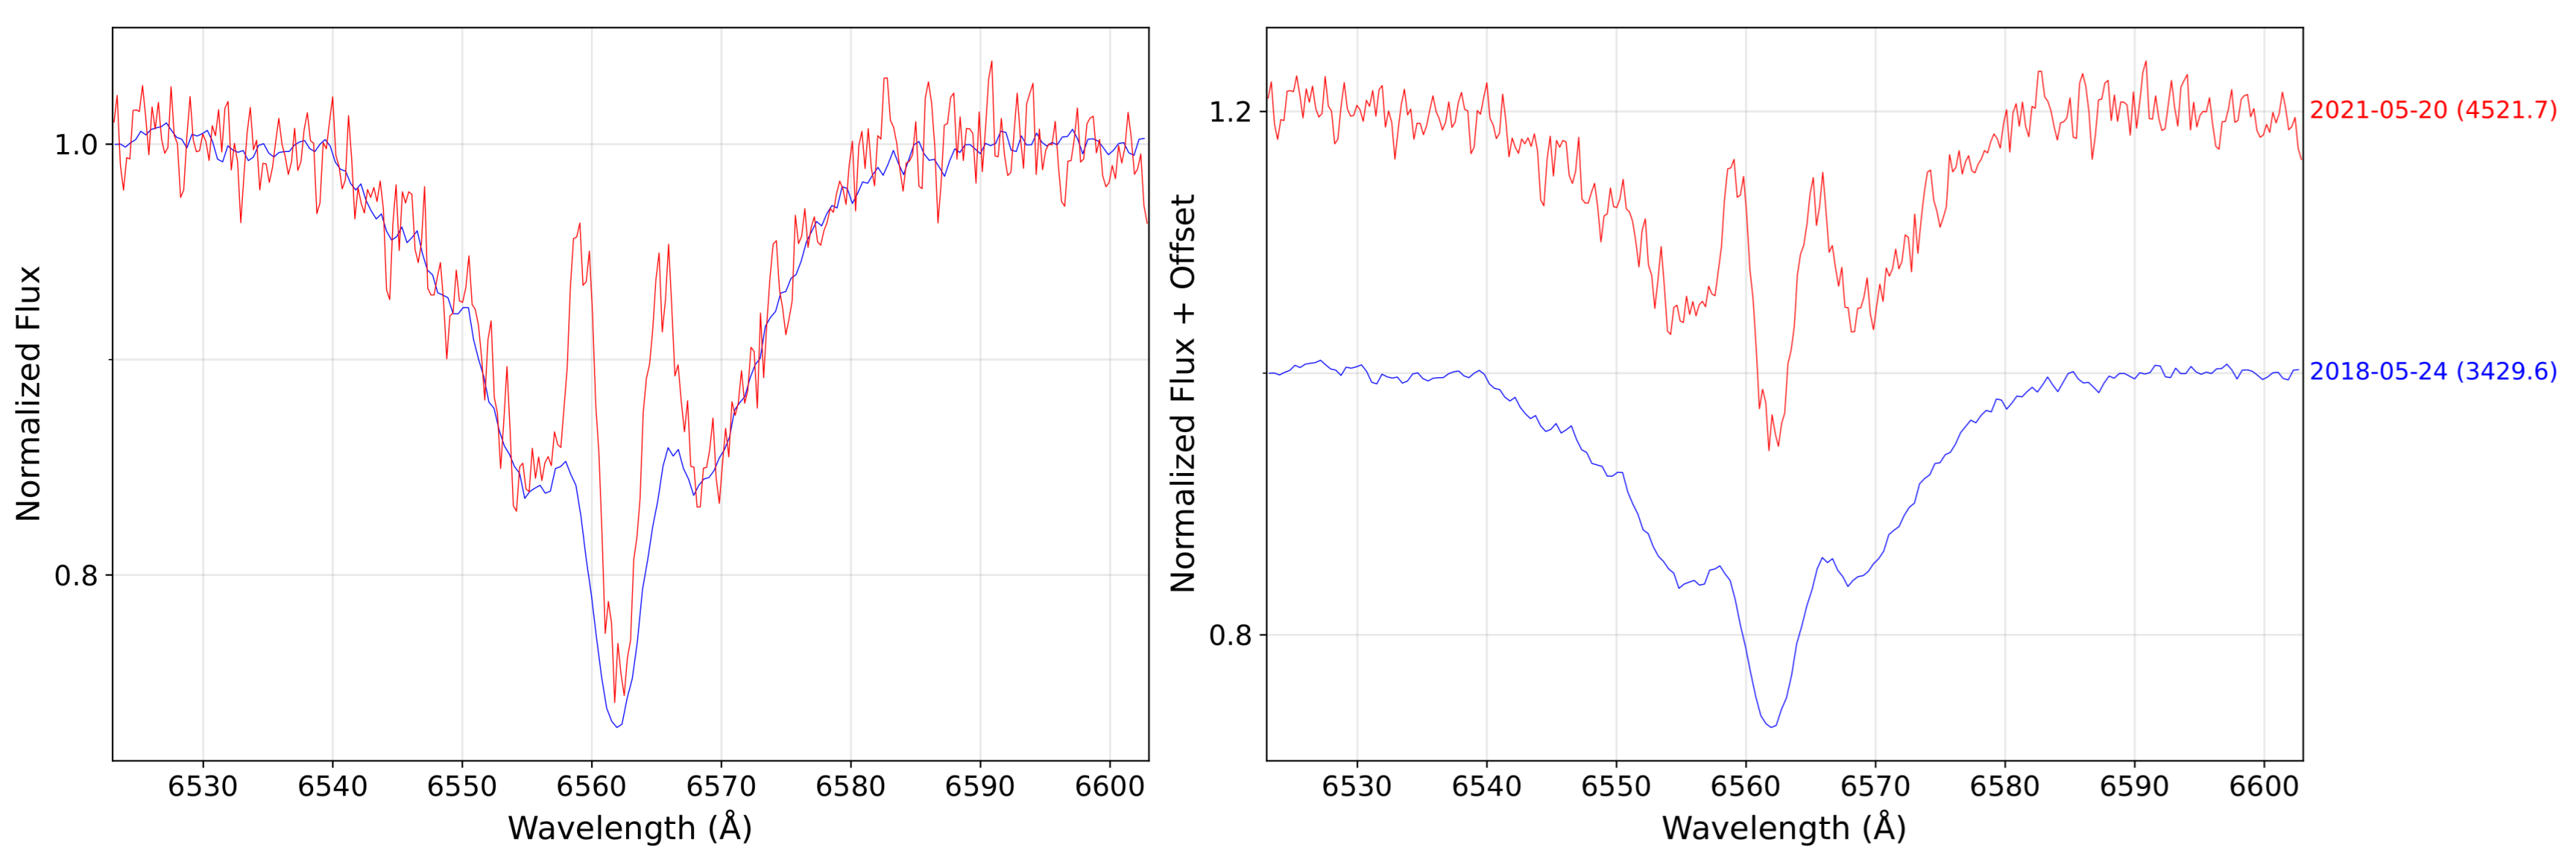
Figure 14 presents normalized H
line profiles obtained in May 2018 and May 2021. The comparison between the two spectra shows noticeable changes in the line profile, including variations in shape and width, indicating that the circumstellar disk is not static and undergoes structural or kinematic evolution on multi-year timescales.
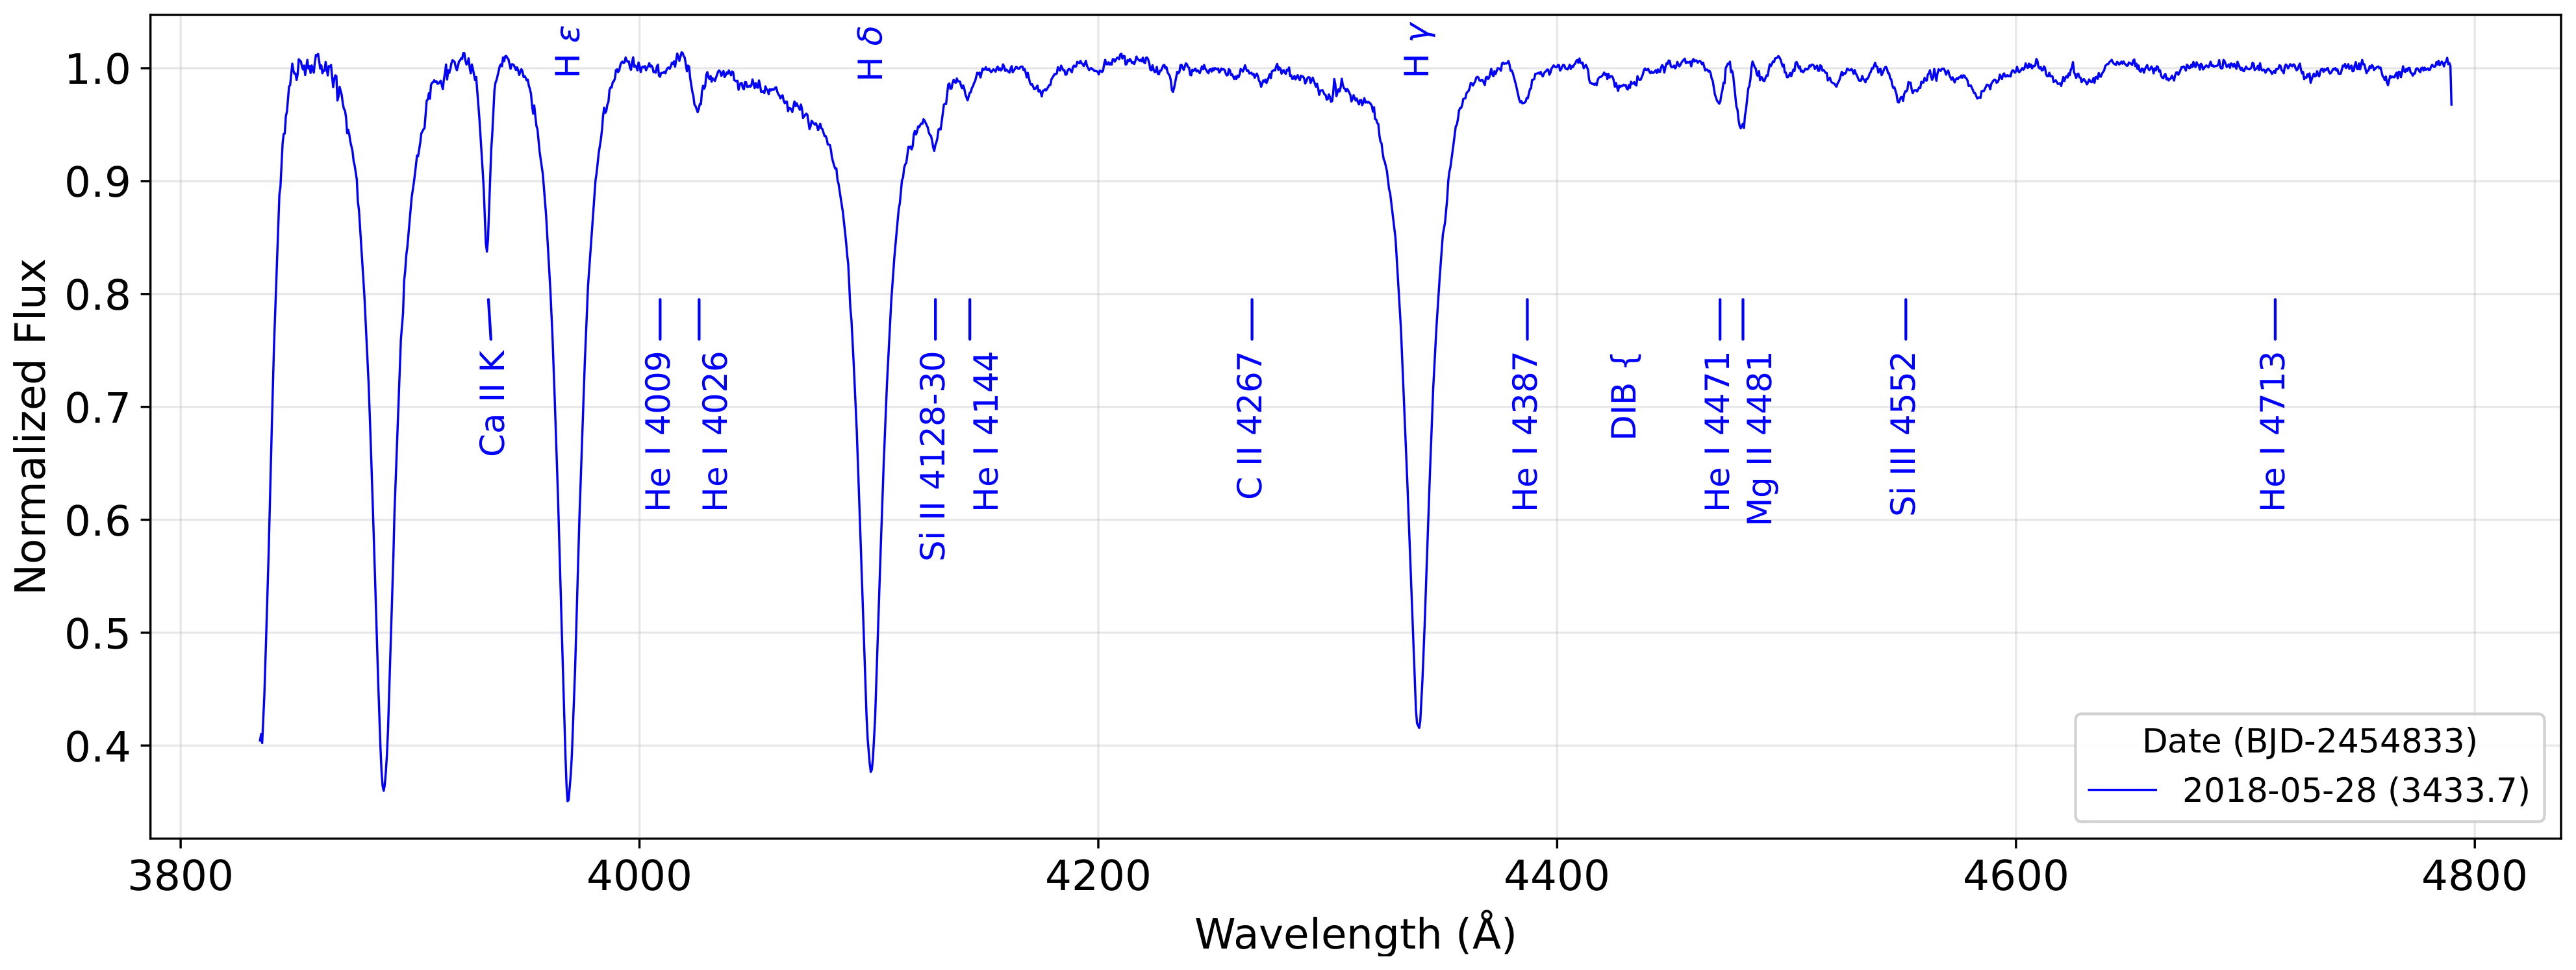
The normalized blue-region spectrum of HD 315823 obtained in May 2018 is shown in
Figure 15. The spectrum covers the wavelength range from approximately 3800 to 4800 Å and we applied the above-mentioned spectral classification criteria based on HeI line ratios and Balmer line profiles. We concluded that HD 315823 is a B8III-IV star.
HD 315823 thus displays photometric variability dominated by low-frequency signals on timescales of days, together with additional variability near 1 cycle day−1 typical of Be stars. The detection of H emission at multiple epochs and the observed changes in the line profile over several years indicate an evolving circumstellar disk.
4. Discussion
Our results show that short-term pulsational variability
can coexist with long-term evolution of circumstellar disks in relatively bright Be stars that have received limited prior attention. This behaviour aligns with recent observational surveys indicating that variability and disk-related phenomena in Be stars are common and often episodic across a wide range of environments. Dedicated spectroscopic monitoring programs have demonstrated cycles of disk formation and dissipation, facilitating the identification of previously unknown Be stars through the detection of H
emission (e.g., [
42]). In parallel, space missions such as Kepler, Kepler/K2, and TESS have revealed a diverse range of variability patterns, including multi-periodic pulsations. Systematic searches (e.g., [
43,
44]), incorporating mid-infrared monitoring with Wide-field Infrared Survey Explorer (WISE) [
45] and extensive optical light-curve surveys of Be stars, also link photometric variability with changes in the circumstellar disk [
46,
47].
In this observational context, the four stars analyzed here should not be regarded as isolated cases, but rather as representative examples of Be stars whose variability becomes clearer when high-precision space photometry is combined with multi-epoch spectroscopic monitoring. K2 photometry reveals short-timescale multi-periodic pulsations and, in some cases, significant low-frequency variability. H spectroscopy indicates ongoing structural evolution of the circumstellar disks. One result of this combined analysis is that disk changes can occur without conspicuous photometric outbursts over the time span of the space-based observations, consistent with scenarios in which disk evolution proceeds through cumulative or intermittent mass-loss processes. Despite the modest sample size, the observed variability patterns closely resemble those found in recent large surveys. These findings highlight the multiscale nature of variability within individual Be stars and emphasize the importance of coordinated photometric observations and long-term spectroscopic monitoring for a comprehensive understanding of the Be phenomenon.
One limitation of the current study is that the K2 campaigns were short, making it difficult to directly connect short-term pulsations to specific disk-feeding events. Future missions such as PLATO [
48], owing to their substantially longer uninterrupted photometric baselines, will enable direct tests of whether the observed short-term pulsations and long-term disk variability persist over multi-year timescales. When combined with systematic spectroscopic monitoring, such datasets will provide stronger constraints on the physical coupling between stellar pulsations, rapid rotation, and circumstellar disk evolution.




 ,
,