Abstract
Background/Objectives: Understanding how plant-derived extracts influence the rheological and sensory behavior of emulsions is crucial for developing stable and consumer-appealing formulations. Although walnut leaf extract (Juglans regia L.) is recognized for its bioactive properties, its structural impact on cosmetic emulsions has not been systematically characterized. This study aimed to investigate the effect of increasing walnut leaf extract concentration on the rheological profile, mechanical integrity during application, and sensory performance of oil-in-water creams. Methods: Four emulsion formulations (F1–F4) containing 0%, 1%, 3%, and 5% walnut leaf extract were prepared using Olivem 1000 and Olivem 300 as emulsifiers. Rheological measurements included amplitude sweep, flow curve, frequency sweep, and thixotropy tests to assess viscoelasticity, flow behavior, and recovery. A sensory evaluation was conducted by trained panelists to correlate rheological parameters with perceived product attributes. Results: All formulations exhibited pseudoplastic, shear-thinning behavior in well-structured cosmetic emulsions during application. The addition of walnut extract significantly modified rheological responses: at 1% concentration, an increase in storage modulus (G′) and shear-thinning ratio (η0/η∞) indicated structural reinforcement and improved spreadability, whereas higher concentrations (3–5%) led to structural softening and faster thixotropic recovery. The frequency sweep revealed a concentration-dependent shift from elastic- to viscous-dominant behavior. Sensory analysis confirmed these trends, with higher extract levels reducing stickiness and greasiness while enhancing absorption. Conclusions: Walnut leaf extract shows a concentration-dependent influence on the rheological behavior of the emulsions, strengthening the network structure at low levels while promoting softening and faster structural recovery at higher concentrations. The strong correlation between rheological and sensory parameters underscores the potential of walnut extract as a multifunctional ingredient for designing well-structured, non-greasy, and consumer-preferred cosmetic creams.
1. Introduction
The success of dermally applied cosmetic products depends not only on their expected efficacy, such as reducing signs of aging, decreasing transepidermal water loss, and increasing skin elasticity and firmness, but also critically on their sensory characteristics, which significantly influence consumer preference and product acceptability [1,2]. According to some authors, the sensory feelings elicited by cosmetic products are closely linked to emotional responses that can enhance self-confidence and self-esteem [3]. Attributes such as spreadability, consistency, stickiness, and the perception of a residual film play a pivotal role in the overall user experience. Indeed, products that are difficult to spread, leave a sticky feel on the skin, or are overly greasy will deter consumers [4]. It is now widely recognized that the sensory properties of dermal preparations represent an indispensable factor affecting a product’s market potential.
Conventional sensory evaluation, which relies on trained panels, is the traditional approach for assessing these properties. This methodology, developed since the 1980s, is now based on guidelines for sensory analysis defined by the International Organization for Standardization (ISO) in Geneva [5]. However, sensory analyses are often associated with limitations, including the physiological state of the organism, skin condition, inherent subjectivity, significant time investment, and considerable costs, making them less accessible for routine product development and quality control. The use of instrumental measurements that correlate with sensory properties could enable faster and more cost-effective product development during the pre-formulation cycle. Furthermore, it would be highly valuable for quality control and predicting end-user satisfaction with the final product.
Rheology, as a fundamental discipline for studying the deformation and flow of materials, can be used to complement the results of sensory evaluations and may even serve as an alternative to sensory studies by providing objective and reproducible measurements. Several studies have demonstrated the potential for correlating rheological parameters with sensory perceptions [6,7,8]. In this context, rheological characterization emerges as a particularly promising technique, given that the texture of a cream is, in essence, its rheological behavior across different application phases.
Rheological investigations serve as a powerful tool for the objective assessment of sensory properties in cosmetic preparations, such as firmness, spreadability, malleability, richness, oiliness, absorption, and tackiness [8]. These user-perceivable properties during application can be quantitatively linked to specific rheological parameters derived from various tests. Flow curve measurements determine viscosity as a function of shear rate, enabling the assessment of a cream’s behavior during application. A lower viscosity value at moderate shear rates directly correlates with easier spreading (better spreadability) and less resistance upon application [9,10]. Amplitude sweep tests are useful for determining the linear viscoelastic region (LVER) and assessing formulation firmness. This test monitors the storage (G′) and loss (G″) moduli as a function of applied deformation [7,9,11]. A higher G′ value within the LVER indicates a firmer, more elastic cream structure. The critical deformation (γc), at which G′ begins to decline, marks the point of structural breakdown, which can be related to the ease of scooping the product from its container. A study on the rheological characteristics of cosmetic emulsions established that the yield stress, determined from this test, is a key parameter for perceiving product type (e.g., cream vs. lotion) [10]. Frequency sweep tests provide insight into the viscoelastic structure during dynamic deformation and the formulation’s behavior under different stress conditions. The dominance of G′ over G″ across a wide frequency range indicates a solid, gel-like structure, while a shift in moduli at low frequencies may suggest a tendency for syneresis [12]. Finally, the thixotropy loop testing measures the recovery of the structure after shearing. Faster recovery (a smaller loop area) is associated with desirable sensory properties like non-tackiness, whereas slow recovery can lead to a sticky feel [7,12]. Many studies clearly demonstrate that such rheological measurements can be directly utilized to predict the sensory profile of cosmetic emulsions [4].
Rheological testing is increasingly pivotal in product development as it enables the prediction of sensory properties through objective, rapid, and cost-effective instrumental measurements. This approach is supported by multivariate models that successfully correlate rheological parameters with sensory data. For example, yield stress effectively indicates pourability and initial spreadability, while the viscoelastic moduli (G′, G″) from oscillatory sweeps quantify attributes like firmness, elasticity, and stickiness, demonstrating rheology’s power as a predictive tool for sensory profiling [13].
Considering all of the above, the aim of this study was to investigate the correlation between sensory attributes and rheological parameters for four emulsion creams containing different concentrations of walnut extract. This plant extract was selected due to its potential for dermal application, while its influence on the textural and rheological profile of the creams represents an area of particular interest [14]. Through the systematic correlation of instrumental measurements with sensory assessments across three key application phases—upon pickup from the container (e.g., consistency), during application (e.g., spreadability, stickiness), and after application (e.g., residual film feel, greasiness)—this work aims to establish quantitative relationships that can reduce the reliance on costly and time-consuming human panels. Ultimately, this approach will accelerate formulation development and ensure consistent product quality through a predictive, instrument-based assessment of the sensory profile.
2. Materials and Methods
2.1. Materials
The components used in the emulsion cream formulations—lingonberry seed oil, olive oil, cetearyl alcohol, cetearyl olivate (and) sorbitan olivate (Olivem 1000), aloe vera juice, and hydrolyzed wheat protein—were supplied by Avena lab—Farmadria (Vršac, Serbia). Caprylic/capric triglyceride, glycerol, and vitamin E (tocopherol) were obtained from Unichem Pharm (Čačak, Serbia). Olive oil PEG-7 esters (Olivem 300) were provided by Mireille Lab (Zagreb, Croatia). Distilled water was produced in-house from tap water using a distillation apparatus at the Faculty of Medical Sciences, University of Kragujevac. All chemicals for the determination of total phenolic content (TPC), total flavonoid content (TFC), 2,2-diphenyl-1-picrylhydrazyl hydrate (DPPH) scavenging capacity, and HPLC analysis were purchased from Sigma-Aldrich (St. Louis, MO, USA).
2.2. Preparation of Juglans regia Ethanolic Extract
An ethanolic extract of Juglans regia L. leaves was prepared using 70% ethanol. This solvent concentration was selected for its efficacy in extracting a broad spectrum of both polar and semi-polar compounds from plant material, as well as its relatively low toxicity compared to other organic solvents. For the extraction, 50 g of finely ground walnut leaves, which had been air-dried in a shaded, well-ventilated area, was macerated with 350 mL of 70% ethanol. The mixture was heated for three hours in a water bath under reflux conditions at the boiling point of the solvent. The resulting extract was then filtered to separate the liquid phase from the solid plant residue. The filtrate was concentrated to dryness using a rotary evaporator under reduced pressure. The obtained dry extract was stored in a refrigerator at 4 °C until further use.
2.3. HPLC Analysis of the Extract
The ethanolic walnut leaf extract was analyzed using an HPLC-DAD system. Chromatographic separation was performed on a C18 column with a gradient elution of acidified water and acetonitrile. Compounds were confirmed by matching their retention times and UV spectra to those of reference standards and quantified using calibration curves [15].
2.4. Analysis of Total Phenolic Content
The total phenolic content (TPC) was quantified via the Folin–Ciocalteu assay [16]. Briefly, the extract was reacted with the FC reagent and sodium carbonate, and the absorbance was measured at 760 nm. Using a gallic acid calibration curve, the TPC was determined and expressed as mg GAE/g of dry extract [17].
2.5. Determination of Total Flavonoid Content (TFC)
The total flavonoid content was determined using the aluminum chloride colorimetric method [18]. The assay mixture consisted of 1 mL of sample or quercetin standard (31.25–1000 µg/mL), 200 µL of 10% AlCl3, 200 µL of 1 M potassium acetate, and 5.6 mL of distilled water. After 30 min of incubation at room temperature, the absorbance was measured at 415 nm. The TFC was quantified using a quercetin calibration curve and expressed as milligrams of quercetin equivalents per gram of dry extract (mg QE/g DE) [19].
2.6. DPPH Radical Scavenging Assay
The antioxidant activity of the extract was evaluated based on its ability to scavenge the DPPH radical [20]. Briefly, 200 µL of the extract or standard (31.25–1000 µg/mL) was mixed with 2 mL of a fresh DPPH methanolic solution. The reaction mixture was incubated in the dark for 30 min, and the absorbance was measured at 517 nm. The radical scavenging activity was calculated using the formula:
where Ac—is the control absorbance and As—is the sample absorbance. The IC50 value (the concentration providing 50% inhibition) was determined from a nonlinear regression curve.
% Inhibition = 100 × (Ac − As)/Ac
2.7. Preparation of o/w Emulsion Cream with J. regia Extract
The creams were prepared using the conventional hot emulsification method, which involves separately heating the oil and water phases and then mixing them under defined conditions [21]. The oil phase consisted of lingonberry seed oil, olive oil, caprylic/capric triglyceride, cetearyl alcohol, Olivem 1000, and Olivem 300. The water phase consisted of distilled water, aloe vera juice, and glycerol. Both phases were heated in a water bath to 75 ± 2 °C under continuous stirring. Upon reaching the target temperature, the oil phase was added to the water phase under continuous mixing using a propeller stirrer at 500 rpm (Velp Scientifica LS, Shanghai, China) until the mixture cooled down to 40 ± 2 °C. The obtained emulsion base was then supplemented with the walnut leaf extract at specified concentrations, hydrolyzed wheat protein, the preservative Euxyl® PE 9010, and vitamin E (tocopherol). Stirring was continued until complete homogenization of the formulation was achieved [12]. All prepared emulsion creams were stored in sealed containers at room temperature for 7 days prior to rheological measurements and sensory testing to allow for structural stabilization. The precise quantitative composition of all investigated cream formulations is provided in Table 1.

Table 1.
Composition of the investigated formulations (values in % w/w).
2.8. Sensory Evaluation of Emulsion Creams with Walnut Leaf Extract
The sensory evaluation of the cream formulations was conducted under controlled laboratory conditions: ambient lighting, a temperature of 21 ± 2 °C, and a relative humidity of 45 ± 3%. A panel of 20 healthy female volunteers, aged between 20 and 40 years, participated in the study. Skin type was not considered. The inclusion criteria were willingness to participate and the ability to verbally articulate sensory perceptions. The exclusion criteria were any dermatological disorders. Prior to the assessment, panelists were briefed on the evaluation procedure and introduced to reference materials representing the extremes of each sensory attribute. All participants tested all four formulations.
The assessment was performed using a structured questionnaire divided into three sections, focusing on the perceptions before, during, and after application to the skin. Participants rated the samples using either predefined descriptive terms or a numerical scale from 1 to 10 (Table 2) [22,23]. The samples were presented in identical, randomly coded plastic containers following a blind testing protocol and a randomized serving order to minimize bias. Assessors underwent a 20–30 min quiet acclimation period and were instructed not to use any topical products for 12 h prior to testing. Sensory attributes were assessed on two marked circular areas on each forearm. During and after sensory evaluation, no adverse effects such as redness, irritation, itching, stinging, or discomfort were observed in any of the participants. All formulations were well tolerated under the test conditions.
Table 2.
Questionnaire applied for sensory attribute evaluation.
The sensory evaluation protocol was approved by the Ethics Committee of the Faculty of Medical Sciences, University of Kragujevac, Serbia (Approval No. 09-666/4, 13 February 2025).
2.9. Rheological Characterization
Rheological properties of the emulsion creams were investigated using a rotational rheometer (Anton Paar RheoCompass™ MCR 102e). Measurements were performed using a cone-plate geometry (PP25 tool) with a constant gap of 1 mm. All experiments were conducted at a controlled temperature of 22 ± 1 °C. Each sample was analyzed in triplicate (n = 3) to ensure the representativeness and statistical reliability of the results.
2.9.1. Amplitude Sweep Test
The amplitude sweep test was used to determine the mechanical strength and the limits of linear viscoelastic behavior of the formulations. The test was performed in controlled shear stress (τ) mode, ranging from 0.001 to 10,000 Pa, at a constant frequency of 1 Hz (ω = 6.28 rad/s), with a logarithmic distribution of 25 points. The test covered a deformation range (γ) from 0.001% to 100%, and the following parameters were recorded: Linear Viscoelastic Region (LVER): The range of deformation within which the material exhibits linear behavior. Storage Modulus (G′): The value of the elastic modulus within the LVER, indicating the structural strength and rigidity of the formulation. Flow Point: Determined via the critical shear stress (τ) and corresponding deformation (γ) at the point where G′ = G″, indicating the onset of structural collapse [24,25].
2.9.2. Frequency Sweep Test
The frequency sweep test was used to characterize the viscoelastic behavior of the samples as a function of angular frequency. The test was performed in a range from 10 to 0.1 rad/s. For each formulation, the strain amplitude used in the frequency sweep test was selected individually based on the previously determined LVER from the amplitude sweep. Specifically, the following strain values were applied: F1: 0.10%, F2: 0.03%, F3: 0.05%, and F4: 0.08%. The test was conducted with a logarithmic distribution across 11 points, and the following parameters were monitored: Storage Modulus (G′) and Loss Modulus (G″) as a function of frequency. Loss Factor (tan δ): calculated as the ratio G″/G′, serving as an indicator of the dominant type of behavior (solid/elastic when tan δ < 1, or liquid/viscous when tan δ > 1) [26,27].
2.9.3. Flow Curve (Viscosity Test)
Flow curves were measured at 40 points over a shear rate range of 0.001 to 1000 s−1 to investigate flow behavior and spreadability. The data were fitted using the Cross, Carreau-Yasuda, and Carreau models to determine zero-shear viscosity (η0), infinite-shear viscosity (η∞), and structural behavior parameters, while the Ostwald (Power-Law) model was used to determine the consistency index (K) and flow behavior index (n). The models that showed the best correlation (highest R2 values) were used for further interpretation of the results. Analysis of the flow curve allowed for the determination of key rheological parameters: Zero-shear Viscosity (η0) describes the structural integrity at rest, Infinite-shear Viscosity (η∞) indicates behavior during intensive rubbing and spreading [24].
2.9.4. Thixotropy (Hysteresis Loop) Test
Thixotropic properties and the ability of the structure to recover after the application of shear were tested using a hysteresis loop test (three cycles). The protocol consisted of: First cycle (Upward curve): 15 points, increasing the shear rate from 1 to 100 s−1. Second cycle (High-shear hold): 15 points, at a constant shear rate of 100 s−1. Third cycle (Downward curve): 15 points, decreasing the shear rate from 100 to 1 s−1 [24].
The quantitative measure of thixotropy was the area of the hysteresis loop, expressed in Pa/s. A larger loop area indicates a more pronounced thixotropic character and a slower structural recovery. This comprehensively defined methodology provides objective parameters directly related to the sensory properties and performance of the creams during application.
2.10. Microscopic Analysis
The microstructure of the emulsion formulations (F1–F4) was examined using an optical microscope equipped with a digital camera. A small amount of each sample was applied to a glass slide to form a thin layer of emulsion cream and covered with a cover glass. Images were taken at a total magnification of 400× under bright field. For each formulation, three independent images were taken from different parts of the sample to ensure representativeness.
2.11. Statistical Analysis
All rheological data were statistically analyzed using SPSS software (version 25). To determine if there were statistically significant differences between formulations, a one-way analysis of variance (One-Way ANOVA) was applied. Prior to applying ANOVA, the normality of the data distribution (Shapiro–Wilk test) and the homogeneity of variances (Levene’s test) were checked. When ANOVA indicated a significant difference, Tukey’s HSD post hoc test was used for further comparison of individual means. The sensory characteristics of the formulations were assessed using the Chi-square test, the Friedman test, and rank-sum multiple comparisons based on Fisher’s LSD test. Higher rank sums indicate a higher level of perception for each sensory attribute. All differences were interpreted as statistically significant at the level of p < 0.05.
3. Results and Discussion
3.1. Phytochemical Profile of Walnut Leaf Extract
A phytochemical analysis of the ethanolic walnut leaf extract was performed, including the determination of total phenolics, total flavonoids, DPPH antioxidant activity, and HPLC profiling, which are presented in Table 3, Table 4 and Table 5.
Table 3.
Content (mg/g dw) of polyphenolic compounds in J. regia ethanolic leaf extract.
Table 4.
Total phenolic content and total flavonoid content of the investigated Juglans regia leaf ethanol extract.
Table 5.
DPPH radical scavenging activity of Juglans regia leaf ethanol extract.
Phytochemical analysis showed that walnut leaf extract is dominated by ellagic acid and hyperoside, together with chlorogenic and neochlorogenic acids. These polyphenolic structures can form hydrogen bonds and interact with emulsifiers at the interface of the two phases [28,29].
3.2. Rheological Characterization of Cream Formulations
The rheological properties of the four emulsion creams (F1–F4) with varying concentrations of walnut leaf extract (0%, 1%, 3%, and 5%, respectively) were systematically investigated to understand the impact of the extract on the creams’ microstructure and potential sensory attributes.
3.2.1. Amplitude Sweep and Mechanical Strength
The amplitude sweep test was employed to determine the linear viscoelastic region (LVER) and assess the mechanical strength of the formulations. The values of the storage modulus (G′) within the LVER, the flow point stress (τ), and the corresponding deformation (γ) are summarized in Table 6.
Table 6.
Parameters derived from the amplitude sweep test for formulations F1–F4.
Statistical analysis (One-way ANOVA followed by Tukey’s HSD post hoc test, p < 0.05) showed no significant differences in the LVER among the investigated formulations, indicating that all creams behaved linearly and elastically within a similar deformation range. The lack of statistically significant differences in the LVER limit among all formulations (F1–F4) indicates that the added plant extract, at the investigated concentrations (1–5%), had a negligible impact on the range of deformations within which the emulsion systems behave linearly and elastically. This suggests that the fundamental network structure, formed by the emulsifiers (Olivem 1000 and 300), was the dominant factor in determining the LVER, which is consistent with studies highlighting the crucial role of emulsifiers in defining the linear viscoelastic response [30].
The storage modulus (G′) values differed significantly between formulations. The highest G′ was observed for F2, indicating the most rigid and solid-like structure. F1 and F3 showed intermediate values and did not differ significantly from each other, while F4 exhibited the lowest G′, reflecting a softer and less cohesive network.
The most significant impact of the walnut leaf extract was observed on the storage modulus (G′). Formulation F2 (1% extract) exhibited the statistically highest G′, indicating the most rigid and elastic structure of all tested samples. This unexpected increase in strength at a low extract concentration (1%) could be explained by potential synergistic interactions between the polyphenolic compounds from the extract and the polysaccharide chains of the Olivem series emulsifiers, leading to additional cross-linking and strengthening of the interfacial structure. A similar phenomenon, where certain active ingredients at low concentrations strengthen the emulsion structure, has been observed in other studies [31,32,33].
In contrast, formulation F4 had a significantly lower G′ compared to F2, indicating a softening of the structure. This can be attributed to a plasticizing effect of the high solid content from the extract, which, at higher concentrations, interferes with particle packing and the formation of a rigid interfacial structure, partially compromising the integrity of the network. Such a decrease in G′ with increasing active substance concentration has also been documented in the literature for other plant extracts [11,32,34].
Regarding the flow point parameters (τ and γ), two distinct groups were identified. F4 showed significantly higher τ and γ values compared to the other samples, suggesting that this formulation could withstand higher deformation before yielding. In contrast, F1, F2, and F3 did not differ significantly in these parameters. This seemingly contradictory behavior—a softer structure that can withstand greater deformation before yielding—can be explained by different breakdown mechanisms. F2, with its very rigid and brittle structure, likely undergoes fracture, while F4, with its softer and more flexible network, exhibits more ductile behavior, stretching and deforming to a greater extent before structural collapse. This finding is analogous to the difference between brittle and tough gels described in studies on hydrogel rheology and highlights the importance of monitoring both parameters—G′ and the flow point—for a complete characterization of texture.
3.2.2. Flow Behavior and Spreadability
The flow curves of all formulations (Figure 1) exhibited a pronounced shear-thinning behavior, a desirable property for cosmetic creams as it ensures high viscosity at rest (for stability) and low viscosity during application (for easy spreadability).
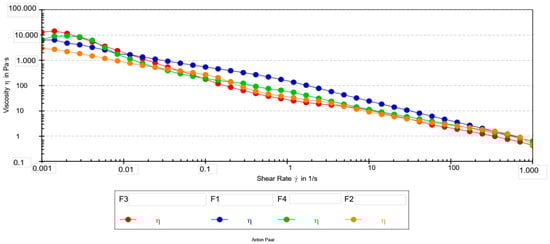
Figure 1.
Flow curves (viscosity vs. shear rate) for emulsion creams F1–F4.
The correlation coefficients were presented in Table 7.
Table 7.
Correlation coefficients (R2) for fitting rheological models to formulations F1–F4.
Higher R2 values indicate better agreement between experimental data and theoretical models. The cross model showed better accuracy of fit (R2 > 0.94) in all formulations and was therefore selected for further analysis.
Key parameters extracted from the flow curves are presented in Table 8.
Table 8.
Flow curve rheological model parameters for emulsion creams F1–F4.
The rheological parameters were analyzed using ANOVA followed by Tukey’s post hoc test. For the zero-shear viscosity (η0), the Cross model did not provide stable estimates for all formulations, which is particularly evident from the very high standard deviation observed for F1 and the missing value for F3. The instability of the model is likely a consequence of the poorly defined plateau at low shear rates, which prevented ANOVA from detecting statistically significant differences in η0.
In contrast, the infinite-shear viscosity (η∞) showed a clearer pattern of separation among the formulations. The Tukey test revealed a significant difference between formulations F2 and F4 (p < 0.05). This indicates that the differences among the formulations are more pronounced at high shear rates than in the zero-shear region.
For the consistency index (K) obtained from the Ostwald model, a clear and statistically significant difference was observed. Formulation F1 exhibited a significantly higher K value compared to all other samples (Tukey, p < 0.05). This result suggests that F1 possesses greater internal cohesion and a stronger network structure at intermediate shear rates. Formulations F2, F3, and F4 did not differ significantly from one another in terms of the K index, despite differences in their numerical values.
The flow behavior index (n) was within a narrow range (0.30–0.38) for all formulations and did not show statistically significant differences. The low n values indicate pronounced pseudoplastic (shear-thinning) behavior across all systems, which is expected for cosmetic emulsions of this type. The high correlation coefficients obtained for the Ostwald model (R = 0.94–0.97) further support the adequacy of this model for describing the rheology of all formulations.
All formulations displayed a slight increase in viscosity within the first two to three measurement points, followed by a typical shear-thinning profile. This initial rise is likely associated with structural rearrangements upon transition from rest to flow [35]. Due to the absence of a well-defined Newtonian plateau at very low shear rates, η0 values estimated by the Cross model were not considered reliable, particularly for F1 and F3. Consequently, the viscosity measured experimentally at 0.001 s−1 was used as a more robust indicator of low-shear behavior.
At 0.001 s−1, the formulations exhibited marked differences in viscosity. Formulation F3 differed significantly from all others; F1 and F2 differed from each other as well as from F3, while F4 was significantly different from F3. These low-shear results indicate that extract concentration has a pronounced influence on the structural strength of the formulations at rest. The infinite-shear viscosity (η∞) values support these observations by characterizing the behavior under high shear rates that simulate spreading. Formulation F2 showed the lowest η∞, which corresponds to rapid structural breakdown and a lighter sensory feel during application, while F4 exhibited the highest η∞, indicating stronger resistance to deformation under high shear.
Extract addition substantially influenced low-shear viscosity (η0,001). The pronounced decrease observed for F2 compared with control F1 reflects significant softening of the internal structure. A similar effect was previously reported for oil-in-water emulsions containing green tea extract, where polyphenols interfered with droplet packing and weakened the continuous network. This supports the hypothesis that polyphenolic compounds may act as internal microstructure modifiers [36].
A comparable trend was reported for chamomile extract, which improved the flowability of cosmetic ointments at optimal concentrations, resulting in a lighter sensory feel. Consistent with this, formulation F2—containing the lowest extract level—showed the lowest viscosity at 0.001 s−1, indicating a weaker structure at rest and easier initial deformation. Conversely, F3, with the highest viscosity at low shear, formed a markedly stronger network and produced a denser initial feel upon application [37,38].
Higher extract concentrations (F3–F4) were associated with distinctive changes in flow parameters (Table 7). F3, which had the highest low-shear viscosity, exhibited strong structure at low shear but lacked a reliable η0 fit, suggesting that the system remained highly structured within the accessible shear range. Although F4 showed lower low-shear viscosity than F3, it exhibited one of the highest η∞ values (0.28 Pa·s), indicating enhanced resistance to flow at elevated deformation rates. These effects may reflect partial thickening of the dispersed phase or stronger droplet–droplet interactions at higher extract loadings.
Such concentration-dependent transitions—from structural softening at low extract levels to over-structuring at higher levels—are consistent with findings for emulsions enriched with licorice root, green tea, and grape seed extracts. In these systems, increased polyphenol content intensified interfacial interactions and reduced lubrication efficiency under high shear. These parallels support the interpretation that the rheological behavior of extract-loaded emulsions is governed by both extract concentration and specific physicochemical interactions with the emulsifier matrix [36,39,40].
3.2.3. Viscoelastic Properties and Structural Behavior
The frequency sweep tests (Figure 2) revealed that the storage modulus (G′) was higher than the loss modulus (G″) across the entire frequency range for all samples, confirming a dominant solid-like, elastic behavior. Maximum values of G′ and G″ are presented in Table 9.
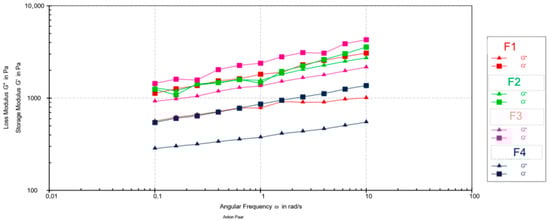
Figure 2.
Mechanical spectra (G′ and G″ vs. angular frequency) for emulsion creams F1–F4.
Table 9.
G′ and G″ vs. angular frequency for emulsion creams F1–F4.
Statistical analysis (one-way ANOVA followed by Tukey’s HSD post hoc test, p < 0.05) confirmed significant differences in viscoelastic parameters among the tested formulations. Based on the maximum storage modulus (G′), formulation F4 showed the lowest value, indicating the least elastic structure, while F1 and F2 showed moderate elasticity. Formulation F3 showed the highest G′, indicating the stiffest internal network. Regarding the loss modulus (G″), three distinct subsets were observed: F4 showed the lowest viscous component, F1 showed an intermediate value, while F2 and F3 showed significantly higher G″ values, indicating a more pronounced viscous behavior. The tan δ values further divided the samples into elastic (F1, F4; tan δ < 0.5) and viscous-dominant systems (F2, F3; tan δ > 0.5).
This classification is consistent with the frequency scan profiles, which showed a clear dominance of G′ over G″ for formulations F1, F3, and F4 over the entire frequency range. In contrast, formulation F2 showed intervals in which G′ and G″ were comparable, indicating a partial loss of elastic dominance and a shift toward a more viscous structural response.
The pronounced decrease in both viscoelastic moduli (G′ and G″) observed for F4 reflects the structural softening induced by the highest extract concentration. Similar concentration-dependent modulus reductions were observed in emulsions containing calendula or chamomile extracts, where the phytoconstituents disrupt droplet interactions and weaken the continuous network [37,38].
A particularly noteworthy finding was the behavior of formulation F3, which exhibited the highest G′ yet also a relatively high tan δ (>0.5). This combination suggests a complex structure that is both rigid and capable of energy dissipation, resulting in enhanced deformability. Research on biopolymer- and polysaccharide-based emulsions has shown that specific interactions between natural polymers and emulsifiers can lead to a “rigid-yet-yielding” network, simultaneously strengthening the elastic matrix while increasing its viscous response under stress [41,42].
Previous studies on plant-extract-enriched emulsions have also shown that polyphenols and low-molecular-weight sugars increase tan δ by reducing interparticle cohesion, resulting in softer, less sticky formulations [43,44]. This trend is consistent with our sensory data, where formulations with higher tan δ (F2, F3) were perceived as less sticky and greasy. These findings indicate that walnut leaf extract not only modulates the structural integrity of the emulsion but also contributes to the viscoelastic balance that governs texture and sensory perception.
The higher standard deviations observed for F1 and F2 probably reflect slight microstructural heterogeneity within these systems. For F1, this variability originates from inherent structural fluctuations of the base emulsion, while for F2, it may be the result of initial interactions between the phenolic compounds present and the emulsifier network. Such variability is often observed in emulsions with complex interfacial structures [35].
The thermal behavior of emulsions stabilized with Olivem-type emulsifiers is well documented. Previous studies have shown that such formulations maintain a stable viscoelastic structure and predictable temperature-dependent viscosity over a wide range, without signs of structural collapse. In emulsions based on the same emulsifier used in our work, viscosity monitoring during cooling showed consistent shear-thinning behavior and the absence of destabilization, indicating the intrinsic thermal robustness of the lamellar network formed by Cetearyl Olivate and Sorbitan Olivate [45].
The observed rheological differences can also be explained by the phytochemical composition of the extract, which varies proportionally with the applied concentration. The high content of ellagic acid in F2 probably acts synergistically on the film formed by Olivem emulsifiers, leading to a stronger viscous response and the highest tan δ (0.75), consistent with the compact arrangement of droplets seen microscopically. At higher concentrations (3–5%), more hydrophilic flavonoids and phenolic acids interfere with droplet packing and partially disrupt the emulsifier network, as reflected in the increased G, but also increased dissipation in F3 (tanδ = 0.57), and in the structural softening observed for F4, which showed the lowest G′and G″values [28].
These trends can be explained by the high content of phenols and flavonoids and the strong antioxidant activity of walnut leaf extract. Polyphenols can interact with surfactant molecules and, at low concentrations, partially adsorb at the oil-water interface, strengthening the interfacial film that forms the emulsifier [29].
3.2.4. Thixotropic Behavior and Recovery
The thixotropic loop test was performed to evaluate the time-dependent recovery of the creams’ structure following shear deformation. The area enclosed by the hysteresis loop, presented in Figure 3 and Table 10, serves as a quantitative indicator of thixotropy, where a larger area corresponds to slower structural recovery.
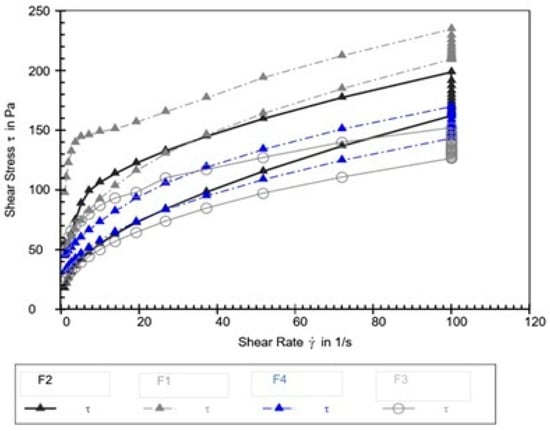
Figure 3.
Hysteresis loops for emulsion creams F1–F4.
Table 10.
Hysteresis loop area for formulations F1–F4.
Thixotropy—the reversible, time-dependent decrease and recovery of viscosity under shear—is a critical rheological property reflecting the internal structural dynamics of emulsified systems. The significant variation in hysteresis loop area among the tested formulations indicates that the walnut leaf extract profoundly affected the kinetics of breakdown and recovery of the internal microstructure.
Formulation F2 displayed the largest hysteresis loop area, indicating the slowest structural recovery after shear cessation. Studies examining emulsions containing botanical extracts have shown that certain phenolic compounds and glycosides can induce a more complex, weakly bonded microstructure that, once disrupted, requires more time to rebuild [46,47]. This pattern suggests that, at lower extract concentrations (such as 1%), the walnut extract components may form transient interactions within the emulsion network—perhaps through weak hydrogen bonding or polyphenol—surfactant associations—that hinder rapid reorganization, thereby enlarging the hysteresis area.
Conversely, formulations F3 and F4 exhibited the smallest hysteresis loop areas, reflecting faster recovery and suggesting a shift in the structural dynamics at higher extract concentrations. Research on polyphenol-rich plant extracts has demonstrated that, above a certain concentration threshold, these compounds can promote bridging flocculation or depletion-induced reassociation, thereby facilitating rapid reformation of the emulsion network [48,49]. Such a mechanism could explain the accelerated recovery observed at 3–5% walnut extract concentrations, indicating a concentration-dependent transition in the extract’s rheological role—from a structure modifier that introduces fragility to one that enhances reformation kinetics.
The control formulation (F1) exhibited an intermediate hysteresis area, confirming that the base emulsion matrix itself possesses an inherent, moderate thixotropic character. The pronounced alteration of this property by the walnut extract—slowing recovery at 1% and accelerating it at higher concentrations—demonstrates its dual and concentration-dependent influence on the rheological characteristics of the emulsion. Similar nonlinear effects of plant-derived actives on emulsion thixotropy have been reported, emphasizing that these bioactives can fine-tune texture, spreadability, and recovery dynamics through complex physicochemical interactions rather than simple viscosity modulation [50,51].
Overall, these results highlight that thixotropy provides an important rheological fingerprint for evaluating the formulation’s structural behavior during application and consumer perception, as it bridges the gap between mechanical response and practical performance during product application.
3.3. Microscopic Analysis
Optical microscopy (400×) revealed clear effects of walnut leaf extract on the microstructure of the emulsion in a concentration-dependent manner. The control formulation (F1) showed a uniform distribution of small droplets, while F2 (1% extract) showed a more compact and densely packed droplet network, consistent with an increased elastic modulus. For 3% extract (F3), micrographs showed enlarged droplets, a broader size distribution, and partial aggregation, indicating disruption of the interfacial film. For F4 (5% extract), the structure became more uniform again, although still modified compared to the control. These results visually confirm that the extract interacts with the emulsifier network and affects the droplet organization (Figure 4).
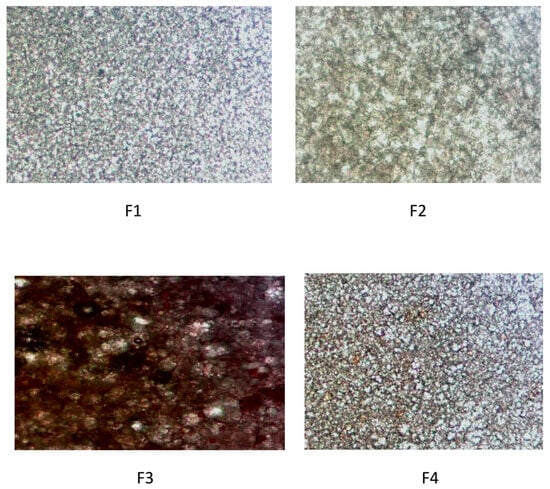
Figure 4.
Optical micrographs of formulations F1–F4 (400× magnification).
The most pronounced destabilization of the emulsion microstructure was observed at the intermediate extract concentration (F3), which showed enlarged droplets, a broader size distribution, and partial aggregation. This concentration-dependent effect is in accordance with studies describing two-phase interactions between polyphenols and interfacial films. Namely, at low levels (F2), polyphenols can strengthen the interfacial layer through hydrogen bonds and improved packing, while at moderate concentrations, they pack at the pre-surface region, disrupting the emulsifier action and promoting flocculation. At higher concentrations (F4), the increased amount of polysaccharides and phenolic compounds increases the viscosity of the continuous phase, which partially restores structural coherence and limits droplet mobility. Similar effects of plant extracts on the emulsion microstructure have been described in other studies [31,37,52].
3.4. Sensory Evaluation
The sensory profiles of the cream formulations (F1–F4) were assessed by a human panel to evaluate consumer-relevant attributes during different stages of application. The Friedman test, followed by Fisher’s LSD post hoc analysis, revealed statistically significant differences (p < 0.05) in several key attributes, as detailed in Table 11.
Table 11.
Results of the sensory evaluation: Chi-square (χ2), p-values from the Friedman test, and rank sums from Fisher’s LSD post hoc test for formulations F1–F4. Different superscript letters (a, b, c) within a row indicate significant differences (p < 0.05).
Before Application: A significant difference was observed only in the attribute of Elasticity. Formulations F2 and F4 were perceived as significantly more elastic than F1 and F3 when manipulated between the fingers.
During Application: Marked differences were recorded for Stickiness, Greasiness, and Absorption Rate.
Stickiness and Greasiness: The control formulation without the extract (F1) was rated as the stickiest and greasiest during application. A clear trend of decreasing stickiness and greasiness was observed with increasing extract concentration, with formulation F4 (5% extract) being perceived as the least sticky and greasy.
Absorption Rate: Conversely, the Absorption Rate showed an inverse relationship with the extract concentration. Formulation F4 was perceived as having the fastest absorption, while the base formulation F1 was rated as having the slowest absorption.
After-Feel Phase: The significant difference in Greasiness persisted 10 min after application. Formulation F4 was judged to be significantly less greasy than F1 and F2, reinforcing the trend observed during the application phase.
A radar chart of the rank sums for these significant attributes (Figure 5) provides a visual overview of the distinct sensory profiles of the four formulations, highlighting the progressive improvement in sensory properties with higher extract concentrations.
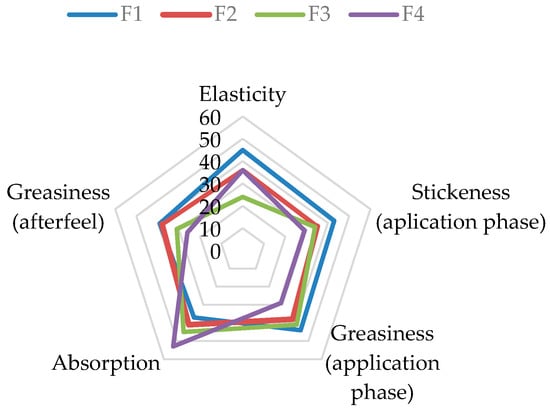
Figure 5.
Radar chart illustrating the rank sums of sensory attributes with significant differences for cream formulations F1–F4. (Note: For Stickiness and Greasiness, a lower rank sum is desirable, indicating less intensity. For Absorption and Elasticity, a higher rank sum is desirable.
Sensory evaluation is generally defined as the assessment of product quality using information perceived through the human senses [53]. According to the results of the sensory analysis, the investigated formulations differed significantly in terms of elasticity, thickness, greasiness, and absorption during the application phase, as well as in greasiness in the after-feel phase. There were no differences in the texture and spreadability of the samples. It was observed that the addition and increasing concentration of walnut extract resulted in a significant decrease in stickiness and greasiness during application, as well as reduced greasiness in the after-feel phase, accompanied by an improved absorption rate. This aligns perfectly with the primary goal of formulating a semisolid product that spreads smoothly upon application without leaving a greasy or sticky sensation on the skin [54]. There are several potential explanations for such results. Walnut leaf extract contains hydrophilic components, such as polyphenols and flavonoids, which increase the water affinity of the formulation. The increased hydrophilicity reduces the greasy and sticky sensations on the skin [55]. Also, the addition of some extracts may alter the viscosity or textural profile of the formulation: it can increase or decrease viscosity, affect droplet size, and modify the rheological behavior of the emulsion. If the extract facilitates the dispersion of oil droplets in the aqueous phase or reduces the cohesiveness of the oily phase, the perception of greasiness and stickiness may be diminished [33,56].
The sensory perception of skincare products during application is influenced by the physicochemical properties of the film formed on the skin and its interaction with the skin surface. These properties change over time during application due to shear-induced rheological changes, evaporation, melting of solids, emulsion restructuring, interaction with skin secretions, and absorption into the stratum corneum [57].
The increasing reliance on objective measurement tools in cosmetic science is also reflected in the work of Michelini et al., who applied non-invasive imaging techniques to quantify changes in skin appearance following the use of an oral supplement. Although their study focuses on clinical skin outcomes rather than formulation behavior, both approaches emphasize the importance of reducing subjectivity and complement traditional sensory evaluation with robust, instrument-based assessment methods [58].
3.5. Summary of Sensory and Rheological Correlations
Table 12 presents an overview of the sensory attributes assessed before, during, and after application of the tested emulsion creams, together with the rheological parameters most relevant to describe each sensory effect. The formulations that showed the most pronounced expression of each attribute are also indicated.
Table 12.
Overview of the relationship between sensory attributes and corresponding rheological parameters for emulsion creams.
The integrated dataset of sensory attributes and rheological parameters (Table 12) highlights a clear pattern of relationships between instrumental measurements and perceived product performance. Matching each sensory descriptor with a corresponding rheological indicator provides an opportunity for texture optimization beyond subjective feedback.
Before application, the differences in consistency and elasticity closely followed the trends observed in low shear viscosity and elastic modulus within the LVER. Formulations F1 and F3, which showed higher η0.001 and mean G′ values, were perceived as denser and firmer, while F2—with the highest G′ in the LVER—was rated as the most elastic. These findings are consistent with the established relationship between initial viscoelastic strength and tactile impression of firmness and cohesiveness during absorption [59]. During application, the sensory attributes of lubricity, stickiness, greasiness, and absorbency reflected the creams’ flow and thixotropy behavior. Formulation F2 exhibited the lowest infinite shear viscosity and the most pronounced shear behavior, which explains its superior lubricity [6].
In contrast, its large hysteresis loop area corresponded to a slower structural recovery, which the panelists associated with greater stickiness. In contrast, F3 and F4 showed smaller loop areas, consistent with reduced stickiness and a faster absorption sensation, especially noticeable for F4, the sample with the lowest η∞ [53,60].
The progressive decrease in perceived fatness from F1 to F4 reflected a decrease in G″ and tan δ values, supporting the interpretation that viscous dissipation contributes to the perception of a heavier, fattier film.
After application, the residual film feel correlated with the elastic response of the formulations. F1, characterized by a more stable elastic structure (higher G′ and lower tan δ), was perceived as leaving a more noticeable film on the skin, while F4, with a more flexible and faster-recovering structure, resulted in a lighter feel after application. These patterns are consistent with the previously discussed effects of extract concentration on microstructure, droplet packing, and viscoelastic equilibrium [60].
Such correlations between instrumental and sensorial parameters align with the broader industry shift toward predictive modeling approaches. As shown by Di Guardo et al., AI-driven frameworks can integrate rheological, physicochemical, and safety data to forecast product performance, and the present findings contribute experimentally validated relationships that could serve as inputs for future predictive tools [61].
Overall, the combined sensory-instrumental data confirm that walnut leaf extract acts as a concentration-dependent microstructure modifier. At low levels (1%), the extract improves the elastic structure and improves lubricity, while higher levels (3–5%) promote faster structural recovery, reduced fat content, and improved absorption. These findings reinforce the potential of the extract to influence both the rheological and sensory characteristics of topical formulations.
4. Conclusions
A comprehensive rheological and sensory evaluation of emulsion creams containing different concentrations of walnut leaf extract (Juglans regia L.) showed that the extract acted as a clear concentration-dependent modulator of structure and tactile performance. At low concentration (1%, F2), the extract improved the elastic response within the linear viscoelastic region and increased the shear-thinning ratio, indicating the formation of a compact and well-organized network that improved lubricity. These effects are consistent with the observed microstructural compaction and suggest beneficial surface interactions between the extract components and the emulsifier matrix. The comparison of instrumental parameters (η∞, G′, G″, tan δ, hysteresis loop area) with sensory attributes (lubricity, greasiness, stickiness, absorption) shows that the rheological behavior of the formulations closely reflects their tactile performance during use. Overall, walnut leaf extract showed a clear ability to fine-tune both the mechanical response and sensory characteristics of the emulsions. At a concentration of 1%, it strengthens the structural network and improves lubricity, while higher concentrations (≥3%) contribute to a less greasy skin feel and faster structural recovery. These findings highlight the potential of walnut leaf extract as a multifunctional, natural ingredient for the development of stable and sensory-appealing cosmetic formulations.
Author Contributions
Conceptualization, M.K. and M.T.; methodology, M.A. (Miljan Adamovic), A.A., A.B. and M.T.; software, J.D.; validation, D.P., M.A. (Marijana Andjic) and M.T.; formal analysis, J.D., O.K., J.Z. and M.T.; investigation, A.A. and M.K.; resources, M.A. (Miljan Adamovic); data curation, M.T.; writing—original draft preparation, M.A. (Miljan Adamovic), A.A. and A.B.; writing—review and editing, O.K., M.A. (Marijana Andjic) and M.T.; visualization, M.T.; supervision, D.P.; project administration, M.T.; funding acquisition, M.A. (Miljan Adamovic). All authors have read and agreed to the published version of the manuscript.
Funding
This research received no funding.
Institutional Review Board Statement
Not applicable.
Data Availability Statement
The data presented in this study are available in this article.
Acknowledgments
This research was supported by the Pharmacy Institution “Zdravlje Lek”, Prvomajska 100, 11000 Belgrade, Serbia, the Ministry of Science, Technological Development, and Innovation, Republic of Serbia through Grant Agreements with the University of Kragujevac—Faculty of Medical Sciences No. 451-03-137/2025-03/200111 and the Faculty of Medical Sciences, University of Kragujevac (Junior Project 15/25). AI assistance (ChatGPT, OpenAI, GPT-5.2.) was used only for language polishing; all data, analyses, and interpretations were produced by the authors.
Conflicts of Interest
The authors declare no conflicts of interest.
Abbreviations
The following abbreviations are used in this manuscript:
| ISO | International Organization for Standardization |
| LVER | linear viscoelastic region |
| J. regia | Juglans regia |
References
- Akanny, E.; Kohlmann, C. Predicting Tactile Sensory Attributes of Personal Care Emulsions Based on Instrumental Characterizations: A Review. Int. J. Cosmet. Sci. 2024, 46, 1035–1063. [Google Scholar] [CrossRef]
- He, J.; Qian, X.; Huang, H.; Lin, B.; Zhang, J.; Zhang, C.; Chen, Y. Construction of a Model for Predicting Sensory Attributes of Cosmetic Creams Using Instrumental Parameters Based on Machine Learning. Appl. Rheol. 2025, 35, 20250044. [Google Scholar] [CrossRef]
- Evangelista, M.; Mota, S.; Almeida, I.F.; Pereira, M.G. Usage Patterns and Self-Esteem of Female Consumers of Antiaging Cosmetic Products. Cosmetics 2022, 9, 49. [Google Scholar] [CrossRef]
- Savary, G.; Gilbert, L.; Grisel, M.; Picard, C. Instrumental and Sensory Methodologies to Characterize the Residual Film of Topical Products Applied to Skin. Ski. Res. Technol. 2019, 25, 415–423. [Google Scholar] [CrossRef]
- ISO 6658:2017; Sensory Analysis—Methodology—General Guidance. ISO: Geneva, Switzerland, 2017. Available online: https://www.iso.org/standard/65519.html (accessed on 20 October 2025).
- Huynh, A.; Garcia, A.G.; Young, L.K.; Szoboszlai, M.; Liberatore, M.W.; Baki, G. Measurements Meet Perceptions: Rheology-Texture-Sensory Relations When Using Green, Bio-Derived Emollients in Cosmetic Emulsions. Int. J. Cosmet. Sci. 2021, 43, 11–19. [Google Scholar] [CrossRef]
- Lee, H.-J.; Kim, S.R.; Kim, B.S.; Lee, S.; Yi, Y.J.; Jeon, H.B.; Son, M.; Park, K.; Park, C.H.; Oh, H.; et al. Prediction of Sensory Textures of Cosmetics Using Large Amplitude Oscillatory Shear and Extensional Rheology. Appl. Rheol. 2024, 34, 20240016. [Google Scholar] [CrossRef]
- Adejokun, D.A.; Dodou, K. Quantitative Sensory Interpretation of Rheological Parameters of a Cream Formulation. Cosmetics 2019, 7, 2. [Google Scholar] [CrossRef]
- Ali, A.; Skedung, L.; Burleigh, S.; Lavant, E.; Ringstad, L.; Anderson, C.; Wahlgren, M.; Engblom, J. Relationship between Sensorial and Physical Characteristics of Topical Creams: A Comparative Study on Effects of Excipients. Int. J. Pharm. 2022, 613, 121370. [Google Scholar] [CrossRef] [PubMed]
- Brummer, R.; Godersky, S. Rheological Studies to Objectify Sensations Occurring When Cosmetic Emulsions Are Applied to the Skin. Colloids Surf. A Physicochem. Eng. Asp. 1999, 152, 89–94. [Google Scholar] [CrossRef]
- Lukic, M.; Jaksic, I.; Krstonosic, V.; Cekic, N.; Savic, S. A Combined Approach in Characterization of an Effective w/o Hand Cream: The Influence of Emollient on Textural, Sensorial and in Vivo Skin Performance. Int. J. Cosmet. Sci. 2012, 34, 140–149. [Google Scholar] [CrossRef]
- Dubuisson, P.; Picard, C.; Grisel, M.; Savary, G. How Does Composition Influence the Texture of Cosmetic Emulsions? Colloids Surf. A Physicochem. Eng. Asp. 2018, 536, 38–46. [Google Scholar] [CrossRef]
- Lee, J.; Lu, J.; Potanin, A.; Boyke, C. Prediction of Tactile Sensory Attributes of Facial Moisturizers by Rheology and Tribology. Biotribology 2021, 28, 100201. [Google Scholar] [CrossRef]
- Adamovic, M.; Adamovic, A.; Andjic, M.; Dimitrijevic, J.; Zdravkovic, N.; Kostic, O.; Pecarski, D.; Pecarski, T.; Obradovic, D.; Tomovic, M. The Botany, Phytochemistry and the Effects of the Juglans Regia on Healthy and Diseased Skin. Cosmetics 2024, 11, 163. [Google Scholar] [CrossRef]
- Stojković, D.; Dragičević, N.; Ivanov, M.; Gajović, N.; Jurišević, M.; Jovanović, I.; Tomović, M.; Živković, J. New Evidence for Cotinus Coggygria Scop. Extracts Application in Gastrointestinal Ailments. Pharmaceuticals 2025, 18, 98. [Google Scholar] [CrossRef] [PubMed]
- Ainsworth, E.A.; Gillespie, K.M. Estimation of Total Phenolic Content and Other Oxidation Substrates in Plant Tissues Using Folin–Ciocalteu Reagent. Nat. Protoc. 2007, 2, 875–877. [Google Scholar] [CrossRef] [PubMed]
- Slinkard, K.; Singleton, V.L. Total Phenol Analysis: Automation and Comparison with Manual Methods. Am. J. Enol. Vitic. 1977, 28, 49–55. [Google Scholar] [CrossRef]
- Chang, C.-C.; Yang, M.-H.; Wen, H.-M.; Chern, J.-C. Estimation of Total Flavonoid Content in Propolis by Two Complementary Colometric Methods. J. Food Drug Anal. 2020, 10, 3. [Google Scholar] [CrossRef]
- Hsu, C.-Y.; Chan, Y.-P.; Chang, J. Antioxidant Activity of Extract from Polygonum Cuspidatum. Biol. Res. 2007, 40, 13–21. [Google Scholar] [CrossRef]
- Brand-Williams, W.; Cuvelier, M.E.; Berset, C. Use of a Free Radical Method to Evaluate Antioxidant Activity. LWT-Food Sci. Technol. 1995, 28, 25–30. [Google Scholar] [CrossRef]
- Stolić Jovanović, A.; Martinović, M.; Žugić, A.; Nešić, I.; Tosti, T.; Blagojević, S.; Tadić, V.M. Derivatives of L-Ascorbic Acid in Emulgel: Development and Comprehensive Evaluation of the Topical Delivery System. Pharmaceutics 2023, 15, 813. [Google Scholar] [CrossRef]
- Standard Guide for Two Sensory Descriptive Analysis Approaches for Skin Creams and Lotions. Available online: https://store.astm.org/e1490-19.html (accessed on 22 October 2025).
- Barjaktarević, A.; Coneac, G.; Cupara, S.; Kostić, O.; Kostić, M.; Olariu, I.; Vlaia, V.; Cotan, A.-M.; Neamu, Ş.; Vlaia, L. Novel Alkyl-Polyglucoside-Based Topical Creams Containing Basil Essential Oil (Ocimum basilicum L. Lamiaceae): Assessment of Physical, Mechanical, and Sensory Characteristics. Pharmaceutics 2025, 17, 934. [Google Scholar] [CrossRef]
- Chiarentin, L.; Cardoso, C.; Miranda, M.; Vitorino, C. Rheology of Complex Topical Formulations: An Analytical Quality by Design Approach to Method Optimization and Validation. Pharmaceutics 2023, 15, 1810. [Google Scholar] [CrossRef] [PubMed]
- Budai, L.; Budai, M.; Fülöpné Pápay, Z.E.; Vilimi, Z.; Antal, I. Rheological Considerations of Pharmaceutical Formulations: Focus on Viscoelasticity. Gels 2023, 9, 469. [Google Scholar] [CrossRef] [PubMed]
- Calienni, M.N.; Martínez, L.M.; Izquierdo, M.C.; Alonso, S.d.V.; Montanari, J. Rheological and Viscoelastic Analysis of Hybrid Formulations for Topical Application. Pharmaceutics 2023, 15, 2392. [Google Scholar] [CrossRef]
- Zhumabek, M.; Kachkinova, A.; Cochennec, M.; Colombano, S.; Amanbek, Y.; Wang, Y.; Omirbekov, S. Stability and Rheological Characterization of Colloidal Gas Aphrons: Influence of Xanthan Gum and Sodium Dodecyl Sulfate. Discov. Appl. Sci. 2025, 7, 432. [Google Scholar] [CrossRef]
- Khan, B.A.; Akhtar, N.; Khan, H.; Braga, V.d.A. Development, Characterization and Antioxidant Activity of Polysorbate Based O/W Emulsion Containing Polyphenols Derived from Hippophae Rhamnoides and Cassia Fistula. Braz. J. Pharm. Sci. 2013, 49, 763–773. [Google Scholar] [CrossRef]
- Tessaro, L.; Martelli-Tosi, M.; Sobral, P.J.D.A. Development of W/O Emulsion for Encapsulation of “Pitanga” (Eugenia uniflora L.) Leaf Hydroethanolic Extract: Droplet Size, Physical Stability and Rheology. Food Sci. Technol. 2022, 42, e65320. [Google Scholar] [CrossRef]
- Dabbaghi, M.; Namjoshi, S.; Panchal, B.; Grice, J.E.; Prakash, S.; Roberts, M.S.; Mohammed, Y. Viscoelastic and Deformation Characteristics of Structurally Different Commercial Topical Systems. Pharmaceutics 2021, 13, 1351. [Google Scholar] [CrossRef]
- Tang, S.; Yang, X.; Wang, C.; Wang, C. Effects of Polyphenols on the Structure, Interfacial Properties, and Emulsion Stability of Pea Protein: Different Polyphenol Structures and Concentrations. Molecules 2025, 30, 1674. [Google Scholar] [CrossRef]
- Mieles-Gómez, L.; Lastra-Ripoll, S.E.; Torregroza-Fuentes, E.; Quintana, S.E.; García-Zapateiro, L.A. Rheological and Microstructural Properties of Oil-in-Water Emulsion Gels Containing Natural Plant Extracts Stabilized with Carboxymethyl Cellulose/Mango (Mangiferaindica) Starch. Fluids 2021, 6, 312. [Google Scholar] [CrossRef]
- Serra, M.; Botelho, C.; Almeida, H.; Casas, A.; Teixeira, J.A.; Barros, A.N. Stable and Functional Cosmetic Creams Enriched with Grape Stem Extract: A Sustainable Skincare Strategy. Antioxidants 2025, 14, 784. [Google Scholar] [CrossRef]
- Romero-Peña, M.; Ghosh, S. Effect of Water Content and Pectin on the Viscoelastic Improvement of Water-in-Canola Oil Emulsions. Fluids 2021, 6, 228. [Google Scholar] [CrossRef]
- Tadros, T.F. Emulsion Formation, Stability, and Rheology. In Emulsion Formation and Stability; John Wiley & Sons, Ltd.: Hoboken, NJ, USA, 2013; pp. 1–75. [Google Scholar]
- Tuyishime, M.A.; Hitabatuma, A.; Matabaro, E. Green Tea Polyphe Behavior, Nano; Academia: Hemel Hempstead, UK, 2016; Volume 5. [Google Scholar]
- Klimaszewska, E.; Seweryn, A.; Małysa, A.; Zięba, M.; Lipińska, J. The Effect of Chamomile Extract Obtained in Supercritical Carbon Dioxide Conditions on Physicochemical and Usable Properties of Pharmaceutical Ointments. Pharm. Dev. Technol. 2018, 23, 780–786. [Google Scholar] [CrossRef] [PubMed]
- Liu, N.; Fu, X.; Duan, D.; Xu, J.; Gao, X.; Zhao, L. Evaluation of Bioactivity of Phenolic Compounds from the Brown Seaweed of Sargassum Fusiforme and Development of Their Stable Emulsion. J. Appl. Phycol. 2018, 30, 1955–1970. [Google Scholar] [CrossRef]
- Nasiri, L.; Gavahian, M.; Majzoobi, M.; Farahnaky, A. Rheological Behavior of Glycyrrhiza Glabra (Licorice) Extract as a Function of Concentration and Temperature: A Critical Reappraisal. Foods 2020, 9, 1872. [Google Scholar] [CrossRef]
- Büyük, M.; Ata, A.; Yemenicioğlu, A. Application of Pectin-Grape Seed Polyphenol Combination Restores Consistency and Emulsion Stability and Enhances Antioxidant Capacity of Reduced Oil Aquafaba Vegan Mayonnaise. Food Bioprod. Process. 2024, 144, 123–131. [Google Scholar] [CrossRef]
- Bais, D.; Trevisan, A.; Lapasin, R.; Partal, P.; Gallegos, C. Rheological Characterization of Polysaccharide–Surfactant Matrices for Cosmetic O/W Emulsions. J. Colloid Interface Sci. 2005, 290, 546–556. [Google Scholar] [CrossRef]
- Dickinson, E. Biopolymer-Based Particles as Stabilizing Agents for Emulsions and Foams. Food Hydrocoll. 2017, 68, 219–231. [Google Scholar] [CrossRef]
- Chen, D.; Stone, S.; Ilavsky, J.; Campanella, O. Effect of Polyphenols on the Rheology, Microstructure and in Vitro Digestion of Pea Protein Gels at Various pH. Food Hydrocoll. 2024, 151, 109827. [Google Scholar] [CrossRef]
- Hayati, I.N.; Hui, C.H.; Ishak, W.R.W.; Yusof, H.M.; Hanidun, S.M. Effect of Black Seed Oil, Honey, Whey Protein Concentrate and Their Interaction on Antioxidant Activity, Elastic Modulus and Creaming Index of O/W Emulsions. J. Dispers. Sci. Technol. 2020, 41, 1925–1936. [Google Scholar] [CrossRef]
- Stabrauskiene, J.; Mazurkevičiūtė, A.; Majiene, D.; Balanaskiene, R.; Bernatoniene, J. Development and Evaluation of an Anti-Inflammatory Emulsion: Skin Penetration, Physicochemical Properties, and Fibroblast Viability Assessment. Pharmaceutics 2025, 17, 933. [Google Scholar] [CrossRef]
- Guo, L.-P.; Han, X.; Lei, Y.; Wang, L.; Yu, P.-F.; Shi, S. Study on the Thixotropy and Structural Recovery Characteristics of Waxy Crude Oil Emulsion. Pet. Sci. 2021, 18, 1195–1202. [Google Scholar] [CrossRef]
- Karazhiyan, H.; Razavi, S.M.A.; Phillips, G.O.; Fang, Y.; Al-Assaf, S.; Nishinari, K.; Farhoosh, R. Rheological Properties of Lepidium sativum Seed Extract as a Function of Concentration, Temperature and Time. Food Hydrocoll. 2009, 23, 2062–2068. [Google Scholar] [CrossRef]
- Pastrana-Pastrana, Á.J.; Flores-Gallegos, A.C.; Roa-Acosta, D.F.; Rodríguez-Herrera, R.; Solanilla-Duque, J.F. Rheological Behavior of Quinoa, Lentil, and Rice Flour Mixtures under Different pH Conditions. Food Hydrocoll. 2025, 158, 110457. [Google Scholar] [CrossRef]
- Di Mambro, V.M.; Fonseca, M.J.V. Assays of Physical Stability and Antioxidant Activity of a Topical Formulation Added with Different Plant Extracts. J. Pharm. Biomed. Anal. 2005, 37, 287–295. [Google Scholar] [CrossRef]
- Fanwa, M.N.; Hucher, N.; Cheumani, A.M.Y.; Ndikontar, M.K.; Malhiac, C.; Grisel, M. Rheological Properties of Triumfetta cordifolia Gum Solutions in the Concentrated Regime. Int. J. Biol. Macromol. 2024, 279, 135335. [Google Scholar] [CrossRef]
- Lin, H.-Y.; Tsai, J.-C.; Lai, L.-S. Effect of Salts on the Rheology of Hydrocolloids from Mulberry (Morus alba L.) Leaves in Concentrated Domain. Food Hydrocoll. 2009, 23, 2331–2338. [Google Scholar] [CrossRef]
- Ribeiro, A.; Bravo, C.; Ramos, R.; Dias, R.; Mateus, N.; de Freitas, V.; Perez, R.; Soares, S. Polyphenols as Enhancers of Emulsifying and Antioxidant Properties of Egg and Yeast Protein Emulsions: Understanding the Molecular Interactions behind Their Technological and Functional Potential. Food Hydrocoll. 2025, 167, 111399. [Google Scholar] [CrossRef]
- Morávková, T.; Stern, P. Rheological and Textural Properties of Cosmetic Emulsions. Appl. Rheol. 2011, 21, 35200. [Google Scholar] [CrossRef]
- Garg, A.; Aggarwal, D.; Garg, S.; Singla, A.K. Spreading of Semisolid Formulations: An Update. Pharm. Technol. N. Am. 2002, 26, 84. [Google Scholar]
- Arct, J.; Oborska, A.; Mojski, M.; Binkowska, A.; Świdzikowska, B. Common Cosmetic Hydrophilic Ingredients as Penetration Modifiers of Flavonoids. Int. J. Cosmet. Sci. 2002, 24, 357–366. [Google Scholar] [CrossRef] [PubMed]
- Bouftira, I.; Abdelly, C.; Sfar, S. Characterization of Cosmetic Cream with Mesembryanthemum Crystallinum Plant Extract: Influence of Formulation Composition on Physical Stability and Anti-Oxidant Activity. Int. J. Cosmet. Sci. 2008, 30, 443–452. [Google Scholar] [CrossRef] [PubMed]
- Boinbaser, L.; Parente, M.E.; Castura, J.C.; Ares, G. Dynamic Sensory Characterization of Cosmetic Creams during Application Using Temporal Check-All-That-Apply (TCATA) Questions. Food Qual. Prefer. 2015, 45, 33–40. [Google Scholar] [CrossRef]
- Michelini, S.; Greco, M.E.; Vespasiani, G.; Trovato, F.; Chello, C.; Musolff, N.; Cantisani, C.; Pellacani, G. Non-Invasive Imaging for the Evaluation of a New Oral Supplement in Skin Aging: A Case-Controlled Study. Ski. Res. Technol. 2025, 31, e70171. [Google Scholar] [CrossRef]
- Imbart, S.; Laplanche, A.; Ruzic, C.; Lavarde, M.; Marull-Tufeu, S.; Bernard, C.; Pensé-Lhéritier, A.-M.; Aoussat, A. Design of a Sensorial-Instrumental Correlation Methodology for a Category of Cosmetic Products: O/W Emulsions. Cosmetics 2022, 9, 84. [Google Scholar] [CrossRef]
- Agyei-Amponsah, J. Sensory, Rheology, Tribology and Shelflife of Reduced Fat Mayonnaise-Type Emulsions Formulated with Lipid-Modified Maize Starch as Fat Replacer. Ph.D. Thesis, University of Pretoria, Pretoria, South Africa, 2019. [Google Scholar]
- Di Guardo, A.; Trovato, F.; Cantisani, C.; Dattola, A.; Nisticò, S.P.; Pellacani, G.; Paganelli, A. Artificial Intelligence in Cosmetic Formulation: Predictive Modeling for Safety, Tolerability, and Regulatory Perspectives. Cosmetics 2025, 12, 157. [Google Scholar] [CrossRef]


Disclaimer/Publisher’s Note: The statements, opinions and data contained in all publications are solely those of the individual author(s) and contributor(s) and not of MDPI and/or the editor(s). MDPI and/or the editor(s) disclaim responsibility for any injury to people or property resulting from any ideas, methods, instructions or products referred to in the content. |
© 2025 by the authors. Licensee MDPI, Basel, Switzerland. This article is an open access article distributed under the terms and conditions of the Creative Commons Attribution (CC BY) license.