Simple Summary
Litchi is valued for its sweet taste and appealing red skin, but varieties like ‘Feizixiao’ often fail to turn fully red at harvest, reducing their commercial value. While the TIFY gene family is known to influence fruit coloring in other plants, its role in litchi was unknown. Herein, 14 TIFY genes were identified in the litchi, and their structures, evolution, and expression patterns were further characterized. Tissue-specific expression was observed among the LcTIFY genes. Notably, three genes—LcPPD1, LcJAZ5, and LcJAZ7—exhibited significant correlations with red pigment accumulation in the pericarp, with their expression levels responding to ABA (coloration promoter) and CPPU (coloration inhibitor) treatments during fruit coloring. These results offer new insights into the genetic control of litchi fruit color and provide valuable targets for breeding programs seeking to enhance fruit appearance and marketability.
Abstract
The TIFY family, known as a novel group of transcription factors unique to the plant, plays a number of roles and has been functionally characterized in numerous plant species. However, TIFY proteins remain unexplored in litchi. Here, we identified 14 TIFY genes in litchi, which were unevenly located on 8 of 15 chromosomes. All of the LcTIFY proteins were predicted to be nuclear-localized and were phylogenetically categorized into four subfamilies (TIFY, PPD, ZML, and JAZ). Duplication analysis detected no tandem duplications but identified one segmental duplication event with LcTIFY genes, suggesting that segmental duplication served as the primary driving force for the expansion of LcTIFY genes. Comparative collinear analysis revealed 12, 5, and 27 collinear gene pairs between litchi and Arabidopsis, rice, and apple, respectively, providing valuable clues for understanding the evolution of the LcTIFY genes. RNA-Seq and qRT-PCR analyses indicated tissue-preferential expression patterns among LcTIFY genes. Notably, LcPPD1 and LcJAZ5 expressions were negatively correlated with anthocyanin accumulation in the ‘Feizixiao’ variety, except that LcJAZ5 displayed a positive correlation under CPPU treatment. In contrast, LcJAZ7 expression showed a positive correlation across all treatments, implicating these genes in the regulation of pericarp pigmentation. Collectively, these findings lay the groundwork for future investigations into the functional roles of TIFY genes in litchi and offer valuable genetic resources for elucidating the mechanisms underlying litchi pigmentation, thereby providing fresh perspectives for subsequent research into the molecular mechanisms of color formation in plants.
1. Introduction
TIFY proteins, which were first identified in Arabidopsis and contain a highly conserved TIFY domain with a core motif TIF[F/Y]XG, previously known as zinc finger proteins, are expressed in the inflorescence meristem (ZIM) family [1,2]. The TIFY gene family can be grouped into four subfamilies, namely, TIFY, (ZIM)/ZIM-like (ZML), PEAPOD (PPD), and JASMONATE ZIM-Domain (JAZ), depending on their conserved domain types [3]. The TIFY subfamily members possess only a TIFY domain. In contrast, the ZML subfamily is distinguished by the combination of a TIFY domain, a CCT domain, and a ZnF_GATA domain. The PPD subfamily exhibits a more complex architecture, containing a TIFY domain, a unique N-terminal PPD domain, and a JAS domain deficient in the PY-NLS motif. Meanwhile, the JAZ subfamily is defined by the presence of both a TIFY domain and a JAS domain.
TIFY transcription factors have been recognized as a novel plant-specific gene family with pleiotropic functions in plant growth and developmental processes. Current functional studies of this family have primarily concentrated on several model species such as Arabidopsis, rice, and tomato. For instance, AtTIFY8 was shown to interact with the co-repressor TOPLESS (TPL) via the adapter protein NOVEL INTERACTOR OF JAZ (NINJA), thereby functioning as a transcriptional repressor. Subsequent studies further linked this repressive activity to reduced root growth in Arabidopsis [4]. Overexpression of OsTIFY subfamily members led to multiple phenotypic effects, including increased flower number, accelerated flowering time, and enhanced culm length and grain weight in rice [5]. AtZML1 and AtZML2 have been identified as essential transcription factors mediating the cry1-dependent photoprotective response in Arabidopsis [6]. AtPPD1 and AtPPD2 (also known as AtTIFY4a and AtTIFY4b, respectively) function as regulators of dispersed meristematic cell proliferation arrest. This regulatory activity enables them to coordinate tissue growth, modulate lamina dimensions, and limit leaf blade curvature [7]. AtJAZ proteins function as key regulators of jasmonate-mediated anthocyanin biosynthesis and trichome development through their interaction with WD-Repeat/bHLH/MYB transcriptional complexes in Arabidopsis [8]. Overexpression of SlJAZ2 in tomato resulted in pleiotropic phenotypic alterations, including reduced plant height and internode length, decreased trichome density, accelerated leaf initiation, earlier lateral bud emergence, and advanced flowering transition [9]. In addition, more studies have found that the TIFY gene family can also regulate seed germination [10], plant hormone signal transduction [11], nodule development and nitrogen fixation [12], biosynthesis of salvianolic acids and tanshinones [13], and so on. Notably, significant advances have also been made in the study of horticultural fruit trees. For instance, studies have shown that AcZML2, AcJAZ9, AcTIFY1 and AcTIFY2 might play important roles in kiwifruit fruit ripening through their expression pattern [14]. Evidence from transgenic tobacco experiments indicated that DlTIFY7 plays a negative regulatory role in anthocyanin accumulation in longan (Dimocarpus longan Lour.) [15]. Exogenous MeJA application revealed significant correlations between the expression of PpJAZ1, PpJAZ4, and PpJAZ5 and fruit pericarp pigmentation in peach (Prunus persica) [16]. In Chinese sand pear (Pyrus pyrifolia), bag removal treatment led to decreased expression of PpJAZ3, PpJAZ8, and PpJAZ11, whereas PpJAZ1, PpJAZ5, PpJAZ7, PpJAZ10, PpPPD1, PpZML1, and PpZML4 were strongly upregulated, displaying an inverse relationship with anthocyanin accumulation [17]. MdJAZ2 protein functions as a negative regulator of anthocyanin biosynthesis and fruit coloration in apple by physically interacting with MdHIR proteins [18]. Integrative analysis of metabolome and transcriptome data revealed that the Tify (Cluster-78338) protein functions as a critical regulatory factor in the anthocyanin biosynthesis pathway during fruit development in L. ruthenicum [19].
Litchi (Litchi chinensis Sonn.), belonging to the Sapindaceae family, is recognized as an economically significant fruit crop in tropical and subtropical areas. The species is believed to have originated in Yunnan, China, and is extensively cultivated throughout the country’s southern regions [20]. Litchi is globally appreciated for its appealing flavor, palatable texture, rich nutritional profile, vibrant appearance, and substantial commercial value. Attractive appearance is a key determinant of fruit attractiveness and marketability. Among the various traits contributing to visual quality, pericarp coloration is especially critical, as it directly influences consumer perception and economic value. However, certain commercially important varieties, such as ‘Feizixiao,’ ‘Guilv,’ and ‘Xinqiumili,’ do not achieve complete reddening by the time of commercial harvest, which coincides with peak sugar accumulation in the aril. This incomplete pigmentation manifests as mottled red patches, restriction of red coloration to the pedicel end, or entirely green fruit. Consequently, this incomplete reddening negatively impacts litchi marketability and consumer appeal. Despite the well-documented involvement of the TIFY proteins in plant developmental processes and fruit anthocyanin pathways, its contribution to these processes in litchi remains poorly understood. Therefore, screening and identifying key genes involved in litchi pericarp coloration and elucidating their underlying molecular regulatory mechanisms are of critical importance. Herein, we performed a systematic identification of the TIFY proteins in litchi using the recently published genome sequence [20]. This was followed by comprehensive bioinformatic characterization, encompassing phylogenetic analysis, conserved motif and domain annotation, chromosomal mapping, mirRNA target prediction, cis-acting element analysis, 3D protein structure prediction, and synteny analysis. Additionally, we explored the expression dynamics of LcTIFY genes across various tissues and in response to exogenous application of ABA (promoting) and CPPU (inhibiting) during pericarp coloration in ‘Feizixiao’ litchi. Our results offer candidate LcTIFY genes and valuable insights for future studies aimed at deciphering the regulatory network governing litchi fruit coloration.
2. Materials and Methods
2.1. Identification of the TIFY Genes in Litchi
Genome sequences of litchi were acquired from the Sapindaceae Genomic Database (http://www.sapindaceae.com/; accessed on 25 December 2025), which provides comprehensive genomic resources including gene annotations file. The Arabidopsis thaliana TIFY (AtTIFY) protein sequences, used as references, were downloaded from the TAIR database (https://www.arabidopsis.org/; accessed on 25 December 2025). Candidate TIFY proteins in litchi were identified using two complementary approaches. Initially, a BLASTP (2.2.19) search was performed against the litchi protein sequences using AtTIFY sequences as queries with an E-value cutoff of 1 × 10⁻⁵. Subsequently, candidates were validated by an HMM search using the TIFY domain profile (PF06200) against the Pfam-A.hmm database and litchi protein sequences file, implemented via the “simple HMM Search” function in TBtools-II (v2.400) [21] (which embeds HMMER v3.0 package). The intersection of the results from the two methods was designated as the final candidate LcTIFY protein set for all downstream analyses.
2.2. Physicochemical Characteristics and Subcellular Localization Prediction
The physicochemical properties of the proteins, such as amino acid length, molecular weight (MW), theoretical isoelectric point (pI), and so on, were determined using the ExPASY ProtParam server (https://www.expasy.org/; accessed on 25 December 2025). Subcellular localization prediction was performed using Cell-PLoc 2.0 (https://www.expasy.org/; accessed on 25 December 2025) and WoLF PSORT (https://wolfpsort.hgc.jp/; accessed on 25 December 2025).
2.3. Phylogenetic Analysis of LcTIFY Proteins
Multiple sequence alignment of Arabidopsis and litchi TIFY proteins was performed using ClustalW (2.0.11). A phylogenetic tree was subsequently constructed via the Maximum Likelihood (ML) method implemented in MEGA11 (11.0.13), with the Kimura 2-parameter model and 1000 bootstrap replicates to assess branch support. All other parameters were kept at default. The final tree was visualized using the iTOL web server (https://itol.embl.de/; accessed on 25 December 2025).
2.4. Structural Features and Organization of LcTIFY Proteins
The MEME Suite (https://meme-suite.org/meme/; accessed on 26 December 2025) and NCBI Batch CD-Search (https://www.ncbi.nlm.nih.gov/Structure/bwrpsb/bwrpsb.cgi; accessed on 25 December 2025) were employed to identify conserved motifs and predict domains in the LcTIFY proteins, respectively. Gene structure information was derived from the litchi genome GFF3 annotation file [20]. These features—gene structures, conserved domains, and motifs—were subsequently combined and graphically represented using TBtools-II (v2.400) [21].
2.5. Prediction of miRNA Target Sites in LcTIFY Genes
Putative miRNA target sites within the coding sequences (CDS) of LcTIFY genes were predicted using the psRNATarget web server (https://www.zhaolab.org/psRNATarget/; accessed on 25 December 2025) with default parameters. The mature miRNA sequences of litchi were retrieved from the Sapindaceae Genomic Database (http://www.sapindaceae.com/; accessed on 25 December 2025). Subsequently, the locations of these predicted target sites on LcTIFY genes were visualized using TBtools-II (v2.400) software [21].
2.6. Protein Secondary Structure Analysis and 3-D Model Construction
The secondary structures of LcTIFY proteins, including α-helices, β-sheets, and random coils, were predicted using the SOPMA algorithm implemented on the NPS@ server (https://npsa-prabi.ibcp.fr/; accessed on 25 December 2025). Subsequently, three-dimensional (3-D) homology models were constructed using the Phyre2 (Protein Homology/analogY Recognition Engine V 2.2) web portal (http://www.sbg.bio.ic.ac.uk/phyre2/; accessed on 25 December 2025) under its normal mode.
2.7. Promoter Analysis and Cis-Regulatory Element Prediction
Putative cis-acting regulatory elements in the 2000 bp promoter regions upstream of the LcTIFY genes start codons were identified using the PlantCARE database (http://bioinformatics.psb.ugent.be/webtools/plantcare/html/; accessed on 25 December 2025). The resulting element distributions were statistically compiled with Microsoft Excel and subsequently visualized using TBtools-II software [21].
2.8. Chromosomal Locations, Evolutionary Rate Calculation, and Synteny Analysis
The chromosomal locations of LcTIFY genes were extracted from the published litchi genome annotation file [20]. The nonsynonymous (Ka) and synonymous (Ks) substitution rates for duplicated gene pairs were calculated using TBtools-II (v2.400) [21]. For comparative genomics, the TIFY protein sequences and corresponding genome data for rice (Oryza sativa) and apple (Malus domestica) were retrieved from the Ensembl Plants database (https://plants.ensembl.org/; accessed on 25 December 2025). Intra- and interspecific collinearity analyses were subsequently performed using the MCScanX algorithm as implemented in TBtools-II [21,22], and the syntenic relationships were visualized with the Advanced Circos function of the same software [21].
2.9. Transcriptome Analysis
Transcriptome Data Analysis: Publicly available RNA-seq data profiling LcTIFY genes expression across various tissues of the ‘Feizixiao’ cultivar were retrieved from the Sapindaceae Genomic Database (http://www.sapindaceae.com/; accessed on 28 December 2025). Additionally, transcriptome data generated in-house (unpublished) were analyzed to investigate expression dynamics during pericarp coloration. These data originated from a field experiment conducted on 26 April 2023 at the Yongfa Experimental Base of the Tropical Fruit Tree Institute, Hainan Academy of Agricultural Sciences, China (19° N, 110° E). In this experiment, foliar application of abscisic acid (ABA, >98% purity, 25 mg/L) (Sangon Biotech, Shanghai, China) or forchlorfenuron (CPPU, >98% purity, 4 mg/L) (Sangon Biotech, Shanghai, China) was performed at 47 days after flowering (DAF) to promote or inhibit pericarp coloration in ‘Feizixiao’ litchi, respectively. Samples were collected weekly, flash-frozen in liquid nitrogen, and stored at −80 °C until further use. The anthocyanin content was measured using a spectrophotometric method. Specifically, 0.2 g of pericarp sample was collected and analyzed following the established protocol reported in the literature [23]. The soluble solid content (SSC) and titratable acidity (TA) of the aril were determined using a PAL-BXIACID F5 sugar-acid meter (ATAGO, Tokyo, Japan). Transcriptome library preparation and sequencing of pericarps of 47d, 63d, and 71d after flowering were performed by Nanjing GENEPIONEER Biotechnology Co., Ltd (Nanjing, China). Transcript abundance was quantified using Salmon v1.0.0 software [24]. For each assay, three biological replicates were included, each with three technical replicates.
2.10. Expression Analysis by qRT-PCR Technology
qRT-PCR Validation: Total RNA was extracted from pericarp samples with Fruit-mate (#9192, Takara, Beijing, China) and RNAiso Plus (#9108, Takara, Takara, Beijing, China) and reverse-transcribed into cDNA using the HiScript III kit (R312-02, Vazyme, Nanjing, China). qRT-PCR was carried out on a Bio-Rad CFX96 system with ChamQ Universal SYBR qPCR Master Mix (Q711, Vazyme, Nanjing, China). Relative expression levels, normalized to the internal references *LcEF-1α* and LcGAPDH [25], were calculated via the 2−ΔΔCT method [26] from three biological replicates, each with three technical replicates. For correlation analysis, a multi-omics plot was generated interactively via the Metware Cloud platform (https://cloud.metware.cn/; accessed on 25 December 2025). Statistical significance was determined using Student’s t-test or one-way ANOVA, as implemented in SPSS v28.0.1.1. Primer sequences for qPCR validation are detailed in Supplementary Table S7.
3. Results
3.1. Identification of TIFY Genes in Litchi
After homology search, 14 TIFY proteins were validated in litchi (Table 1), comprising 1 LcTIFY, 2LcPPDs, 3 LcZMLs, and 8 LcYAZs proteins. Their amino acid lengths varied from 134 to 605 aa, corresponding to molecular weights (MW) of 15.12–66.04 kDa and isoelectric points (pI) of 4.95–10.11. Stability prediction using an instability index of 40 identified LcZML1 and LcJAZ8 as stable and the remaining LcTIFY proteins as unstable. Hydrophilicity analysis indicated that all LcTIFY proteins are hydrophilic (Average Hydrophilic Coefficient < 0), and subcellular localization prediction further suggested that these proteins are targeted to the nucleus (Table 1).

Table 1.
Basic information of TIFY genes in litchi.
3.2. Phylogenetic Relationships Among LcTIFY Proteins
To elucidate the evolutionary relationships and classification of litchi TIFY proteins, a phylogenetic tree was constructed using 32 TIFY protein sequences from Arabidopsis and litchi. The results revealed that all identified LcTIFY proteins clustered into four distinct subfamilies: TIFY, PPD, ZML, and JAZ. Within the JAZ subfamily, five subgroups (JAZ I–V) were resolved. However, no LcTIFY member was assigned to the JAZ I subgroup (Figure 1).
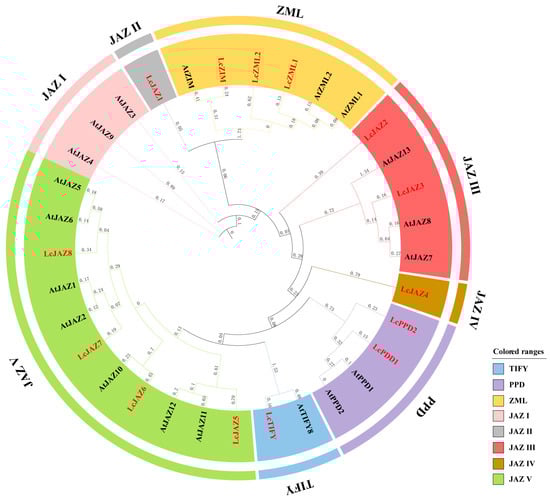
Figure 1.
Phylogenetic relationships among TIFY proteins from Arabidopsis (black) and litchi (red).
3.3. Conserved Motif, Domain, and Gene Structure Organization of LcTIFY Genes
Analysis of structural features revealed that LcTIFY genes within the same subfamily share similar architectures of conserved motifs, protein domains, and exon–intron organization. All LcTIFY proteins possess Motif 1 and the defining TIFY domain (Figure 2A,B). Beyond this common core, subfamily specific features were identified: the PPD subfamily possesses a JAS domain and a unique Motif 6, whereas the ZML subfamily contains CCT and GATA domains, and the JAZ subfamily includes an extra JAS domain. The exon count across LcTIFY genes ranges from 2 to 16 (Figure 2C).
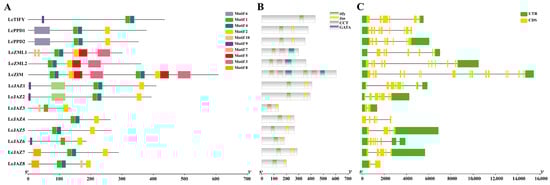
Figure 2.
Conserved motifs, conserved domains, and gene structure of LcTIFYs: (A) conserved motifs; (B) conserved domains; (C) gene structure.
3.4. MiRNA Target Sites in LcTIFY Genes
A total of 33 putative miRNA target sites were identified, distributed across 13 (92.86%) of the LcTIFY genes (Figure 3 and Supplementary Table S1). Among these, LcPPD2, LcZML2, LcZIM, LcJAZ1, LcJAZ5, and LcJAZ2 harbored the highest numbers, with 3, 4, 5, 4, and 3 target sites, respectively. LcZML1, LcJAZ3, LcJAZ7, and LcJAZ8 each contained two target sites, while LcTIFY (member of TIFY subfamily) and LcJAZ6 possessed only one each. In contrast to other LcTIFY members, no miRNA target sites were detected in LcJAZ4.
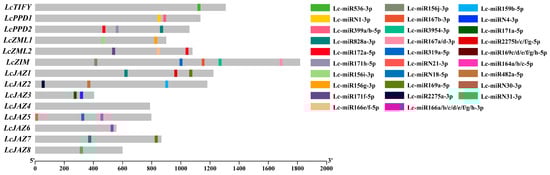
Figure 3.
MiRNA target sites were located within the coding sequences (CDS) of litchi TIFY genes.
3.5. Cis-Acting Element Analysis of LcTIFY Genes
Promoter cis-acting elements are key regulators of gene transcription. To explore the transcriptional regulation of LcTIFY genes, we analyzed 2000 bp upstream promoter sequences. Excluding core (e.g., TATA-box) and uncharacterized motifs, 381 putative cis-elements were identified and functionally classified in the LcTIFY gene promoters (Figure 4A,B). Light-responsive elements constituted the largest group (191 elements, 50.13%), featuring motifs such as Box 4, GA-motif, and MRE. Hormone-responsive elements (115, 30.18%) included ABRE, TGA-element, and MeJA/SA-responsive motifs. Abiotic stress-responsive elements (59, 15.49%) encompassed ARE, MBS, and GC-motif. Elements linked to growth and development were the least abundant (16, 4.20%), including CAT-box and HD-Zip 1 (Figure 4C).
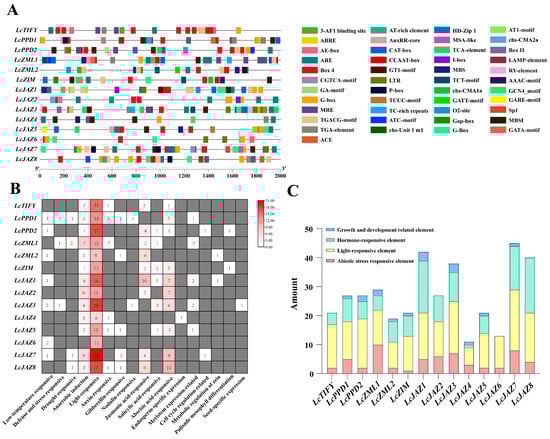
Figure 4.
Regulatory element profiling in the promoters of LcTIFY genes: (A) the Cis-acting elements distribution pattern; (B) quantity heatmap by elements function; (C) quantitative statistics of elements on LcTIFY genes.
3.6. The 3D Protein Structure Analysis
Analysis of secondary structure revealed that α-helices, extended strands, and random coils constitute the main structural components of all LcTIFY proteins (Supplementary Table S2). Random coils constituted the largest proportion (73.88–88.94%), followed by α-helices (6.39–25.99%) and extended strands (1.8–6.72%). Analysis of the predicted three-dimensional (3D) structures revealed distinct patterns among the LcTIFY proteins (Figure 5). High structural similarity was observed within the ZML subfamily (LcZML1 and LcZIM2) and within specific pairs of the JAZ subfamily (LcJAZ3/LcJAZ4 and LcJAZ7/LcJAZ8), whereas the TIFY subfamily member (LcTIFY), the PDD subfamily members (LcPDD1 and LcPDD2), and other JAZ subfamily members (LcJAZ1, LcJAZ2, LcJAZ5, and LcJAZ6) exhibited divergent 3D conformations. These structural similarities are indicative of potential functional redundancy among the highly similar protein pairs.
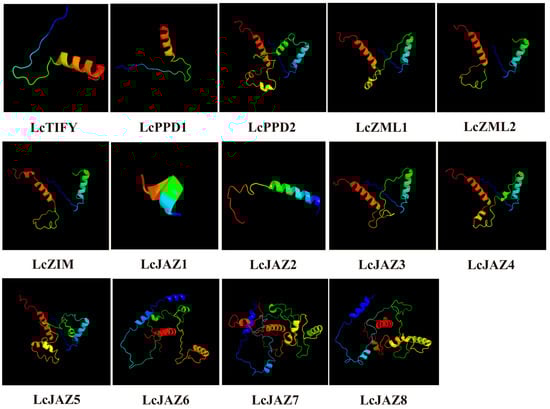
Figure 5.
3D structure of the LcTIFY proteins.
3.7. Genomic Distribution, Duplication, Synteny, and Evolutionary of LcTIFY Genes
The 14 LcTIFY genes were unevenly distributed across 8 chromosomes (Figure 6A): Chr1 contained 4 genes; Chr4, Chr5, and Chr14 each contained 2 genes; and Chr3, Chr8, Chr9, and Chr10 each contained 1 gene. Duplication analysis identified one segmentally duplicated pair (LcPPD1/LcPPD2) but no tandem duplications (Figure 6A). The Ka/Ks ratio for this pair was 0.2673066858 (<1), indicating strong purifying selection (Supplementary Table S3). Comparative synteny analysis revealed differential conservation: 12 collinear pairs with Arabidopsis thaliana, 5 with Oryza sativa, and 27 with Malus pumila, the closest evolutionary relationship between litchi and apple (Figure 6B and Supplementary Table S4).
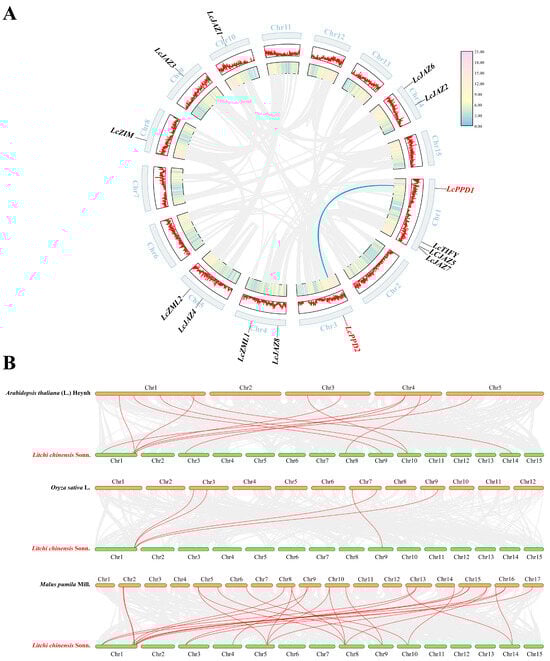
Figure 6.
Physical mapping and syntenic analysis of LcTIFY genes: (A) chromosomal localization and intra-species collinearity analysis; (B) comparative synteny analysis.
3.8. Tissue-Specific Expression Analysis of LcTIFY Genes
To investigate the potential functions of LcTIFY genes, their expression profiles were analyzed across various tissues of the ‘Feizixiao’ variety based on publicly available RNA-seq data. Distinct tissue-specific expression patterns were observed across different tissues (Figure 7 and Supplementary Table S5). LcTIFY was predominantly expressed in the aril and seed. LcPPD1 showed significant expression in the female flower, while LcZML1 was relatively highly expressed in the aril. LcZML2, LcZIM, LcJAZ1, and LcJAZ7 were mainly expressed in the leaf. High expression of LcJAZ2, LcJAZ3, and LcJAZ4 was preferred in the male flower. LcJAZ5 and LcJAZ8 displayed relatively abundant expression in the pericarp, and LcJAZ6 was highly expressed in both the female flower and fruitlet.
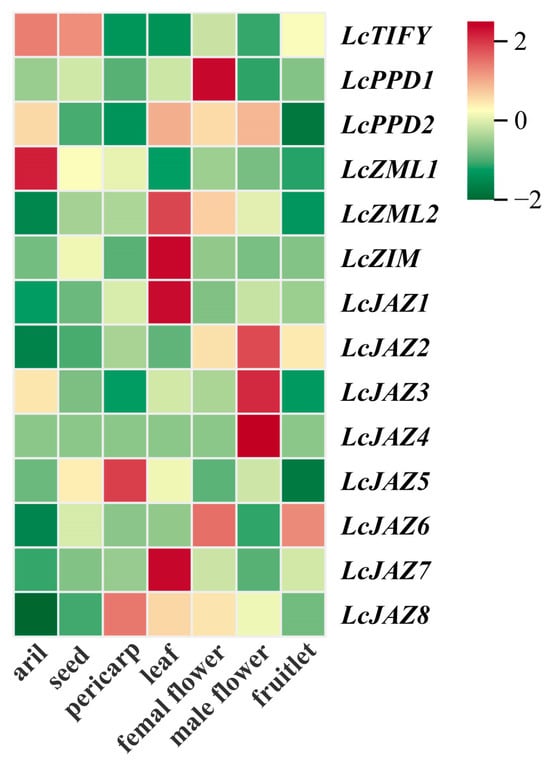
Figure 7.
Tissue-specific expression patterns of LcTIFY genes.
3.9. Temporal Expression Profiles of LcTIFY Genes Throughout Pericarp Coloration
To elucidate the functional significance of LcTIFY genes in litchi fruit coloration, we modulated pericarp pigmentation in ‘Feizixiao’ variety by applying exogenous regulators (abscisic acid (ABA) or forchlorfenuronand (CPPU)) analyzed corresponding gene expression (Figure 8). Compared with the control, ABA treatment significantly promoted pericarp coloration and increased anthocyanin content, particularly at 56 and 63 days after flowering (DAF), reaching 2.30- and 2.06-fold of the control levels, respectively. In contrast, CPPU treatment inhibited these processes, with anthocyanin content in the control being 7.41- and 6.39-fold higher than in CPPU-treated fruit at 71 and 75 DAF, respectively (Figure 8A,B). Neither treatment substantially affected soluble solid content (SSC) or titratable acidity (TA) (Figure 8C,D). Notably, SSC peaked at 71 DAF, coinciding with the optimal commercial harvesting stage (Figure 8A–C). Transcriptome analysis revealed complex expression dynamics for LcTIFY genes during this process (Figure 8E and Supplementary Table S6). For instance, in contrast to the control, the expression of the TIFY subfamily gene (LcTIFY) exhibited a progressive downregulation in response to both exogenous ABA and CPPU treatments. In contrast, subfamilies containing multiple members, namely, PPD, ZIM, and especially the largest JAZ subfamily, displayed marked intra-subfamily expression heterogeneity under ABA and CPPU treatments. LcJAZ1 and LcJAZ2 were both downregulated overall, with LcJAZ1 reaching its minimum expression level at 71 DAF under ABA treatment. LcJAZ3 exhibited a gradually increasing trend. LcJAZ4 was expressed at very low levels, approaching the detection limit. LcJAZ5 expression gradually declined in the control group, whereas under both ABA and CPPU treatments, it initially decreased and subsequently increased, with a more pronounced recovery in the CPPU-treated group. LcJAZ6, LcJAZ7, and LcJAZ8 followed an initial increase followed by a decrease in the control group, but under ABA and CPPU treatments, they showed an initial decrease followed by an increase. Within these patterns, LcJAZ6 displayed a more marked increase at 71 DAF under ABA treatment, LcJAZ7 showed the most pronounced decrease at 63 DAF under CPPU treatment, and LcJAZ8 exhibited the most substantial increase at 71 DAF under CPPU treatment.
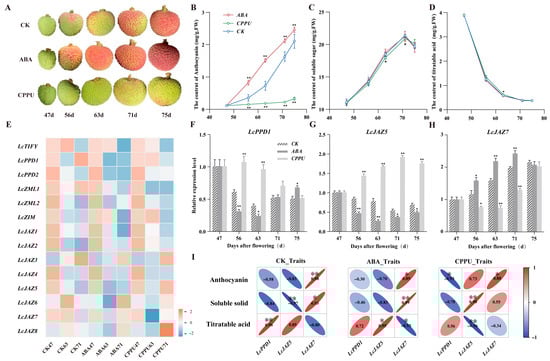
Figure 8.
Expression patterns of LcTIFY genes during fruit pericarp coloration of ‘Feizixiao’ variety. (A) treatment effects of pericarp of ‘Feizixiao’ litchi; (B) changes of anthocyanin content; (C) changes of SSC content; (D) changes of TAA content; (E) expression patterns of the LcTIFY genes by transcriptome datas; (F–H) relative expression of LcPPD1, LcJAZ5, and LcJAZ7 detected by qRT-PCR, separately; (I) correlation analysis between gene expression levels and physiological indices under different treatments. CK: Control; ABA: Treated by exogenous abscisic acid (ABA); CPPU: Treated by Forchlorpenuron (CPPU). The labels 47 d, 56 d, 63 d, 71 d, and 75 d represent pericarp samples collected at 47, 56, 63, 71, and 75 days after flowering (DAF), respectively. *: indicates significant difference at p < 0.05; **: indicates highly significant difference at p < 0.01.
With the aim of clarifying the involvement of LcTIFY genes in litchi fruit pigmentation, quantitative real-time PCR (qRT-PCR) analysis was employed to three representative members (LcPPD1, LcJAZ5, and LcJAZ7) and assessed their expression correlations with the accumulation dynamics of anthocyanin, SSC, and TA during pericarp pigmentation in the ‘Feizixiao’ cultivar. The correlation analysis uncovered treatment-specific expression patterns for each of the three LcTIFY genes in relation to the evaluated fruit quality parameters (Figure 8F–I). LcPPD1 consistently displayed negative correlations with anthocyanin and SSC across all treatments, while showing positive correlations with TA. Notably, a highly significant positive correlation with TA was observed in the control group (R = 0.96), and a highly significant negative correlation with anthocyanin was detected in the CPPU-treated group (R = −0.93). LcJAZ5 exhibited pronounced treatment-dependent correlation patterns. In the control and ABA treatment groups, its expression was negatively associated with anthocyanin and SSC but positively associated with TA. Conversely, the opposite relationships were observed in the CPPU treatment group. Specifically, highly significant correlations were identified for SSC in the control group (R = −0.97) and for TA in the ABA group (R = 0.95), and in the CPPU group, there was a positive correlation with SSC (R = 0.98) accompanied by a negative correlation with TA (R = −0.96). LcJAZ7 demonstrated a pattern opposite to that of LcPPD1. Its expression was highly significantly positively correlated with anthocyanin and SSC in both the control (R = 0.98 and 0.93, respectively) and ABA treatment groups (R = 0.89 and 0.99, respectively), while exhibiting a highly significant negative correlation with TA in the ABA group (R = −0.93). In the CPPU treatment group, LcJAZ7 expression remained highly significantly positively correlated with anthocyanin content (R = 0.88). Collectively, these results suggest that LcPPD1, LcJAZ5, and LcJAZ7 may function as important regulators of pericarp coloration in the ‘Feizixiao’ litchi variety, meriting further functional characterization.
4. Discussion
In contrast to the well-characterized MYB, bZIP, and bHLH families, the TIFY family represents a relatively small, novel, and plant-specific group of transcription factors. Nonetheless, accumulating evidence confirms its crucial roles in plant growth and development [1,2]. A total of 14 LcTIFY genes were identified in this study based on the chromosome-level litchi genome assembly [20], as number comparable to those reported in longan (16) [15], apple (16) [27], peach (16) [16], and grape (19) [28]. Prediction analysis revealed that all LcTIFY proteins reside in the nucleus, in agreement with the typical nuclear localization of transcription factors (Table 1). Phylogenetic analysis revealed that the litchi TIFY proteins comprises four subfamilies: TIFY, ZML, PPD, and JAZ (Figure 1). The JAZ subfamily was the largest and could be further subdivided into five subgroups (JAZ I–V), a classification consistent with reports in other plants [29,30]. Members within the same subfamily exhibited highly similar conserved domain and motif architectures (Figure 2A,B), implying a similar function. MiRNA was considered as a post transcriptional regulator according to target the CDS sequence of genes in plant [31]. While such regulation of TIFY genes is poorly characterized. In our result, we identified 33 potential miRNA target sites across 13 (92.86%) LcTIFY genes (Figure 3 and Supplementary Table S1), suggesting that miRNA-mediated post-transcriptional regulation plays a critical role in modulating LcTIFY genes function. While no miRNA target site was predicted for the LcJAZ4 gene, possibly due to sequence divergence during evolution, this remains a hypothesis that necessitates further experimental investigation.
Cis-regulatory elements located in promoter regions are essential for modulating gene expression in response to developmental signals and environmental cues. Our analysis suggests that LcTIFY genes are potentially regulated by light, hormones (e.g., IAA, ABA, MeJA), abiotic stress, and growth-related signals (Figure 4). Gene duplication serves as a primary mechanism underlying the proliferation of gene families [32]. In litchi, the absence of LcTIFY genes in the JAZ I subgroup (Figure 1) and the lack of tandem duplications (Figure 6A) indicate a distinct evolutionary trajectory. Only one segmentally duplicated pair (LcPPD1/LcPPD2) was identified, with a Ka/Ks ratio < 1 (Figure 6A and Supplementary Table S3), implying that segmental duplication, followed by strong purifying selection, was the primary mechanism for LcTIFY genes expansion. Further comparative synteny exhibited 5 collinear gene pairs with monocot plant (rice), 12 and 27 collinear gene pairs with dicot plants (Arabidopsis and apple), respectively. These findings suggest a significant extent of evolutionary conservation between litchi and dicot species, reflecting divergent evolutionary paths following the monocot-dicot divergence.
TIFY proteins regulate development in various plant organs, including leaves, flowers, roots, and fruits [4,5,7,10,19]. Consistent with their putative roles, our expression analysis revealed distinct tissue preferences for LcTIFY genes in litchi (Figure 7 and Supplementary Table S5). For instance, LcPPD1 and LcJAZ6 were predominantly expressed in female flowers; LcZML2, LcZIM, LcJAZ1, and LcJAZ7 in leaves; LcJAZ2, LcJAZ3, and LcJAZ4 in male flowers; and LcJAZ5 and LcJAZ8 in pericarp, suggesting functional specializations during the development of these tissues. Pericarp coloration, a key determinant of fruit quality and marketability, is often incomplete in major cultivars like ‘Feizixiao.’ It is well known that anthocyanins, carotenoids, and chlorophyll are key pigments responsible for plant coloration. Among these, anthocyanins are a major contributor to the reddening of the litchi pericarp during late ripening. However, in some cultivars like ‘Feizixiao,’ anthocyanin accumulation in the pericarp is insufficient even when aril sugar content peaks, leading to suboptimal coloration that can detract from commercial value. Recent studies implicate TIFY genes could function in the pathway of anthocyanin biosynthesis. Notably, some act as negative regulators (e.g., DlTIFY7 in longan [15]; *PpJAZ3/8/11* in pear [17]; MdJAZ2 in apple [18]), while others act as positive regulators (e.g., several PpJAZ, PpPPD1, and PpZML genes in pear [17]; a TIFY (Cluster-78338) protein in L. ruthenicum [19]). Intriguingly, during the chemically modulated pericarp coloration of ‘Feizixiao’ variety (ABA-promoted, CPPU-inhibited), we found that LcPPD1 and LcJAZ5 expression was negatively correlated with anthocyanin accumulation in the ‘Feizixiao’ variety under control and ABA treatments, while LcJAZ5 exhibited a positive correlation under CPPU treatment. In contrast, LcJAZ7 expression showed a positive correlation across all treatments (Figure 8 and Supplementary Table S6). This positions LcPPD1 and LcJAZ5 as potential negative regulators and LcJAZ7 as a potential positive regulator of anthocyanin accumulation in litchi, a hypothesis that warrants further functional validation. These findings have implications for the molecular improvement of litchi pericarp pigmentation.
5. Conclusions
A systematic, genome-wide identification of the TIFY gene family was performed in chromosome-level litchi genome, resulting in the characterization of 14 LcTIFY proteins. These were classified into the TIFY, ZML, PPD, and JAZ subfamilies, and all members harbored the signature TIFY domain and Motif 1, with predicted nuclear localization. Evolutionary analysis revealed one segmental duplication event with LcTIFY genes. Furthermore, comparative collinear analysis with Arabidopsis, rice, and apple provided insights into the evolutionary trajectory of the LcTIFY family in angiosperms. Importantly, expression patterns showed tissue-preferential expression of LcTIFY family genes; specifically, LcPPD1 and LcJAZ5 expression was negatively correlated with anthocyanin accumulation in the ‘Feizixiao’ cultivar, with the exception of LcJAZ5 showing a positive correlation under CPPU treatment. Conversely, LcJAZ7 expression was consistently positively correlated across all treatments, implicating their roles in fruit development. These three genes deserve particular attention and should be considered high-priority candidates for subsequent functional characterization experiments. Collectively, this work paves the way for in-depth functional studies of the TIFY genes in litchi and offers a valuable genetic platform for future research into the mechanisms controlling pericarp pigmentation.
Supplementary Materials
The following supporting information can be downloaded at https://www.mdpi.com/article/10.3390/biology15050445/s1: Table S1: miRNA site prediction of LcTIFY genes; Table S2: Two-dimensional structures of LcTIFY proteins in litchi; Table S3: Segmentally duplicated and the ka,ks value in LcTIFY gene pairs; Table S4: Orthologous TIFY gene pairs among Arabidopsis, Oryza, malus and litchi; Table S5: The TPM value of LcTIFY genes in different tissues of ‘Feizixiao’ variety; Table S6: The TPM value of LcTIFY genes during fruit peel coloring process of ‘Feizixiao’ variety; Table S7: Primers used for qRT-PCR analysis in this study.
Author Contributions
Conceptualization, W.M. and Y.T.; experiments and data analysis, Y.T., X.M. and P.C.; materials, D.Y. and T.L.; writing—original draft preparation, Y.T. and X.M.; writing—review and editing, W.M. All authors have read and agreed to the published version of the manuscript.
Funding
This research was supported by the National Natural Science Foundation of China (32260750), the Natural Science Foundation of Hainan Province (325RC665), and the 2025 Science and Technology Project “Hainan Qiongshan Litchi Science and Technology Backyards” (HKKJ2025KJXY02).
Institutional Review Board Statement
Not applicable.
Informed Consent Statement
Not applicable.
Data Availability Statement
All data supporting the findings of this study are available within the article and its Supplementary Materials. Further inquiries should be addressed to the corresponding author.
Acknowledgments
We gratefully acknowledge Hainan Qiongshan Litchi Academy, Hainan NongkenHongming Agricultural Technology Development Co., Ltd., and Hainan State Farms Investment Holding Group Co., Ltd., Haikou, Hainan 570105, China, for their free field test sites and litchi fruit materials.
Conflicts of Interest
The authors declare that they have no conflicts of interest. The funders have no role in the design of the study and collection, analysis, and interpretation of data, and in writing the manuscript.
References
- Nishii, A.; Takemura, M.; Fujita, H.; Shikata, M.; Yokota, A.; Kohchi, T. Characterization of a novel gene encoding a putativesingle zinc-finger protein, ZIM, expressed during the reproductive phase in Arabidopsis thaliana. Biosci. Biotechnol. Biochem. 2000, 64, 1402–1409. [Google Scholar] [CrossRef] [PubMed]
- Vanholme, B.; Grunewald, W.; Bateman, A.; Kohchi, T.; Gheysen, G. The tify family previously known as ZIM. Trends Plant Sci. 2007, 12, 239–244. [Google Scholar] [CrossRef] [PubMed]
- Bai, Y.; Meng, Y.; Huang, D.; Qi, Y.; Chen, M. Origin and evolutionary analysis of the plant-specific TIFY transcription factor family. Genomics 2011, 98, 128–136. [Google Scholar] [CrossRef] [PubMed]
- Pérez, A.C.; Durand, A.N.; Bossche, R.V.; De Clercq, R.; Persiau, G.; Van Wees, S.C.M.; Pieterse, C.M.J.; Gevaert, K.; De Jaeger, G.; Goossens, A.; et al. The non-JAZ TIFY protein TIFY8 from Arabidopsis thaliana is a transcriptional repressor. PLoS ONE 2014, 9, e84891. [Google Scholar]
- Hakata, M.; Muramatsu, M.; Nakamura, H.; Hara, N.; Kishimoto, M.; Iida-Okada, K.; Kajikawa, M.; Imai-Toki, N.; Toki, S.; Nagamura, Y.; et al. Overexpression of TIFY genes promotes plant growth in rice through jasmonate signaling. Biosci. Biotechnol. Biochem. 2017, 81, 906–913. [Google Scholar] [CrossRef]
- Shaikhali, J.; Lopez, J.D.D.B.; Ötvös, K.; Kremnev, D.; Garcia, A.S.; Srivastava, V.; Wingsle, G.; Bako, L.; Strand, Å. The CRYPTOCHROME1-Dependent Response to Excess Light Is Mediated through the Transcriptional Activators ZINC FINGER PROTEIN EXPRESSED IN INFLORESCENCE MERISTEM LIKE1 and ZML2 in Arabidopsis. Plant Cell 2012, 24, 3009–3025. [Google Scholar] [CrossRef]
- White, D.W.R. PEAPOD regulates lamina size and curvature in Arabidopsis. Proc. Natl. Acad. Sci. USA 2006, 103, 13238–13243. [Google Scholar] [CrossRef]
- Qi, T.; Song, S.; Ren, Q.; Wu, D.; Huang, H.; Chen, Y.; Fan, M.; Peng, W.; Ren, C.; Xie, D. The Jasmonate-ZIM-domain proteins interact with the WD-Repeat/bHLH/MYB complexes to regulate Jasmonate-mediated anthocyanin accumulation and trichome initiation in Arabidopsis thaliana. Plant Cell 2011, 23, 1795–1814. [Google Scholar] [CrossRef]
- Yu, X.; Chen, G.; Tang, B.; Zhang, J.; Zhou, S.; Hu, Z. The Jasmonate ZIM-domain protein gene SlJAZ2 regulates plant morphology and accelerates flower initiation in Solanum lycopersicum plants. Plant Sci. 2018, 267, 65–73. [Google Scholar] [CrossRef]
- Yang, Y.; Ahammed, G.J.; Wan, C.; Liu, H.; Chen, R.; Zhou, Y. Comprehensive analysis of TIFY transcription factors and their expression profiles under jasmonic acid and abiotic stresses in watermelon. Int. J. Genom. 2019, 2019, 6813086. [Google Scholar] [CrossRef]
- Lv, G.; Han, R.; Shi, J.; Chen, K.; Liu, G.; Yu, Q.; Yang, C.; Jiang, J. Genome-wide identification of the TIFY family reveals JAZ subfamily function in response to hormone treatment in Betula platyphylla. BMC Plant Biol. 2023, 23, 143. [Google Scholar] [CrossRef] [PubMed]
- Li, Y.; Xu, M.; Wang, N.; Li, Y. A JAZ Protein in Astragalus sinicus interacts with a leghemoglobin through the TIFY domain and is involved in nodule development and nitrogen fixation. PLoS ONE 2015, 10, e0139964. [Google Scholar]
- Pei, T.; Ma, P.; Ding, K.; Liu, S.; Jia, Y.; Ru, M.; Dong, J.; Liang, Z. SmJAZ8 acts as a core repressor regulating JA-induced biosynthesis of salvianolic acids and tanshinones in Salvia miltiorrhiza hairy roots. J. Exp. Bot. 2017, 69, 1663–1678. [Google Scholar]
- Tao, J.; Jia, H.; Wu, M.; Zhong, W.; Jia, D.; Wang, Z.; Huang, C. Genome-wide identification and characterization of the TIFY gene family in kiwifruit. BMC Genom. 2022, 23, 179. [Google Scholar] [CrossRef] [PubMed]
- Qing, H.; Wu, Z.; Mo, X.; Wei, J.; Shi, Y.; Guo, H.; Xu, J.; Ding, F.; Zhang, S. Genome-Wide Identification of the TIFY Family in Longan and Their Potential Functional Analysis in Anthocyanin Synthesis. Biology 2025, 14, 364. [Google Scholar] [CrossRef] [PubMed]
- Sheng, Y.; Yu, H.; Pan, H.F.; Qiu, K.L.; Xie, Q.M.; Chen, H.L.; Fu, S.L.; Zhang, J.Y.; Zhou, H. Genome-wide analysis of the gene structure, expression and protein interactions of the peach (Prunus persica) TIFY gene family. Front. Plant Sci. 2022, 13, 792802. [Google Scholar] [CrossRef]
- Ma, Y.; Shu, S.; Bai, S.; Tao, R.; Qian, M. Genome-wide survey and analysis of the TIFY gene family and its potential role in anthocyanin synthesis in Chinese sand pear (Pyrus pyrifolia). Tree Genet. Genomes 2018, 14, 25. [Google Scholar] [CrossRef]
- Chen, K.Q.; Zhao, X.Y.; An, X.H.; Tian, Y.; Liu, D.D.; You, C.X.; Hao, Y.J. MdHIR proteins repress anthocyanin accumulation by interacting with the MdJAZ2 protein to inhibit its degradation in apples. Sci. Rep. 2017, 7, 44484. [Google Scholar] [CrossRef]
- Guo, J.; Wang, J.; Peng, C.; Liu, H.; Shang, J. Integrated Metabolomic and Transcriptomic Analyses of Anthocyanin Synthesis During Fruit Development in Lycium ruthenicum Murr. Biology 2025, 18, 1614. [Google Scholar] [CrossRef] [PubMed]
- Hu, G.; Feng, J.; Xiang, X.; Wang, J.; Salojärvi, J.; Liu, C.; Wu, Z.; Zhang, J.; Liang, X.; Jiang, Z.; et al. Two divergent haplotypes from a highly heterozygous lychee genome suggest independent domestication events for early and late-maturing cultivars. Nat. Genet. 2022, 54, 73–83. [Google Scholar] [CrossRef] [PubMed]
- Chen, C.; Wu, Y.; Li, J.; Wang, X.; Zeng, Z.; Xu, J.; Liu, Y.; Feng, J.; Chen, H.; He, Y.; et al. TBtools-II: A “one for all, all for one” bioinformatics platform for biological big-data mining. Mol. Plant 2023, 16, 1733–1742. [Google Scholar] [CrossRef]
- Wang, Y.; Tang, H.; Debarry, J.D.; Tan, X.; Li, J.; Wang, X.; Lee, T.H.; Jin, H.; Marler, B.; Guo, H.; et al. MCScanX: A toolkit for detection and evolutionary analysis of gene synteny and collinearity. Nucleic Acids Res. 2012, 40, e49. [Google Scholar] [CrossRef] [PubMed]
- Park, N.I.; Li, X.; Suzuki, T.; Kim, S.J.; Woo, S.H.; Park, C.H.; Park, S.U. Differential expression of anthocyanin biosynthetic genes and anthocyanin accu-mulation in tartary buckwheat cultivars ‘Hokkai T8’ and ‘Hokkai T10’. J. Agric. Food Chem. 2011, 59, 2356–2361. [Google Scholar] [CrossRef]
- Patro, R.; Duggal, G.; Love, M.I.; Irizarry, R.A.; Kingsford, C. Salmon provides fast and bias-aware quantification of transcript expression. Nat. Methods 2017, 14, 417–419. [Google Scholar] [CrossRef]
- Zhong, H.-Y.; Chen, J.-W.; Li, C.-Q.; Chen, L.; Wu, J.-Y.; Chen, J.-Y.; Lu, W.-J.; Li, J.-G. Selection of reliable reference genes for expression studies by reverse transcription quantitative real-time PCR in litchi under diferent experimental conditions. Plant Cell Rep. 2011, 30, 641–653. [Google Scholar] [CrossRef]
- Livak, K.J.; Schmittgen, T.D. Analysis of relative gene expression data using real-time quantitative PCR and the 2 (-Delta Delta C (T)) Method. Methods 2001, 25, 402–408. [Google Scholar] [CrossRef]
- Mei, C.; Zhang, X.Y.; Yan, P.; Aisajan, M.; Feng, B.B.; Ma, K.; Han, L.Q.; Dong, L.X.; Wang, J.X. Identification of TIFY family in apple and their expression analysis under insect stress. Acta Hortic. Sin. 2021, 48, 233–242. [Google Scholar]
- Yucheng, Z.; Min, G.; Singer, S.D.; Fei, Z.J.; Wang, H.; Wang, X.P. Genome-Wide Identification and Analysis of the TIFY Gene Family in Grape. PLoS ONE 2012, 7, e44465. [Google Scholar]
- Wang, H.; Zhang, Y.; Zhang, L.; Li, X.; Yao, X.; Hao, D.; Guo, H.; Liu, J.; Li, J. Genome-Wide Identification and Characterization of the TIFY Gene Family and Their Expression Patterns in Response to MeJA and Aluminum Stress in Centipedegrass (Eremochloa ophiuroides). Plants 2024, 13, 462. [Google Scholar] [CrossRef]
- Guan, Y.; Zhang, Q.; Li, M.; Zhai, J.; Wu, S.; Ahmad, S.; Lan, S.; Peng, D.; Liu, Z.-J. Genome-Wide Identification and Expression Pattern Analysis of TIFY Family Genes Reveal Their Potential Roles in Phalaenopsis aphrodite Flower Opening. Int. J. Mol. Sci. 2024, 25, 5422. [Google Scholar] [CrossRef] [PubMed]
- Chen, X. microRNA biogenesis and function in plants. FEBS Lett. 2005, 579, 5923–5931. [Google Scholar] [CrossRef] [PubMed]
- Die, J.V.; Castro, P.; Millán, T.; Gil, J. Segmental and tandem duplications driving the recent NBS-LRR gene expansion in the asparagus genome. Genes 2018, 9, 568. [Google Scholar] [CrossRef] [PubMed]


Disclaimer/Publisher’s Note: The statements, opinions and data contained in all publications are solely those of the individual author(s) and contributor(s) and not of MDPI and/or the editor(s). MDPI and/or the editor(s) disclaim responsibility for any injury to people or property resulting from any ideas, methods, instructions or products referred to in the content. |
© 2026 by the authors. Licensee MDPI, Basel, Switzerland. This article is an open access article distributed under the terms and conditions of the Creative Commons Attribution (CC BY) license.