3.1. Powder Size Distribution
The laser particle size distributions of the B-Mg base powder, titanium powder, boron powder, and the ball-milled composite powder were measured using a Malvern Mastersizer 3000 laser particle size analyzer(Malvern Panalytical Ltd., Malvern, UK). The results are shown in
Figure 2.
As shown in
Figure 2, the particle size of the composite powder after ball milling is significantly reduced compared to that of the B-Mg base powder and titanium powder. Moreover, the particle size of the ternary composite powders gradually decreases with increasing titanium content, indicating that the addition of titanium enhances the shear force transmission between the grinding media and the B-Mg base powder during the ball milling process. This enhanced mechanical interaction promotes the fragmentation of boron particles and facilitates more effective micro-scale compositing between boron and metal. It is worth noting that in
Figure 2c, both the raw boron sample and the BM
7T
1 sample exhibit bimodal particle size distributions. However, the secondary peak is relatively small, and the overall distribution is broader. The peak position of BM
7T
1 shifts further to the left compared to the raw boron sample, and its curve exhibits a steeper decline in the tail, corresponding to smaller D
50 and D
90 values, which confirms the formation of finer composite powder after processing. In contrast, the other samples display more pronounced bimodal distribution characteristics. With increasing titanium content, the height difference between the two peaks gradually increases, suggesting a trend toward greater non-uniformity in particle size distribution. This type of bimodal structure typically includes a primary peak near D
50 and a secondary peak near D
90, indicating the coexistence of fine and coarse particles.
3.3. Microscopic Characterization
For ease of description, the composite powders are denoted using the subscript notation BM
xT
y, where
x and
y represent the weight percentages of magnesium and titanium, respectively. For example, a sample containing 1 wt.% magnesium and 7 wt.% titanium is denoted as BM
1T
7. The morphology and elemental distribution of the prepared composites were examined using a Hitachi SU5000 Field Emission Scanning Electron Microscope (FESEM) (Hitachi High-Technologies Corporation, Tokyo, Japan). Compositional analysis was conducted using XFlash 6130 Energy Dispersive Spectroscopy (EDS) (Bruker AXS GmbH, Karlsruhe, Germany) in conjunction with surface mapping to evaluate the homogeneity of metal distribution on the boron base. Representative micrographs of the starting boron powder and a composite sample are shown in
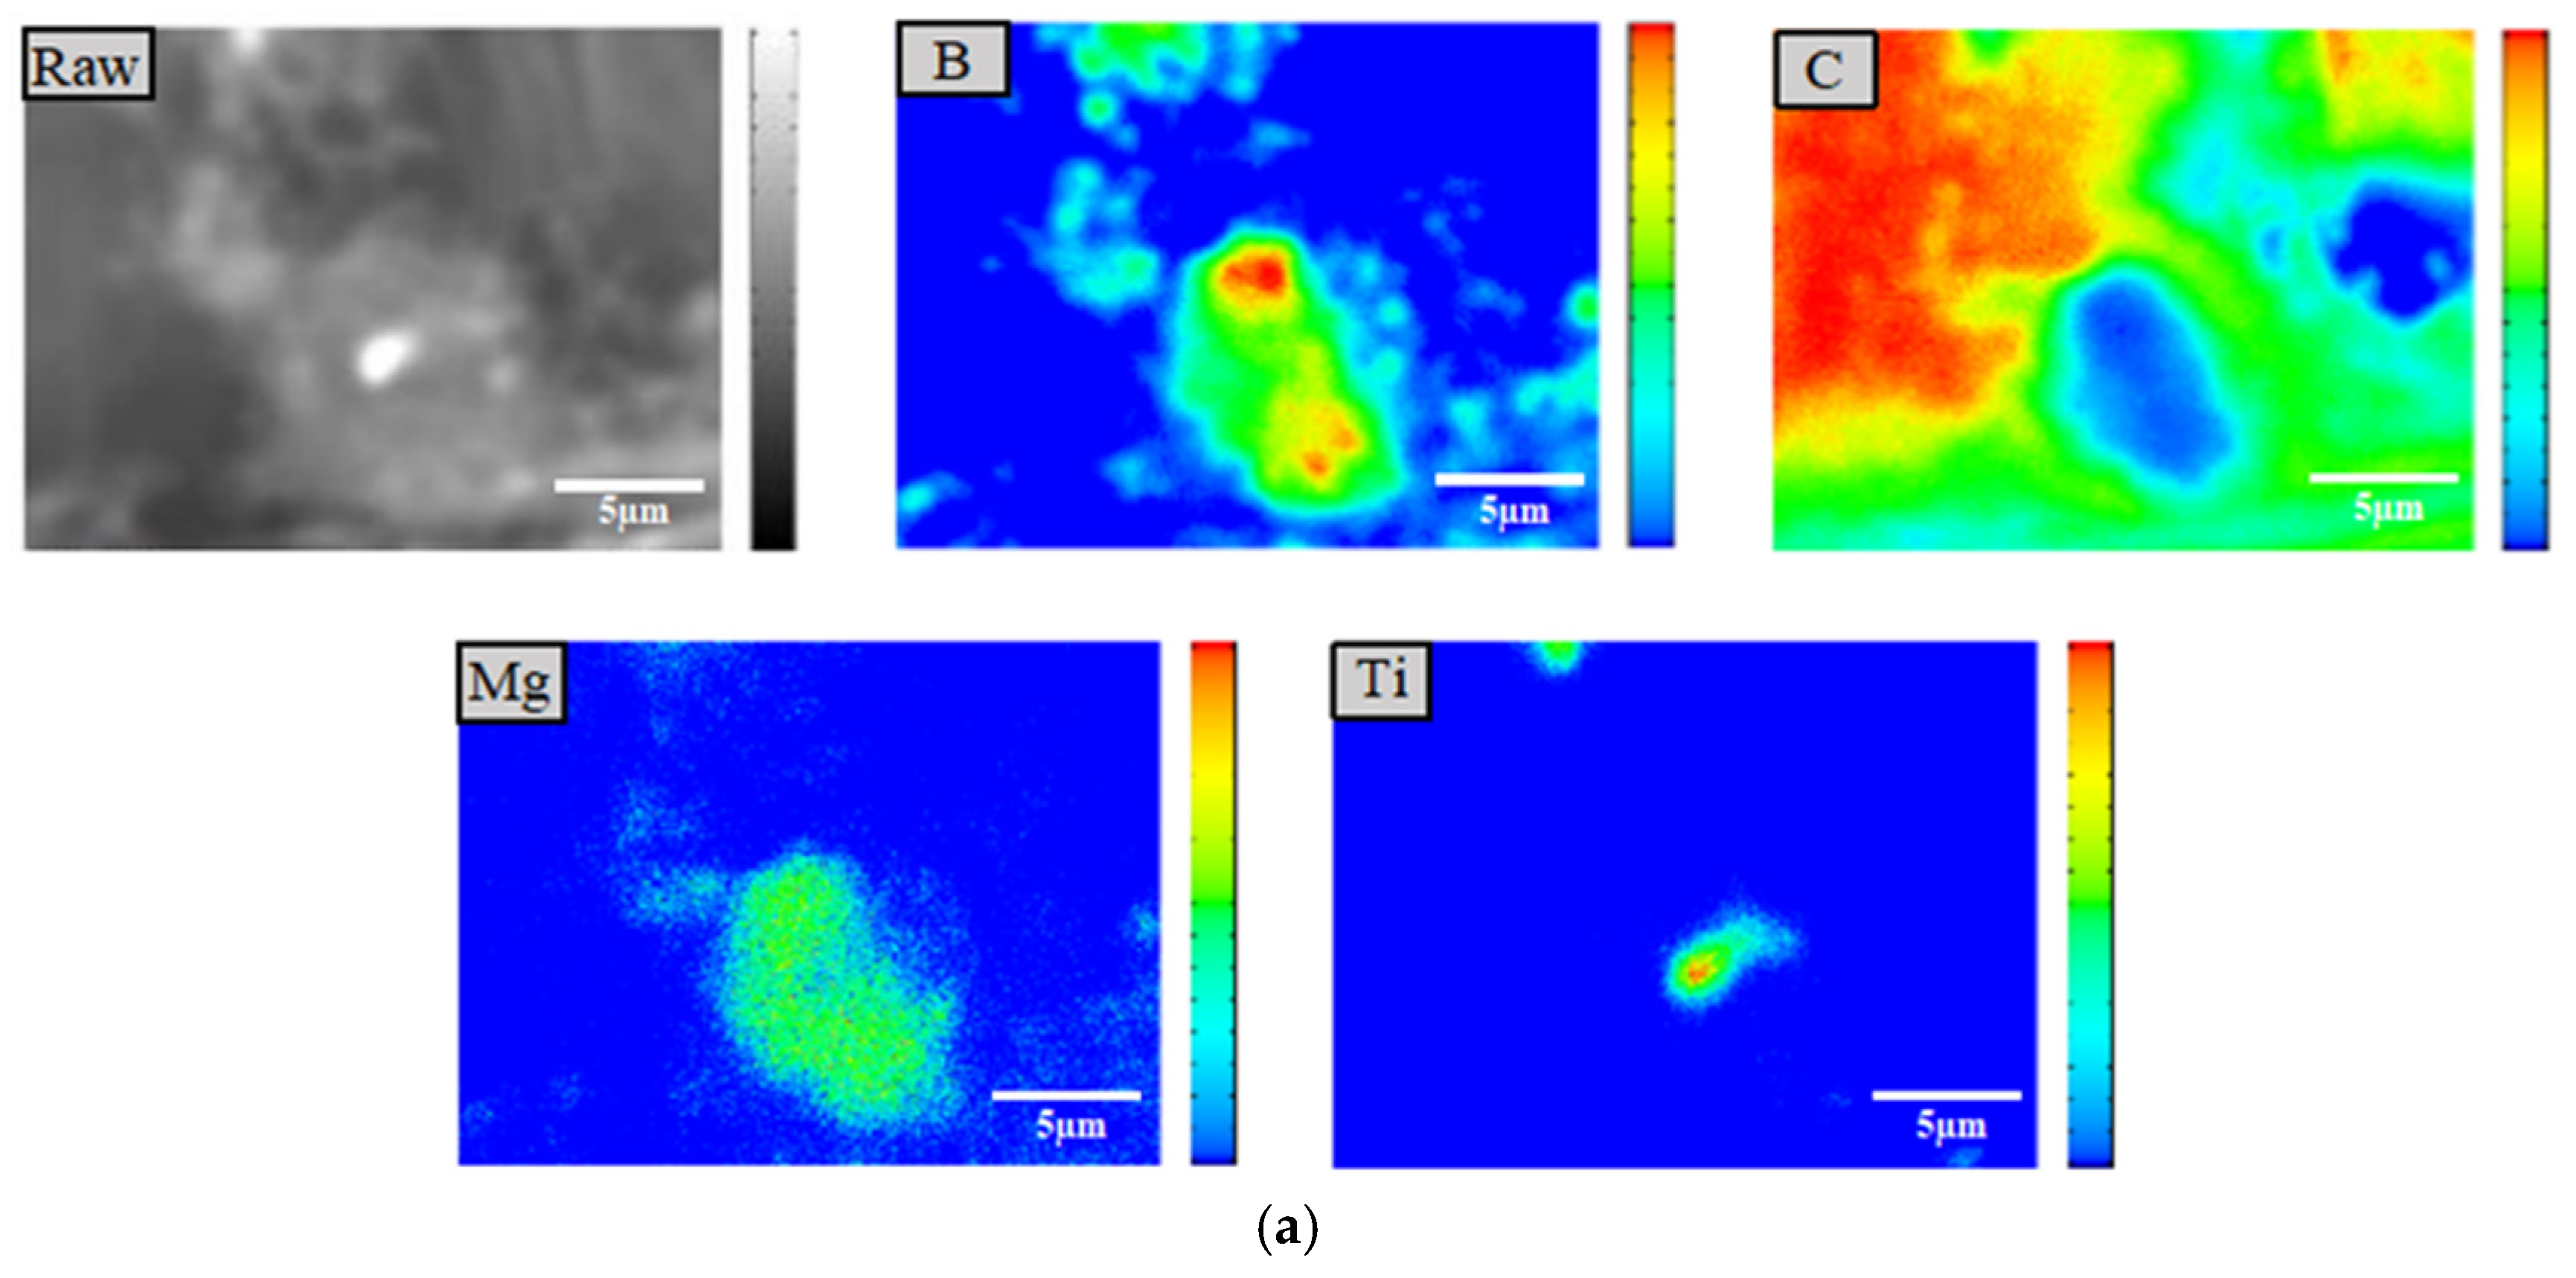
Figure 4a, taken using secondary electrons, which reveals the general morphology of the particles, while
Figure 4b, captured using backscattered electrons, highlights the heavier metal elements as brighter regions, enabling clear distinction between metal particles and boron aggregates. In
Figure 4c, EDS elemental mapping confirms that both magnesium and titanium are dispersed across the boron particle surfaces. The co-localization of boron with elevated metal concentrations suggests that the metallic constituents are effectively deposited onto the boron aggregates during the preparation process.
In particular, samples BM8, BM1T7, BM5T3, and BM7T1 were further analyzed using INCA Energy Dispersive Spectroscopy (EDS) (Oxford Instruments, Oxford, UK) with ZAF (atomic number-absorption-fluorescence) correction to improve quantitative accuracy. The corresponding X-ray fluorescence spectra were plotted to verify the elemental composition and further confirm the effective integration of magnesium and titanium within the boron-based composite matrix.
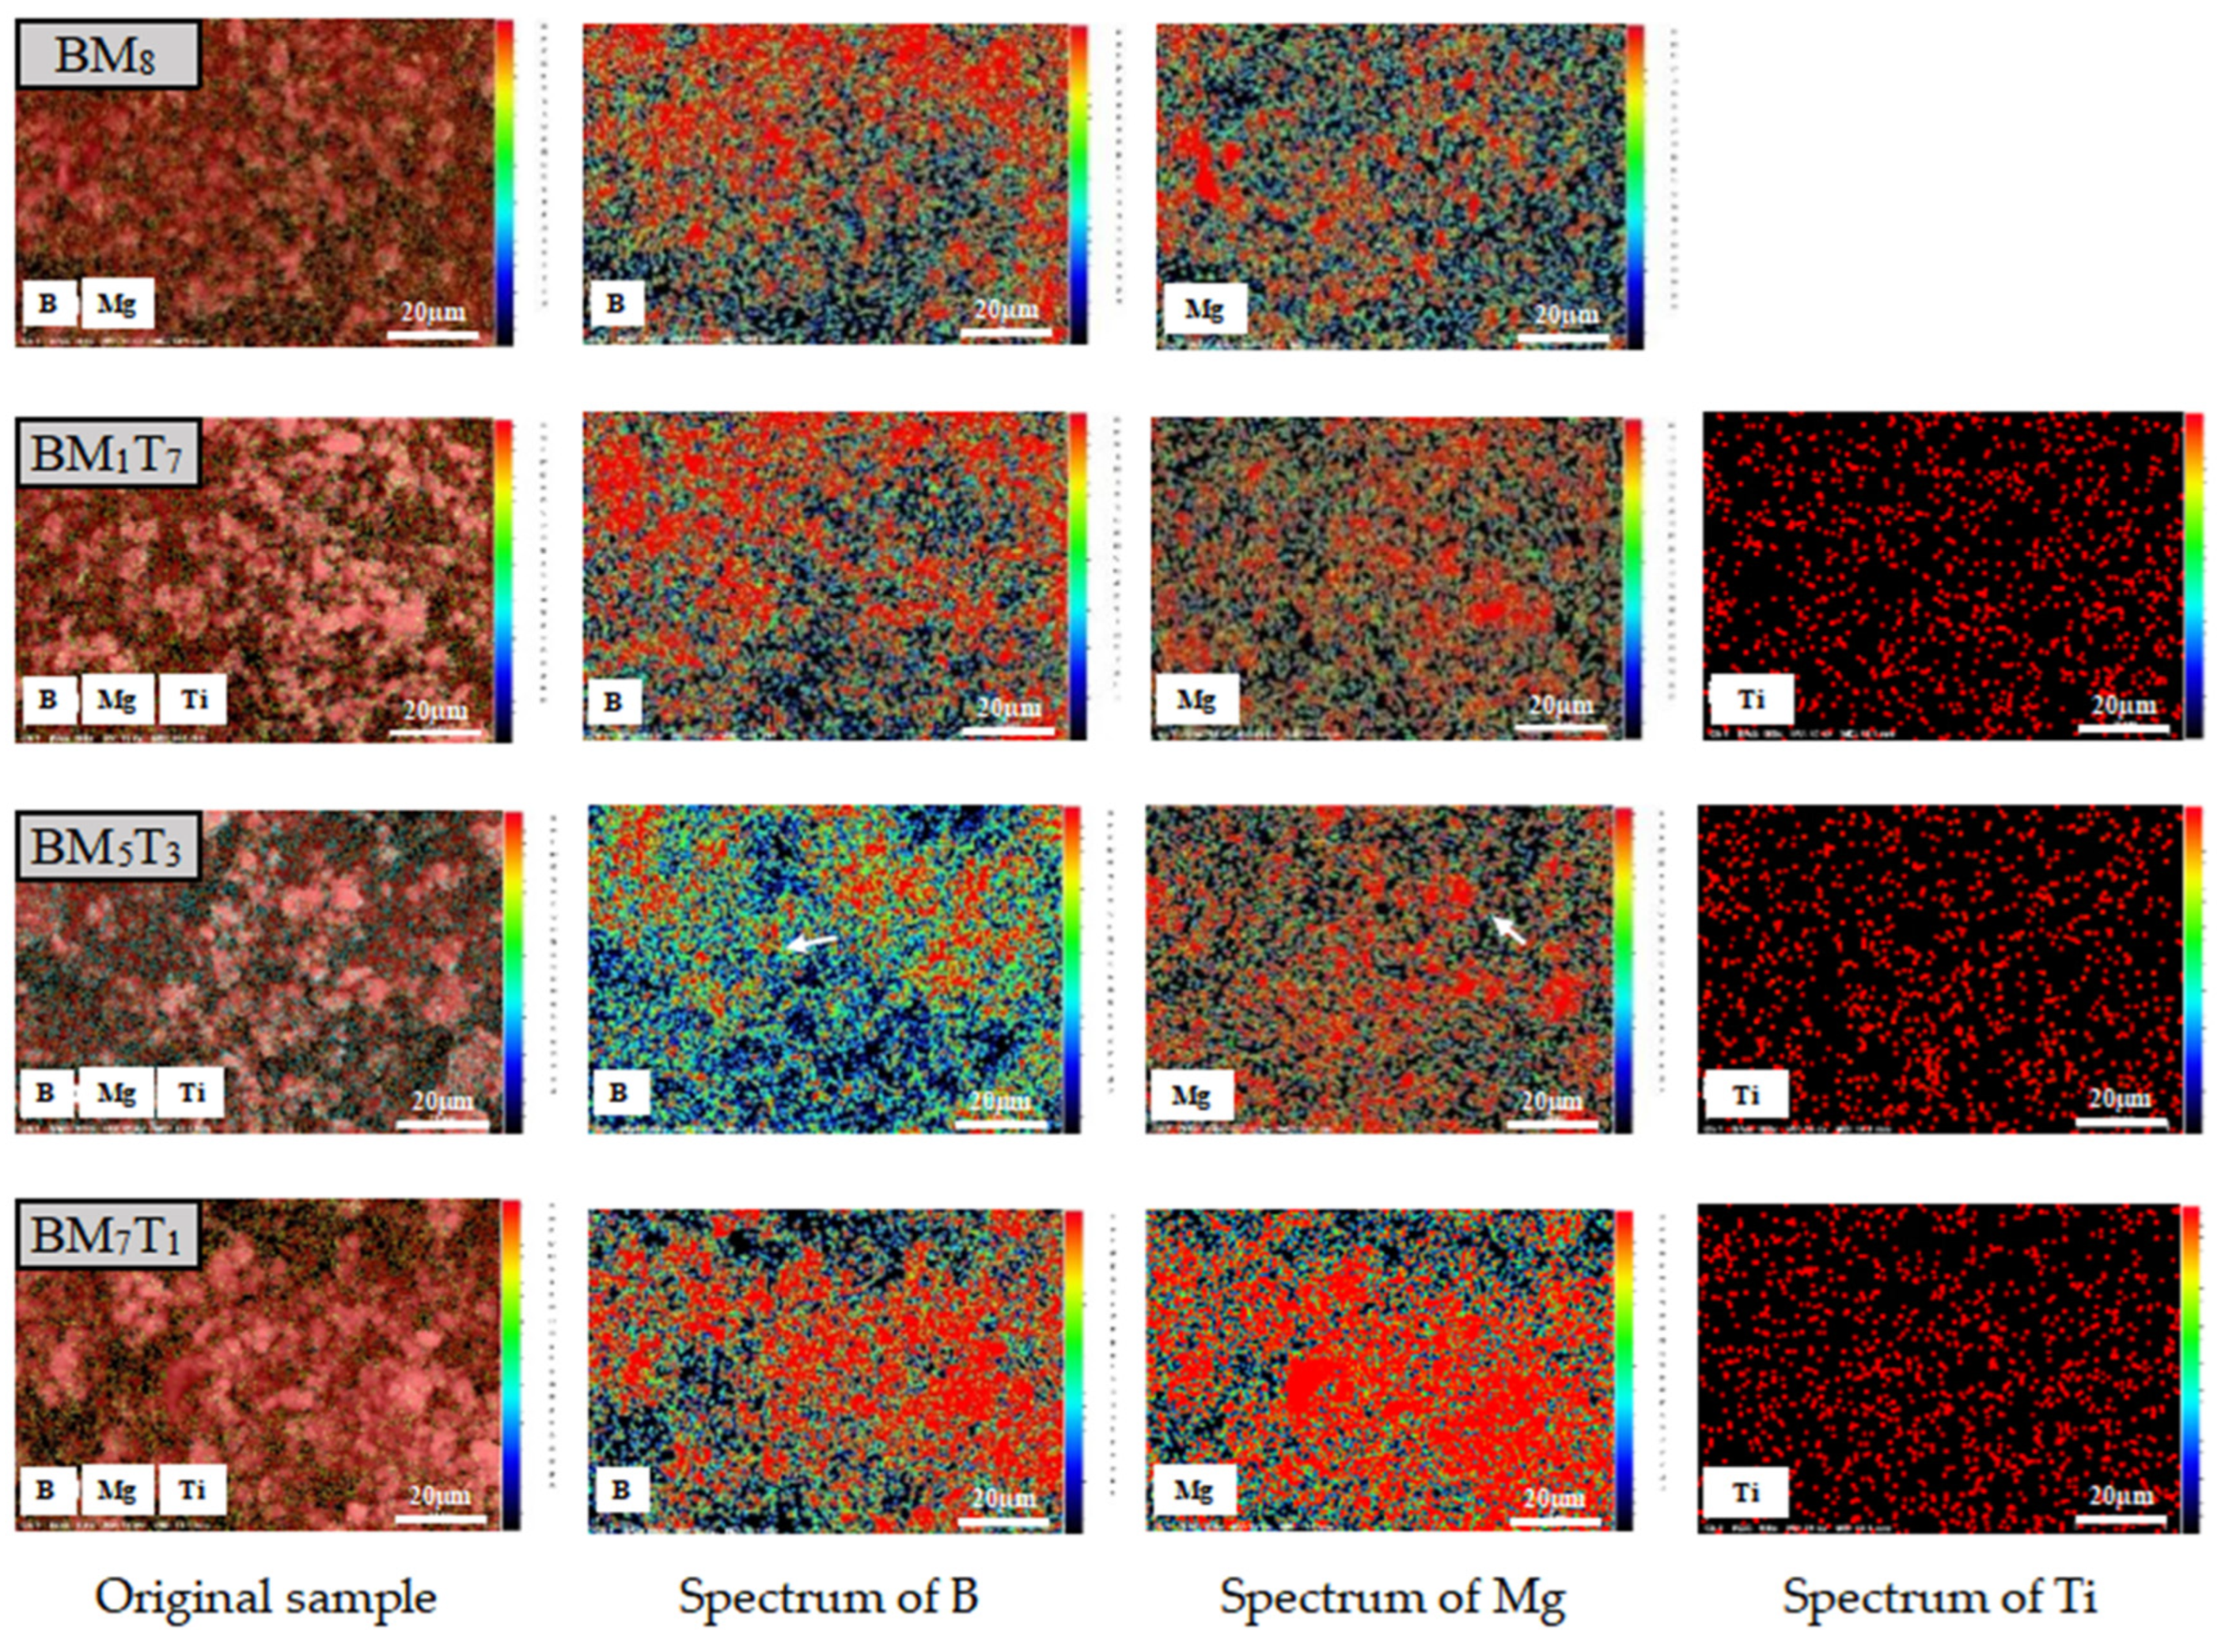
As shown in
Figure 5, taking BM
5T
3 as an example, in the B element map, the color at the edges of some large red agglomerates (indicated by arrows) transitions from red to yellow, green, and blue, indicating a noticeable decrease in radiation intensity at the boundaries. The Mg element map shows a similar pattern, where the edges of certain bright red regions are surrounded by green/blue areas (indicated by arrows), suggesting a lower Mg density at the periphery. This implies that the B-Mg matrix has achieved a high degree of integration after electrical explosion and subsequent ball milling. The apparent diffusion of Mg into the boron agglomerates further supports the good composite formation. In contrast, titanium exhibits a strong spectral absorption effect, with only a slight decrease in intensity at the edges, indicating that despite its uniform surface distribution, Ti forms relatively few micro-regions of composite with B and Mg. Notably, the edge attenuation observed in the B-Mg maps becomes more pronounced with increasing Mg content, which is most evident in the BM
5T
3 sample. This may be attributed to a more complete coating of boron by magnesium following the electrical explosion process. During ball milling, titanium likely facilitates this process by transmitting mechanical forces and enhancing the shearing action, thereby promoting the dispersion of magnesium within the boron matrix. To verify this hypothesis, the BM
5T
3 sample was subjected to carbon embedding (due to its magnetic nature) for further EDS analysis and JEM2100 high-resolution transmission electron microscopy (HRTEM) (JEOL Ltd., Tokyo, Japan) observation. As shown in
Figure 6, composite powder particles containing relatively large titanium inclusions were selected to highlight the differences in microstructure.
Elemental mapping of carbon and boron obtained from EPMA 1720H Electron Probe Microanalysis (EPMA) (Shimadzu Corporation, Kyoto, Japan) clearly indicates that the low-contrast gray clusters in the image correspond to boron agglomerates. The high-contrast regions represent titanium particles, as confirmed by targeted elemental scans. The results also reveal that titanium is dispersed around some of the larger Ti particles. In the HRTEM images, the contrast among the three elements is more distinct: titanium appears brightest, followed by the B-Mg regions, while boron itself shows relatively low brightness. This contrast is consistent with the EDS results, as shown in
Figure 6. Moreover, the HRTEM images reveal that smaller titanium particles are embedded within the boron agglomerates, whereas magnesium is completely dispersed throughout the boron matrix, exhibiting a flocculent morphology. This behavior may be attributed to the lower hardness of magnesium and the higher hardness of titanium. During the ball milling process, titanium plays a mechanically assisting role, effectively promoting the fragmentation of magnesium and facilitating its dispersion and embedding into the boron matrix, thereby forming a more compact and uniform composite structure.
3.4. Specific Surface Area
The B-Mg-Ti composite powder developed in this study is primarily intended for use as a high-energy fuel. Increasing the specific surface area of the composite powder is beneficial for enhancing the material’s reactivity, which in turn promotes energy release during combustion. Therefore, it is essential to investigate the changes in specific surface area between the composite powder and the untreated boron powder. According to the single-point Brunauer–Emmett–Teller (BET) adsorption theory, the specific surface area of a material can be calculated using the following formula:
where
Vm is the saturated adsorption of nitrogen on the sample surface in mL;
N is Avogadro’s constant (6.024 × 10²³);
σ is the cross-sectional area of nitrogen molecules 0.162 nm2;
W is the sample mass;
The value of
Vm can be obtained using the BET equation.
where
P is the partial pressure of nitrogen and
P0 is the saturation vapor pressure at the adsorption temperature. The relative pressure (
) was selected in the range of 0.05–0.25, as values below 0.05 make it difficult to establish multilayer adsorption equilibrium, while values above 0.25 tend to promote capillary condensation. In the BET adsorption plot,
is used as the x-axis and
as the y-axis. The resulting BET adsorption plot of the sample is shown in
Figure 7.
The specific surface area of each sample was determined by calculating the slope and intercept of the linear region of the BET adsorption isotherm. These values were subsequently used to derive the BET constant
C and the monolayer adsorption capacity
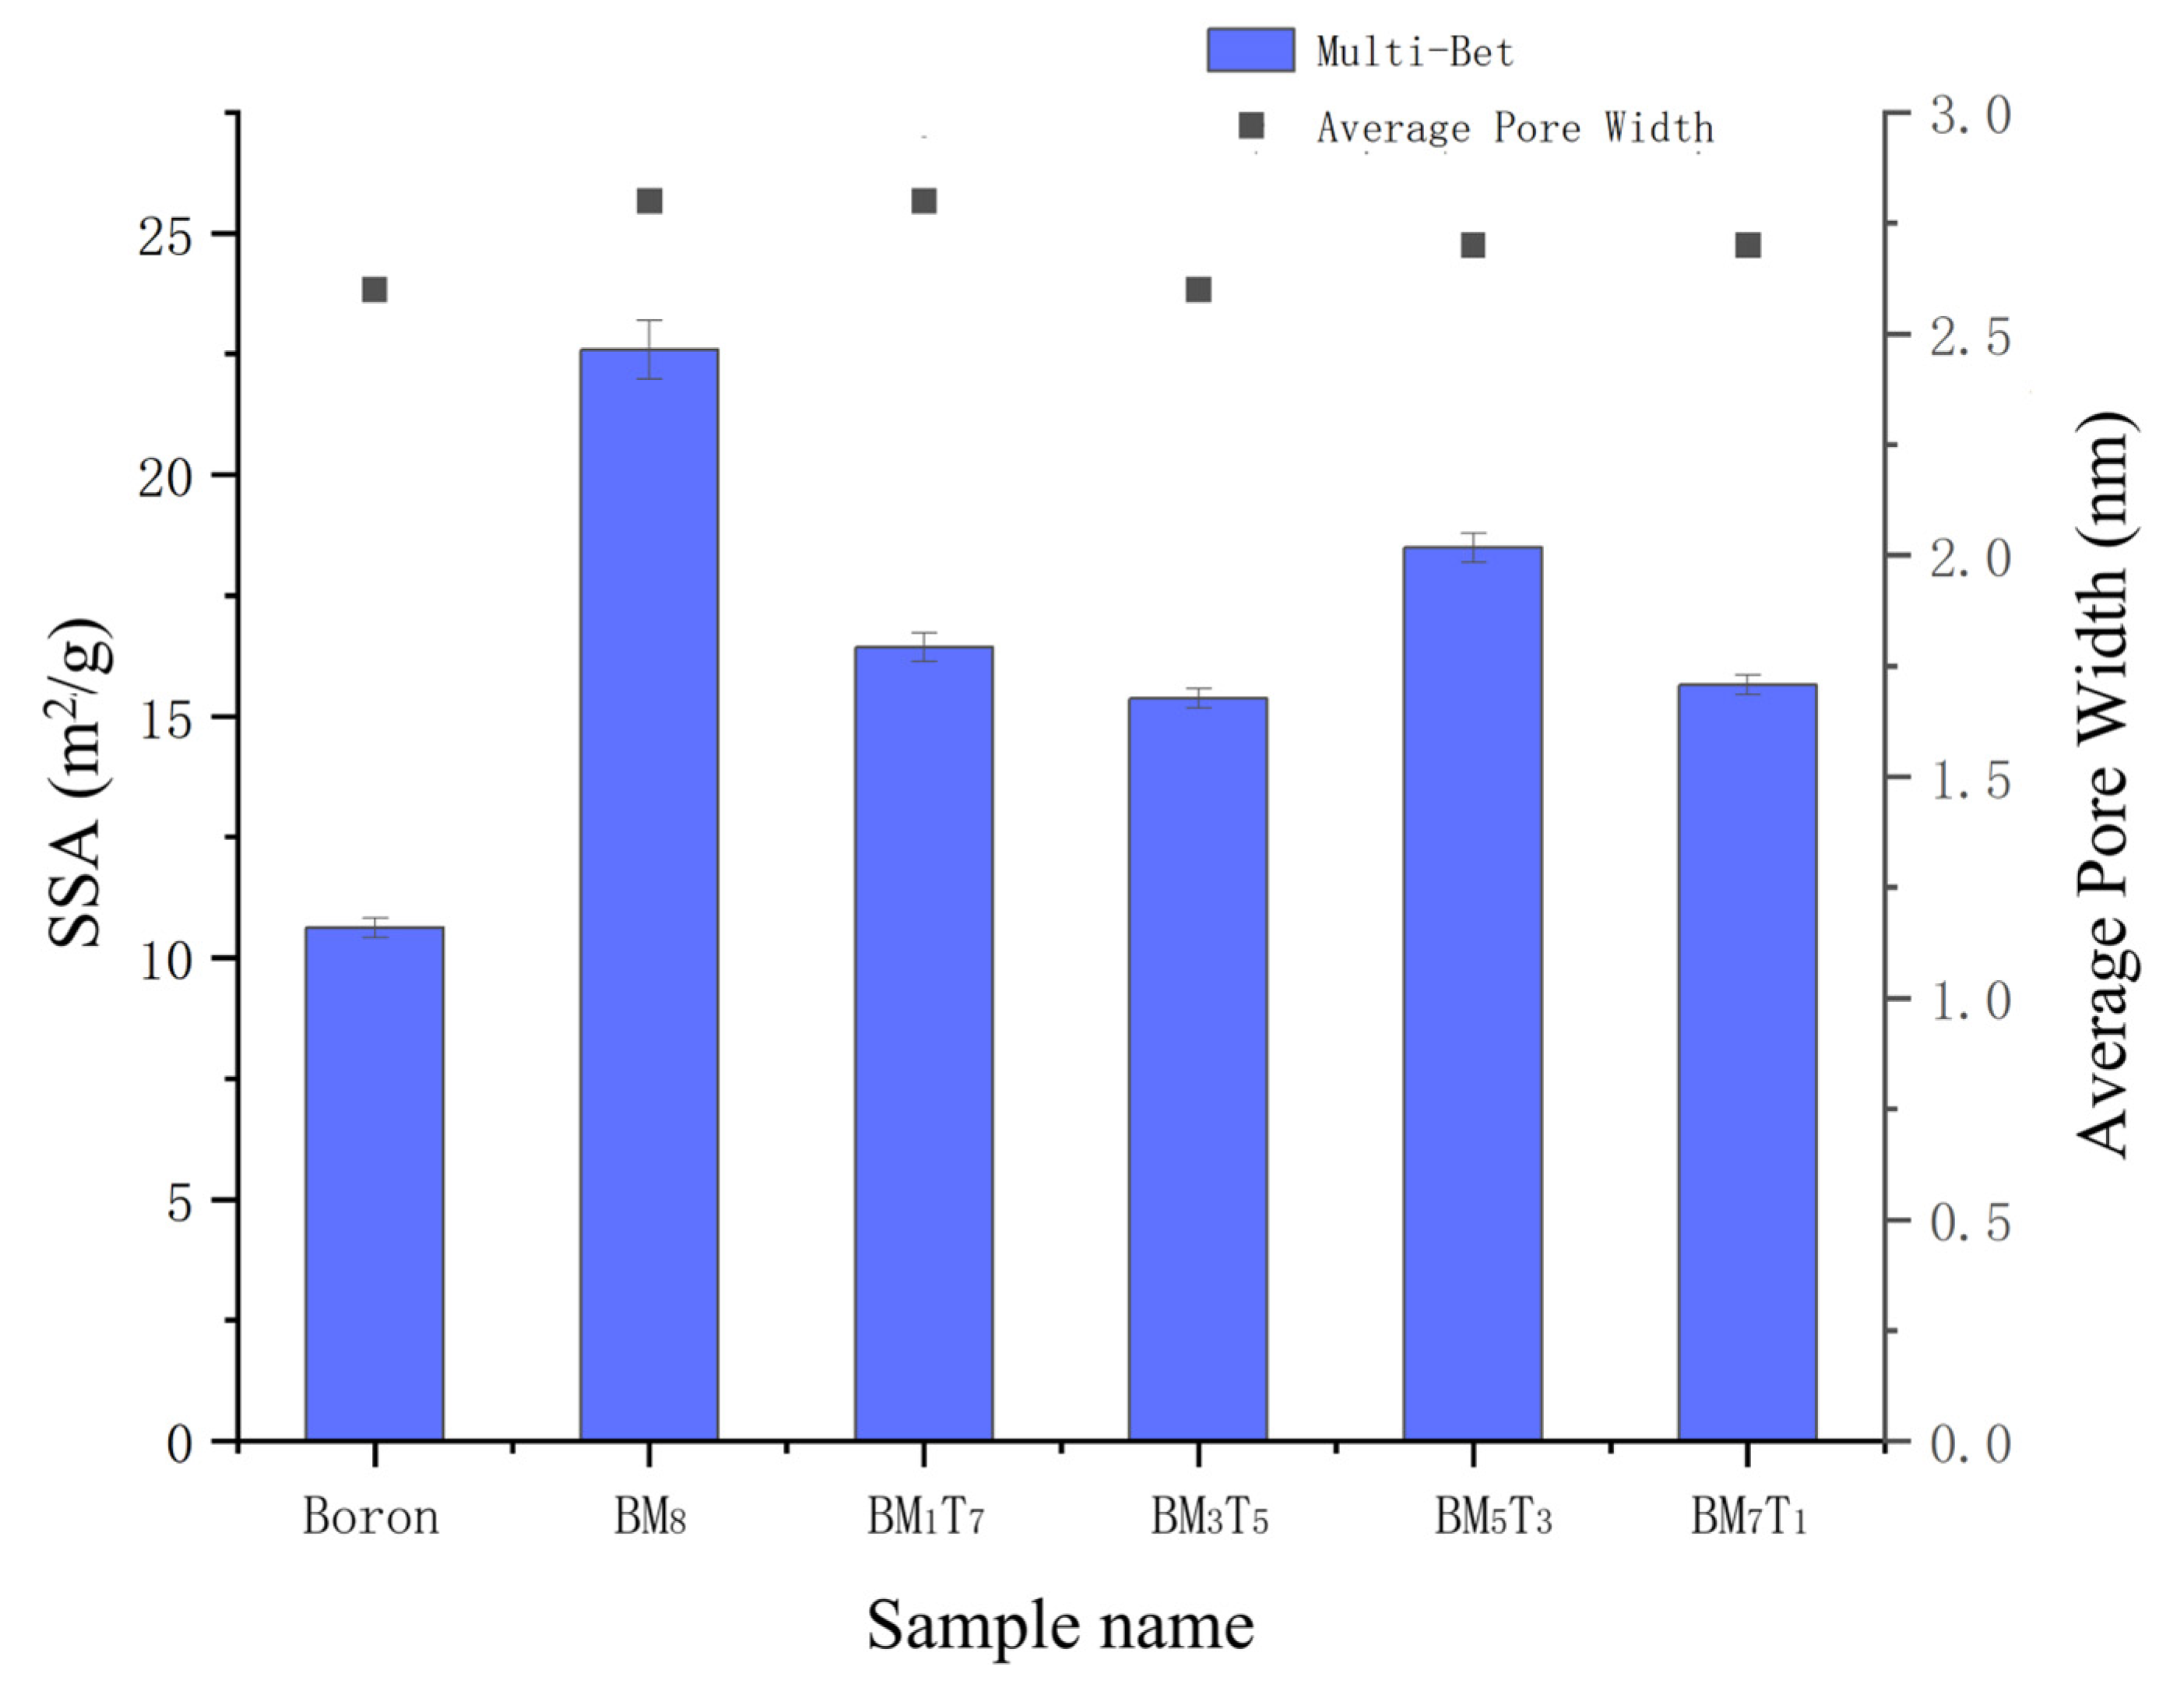
Vm. Based on these parameters, the specific surface areas were calculated using the Multi-BET model, as shown in
Figure 8. It should be noted that the error bars represent the standard deviation from three independent measurements, reflecting the reproducibility of the data. The results in
Figure 8 clearly demonstrate that the composite powders exhibit significantly higher specific surface areas than the untreated boron powder, all exceeding 15 m
2/g. However, no consistent or regular trend was observed between the variation in titanium content among the samples and their specific surface areas. Generally, finer powders exhibit larger specific surface areas. In this study, as the Ti content increases, the measured particle size of the composite powders follows the following order: BM
7T
1 > BM
5T
3 > BM
3T
5 > BM
1T
7. However, the actual specific surface area results show that BM
3T
5 has the highest value, while BM
5T
3 has the lowest. This discrepancy is mainly attributed to the drying process applied after wet ball milling. During drying, secondary agglomeration occurs in the powders. Although manual grinding was employed to break up these agglomerates, the effectiveness of this process in fully dispersing the particles is somewhat random. Consequently, samples with different Ti contents exhibit varying degrees of agglomeration, resulting in irregular specific surface area measurements. In contrast, the laser particle size distribution measurements display a consistent trend because the testing involves ultrasonic dispersion, ensuring a more uniform sample state during analysis. Therefore, the particle size results show a regular variation trend. In addition, the average pore width of all compositions remained within a narrow range of 2.6–2.8 nm, indicating that the mechanical ball milling process had a greater effect on specific surface area than on pore structure.
3.5. Viscosity
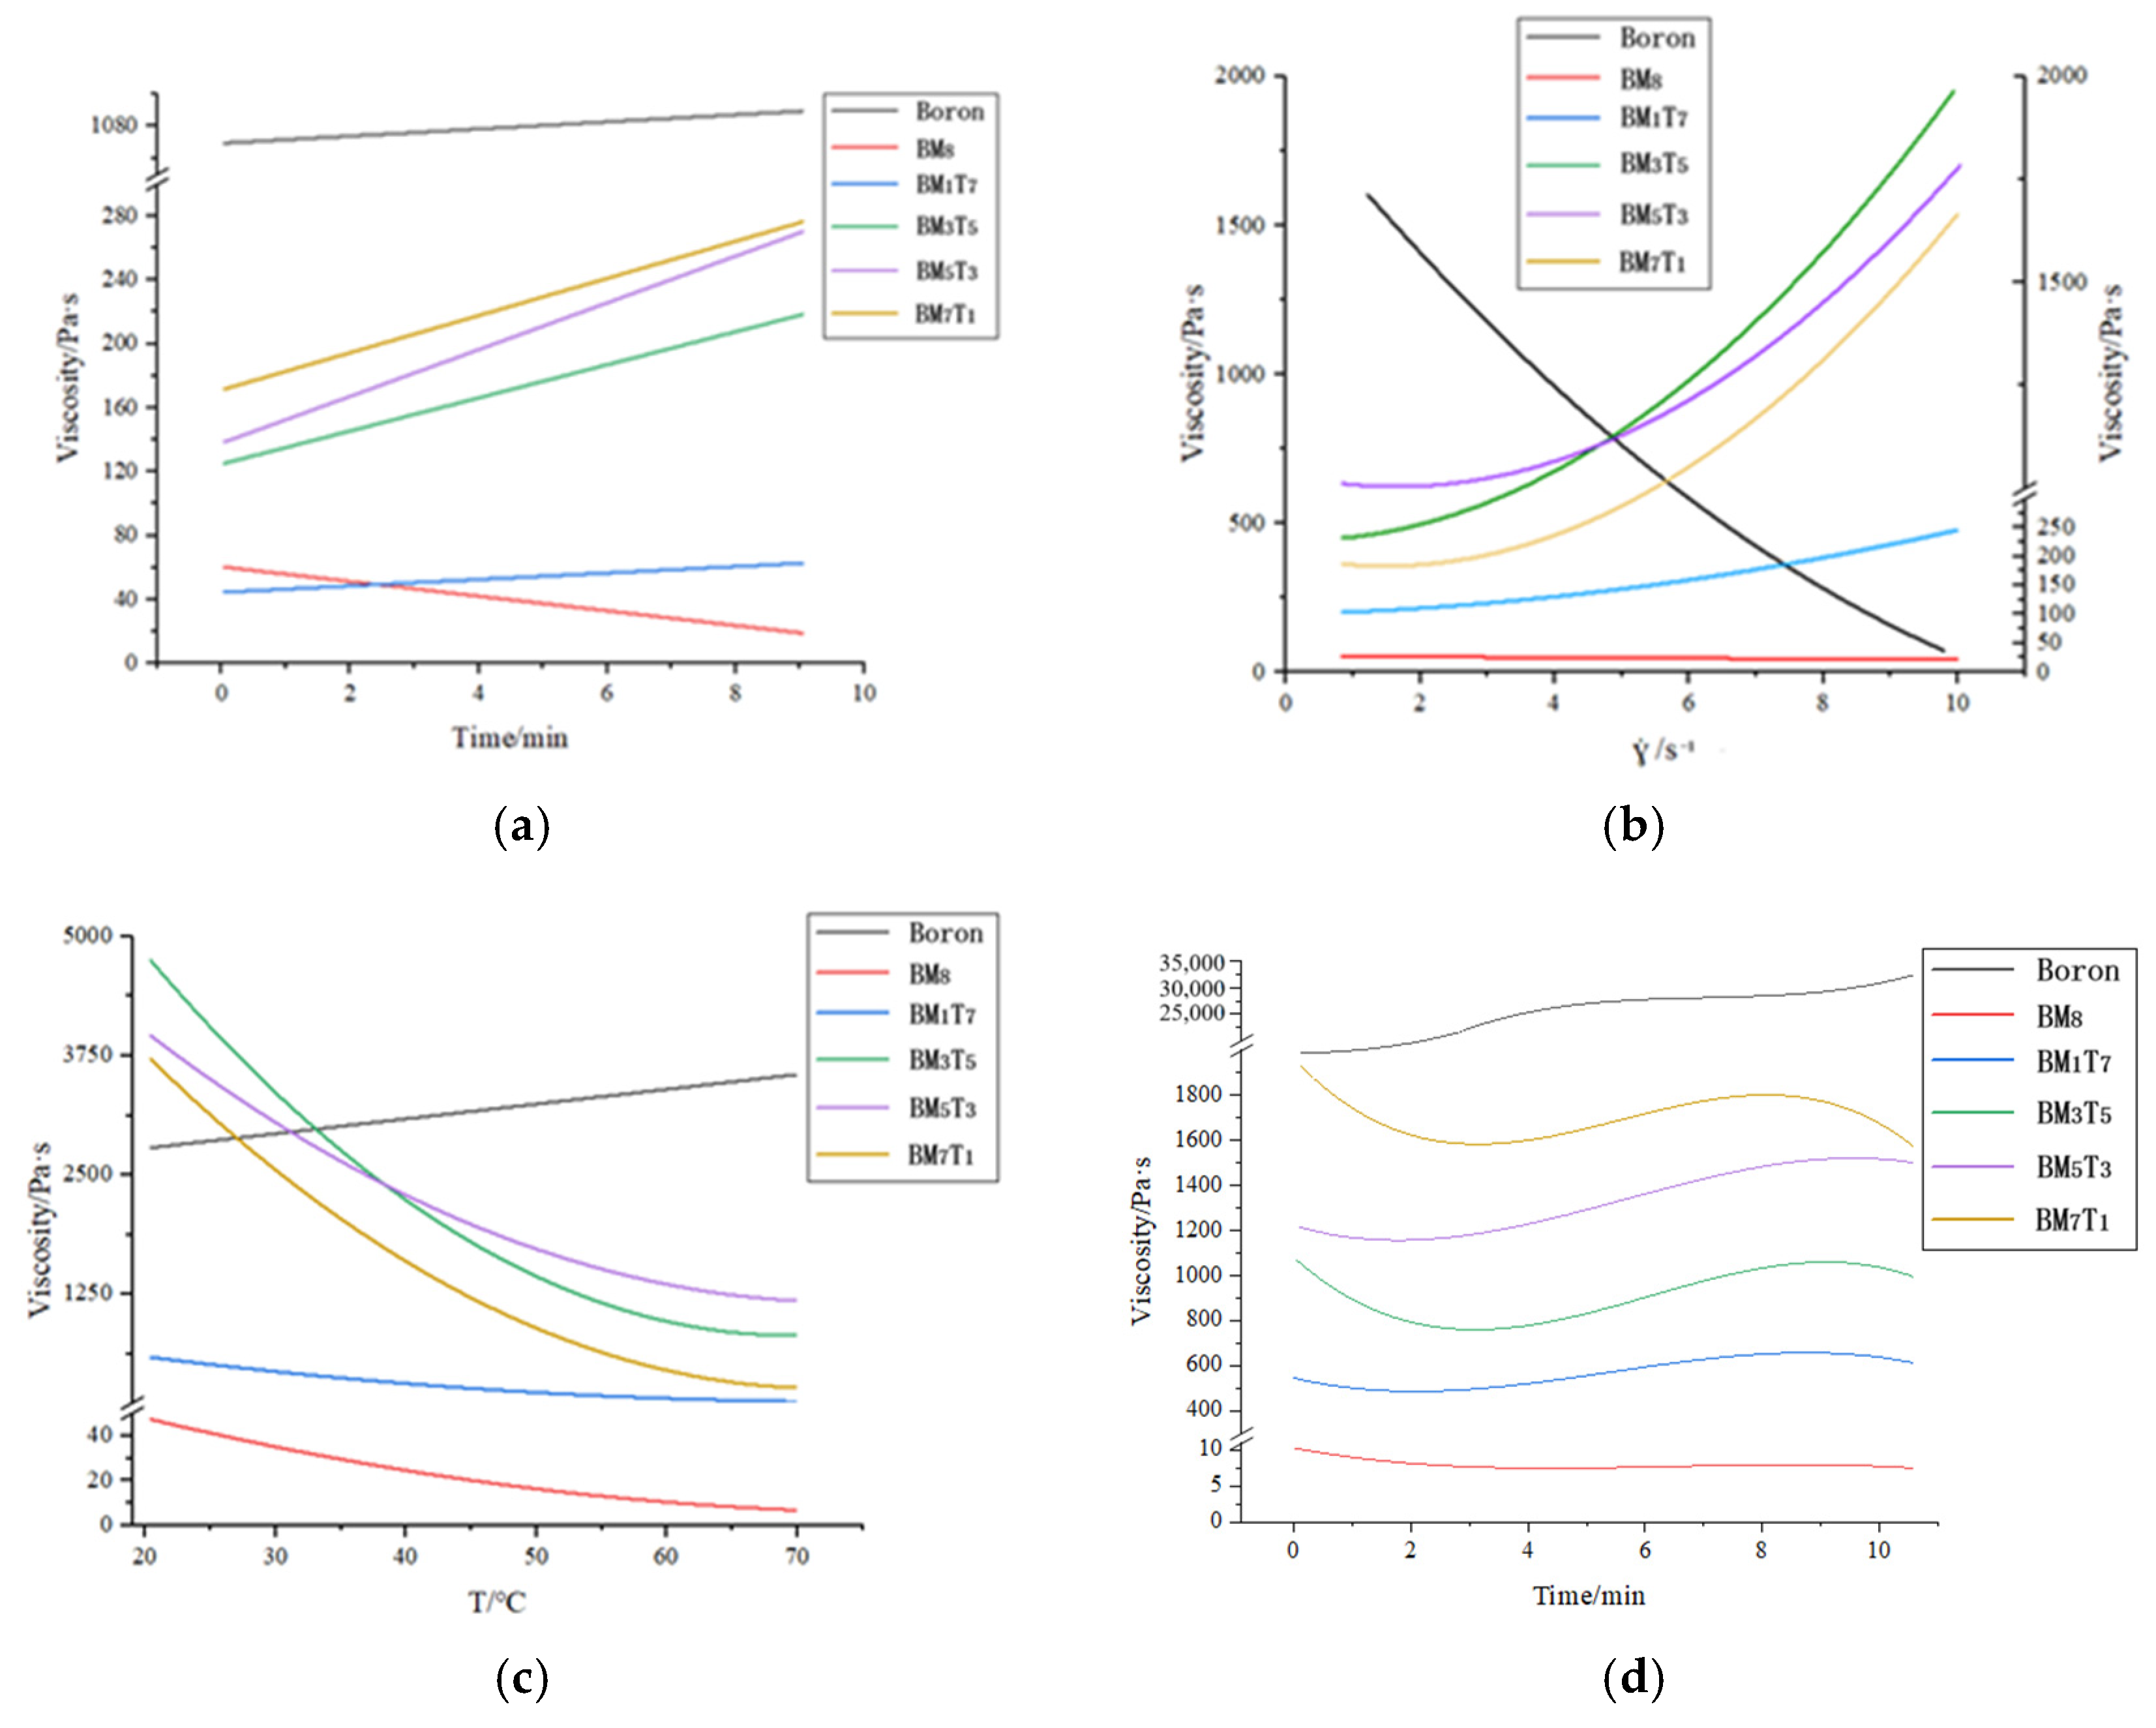
Figure 9 presents the results of numerical fitting based on all experimental test data, illustrating the relationship between viscosity and the varying test parameters across all prepared samples.
The rheological behavior of the composite powders was evaluated through a four-stage viscosity test. In the first stage, conducted at 20 °C with a constant shear rate of 1.000 s−1 for 10 min, most composite samples exhibited a slow increase in viscosity, except BM8, which showed a gradual decline. The unprocessed boron powder displayed the highest initial viscosity, followed by composite powders in the order of BM7T1 > BM5T3 > BM3T5 > BM1T7. Notably, BM8 started with a higher viscosity than BM1T7 but reversed over time. These results suggest that higher titanium content corresponds to a general reduction in viscosity at this stage.
In the second stage, as the rotation speed increased from 1.000 s−1 to 10.000 s−1 at a constant 20 °C, the viscosity of the ternary composites rose exponentially, while the unprocessed boron powder showed a rapid decrease. BM8 exhibited minimal change. Initially, BM3T5 and BM5T3 surpassed BM1T7 in viscosity, with BM3T5 overtaking BM5T3 at a shear rate of 4.898 s−1, indicating a stronger response to shear. The viscosity of BM1T7 increased only slightly, remaining the lowest among the composites.
In the third stage, the platform rotation rate was maintained at 1.000 s−1 while the temperature was rapidly increased from 20 °C to 70 °C over a 15-min period. During this rapid heating process, the viscosity of the original boron sample exhibited an increasing trend. In contrast, all B-Mg-Ti ternary composite powders demonstrated a general decrease in viscosity. Among these, the BM3T5 sample initially exhibited the highest viscosity; however, in the 20 °C to 40 °C temperature range, its viscosity decreased sharply, falling below that of the BM5T3 sample but remaining higher than that of the BM7T1 sample. The BM1T7 sample consistently exhibited the lowest viscosity throughout this stage.
In the fourth stage, the samples were held at a constant temperature of 70 °C while the platform rotated at a fixed rate of 1.000 s−1 for 10 min. Under these conditions, the viscosity of the original boron sample exceeded 20,000 Pa·s, indicating significant thickening at an elevated temperature. In contrast, all B-Mg-Ti ternary composite powders exhibited markedly lower viscosities, all remaining below 2000 Pa·s, with the BM8 sample reaching as low as <10 Pa·s. The viscosity profiles of the composite powders remained relatively stable throughout this stage, suggesting the establishment of a dynamic equilibrium at 70 °C. The viscosity ranking of the samples from highest to lowest was BM7T1 > BM5T3 > BM3T5 > BM1T7, which mirrored the trend observed at 20 °C. These results further confirm that increasing titanium content effectively reduces the viscosity of the composite powders. Across all testing phases, the BM7T1 sample consistently maintained a viscosity below 1000 Pa·s, while the other samples exhibited varying degrees of fluctuation. Notably, the BM3T5 sample demonstrated the largest fluctuations, with its viscosity peaking near 5000 Pa·s during the early stages of the thermal ramp-up, followed by a sharp decline. This pattern was also observed during the speed-increase phase, where a rapid rise in viscosity was followed by an equally rapid drop during heating. Although the BM5T3 sample displayed a similar fluctuation trend, the rate and extent of change were less pronounced than those of BM3T5. The BM1T7 sample showed viscosity behavior consistent with that of BM7T1, both maintaining relatively low and stable values throughout the testing sequence.
The B-Mg-Ti composite powder prepared in this study is primarily intended for use as a fuel component in solid propellants. In particular, HTPB-based (hydroxyl-terminated polybutadiene) solid propellants commonly use HTPB as the binder. During propellant formulation, the mixture of boron powder and HTPB is achieved through stirring at a controlled temperature of 70 °C. However, the boron powder surface often contains boron oxide (B2O3) or boric acid, which can interact with the terminal hydroxyl groups (–OH) in HTPB through acid-base coordination or esterification reactions. These interactions can induce slight crosslinking or molecular entanglement, leading to a significant increase in system viscosity and consequently limiting the amount of boron powder that can be incorporated. To address this issue, magnesium and titanium are introduced to form a composite coating on the surface of boron particles, which effectively prevents direct contact between the oxidized boron surface (B2O3 or boric acid) and HTPB, thereby reducing the viscosity during mixing. Titanium is introduced via a ball milling process, which enhances the shear force exerted by the milling media on the base materials. This promotes the dispersion of magnesium within the boron aggregates, resulting in localized micro-scale composites of boron, magnesium, and titanium. The amount of titanium added influences the surface coating state of the powder, which in turn affects the rheological behavior of the composite. Notably, in practical applications at 70 °C, higher titanium content corresponds to lower viscosity, indicating that titanium plays a crucial role in viscosity control. Therefore, it is reasonable to conclude that an optimal ratio of magnesium and titanium in the B-Mg-Ti samples can be identified to maintain stable viscosity under the four-stage testing conditions.


