Article

Study of Current- and Wave-Induced Sediment Transport in the Nowshahr Port Entrance Channel by Using Numerical Modeling and Field Measurements

1
Department of Civil Engineering, Islamic Azad University, Central Tehran Branch, Tehran 1584743311, Iran
2
Department of Civil Engineering, University of Guilan, Guilan 4199613765, Iran
3
Department of Civil Engineering, Islamic Azad University South Branch, Teheran 1584743311, Iran
4
School of Water Science and Engineering, Shahid Chamran University of Ahvaz, Ahvaz 6135783151, Iran
*
Author to whom correspondence should be addressed.
J. Mar. Sci. Eng. 2020, 8(4), 284; https://doi.org/10.3390/jmse8040284
Submission received: 29 January 2020 / Revised: 2 April 2020 / Accepted: 8 April 2020 / Published: 15 April 2020
(This article belongs to the Special Issue Modelling of Harbour and Coastal Structures)

Abstract

:
The Nowshahr port in the southern coastlines of the Caspian Sea is among the oldest northern ports of Iran, first commissioned in the year 1939. In recent years, this port has been faced with severe sedimentation issues in and around its entrance that has had negative impacts on the operability of the port. The present study aims at identifying major reasons for severe sedimentation in the port entrance. First, field measurements were evaluated to gain an in-depth view of the hydrodynamics of the study area. Numerical models then were calibrated and validated against existing field measurements. Results of numerical modeling indicated that wind-induced current is dominant in the Caspian Sea. The numerical results also indicated that in the case of an eastward current direction, the interaction between current and the western breakwater arm would lead to the formation of a separation zone and a recirculation zone to the east of the port entrance region. This eddying circulation could transport suspend settled sediments from eastern shoreline towards the port entrance and its access channel. The results of this paper are mostly based on the study of current patterns around the port in the storm conditions incorporate with the identification of sediment sources.

1. Introduction

The study of sedimentation in the entrance channel and basin of ports is of significant importance. This is because excessive sedimentation can result in a reduction in economic activities and can impact the overall operability of the port. Also, with the construction of coastal structures such as ports and with potential interference with longshore sediment transport patterns, the study of coastline changes due to accretion and erosion and subsequent loss of land in the hinterland area of port becomes of greater importance. Therefore, proper identification of sources of sediment supply and dominant transport patterns is of significant importance in determining long-term status of the port and all the operational expenditures required to keep the economic functioning of the port [1].
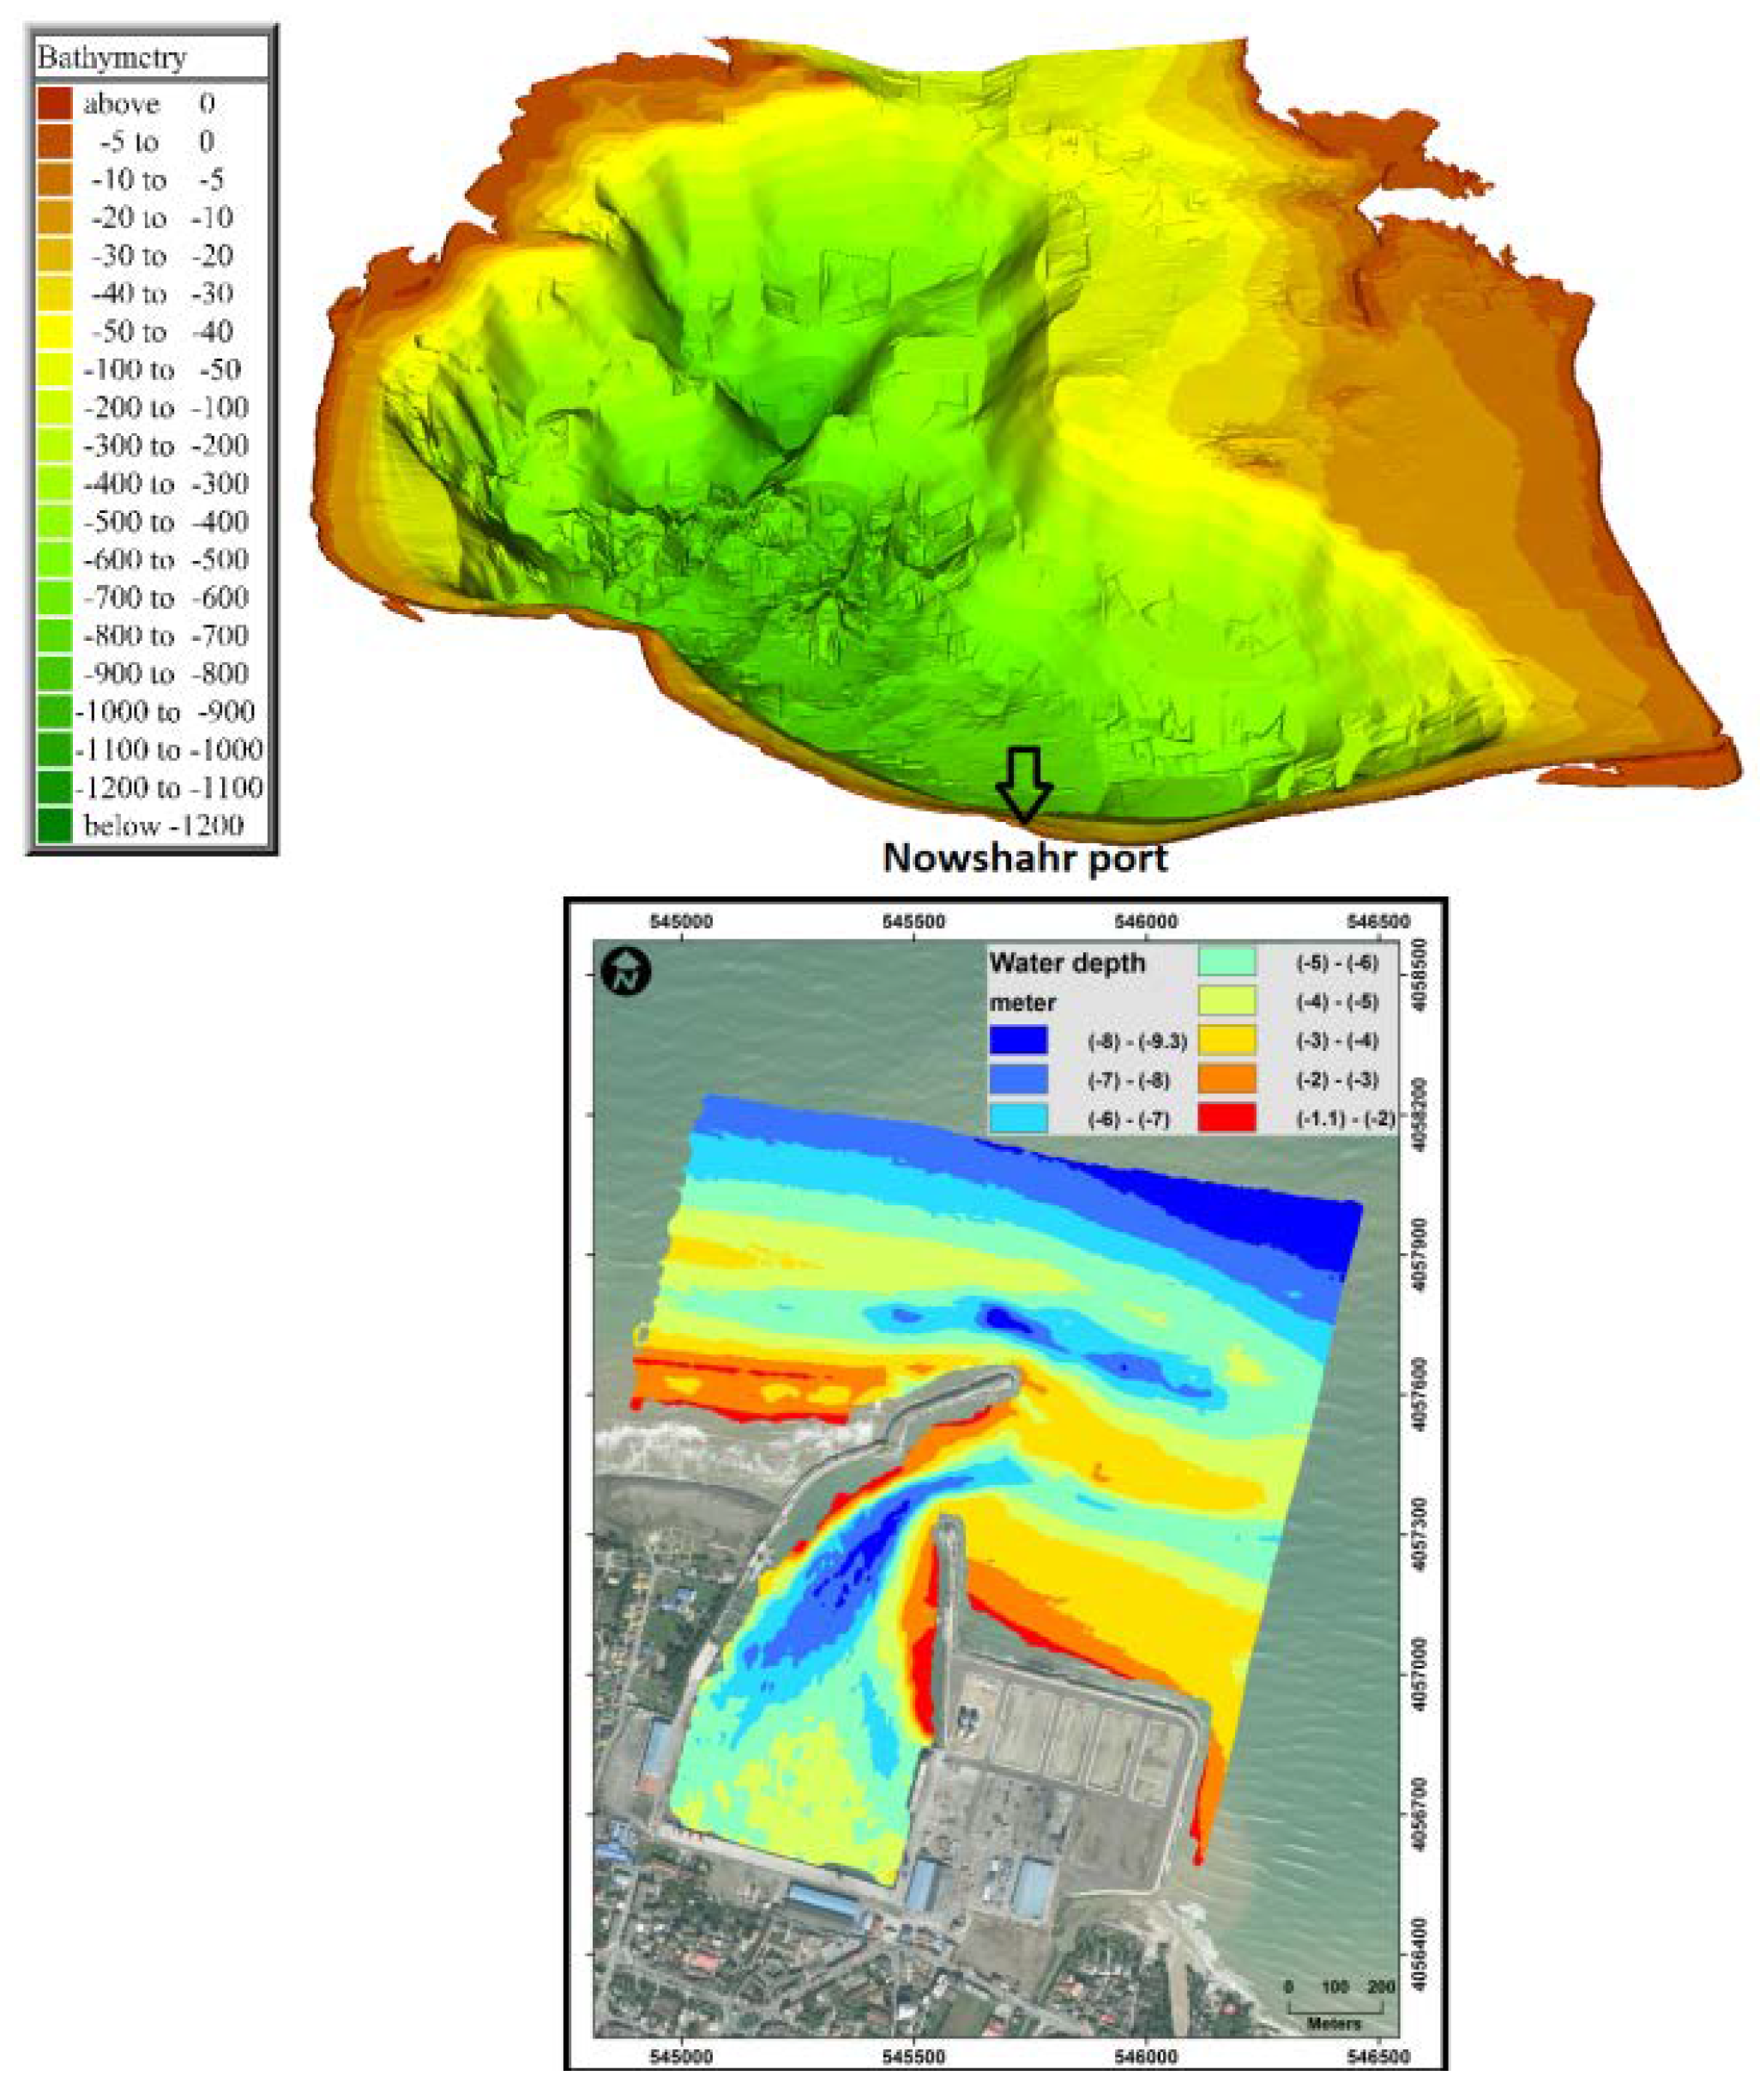
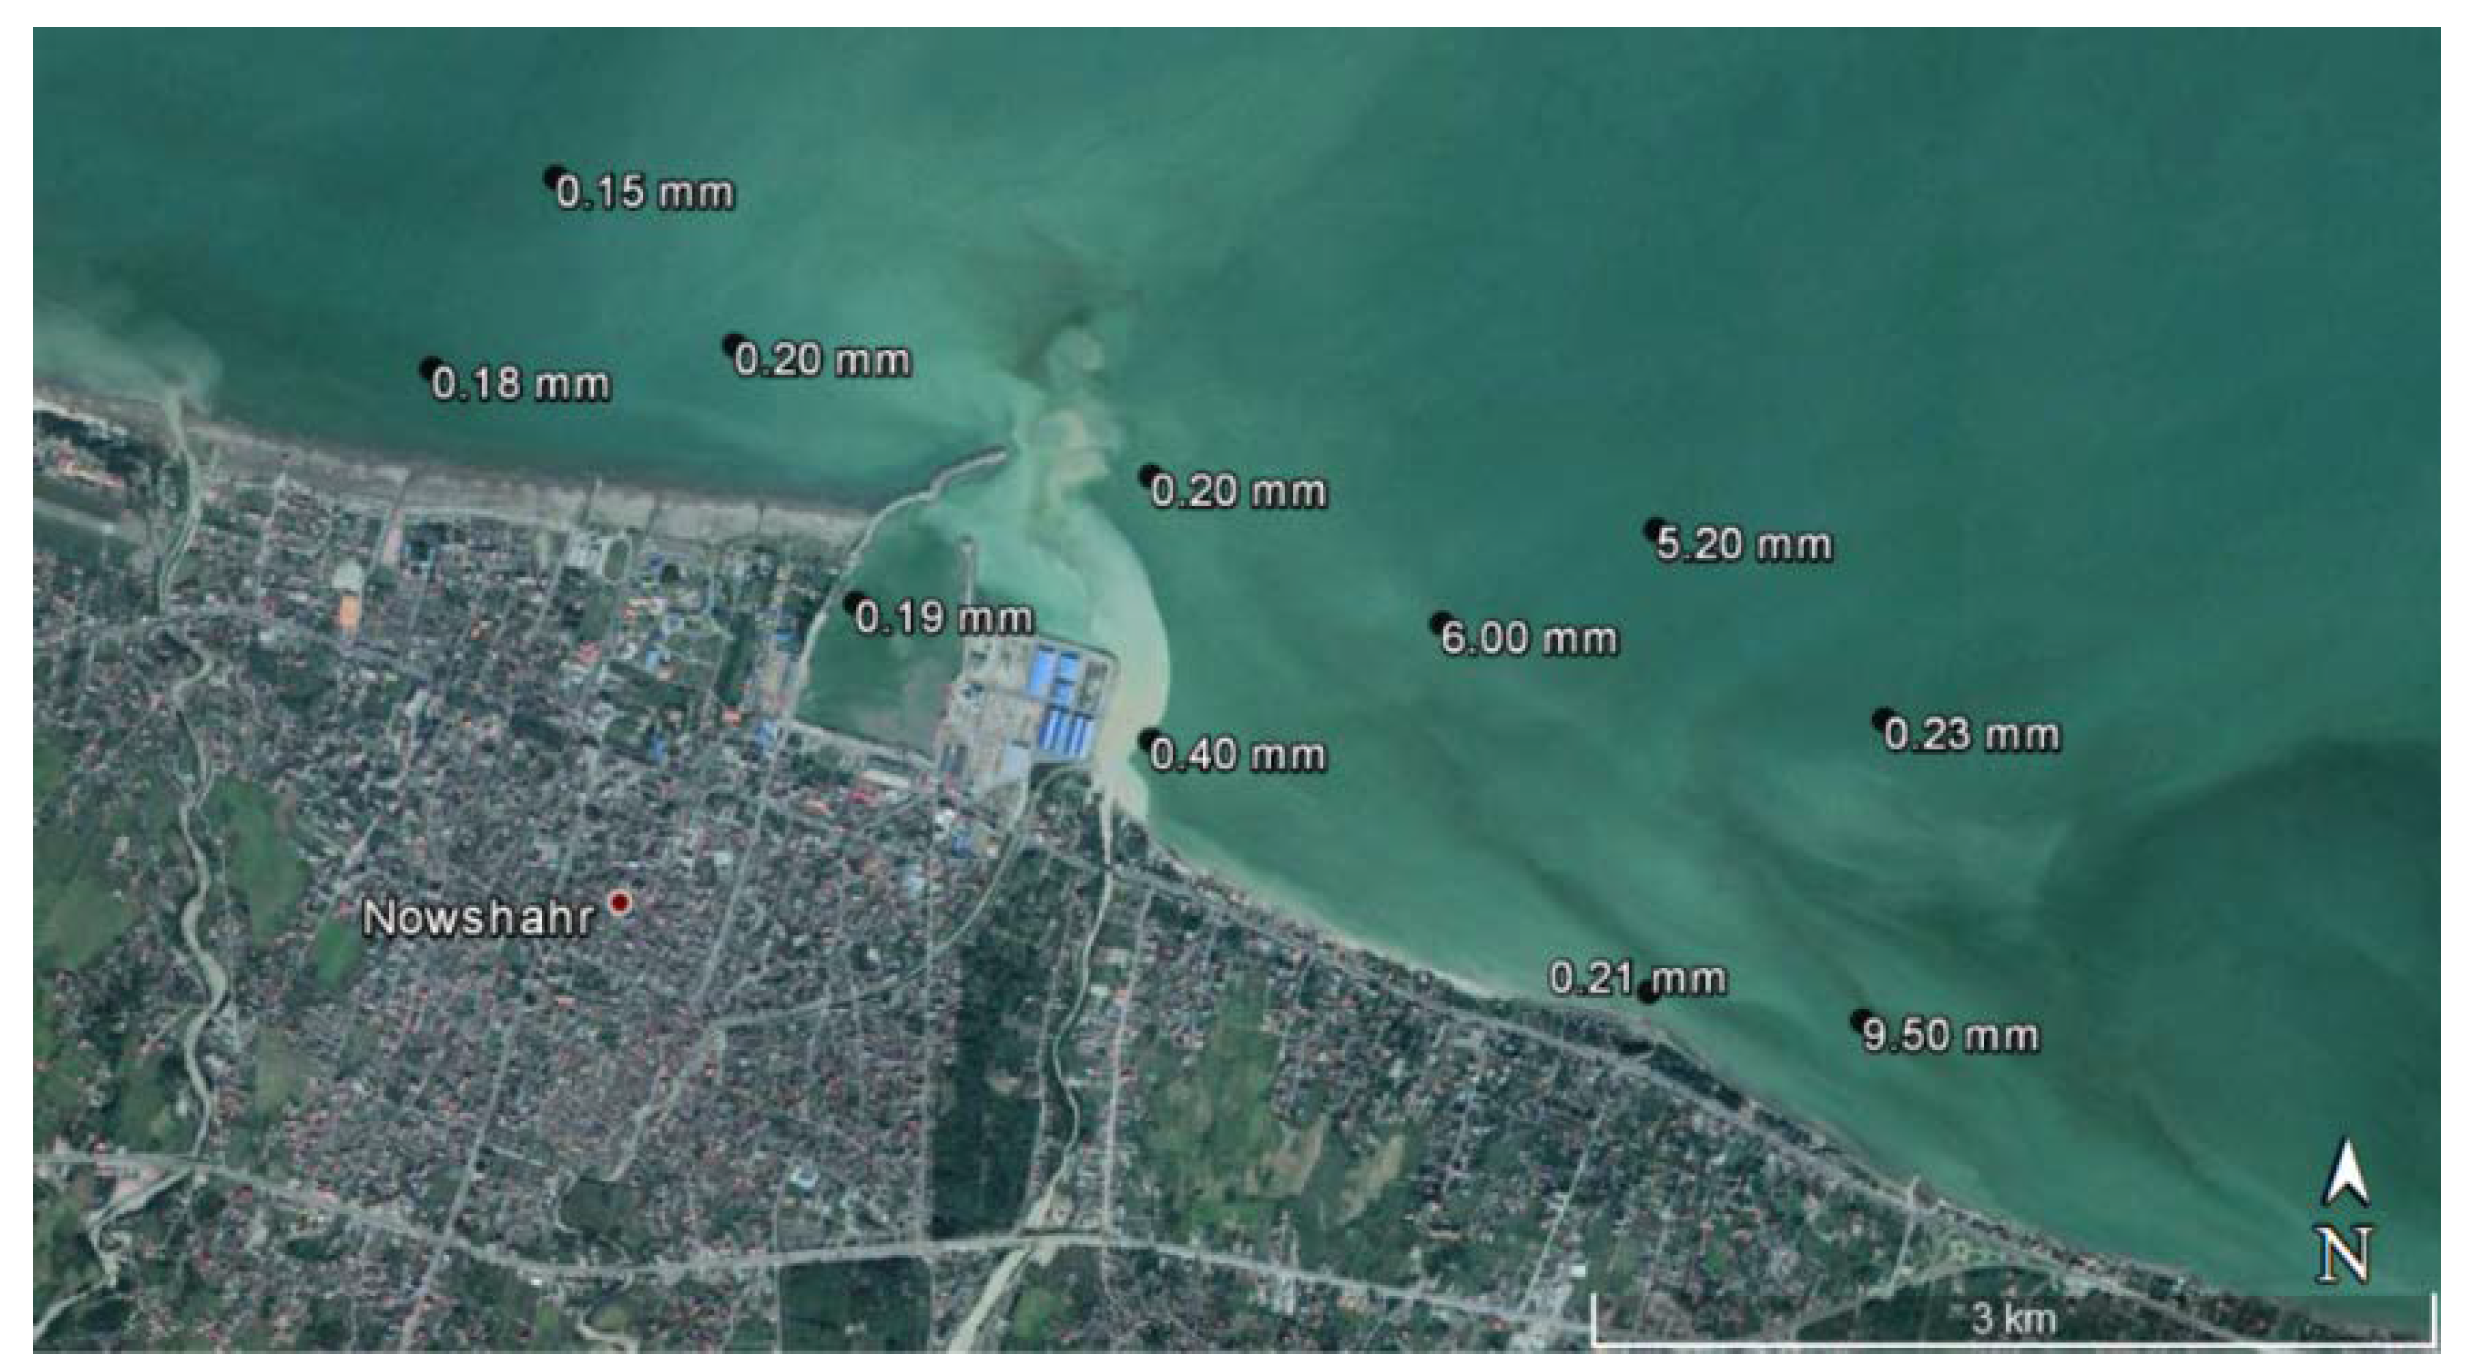
Nowshahr port is among the oldest and most active ports situated along the southern coastline of the Caspian Sea. This port is located in the north of Iran at the longitude of 51 32′ E and latitude of 36 39′ N. The location of this port along the southern coastline of the Caspian Sea is shown in Figure 1.
Construction of Nowshahr port started in the year 1930 and commissioned in the year 1939. Since then, the port has been continuously operational. Several changes have occurred throughout the past years in Nowshahr port. 
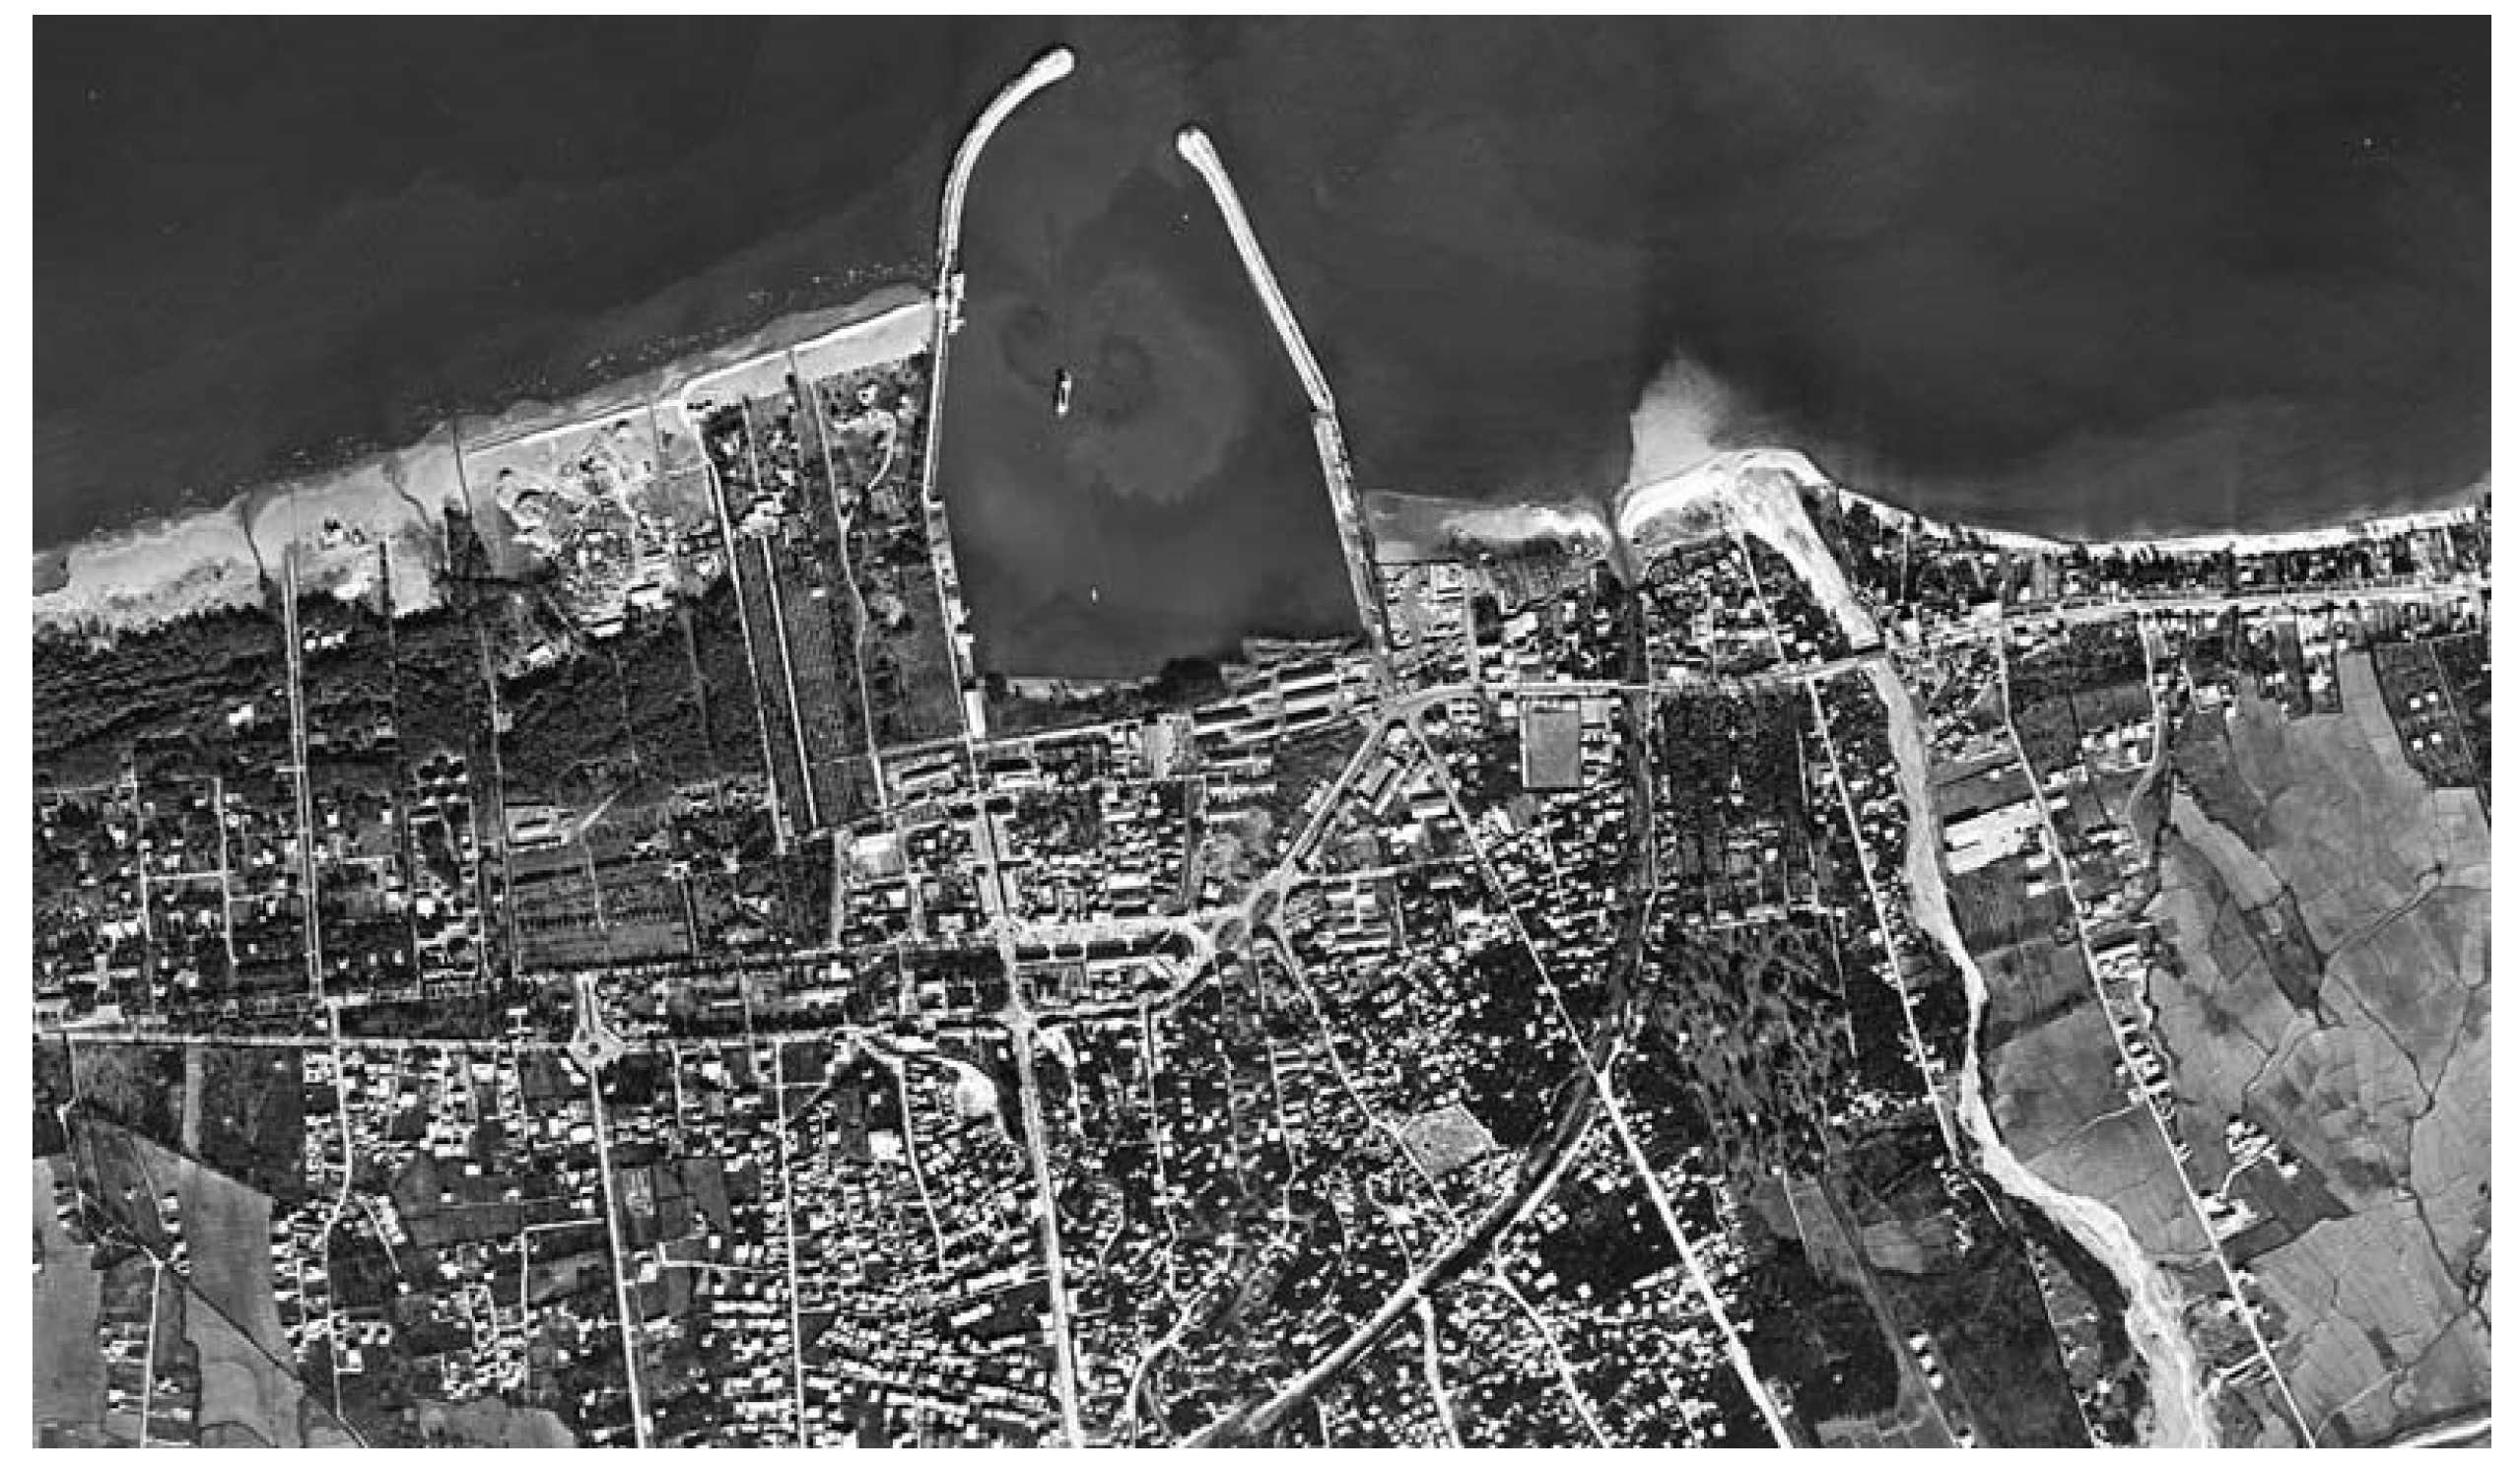
Figure 2 shows the initial layout and positioning of the port. As evident in this figure, the westward areas of the port faced severe sedimentation while eastward areas were dominated by coastal erosion. This is an indication of dominant eastward (west to east) direction of sediment transport which would then result in an accretion of sediments to the west of coastal structures and erosion of coastline to the east of them, consistent with existing literature on this subject matter [2].
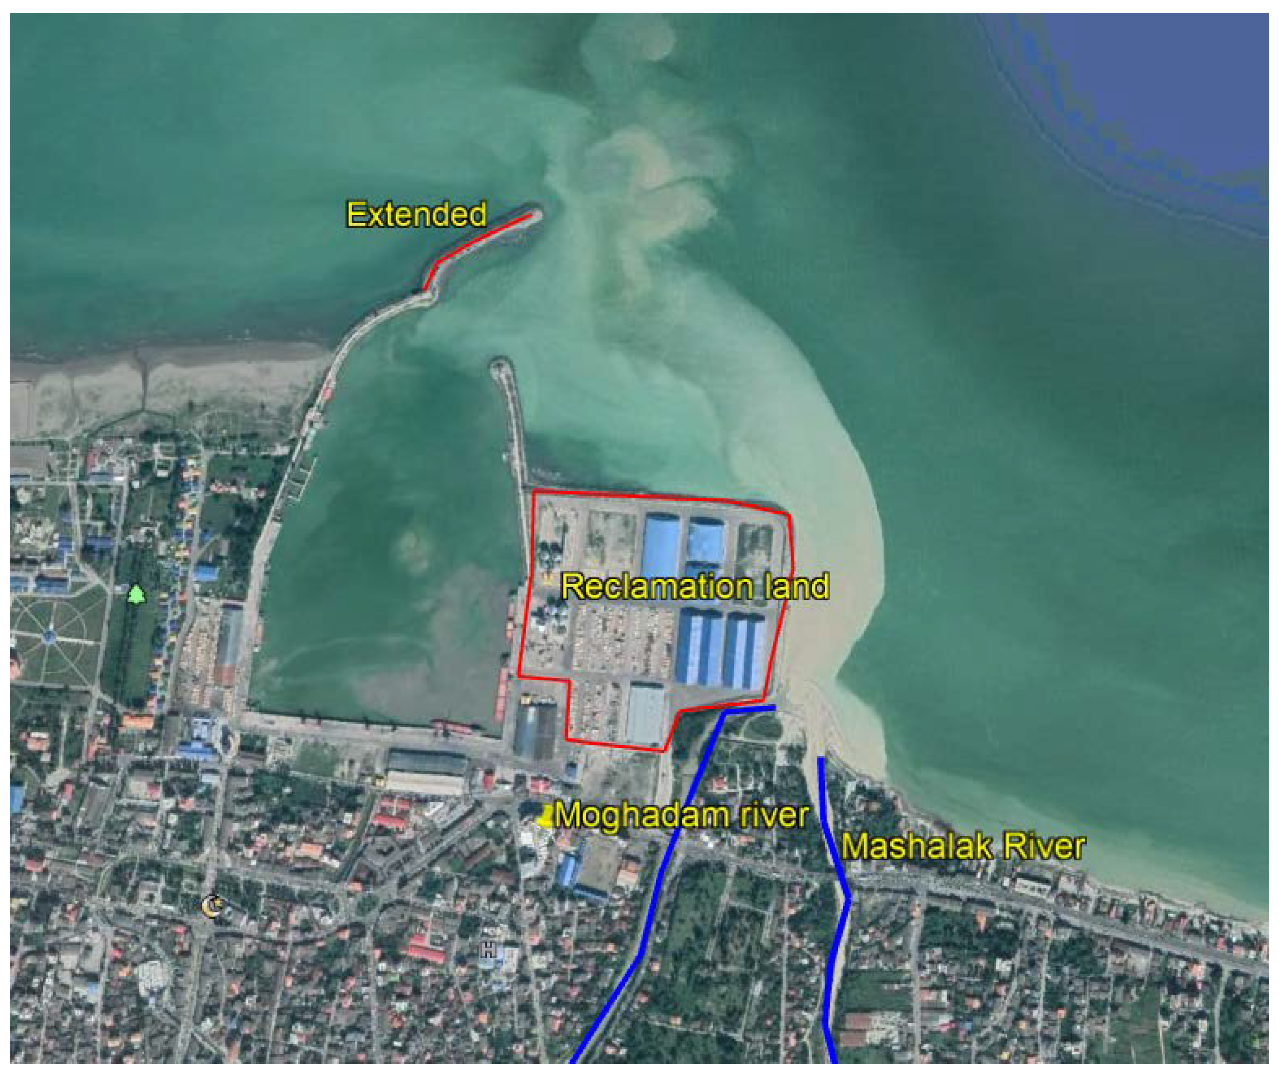
Throughout the 50 years after its initial construction, the port has faced an unwanted wave agitation problem inside the port basin. The sedimentation issue was rather less important throughout the same period in this port. In the year 1989, it was decided that for reduction of wave height inside the basin, the western arm of breakwater shall increase in length by 300 m. Also due to lack of required hinterland, a land reclamation project was conducted in the eastern part of the port in two different stages. Figure 3 shows various changes that have taken place in port layout in the past years including land reclamation in the eastern part of lee breakwater and changes in the western arm of breakwater (main breakwater).
The port throughout its operational lifetime has faced severe sedimentation problems and a decrease in water draft depth on its entrance channel. As a result, the basin and entrance channel of Nowshahr port has been dredged multiple times since 1988. The problem of sedimentation has been exacerbated in recent years such that regular annual dredging of up to 300,000 m3 in the entrance channel is required for the port to continue its operation. Variation and gradual reduction in the Caspian Sea water level, lengthening of the main breakwater, land reclamation in the eastern parts and increase of sediment supply from rivers are among the reasons why Nowshahr port is faced with severe sedimentation problem [3]. This problem can be related to the positioning and layout of the basin and its entrance location [4]. There are numerous worldwide examples of studying sedimentation problems arising from similar factors in the port basin and ways of mitigating its unwanted effects [5,6,7,8,9,10,11].
Generally, past studies focusing on the issue of excessive sedimentation in Nowshahr port are rather limited. These studies are either in the form of conference proceedings [3,12,13,14,15] or consulting engineer reports [16,17]. It is thus concluded that an in-depth knowledge of sources of sediment supply and hydrodynamics of the study area affecting sediment movement patterns is still lacking. The main purpose of this study is to investigate the long-term problem of sedimentation in Nowshahr port and provide a comprehensive view of the hydrodynamics of the study area and sediment transport patterns.
Measurement of various parameters such as wave height, current speed, water level variation and sedimentation in areas surrounding Nowshahr port will be used in this study in order to investigate the effects of these parameters on sediment supply in the region of interest. The circulation patterns and major hydrodynamic features of the study area will first be investigated through the analysis of existing field measurements. This will be supplemented with the usage of a well-calibrated and validated numerical model to provide additional sources of data in identifying dominant sediment transport patterns in the study area. The present study aims at providing beneficial data for the researchers and engineers to discuss the solutions for the issue of sedimentation in the access channel and basin of Nowshahr port.

2. Materials and Methods

The required field measurements for the study of sedimentation in the area surrounding the port include hydrodynamic parameters such as wave, coastal wind, sea currents and also general sediment properties. As the field measurements are generally expensive, availability and distribution of these data is usually limited to few points around the port. Another source of data for the studies can be derived from numerical models that have been calibrated and validated using existing field measurements [18,19,20]. In the present study, both of the above mentioned sources of data were used for investigation of sedimentation in Nowshahr port.

2.1. Existing Field Measurements

In this section, various sources of field measurements used in the present study will be described. The circulation of the Caspian Sea is largely controlled by the variation of the wind field and also the variation of bottom friction in near-shore areas. The tidal effects are almost negligible in this closed lake. In the coastal zone, wave breaking also makes coastal longshore currents which are one the most effective factors for sediment transport along the shores. These waves also derived by strong winds. Therefore, at first existing data on wind parameters in this region is presented. It has then proceeded with other data sources including other existing hydrographic measurements such as wave and currents and coastal and river sediment properties. The same data sources will be used for model calibration and validation.

2.1.1. Measurements of Local Wind

As mentioned earlier, one of the most important parameters of the current model is the wind field. There are various wind data sources available for the study area such as satellite observations and numerical weather research models. One of the sources of wind data available for the Caspian Sea is the results of the Weather Research Forecast (WRF) model which was previously used in the “Monitoring and Modeling Study of Northern Coasts of IRAN” project. This model is usually considered to provide the most accurate wind field data [21]. This dataset consists of the 1-hourly wind data from 1983–2013 with a spatial resolution of 0.1° × 0.1°. The comparisons of these wind data with the measurements near the study area have shown that the WRF wind field is the most accurate representation of the region’s wind field (compared to other wind fields such as QuikSCAT or ECMWF) [21]. Hence, this wind data is used as the input wind for forcing the numerical model. Figure 4 shows the wind rose in the Nowshahr port based on WRF wind data.
According to Figure 4, wind rose is dominated with two main directions of winds, namely the easterlies and westerlies that blow parallel to the coastline. The maximum westerly wind speed reaches 25 ms−1. Roughly 55 percent of time, calm conditions (wind speed less than 3 ms−1) prevails.

2.1.2. Hydrographic Measurements

Figure 5 shows bathymetric data in the southern Caspian Sea and also the area surrounding Nowshahr port. For the southern coasts of the Caspian Sea, the bathymetry data were obtained from the maps provided by Iran National Cartographic Center which were available on different scales (1:10,000, 1:25,000, 1:100,000). For the far shore, etopo2 bathymetry data were applied here. According to this figure, the depth reaches less than 2 m near the western arm of breakwater. Extensive sedimentation can be seen in the port entrance. An access channel was dredged to a depth of 6 m in order to facilitate the passage of vessels in the past years. Maintenance of this access channel requires annual dredging of up to 300,000 m3. Also sedimentation in the access channel and port entrance areas resulted in interference with the free passage of vessels occasionally.

2.1.3. Wave and Current Measurements

Wave and current measurements are important sources of data in the study area, since the movement of sediment is controlled by these hydrodynamic conditions. These data will be used for the calibration and validation of the models.
The data used in this study is obtained from the results of “Monitoring and modeling study of northern coasts of Iran”, where long-term measurements for more than 1 year were surveyed in various locations at the Iranian coasts of the Caspian Sea [22]. In the present study, wave and current measurements in a 10 m depth point located near the Nowshahr port were used. The exact location of this point was 51.3883° E and 36.6985° N. The wave and current measurements were surveyed at 10-min intervals, rendering this dataset quite useful in identifying high-frequency events.
The existing wave data including significant wave height and mean wave direction is available for 15 months from 15 October 2012 to 7 February 2014. The maximum recorded significant wave height in this station through this period was about 3.4 m. The average significant wave height was about 0.65 m. Figure 6 indicates wave rose obtained from the analysis of wave data in this station. About 69 percent of the time, calm conditions prevail with wave height less than 0.7 m.
As seen in Figure 6, more energetic and more frequent directions of waves are NNW and N. These directions would result in the formation of long-shore currents and sediment transport in the eastern direction (west to east) in the surf zone. This is consistent with sedimentation patterns observed in western parts of the Nowshahr port and behind the main breakwater (Figure 2 and Figure 3).
The current measurement in this station is available from 15 October 2012 to 9 February 2014. The maximum observed current velocity in this station was around 0.94 ms−1 and occurred at a depth of 3.5 m below the water surface on 7 October 2013. The maximum current velocity flows towards the direction of 85 degrees (eastward). Figure 7 presents the comparison between the two surface and bottom current roses that were obtained at this station. According to Figure 7, surface eastward currents are stronger than bottom currents. The currents at the surface and bottom tend to flow eastward. Opposing westward currents also occur both at surface and near bottom. These less frequent westward currents flow in the opposing direction of the dominant current direction (which is eastward) and are generally stronger near the surface with velocities larger than 0.2 ms−1. Therefore, it is concluded that both westward and eastward currents parallel to the coastline occur in areas adjacent to Nowshahr port. However, the eastward currents are stronger and more frequent. Based on the measured data with the current speed higher than 0.1 ms−1, about 70% percent of data are form west to east with the average and maximum current speed of 0.21 and 0.84 ms−1, respectively. The average and maximum current speed for the remaining 30% of east to west currents are 0.15 and 0.44 ms−1, respectively. Because of positioning of port entrance and its main and lee breakwaters, westward currents can cause problems for navigation and sedimentation in the port entrance by carrying sediments supplied from rivers located in the east of the port.

2.1.4. Coastal Sediment Properties

Sediment measurements have indicated that around the Nowshahr port, most of the sediments are composed of sand. On the eastern side of the port, coarser sediments including gravels are also observed. This could be due to intensive erosion occurring over the years on the eastern side of the port (the east of lee breakwater). The dominant west to east current erodes the finer portion of sediments, leaving the coarser materials behind. Because the port breakwaters block the river of sand, there are no replacements for finer sand materials. To the up-drift side of the port, the average particle diameter is about 200 microns and is mostly composed of sand. The information from continual dredging carried out in the area also indicates that the average grain sizes of dredged materials in the area were about 0.2 mm.
The distribution of sediment mean grain sizes is shown in Figure 8. These measurements were performed in 2012 [3]. Regarding the extreme dimensional variability observed in the east, these samples seem not enough to represent the true sediment grain size variation in the domain.
Besides the dominant sand material of the bed sediments around the port, the small percentage of silt was also observed in the far shore near the port entrance. In coastal areas, by moving from port entrance to the west, average grain sizes increase. In accordance with Figure 8, average particle diameters in western areas of the port are close in three locations. However, large variations can be seen in the eastern areas of the port and behind the lee breakwater. In these areas, the sediments are mostly composed of coarser gravel material (Figure 8).

2.1.5. Riverine Sediment Properties

Two rivers flow into the eastern parts of Nowshahr port: Mashalak and Moghadam rivers. As evident in Figure 3, the sediment supply of these rivers could be a noticeable amount in the annual budget of sediments in the particular study location. This is especially true about the Mashalak River. As it was shown in previous sections, in addition to the dominant eastward currents, westward currents also occur in the study area occasionally. These surface westward currents have the potential to carry sediments supplied by these rivers (which mostly occur at the surface) toward the entrance of Nowshahr port and would then result in deposition of sediments in the basin of Nowshahr port. Therefore, it is crucial to quantify the annual supply of sediments from these rivers into the areas surrounding the Nowshahr port and in particular, the access channel of the port. The sediment supplies of these rivers were measured using the analysis of sediment concentration in the water samples that taken every month of the year. Following the analysis of these measurements, it was found that the average annual sediment supply from these rivers reaches 40,000 m3 per annum. The discharges and sediment concentration of the rivers were included in the model as source terms.

2.1.6. Analysis of the Hydrodynamic Condition of Study Area Based on Field Measurements

The Caspian Sea is the largest landlocked water body in the globe and circulation patterns in the sea are largely controlled by wind forcing. With the analysis of wind and current data (comparison between Figure 4 and Figure 7), it was found that large similarities exist between current and wind rose. This is an indication that wind forcing is the main driving force for currents (as the tidal currents are negligible in the Caspian Sea). Both westward and eastward currents could result in alongshore sediment transport. However, because the eastward currents are stronger and more frequent, it is predictable that net sediment transport is eastward, too. Wave-induced currents could also result in an increased eastward current velocity in the coastal area (surf zone). The breakwaters of the port block the west to east net sediment transport. Therefore, accretion of sediments can occur on the western side of Nowshahr port whereas erosions happen on the eastern side.
Another sediment source which has received less attention rather than net west to east sediment River is the supply of sediment from rivers at the east of Nowshahr port. These riverine derived sources of sediment can provide enough material to be transported by westward currents towards the entrance channel and basin of the port. The effect of this sediment source will be later discussed more.
In the following section, the numerical model set-up will be described. This numerical model was used for detailed analysis of wave and current-induced sediment transport in areas adjacent to main and lee breakwaters and entrance of the port.

3. Description of Numerical Model and Main Parameters

In the present study, the DHI MIKE software was used to simulate the hydrodynamic parameters of the area. MIKE software package, which is funded and developed by the Danish Hydraulic Institute in collaboration with the Danish Water Quality Institute, has high computational and graphical capabilities in modeling estuaries, shallow coastal areas, bays, seas, etc. This software is a comprehensive system for modeling two-dimensional and three-dimensional free-surface flow in water bodies and it is a reliable and commonly used numerical simulator. It is capable of modeling instationary flow affected by wind, bed variations, etc.
DHI MIKE software package includes different modules to simulate different hydrodynamic phenomena in the water bodies. For example, The MIKE21-SW module is used for spectral phase averaged simulation of wind-generated waves. The 3 dimensional MIKE3-HD (Hydrodynamic) module is used to simulate the sea currents. This module simulates the flow pattern and water level variations affected by various forcing. In addition, the MIKE3-ST module is developed for the simulation of non-cohesive sediment transport. The water level variation (which is the HD module output) changes the water depth and therefore should be included in wave simulation. On the other hand, in order to simulate the current caused by wave breaking, the radiation stresses data of the waves should be included in the hydrodynamic simulation. The bed level variation (as a result of the ST module) also affects both wave and current. Hence, it would be favorable to perform simultaneous wave, flow, and sediment transport simulations with the direct interaction between these modules. Therefore, in this study, the coupled module of SW&HD&ST from MIKE software was used for numerical simulations.
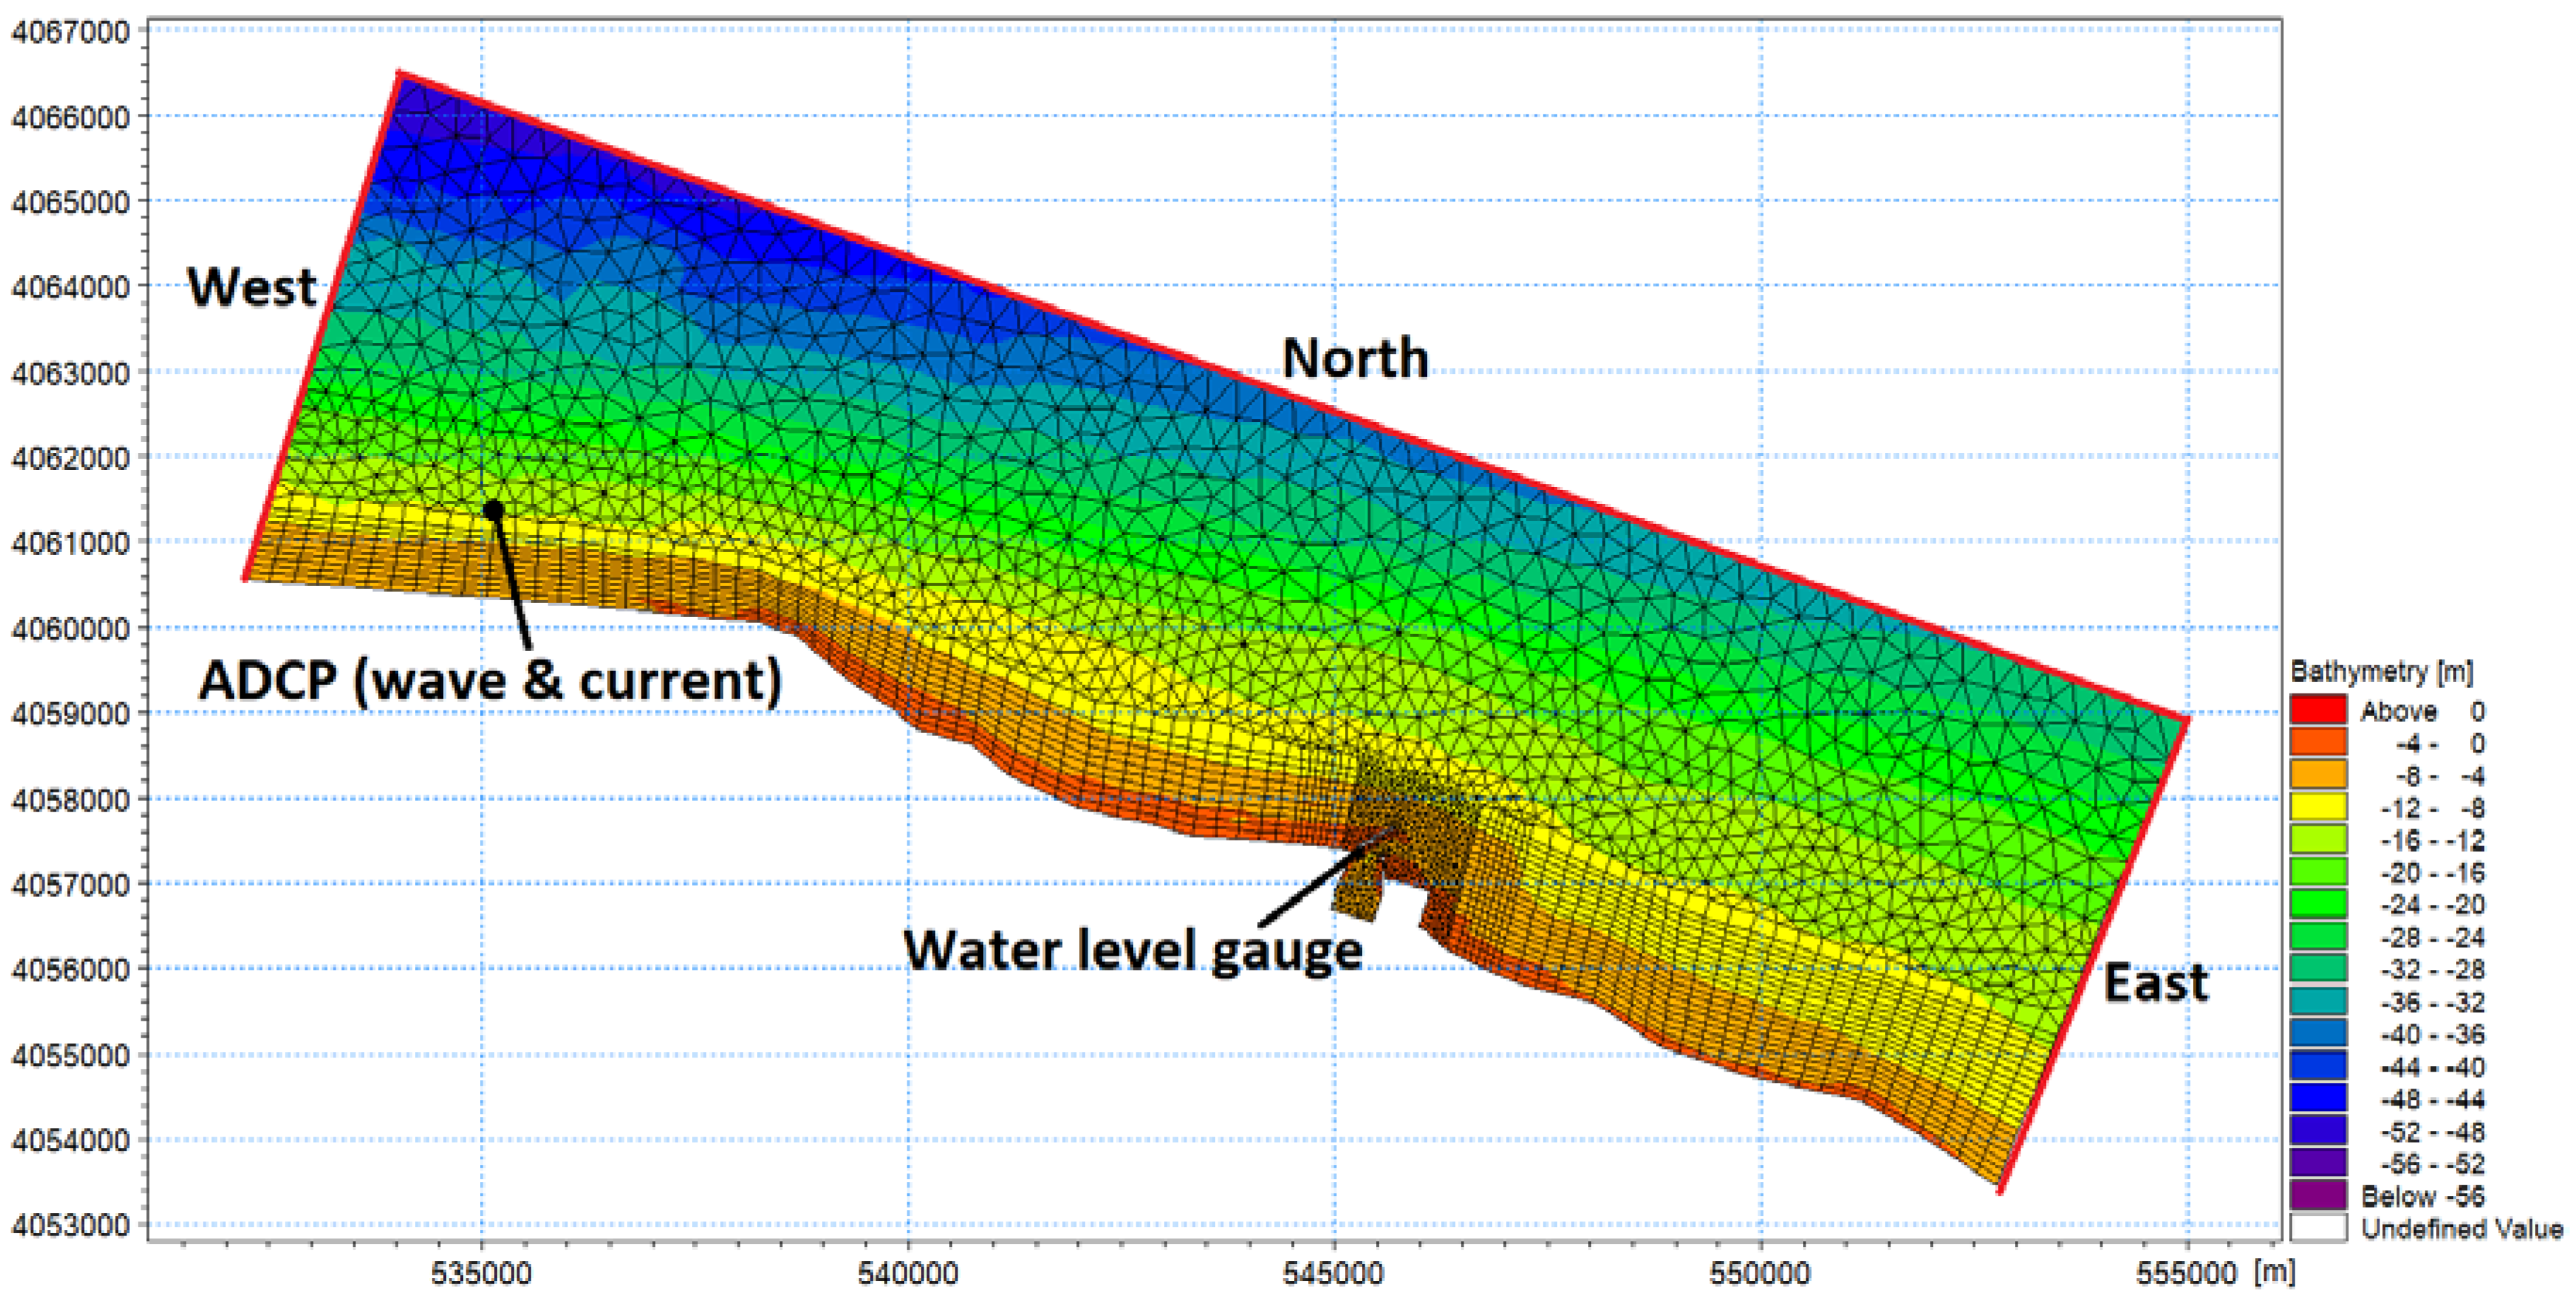
The computational domain of the model is shown in Figure 9. A combination of triangular and quadrangular grids was used in the domain with finer grid sizes around the Nowshahr port. The grid sizes varied from 50 to 500 m. There are 3 open boundaries in the domain: Northern, Eastern and Western open boundaries. For these boundaries, wave and current data were obtained from a large scale model covering the entire Caspian Sea. That model was conducted by the Port and Maritime Organization of Iran, and its result was available by the organization. For the sediment transport model, a zero gradient condition was applied in open boundaries. The model was executed for 1 year (2013) in the coupled mode. Atmospheric forcing was provided from the WRF model which has been applied in both current and wave models.

3.1. Sensitivity Analysis

In most of the numerical models, there are several parameters that the results of the model are dependent on them and the governing equations would be solved based on them. In the spectral wave models, various factors such as computational grid size, number of angular discretization, accuracy of numerical solution of the equations, wave breaking and bed roughness coefficients, white capping coefficients, etc., might affect the result. In the flow model, in addition to the computational grid size and the accuracy of numerical solution of the equations, bed resistance (roughness height) and eddy viscosity (the effect of diffusivity) also might affect the results.
In order to calibrate and validate the numerical models, at first the factors that the results of the model are sensitive to should be identified and then they should be properly and optimally tuned to draw the model results as close as possible to the actual measured values.
The results of sensitivity analysis on the parameters that could affect the MIKE21-SW spectral wave model results indicated that among the investigated parameters, the number of angular divisions of the spectrum, the solution technic, and shallow-water wave breaking had almost no effect on the outputs [
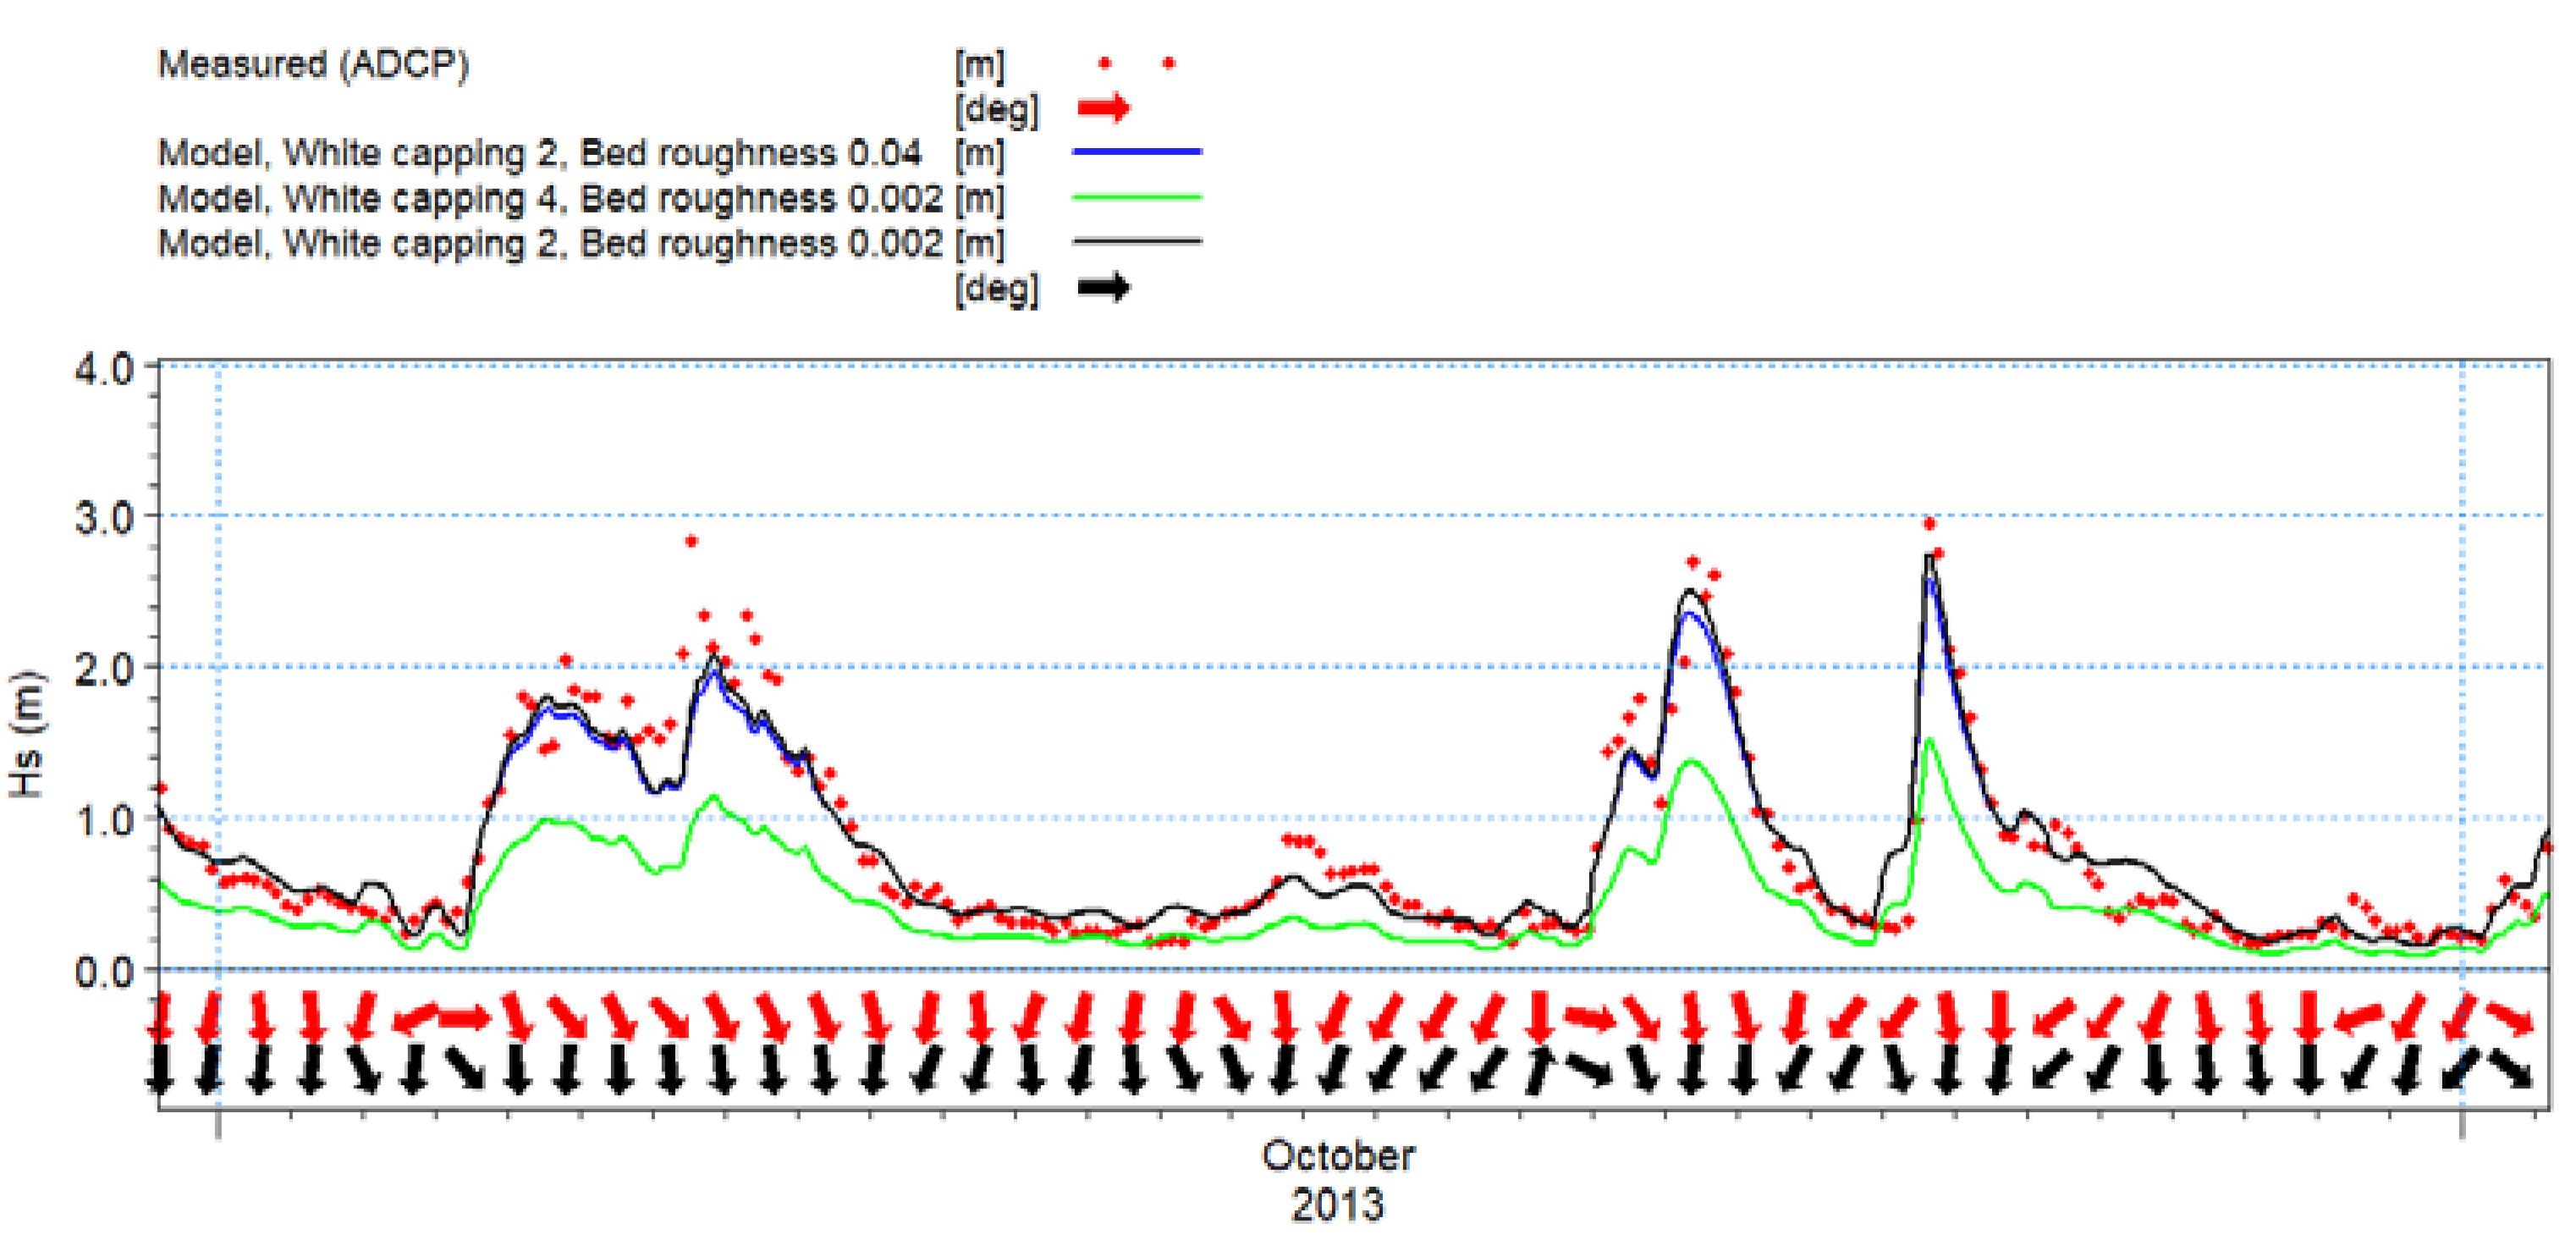
16]. Decreasing the size of the computational grid has a certain effect on the accuracy of the results and more than that, only increases the computational cost. This parameter is also not a calibration parameter and mesh dimensions must be optimally selected so that spatial discretization does not affect the results. The bed roughness and white capping coefficients also affect the results to some extent and can be used as the main parameters in the calibration process of the wave model. For the 3D flow model, bed resistance is the most effective parameter in the results. Full explanations about sensitivity analysis are not provided here for brevity. However, the result of model for two different bed roughness coefficients (0.002 and 0.04) and two different white capping coefficients (4 and 2) in the wave model are presented in 
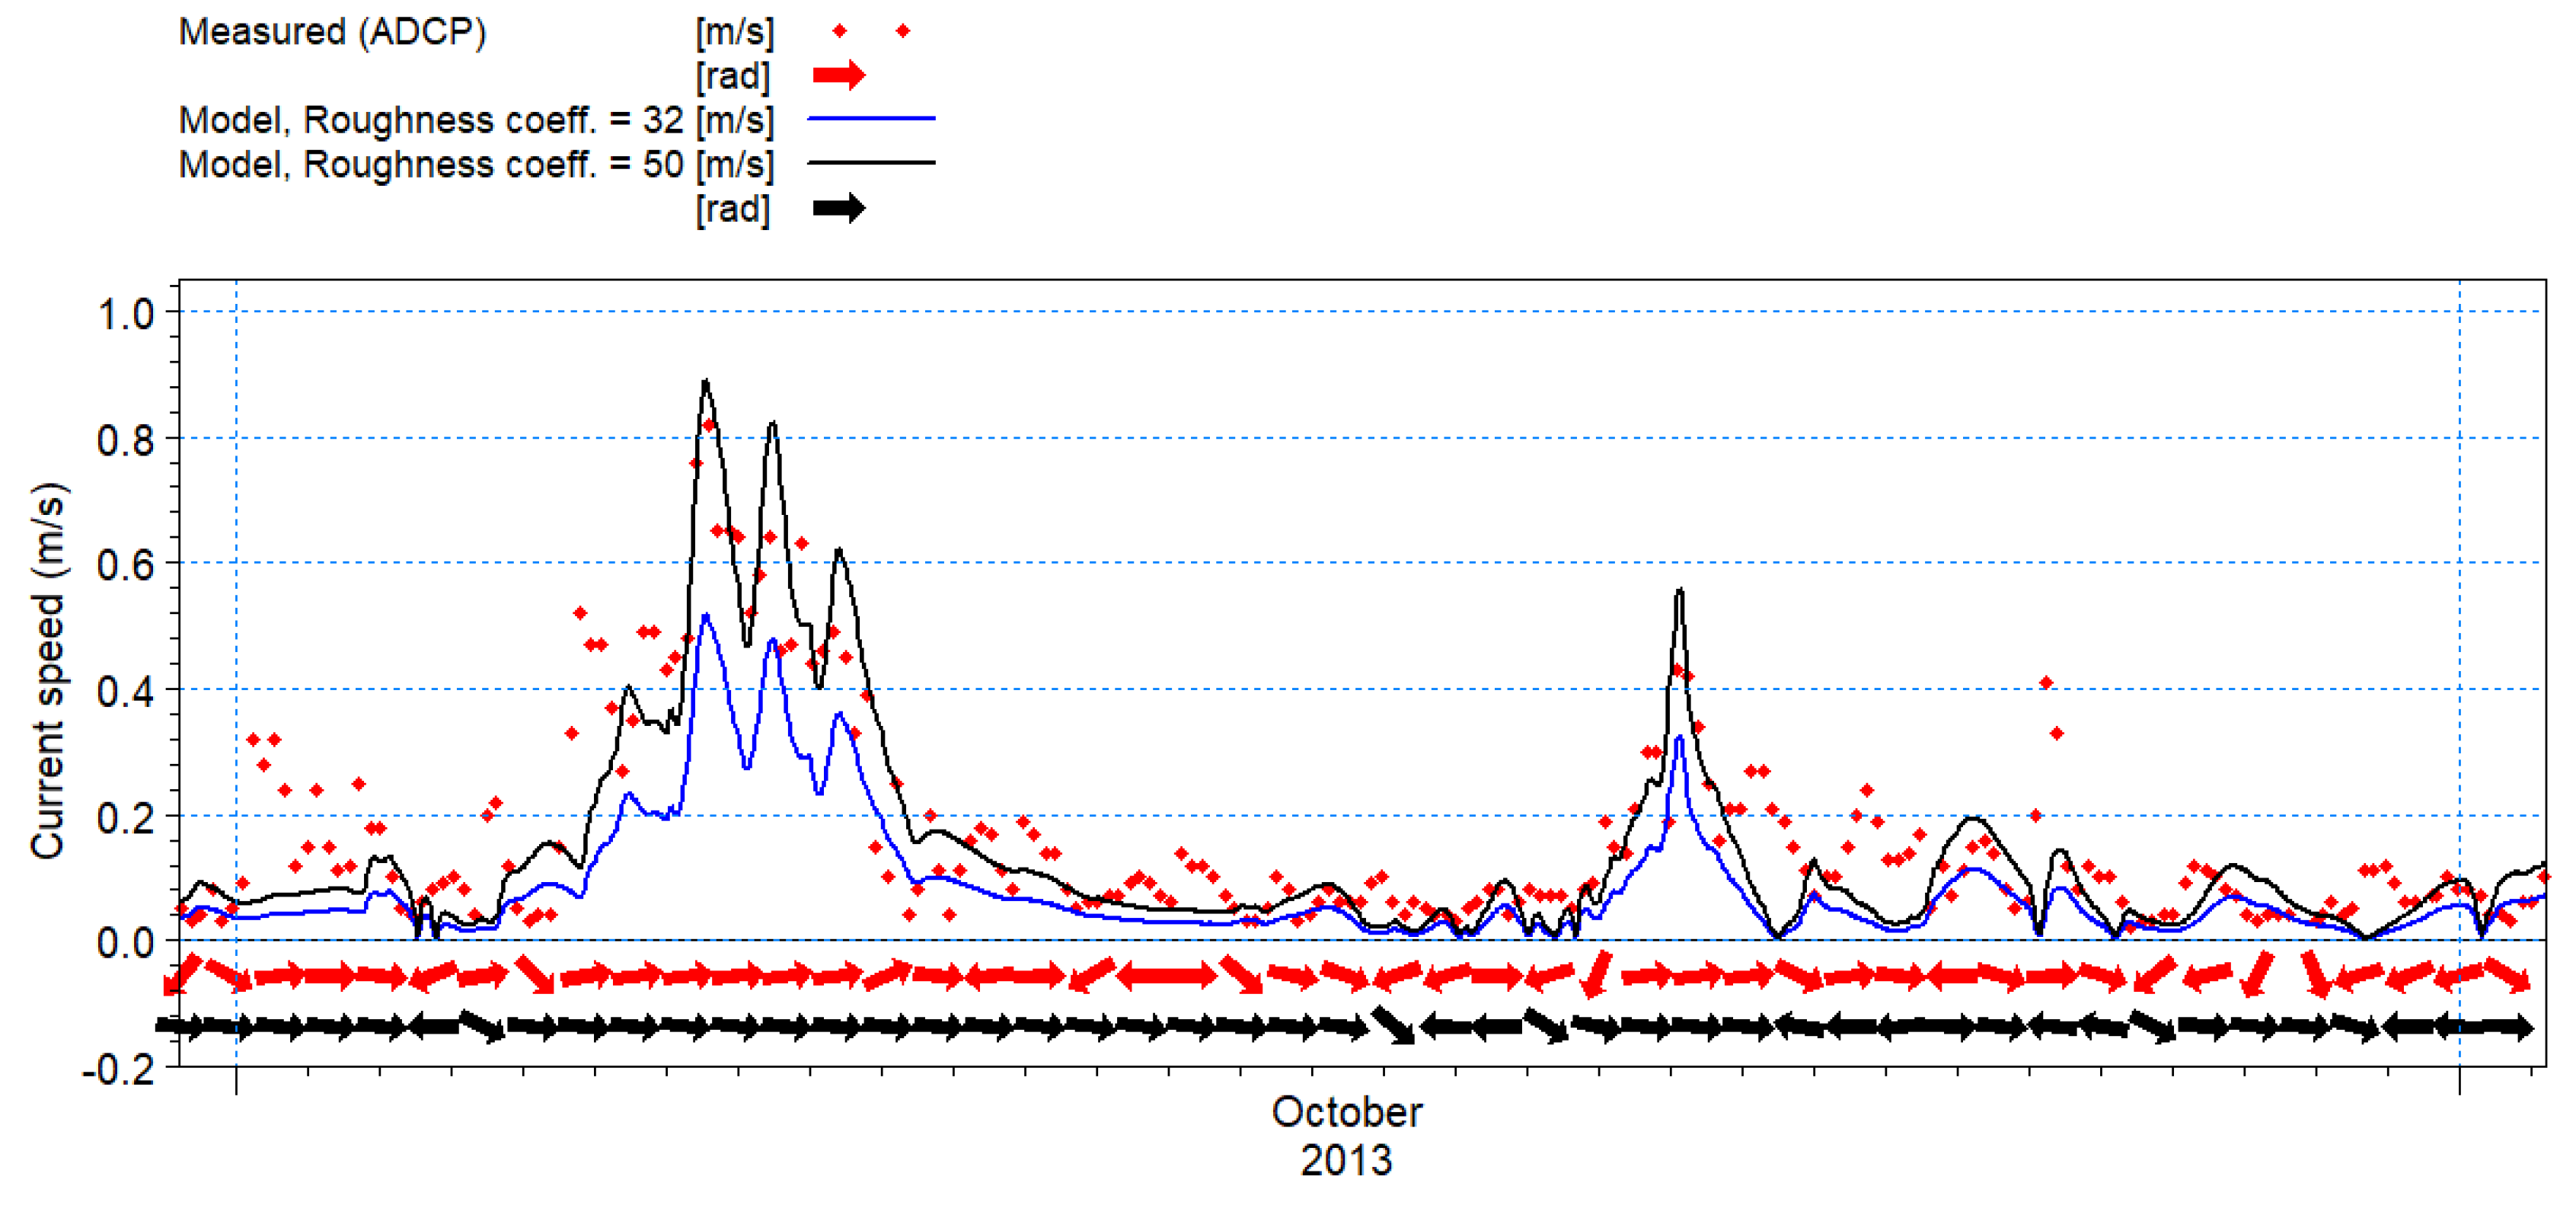
Figure 10. In addition, the model results for two different roughness height coefficients in the flow model (50 and 32) are also presented in Figure 11. The effectiveness of these coefficients on the model results can be clearly seen in these figures.

3.2. Model Calibration

After the initial setup of the model and also sensitivity analysis and identifying effective parameters on the results for the calibration, the calibration and verification of the models are performed based on the Nowshahr ADCP and water level gauge measurements (locations of the measurements are shown in Figure 9).
In this section, results of the comparison between model results and field measurements are presented. Several physical parameters such as wave height, current speed, and sea level variations were used in this analysis.
Figure 10 shows the results of comparison between modeled and measured wave height and direction for October (as a sample month). As seen in the Figure, there are three distinct storm peaks with wave heights greater than 1 m in this period. The model results (black line) have captured all of these three storm events with a rather good accuracy. There is a high correlation between model results and measurements of both wave height and direction (the quantitative value of correlation is presented in Table 1). Therefore, the model seems to be reliable in the simulation of wave regime in the study area. However, the model results have generally under-predicted maximum wave heights that occur during storm periods. This could be related to the accuracy of WRF wind forcing (which also provided by an atmospheric numerical model).
In order to statistically evaluate the model performance, various parameters such as model skill, correlation coefficient, bias parameter, root mean square error and index of dispersion (SI) were selected. These parameters are defined as:
M o d e l   S k i l l = 1 ( X p X m ) 2 ( | X p X m ¯ | + | X m X m ¯ | ) 2
S I = 1 N i = 1 N ( X p X m ) 2 X m ¯
R = ( X p X p ¯ ) ( X m X m ¯ ) ( X p X p ¯ ) 2 ( X m X m ¯ ) 2
B I A S = 1 N ( X p X m )
R M S E = 1 N ( X p X m ) 2
where N represents the number of records, Xp is the predicted value and Xm is the measured value. Also, X m ¯ and X p ¯ represent the mean of measured and predicted values, respectively. In Table 1, the values of these statistical parameters that were obtained from the comparison between model results and measurements of wave height in October 2013 are presented. As evident from this table, the model performance is considered satisfactory and the results could be used for advancement of purposes of this study.
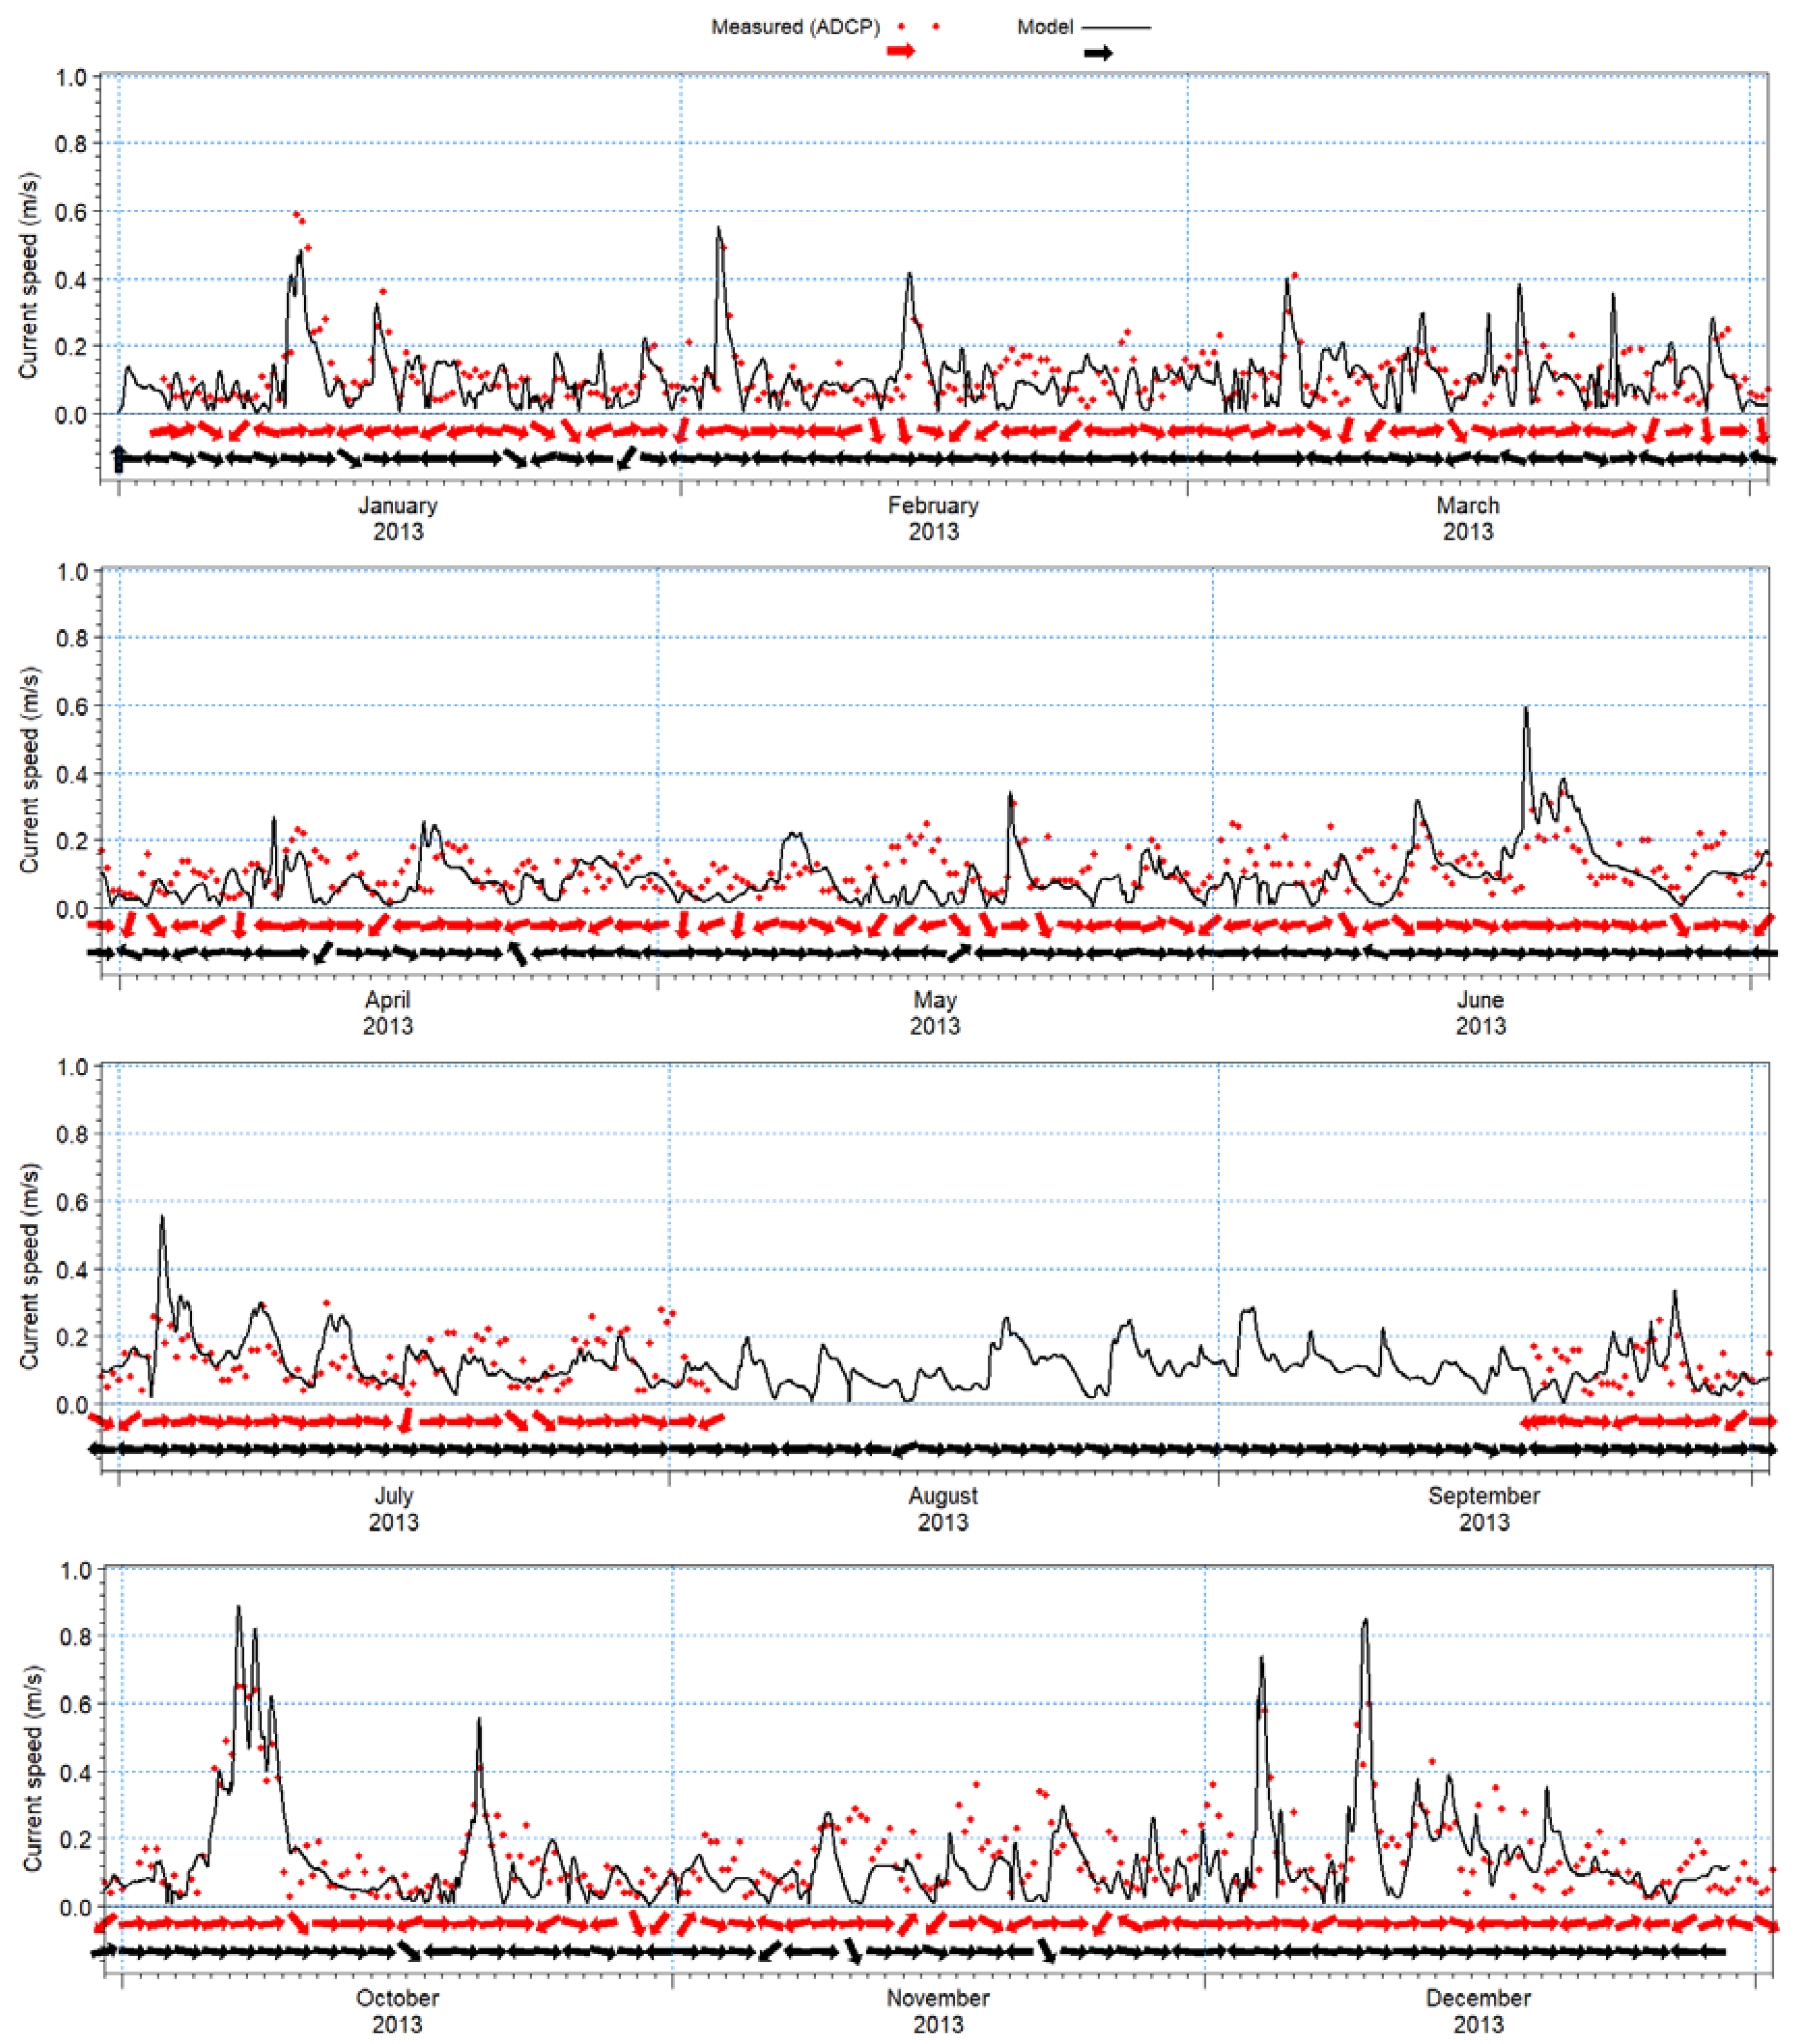
A similar comparison was made for the evaluation of HD module. Comparison of modeled and observed current velocities and directions in October 2013 (as a sample month) is shown in Figure 11. The model results of current velocity generally follow the same pattern as observations. The same agreement could be seen between model results and observations for the current direction. For example, the model has captured a single event with strong eastward currents that peaked on 8th October with velocities reaching 0.9 ms−1. The overall agreement between model output and available observations is quite well. Table 2 presents various statistical parameters that were obtained from a comparison between modeled and measured current speeds. The comparison of Table 1 and Table 2 values indicate a less accurate performance of current simulation results compared with wave height modeling results. However, the values of Table 2 indicate the satisfactory performance of model to assess sediment transport patterns around the Nowshahr port.
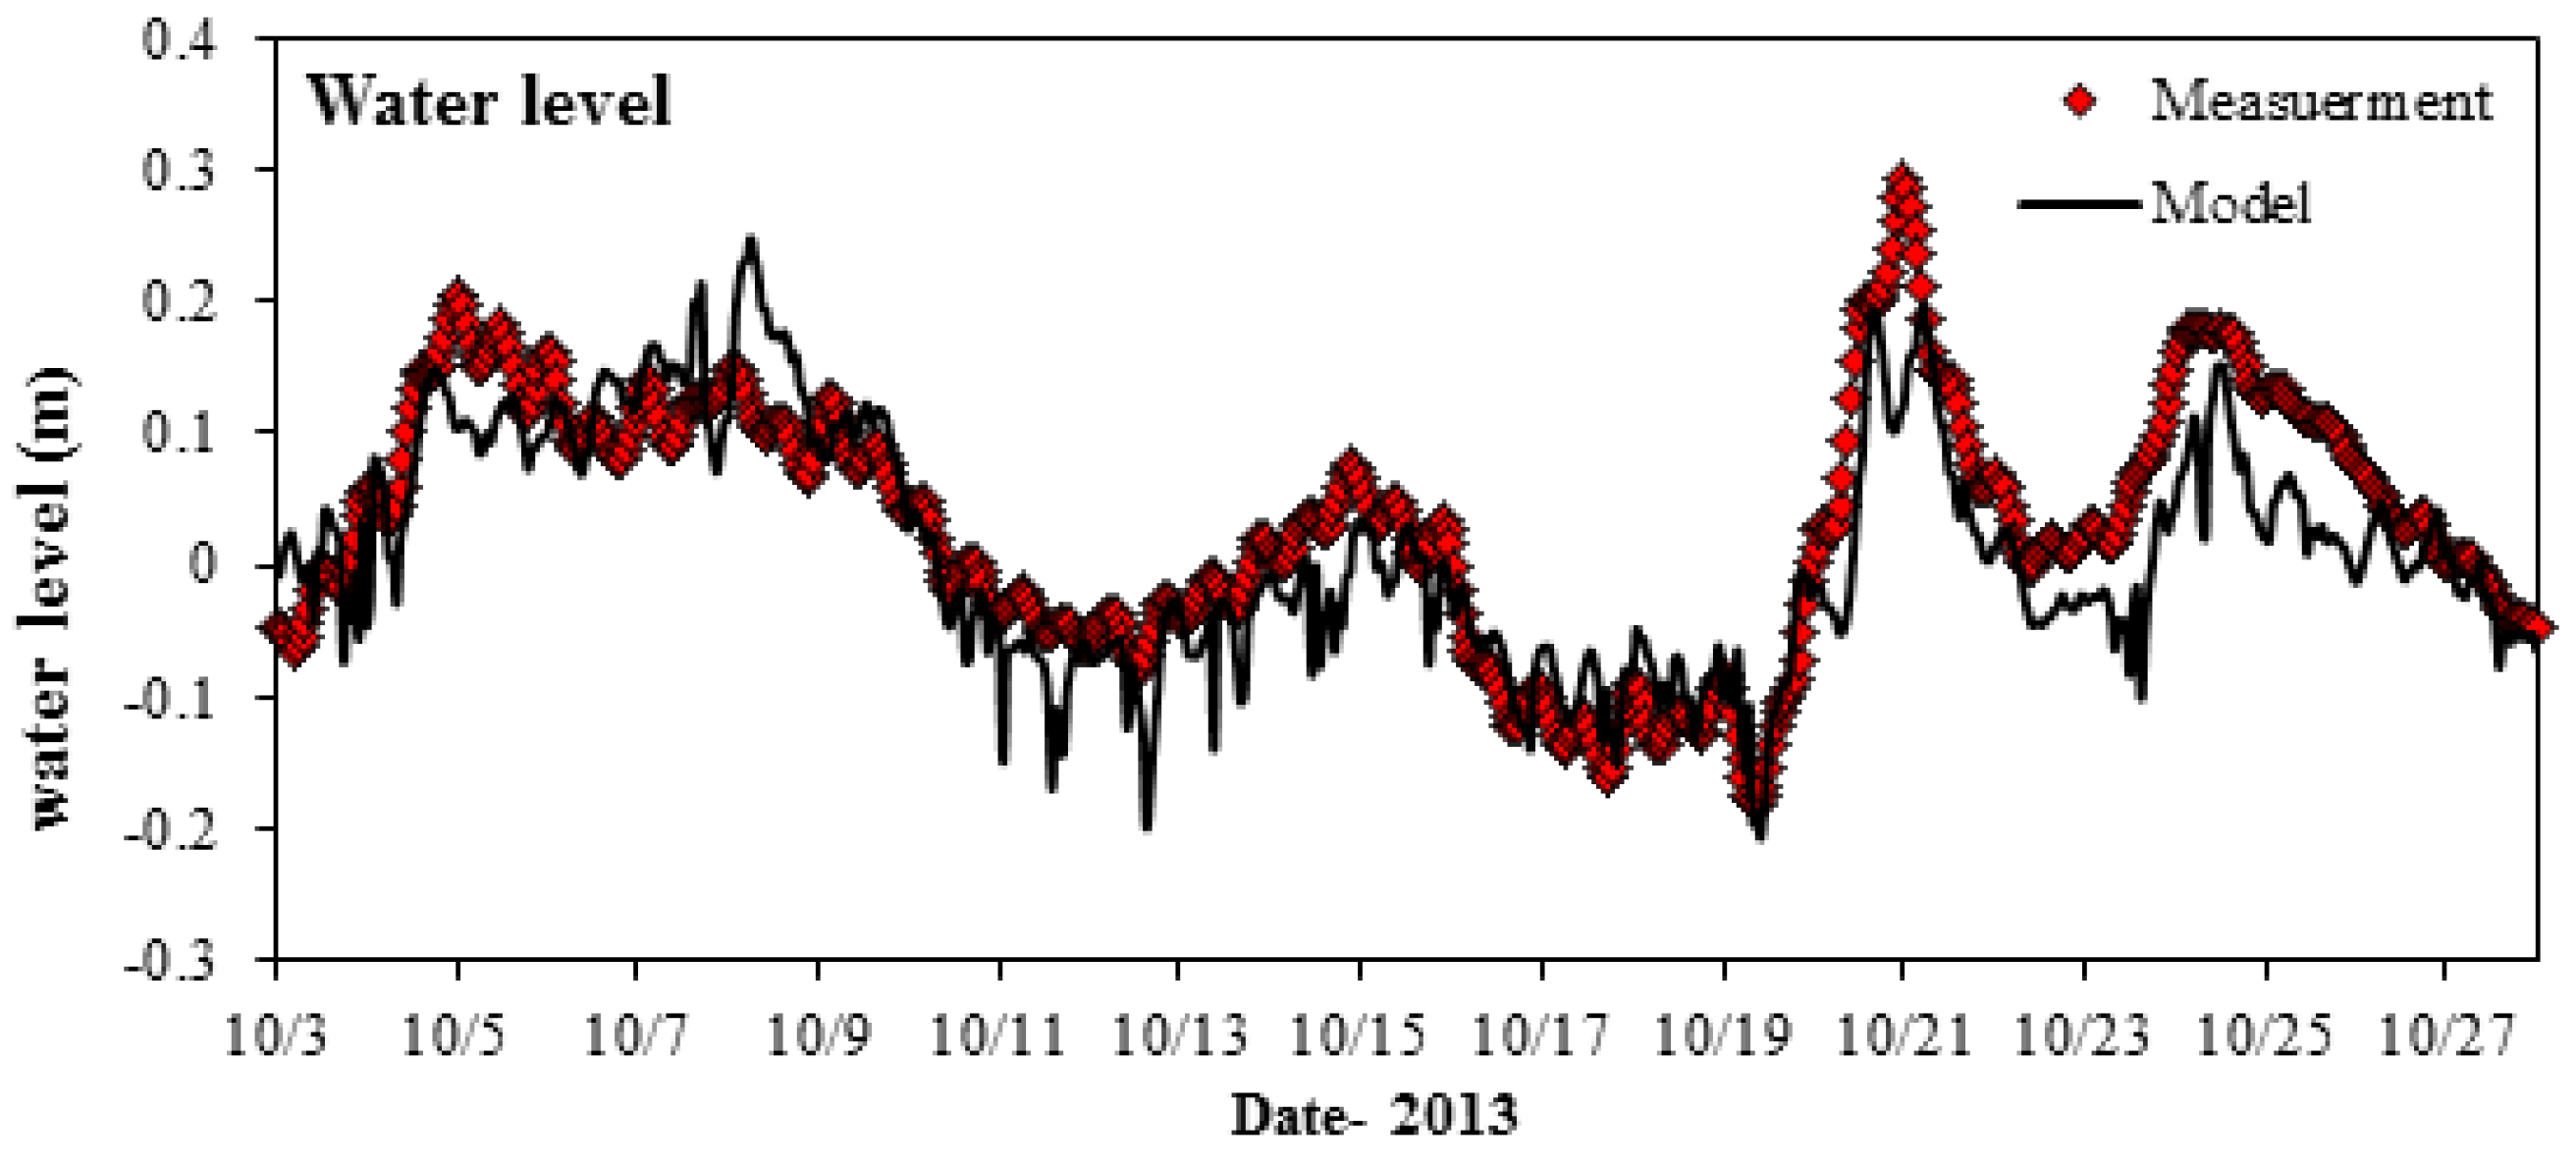
In addition to the wave and currents, comparison of surface water level variations between measured and modeled values is presented in Figure 12. There is again a good agreement between model results and measured values. A storm surge of up to 30 cm is observed during storm periods. The model has correctly captured low-frequency variations of water level under wind force.
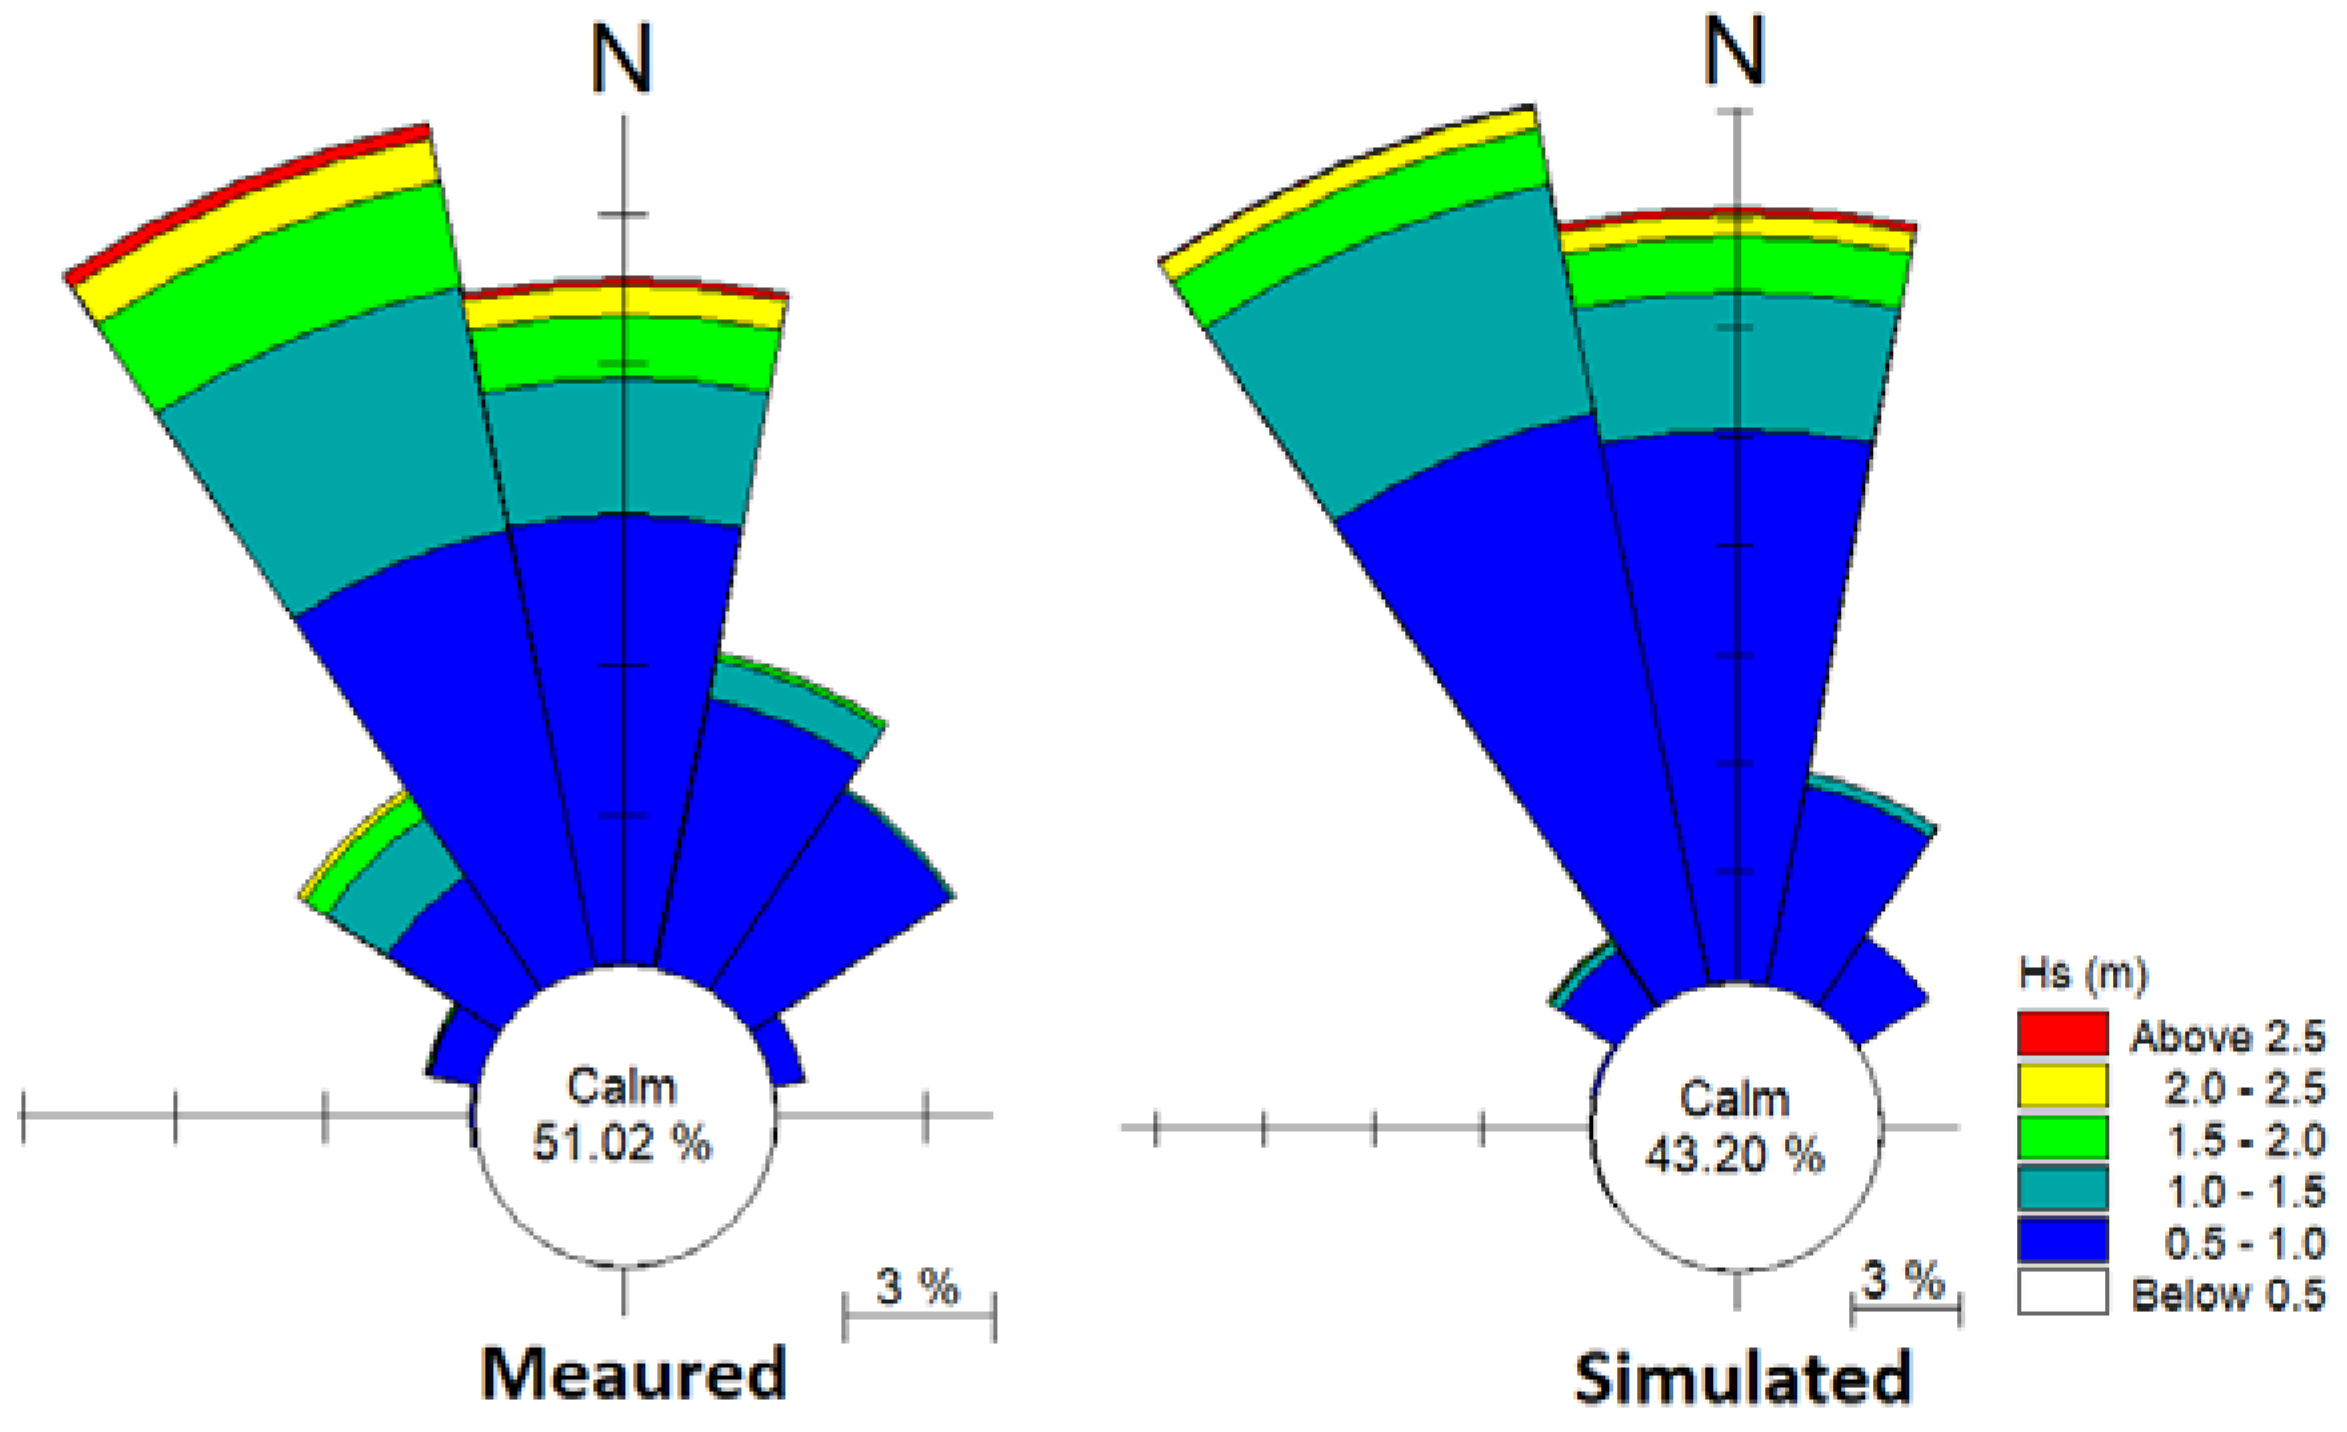
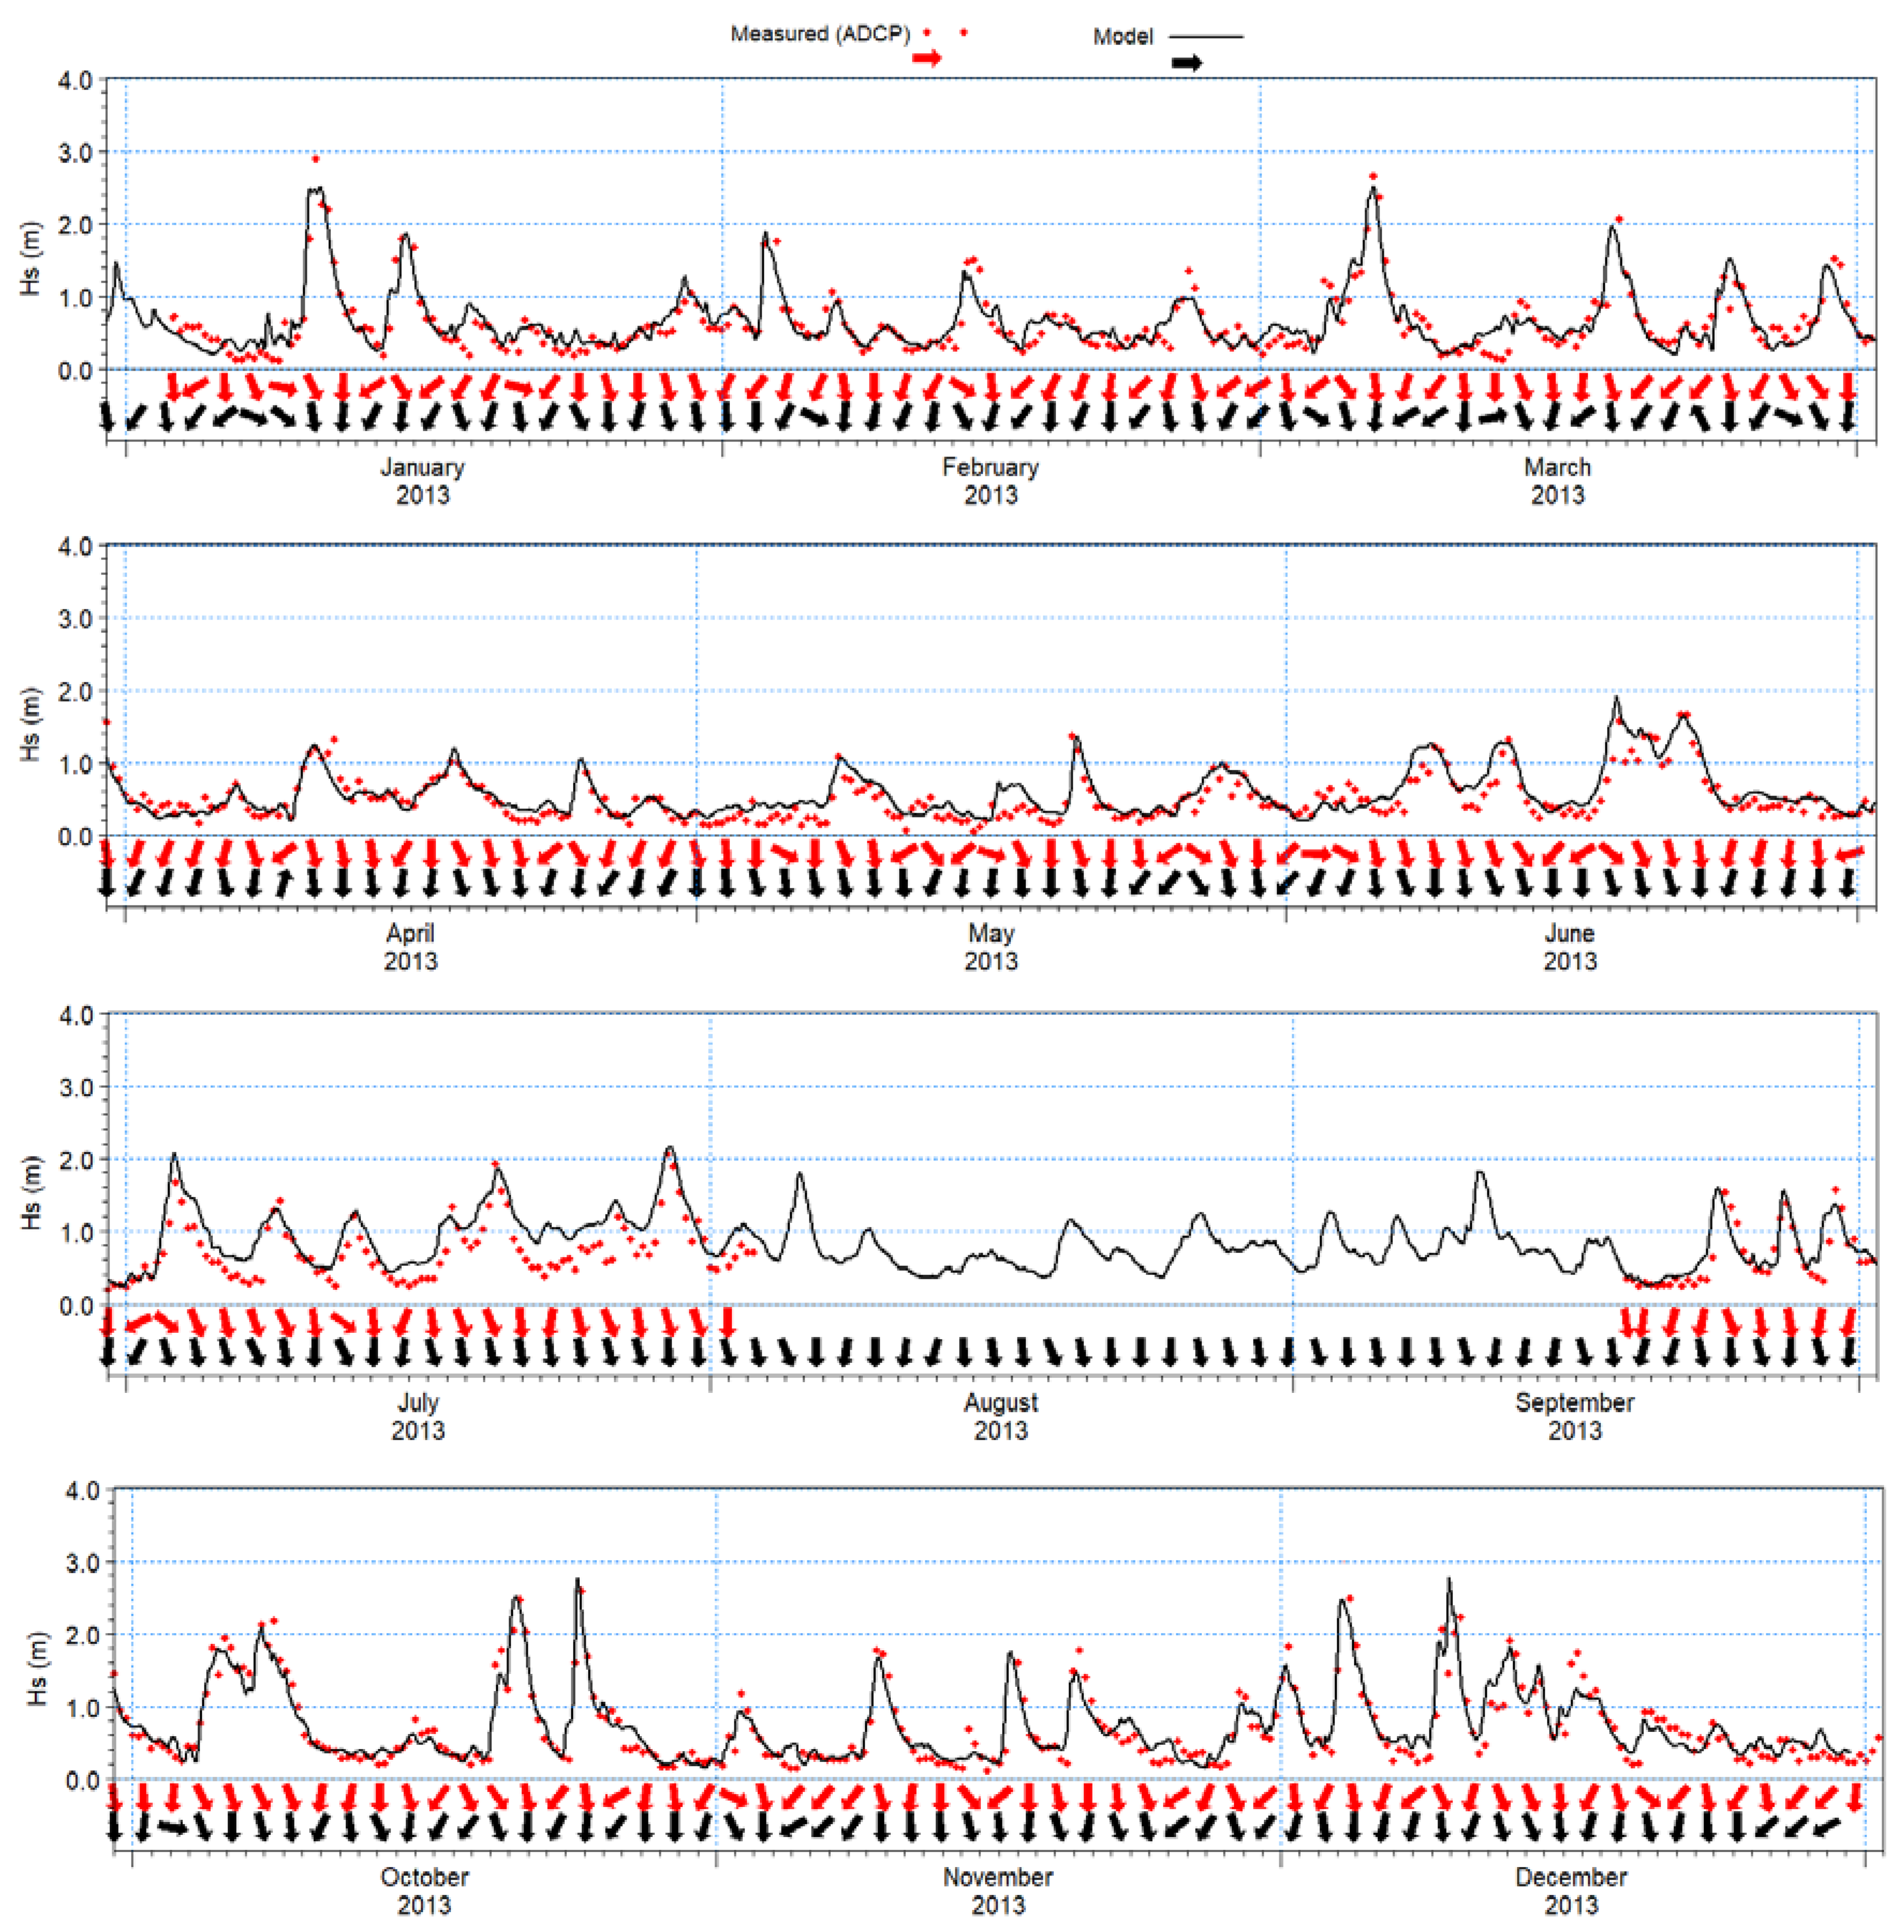
For validation of the model, the comparison of measured and simulated wave height in 2013 is shown in Figure 13. In addition, in Figure 14, annual wave roses are compared based on model results observed values of waves. Both of these figures indicate good performance of the model in capturing important high sea waves during storms. Also, there is a remarkable similarity between annual wave roses as shown in Figure 14 which indicates the high accuracy of the model in the simulation of wave direction.
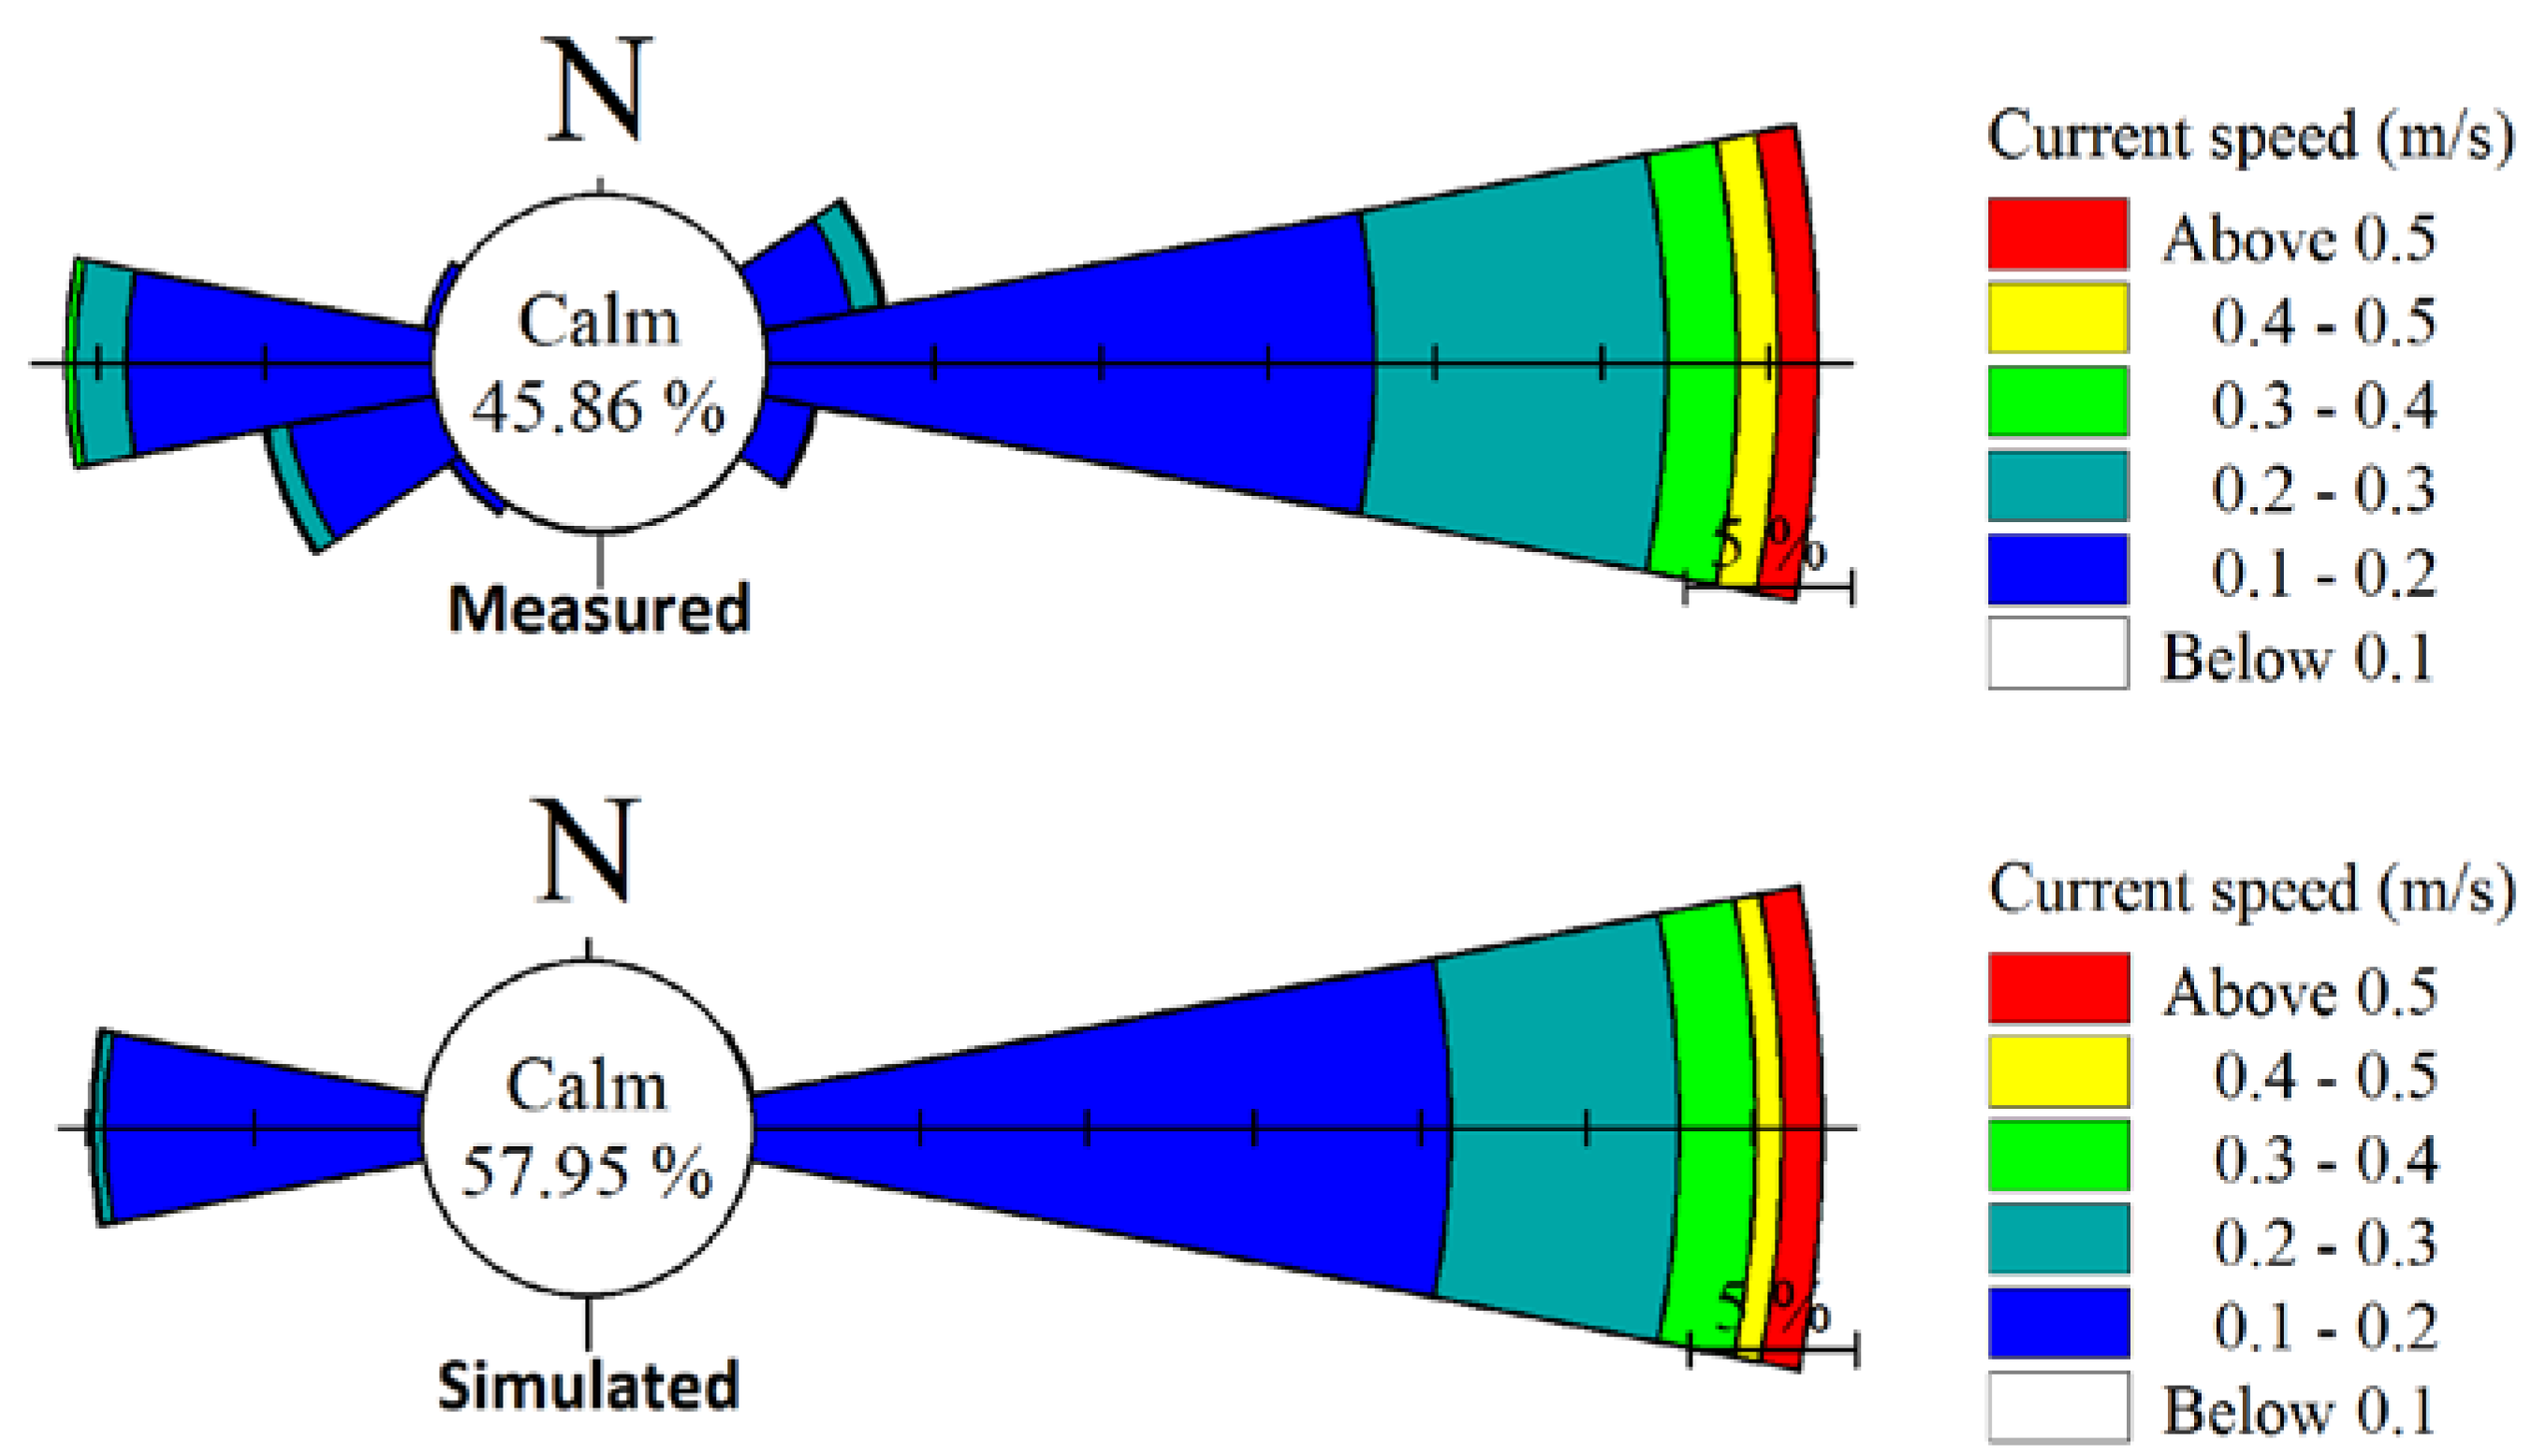
A similar comparison was made between simulated current speed and direction and measured values. These results are shown in Figure 15 and Figure 16. In 
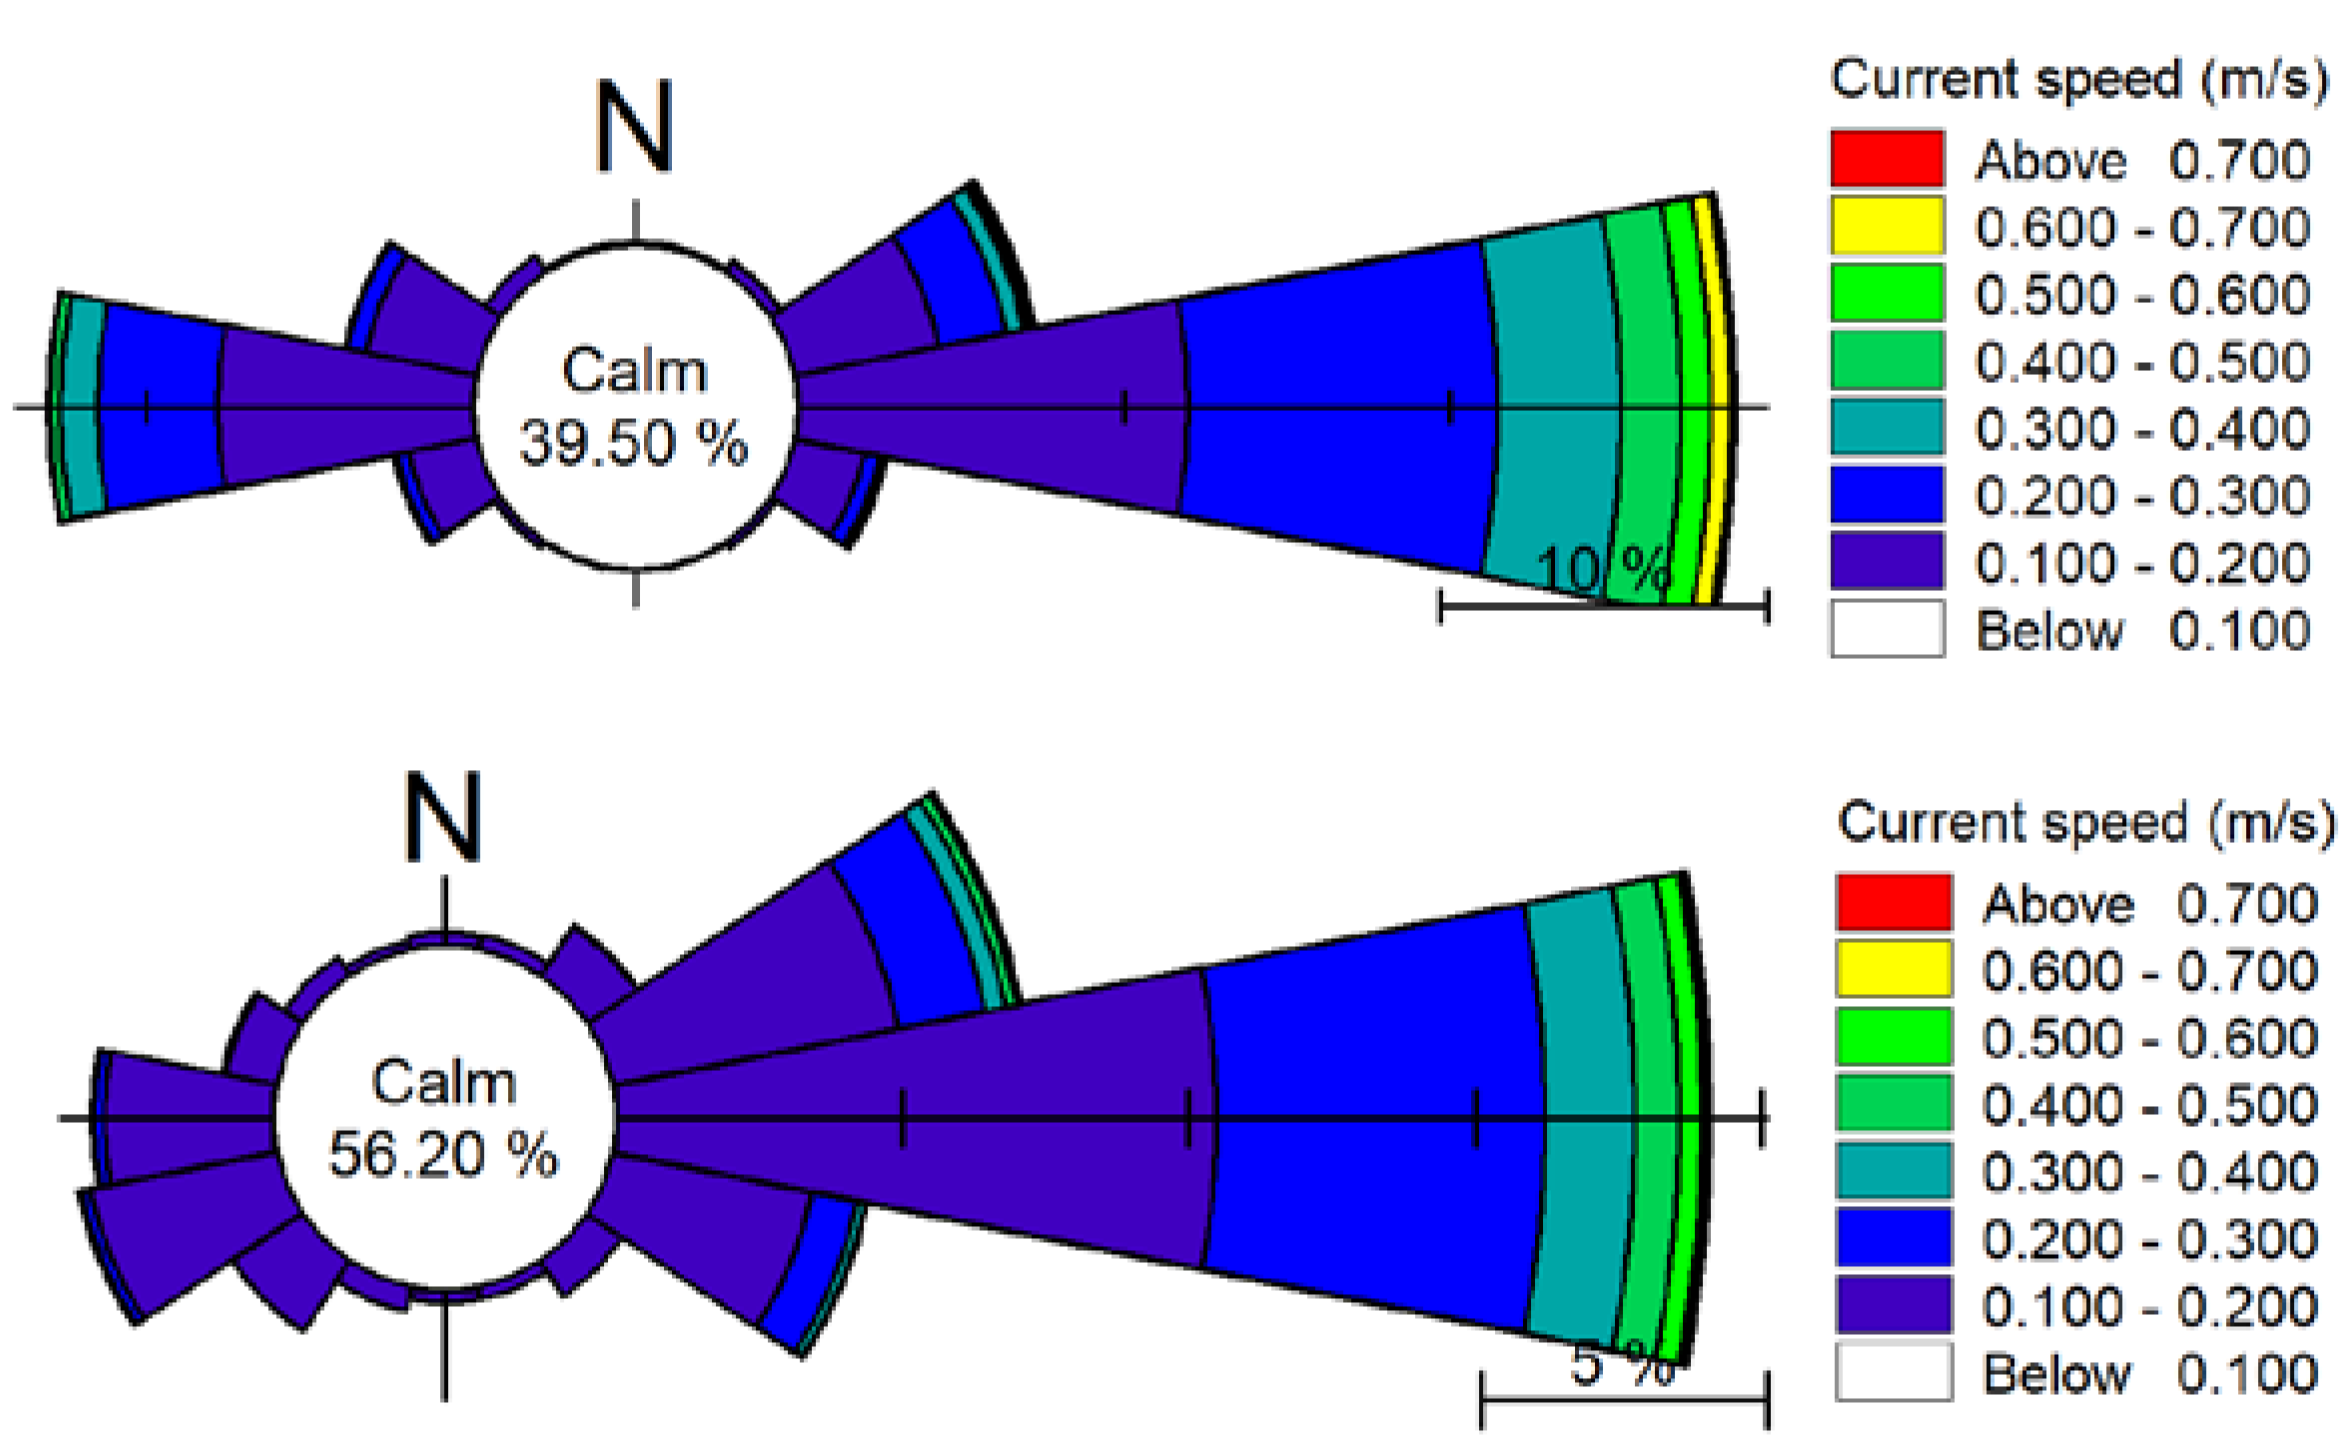
Figure 15, a time series of current speed and direction from model results and measured values is shown for 2013. In addition in Figure 16, the annual current roses that were obtained from model results and field measurements are shown. As can be seen from these figures, the model has shown good performance in simulating current speed and direction, particularly during storm events. However, there is a slight discrepancy between model results and observations during calm conditions when the current speed is less than 0.2 ms−1. Based on the comparison of wave roses, the model has indicated good performance in simulating the current direction, too.
Following proper calibration and validation of model results, the coupled model was forced for 2013. In Table 3, a list of main parameters and their value used in final simulations is presented.

4. Results and Discussion

In this section, the simulation results of hydrodynamic parameters and their impact on sediment transport patterns will be presented. As mentioned based on the measurements, the dominant current direction is eastward (from west to east). As seen in Figure 16, about 70% of currents (with the speed higher than 0.1 m/s) have an eastward direction, while about 30% of them are westward. The currents are highly correlated with local wind speed and direction (Figure 4 and Figure 7). Figure 17 presents three-hourly maps of the wind field in the southern parts of the Caspian Sea for more than 1 day during a typical storm event. These storm events occur frequently throughout the year. The largely similar feature among these storms is that they initially approach southern parts of the Caspian Sea as northerly winds. However, with the interaction of these large-scale wind events with Alborz mountainous in the north of Iran, the winds deflect and form two dominant directions almost parallel to the coastline: westerlies that blow eastward (known as Dasht-Bad, Figure 17) and easterlies that blow westward (known as Gil-Bad) [22]. These winds generate wind driven sea currents along the southern coasts of the Caspian Sea.
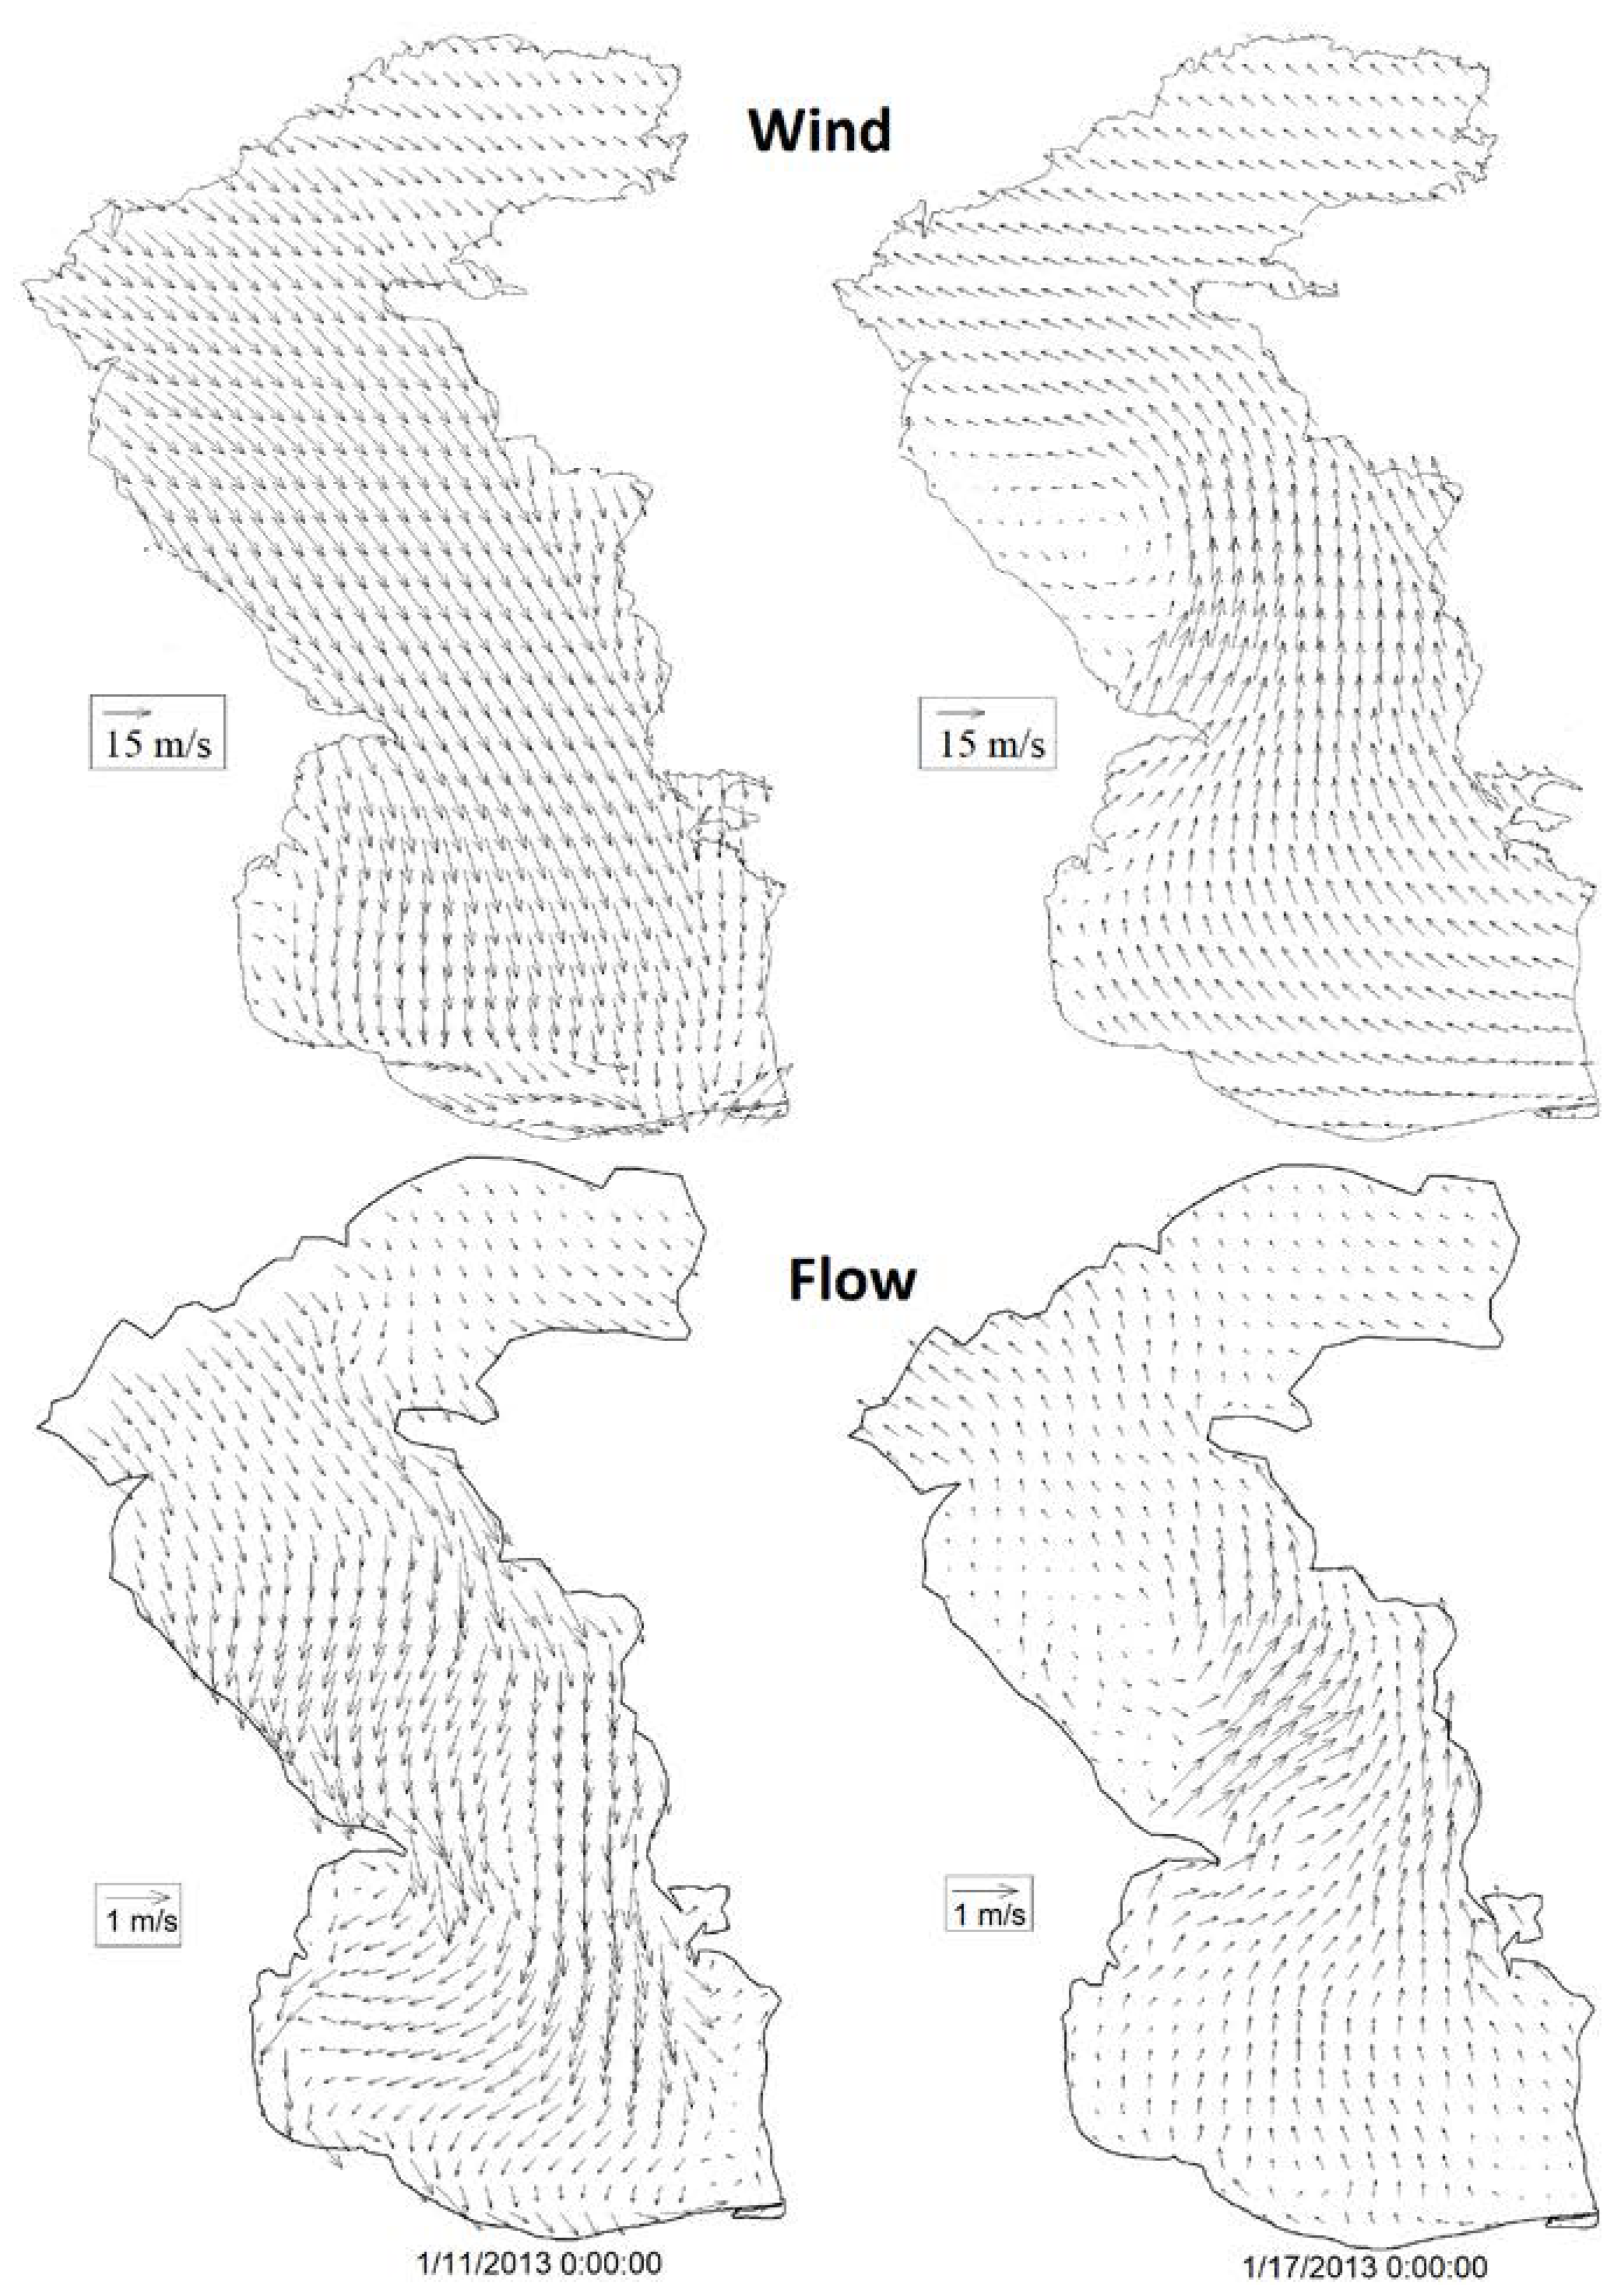
Figure 18 presents a comparison of the surface current field obtained from the HD model and wind field obtained from WRF model during two distinct storm events. In the southern parts of Caspian Sea, a good agreement could be observed between directions of surface currents and wind during storm events (Figure 18). The same agreement could be observed in other areas of Caspian Sea. This is an indication that surface currents were largely affected by surface stresses imparted by atmospheric wind forcing. Therefore, dominant current directions along the southern coastline of Caspian Sea are eastward and westward, as would be predicted by dominant direction of winds. As the west to east winds (same as the one that is shown in Figure 17) are stronger and more frequent, the dominant current and sediment transport is also eastward. However, there are also weaker less frequent westward wind which could be important for driving westward currents that transport eastern riverine sediments to the port entrance.
Following an investigation of large-scale dynamics of surface currents in Caspian Sea, a more local study was carried out in order to gain insight into relationship between surface currents and winds around the Nowshahr port.
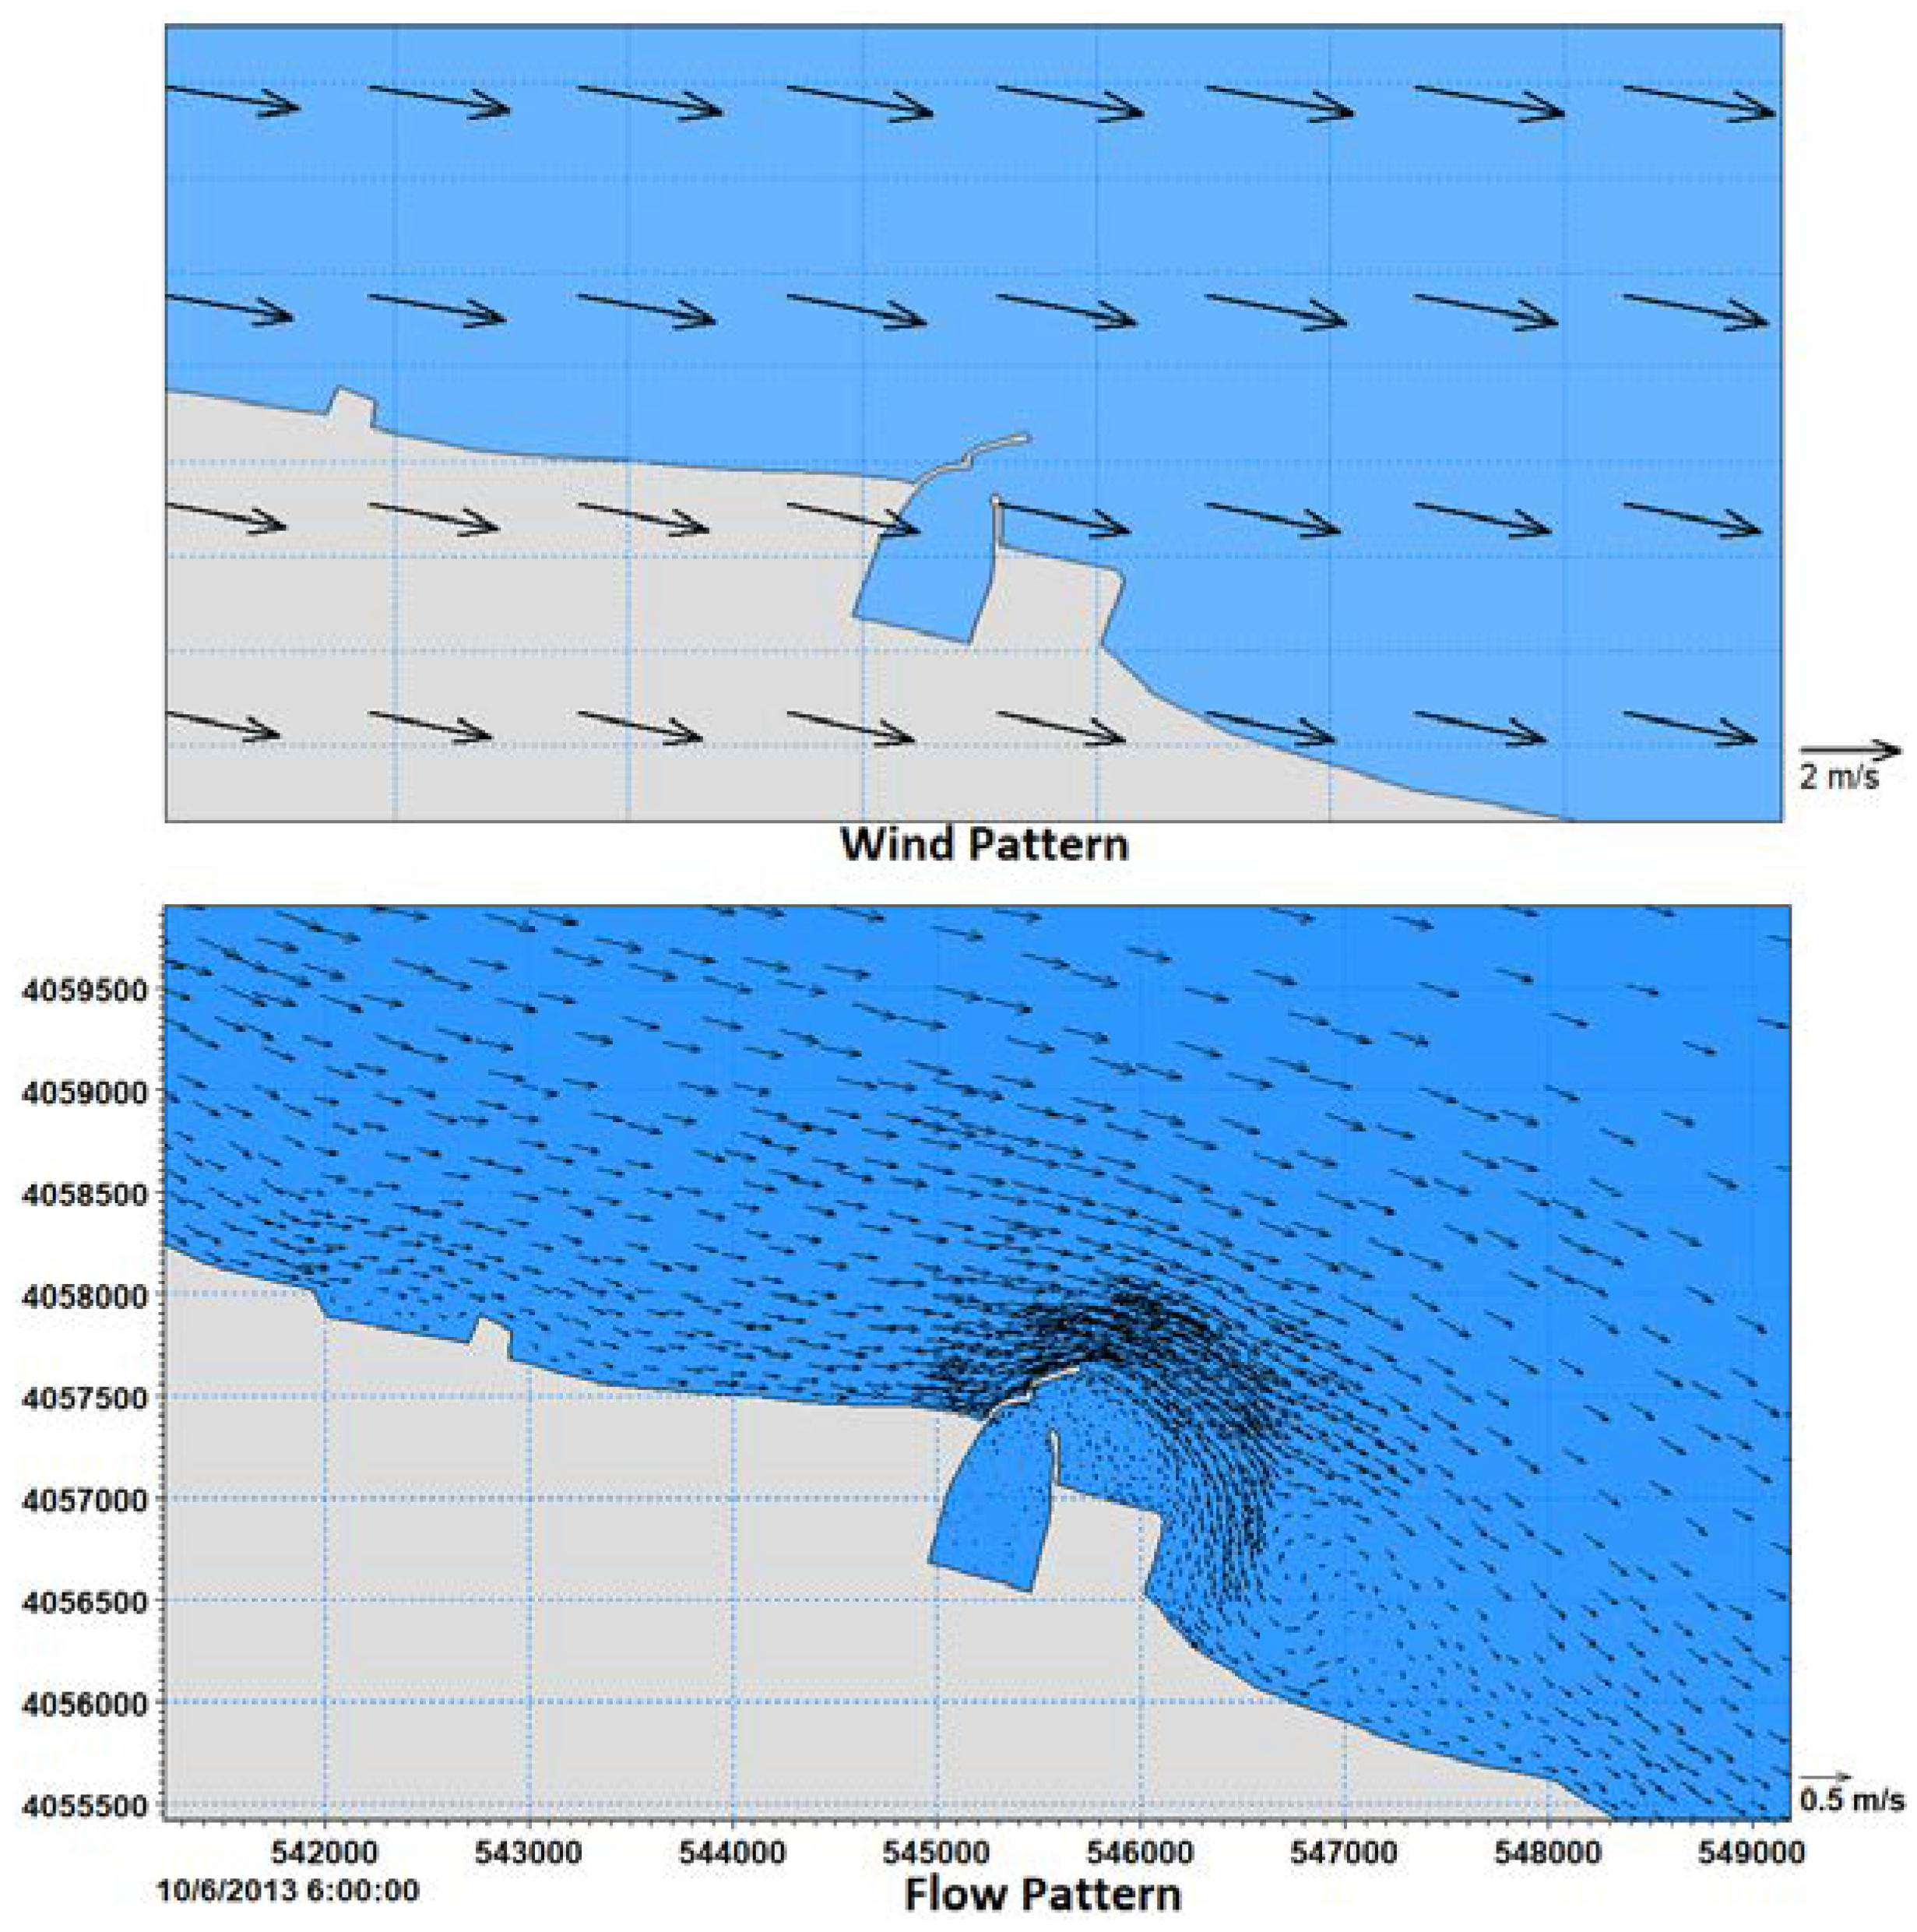
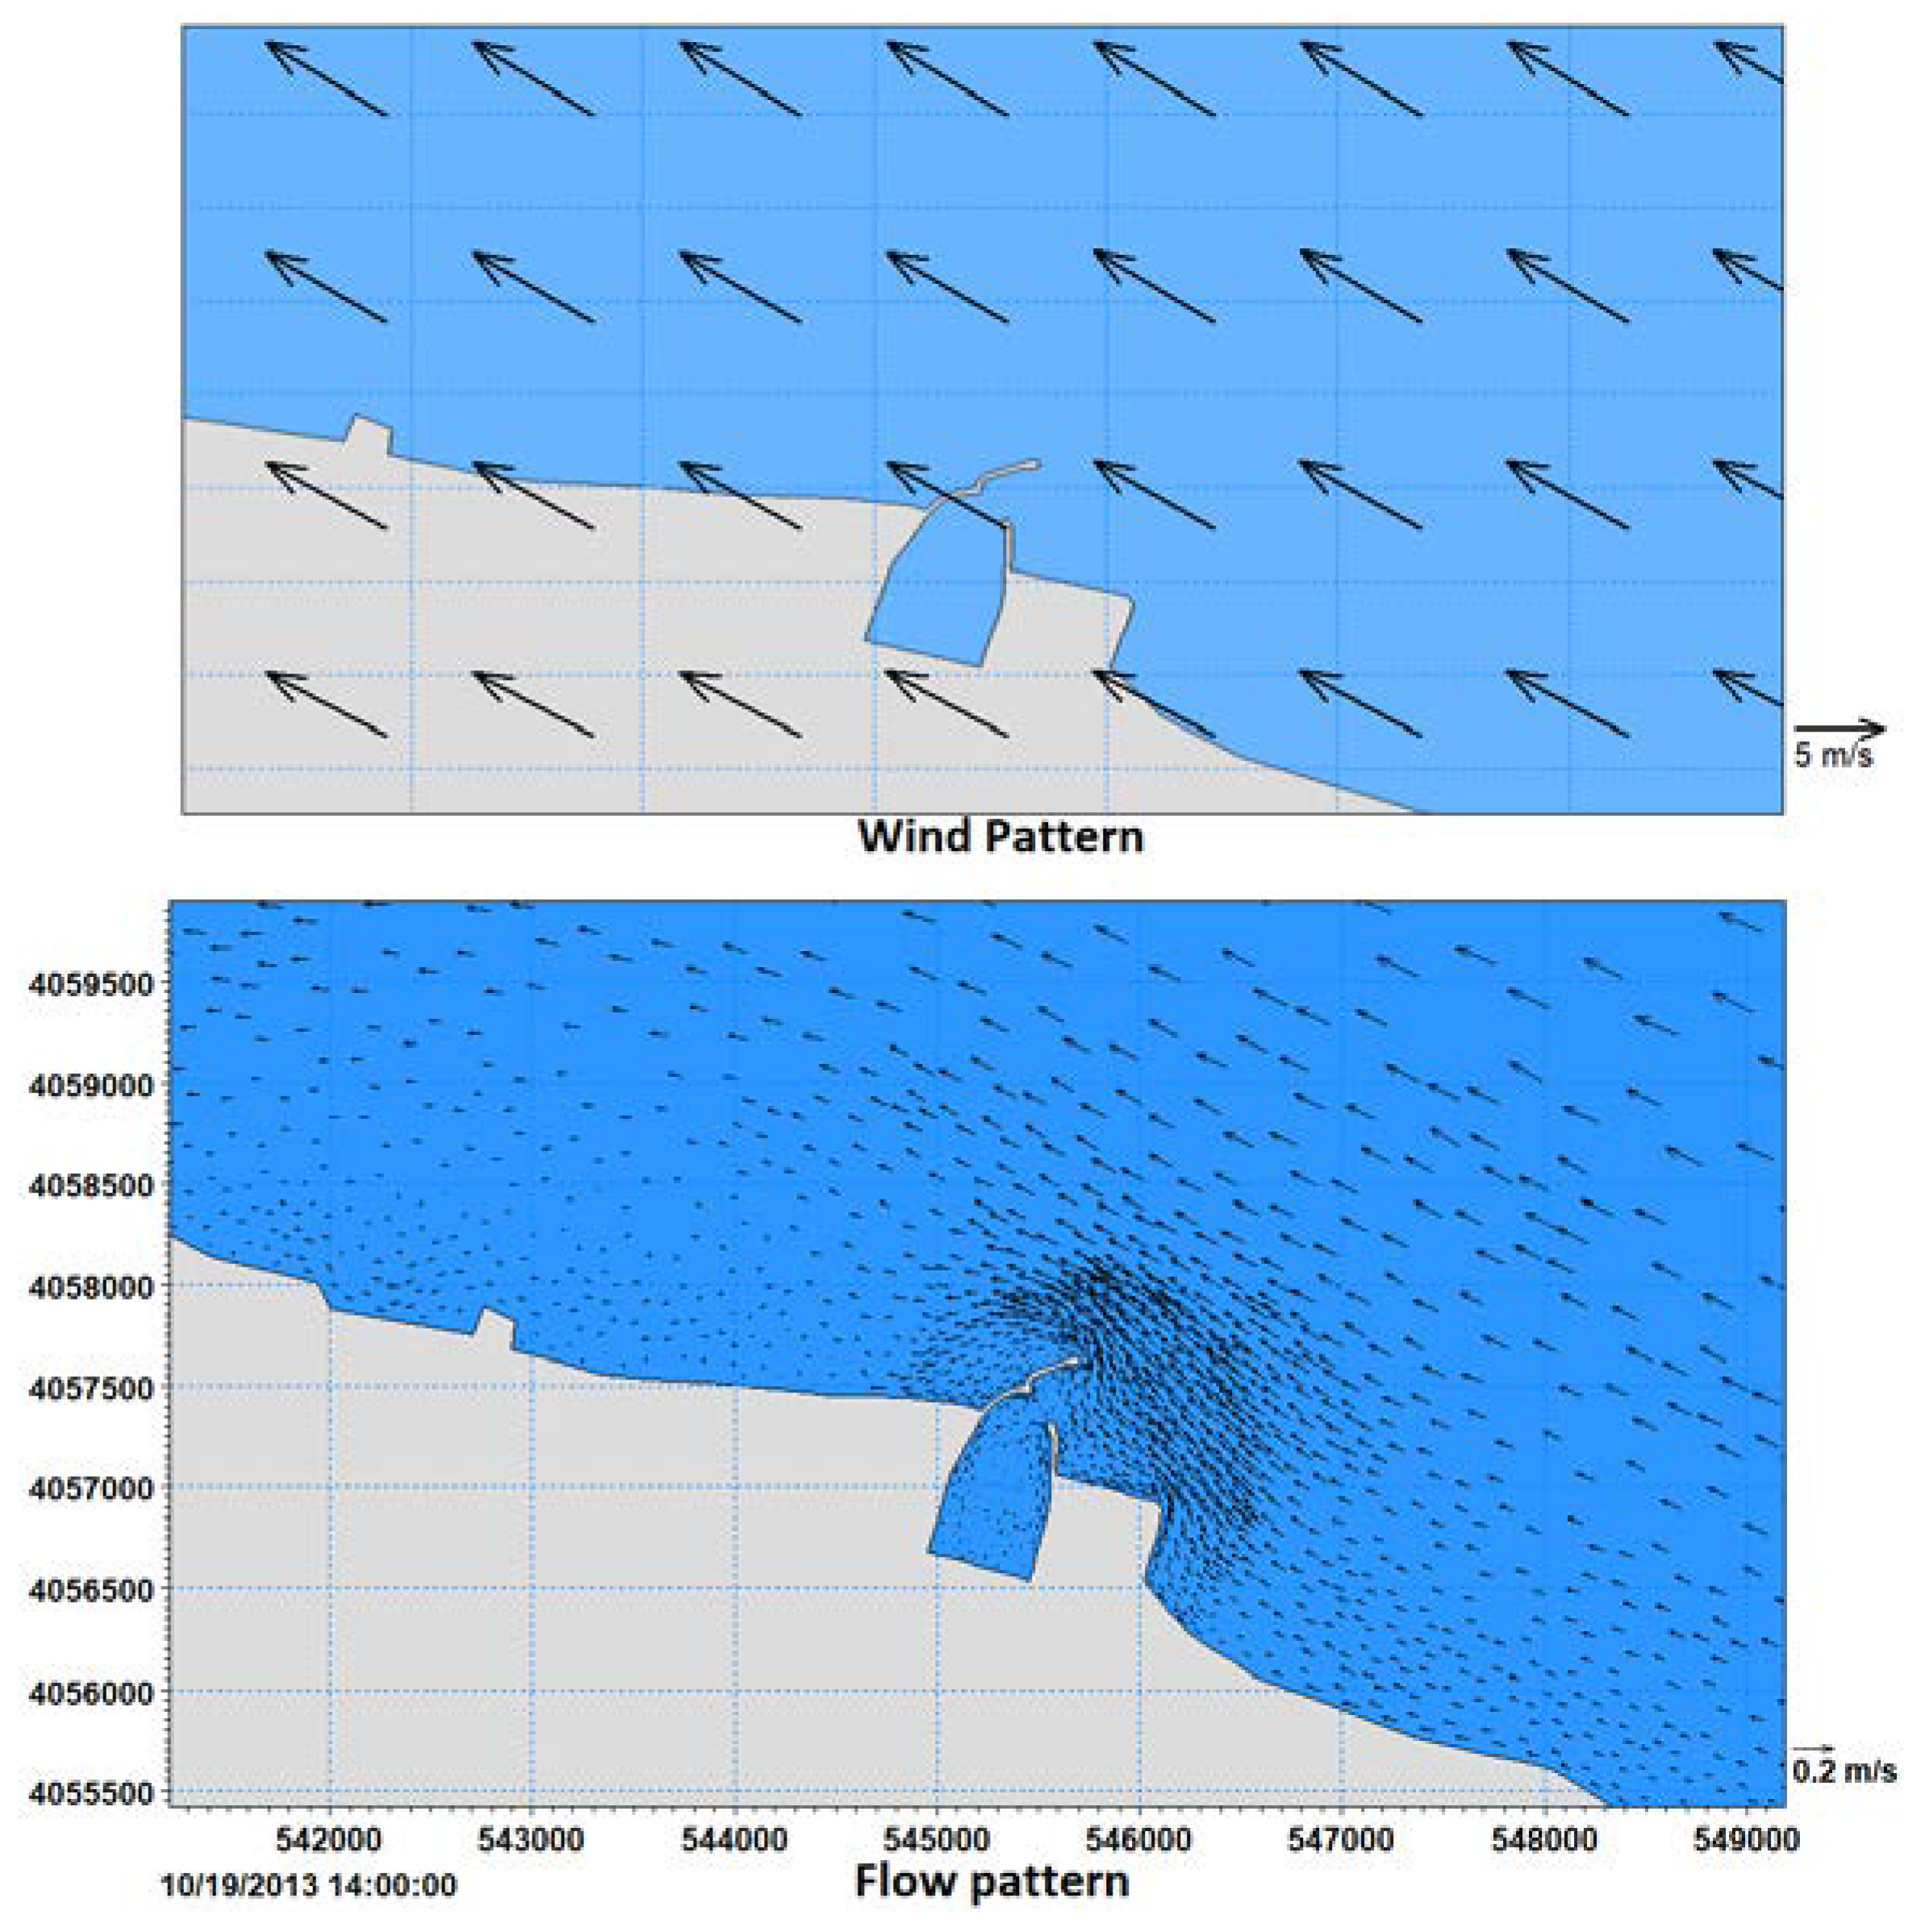
 Figure 19 and Figure 20 present the results of model simulation during two different storm events. In Figure 19, the simulation result during an eastward wind event is shown. The simulated currents were flowing in the same direction as winds. The same was true in the case of a westward wind event (Figure 20) where both wind and current direction was from east to west. It can be seen from Figure 19 that when west to east currents passes over the main breakwater head, it generates an eddy that returns the flow to the port entrance. This flow transports the sediment sources in the east of the channel back into the west and into the access channel of the port. Other field studies (as a part of “monitoring and modeling studies of the northern coasts” [22]) support these findings. In that study, a drifter was released in western parts of Nowshahr port and the movement of it was tracked from its initial release point. The drifter moved eastward past the port entrance and after hitting eastern reclaimed lands it again re-entered into the entrance of port basin consistent with circulation pattern shown in Figure 19.
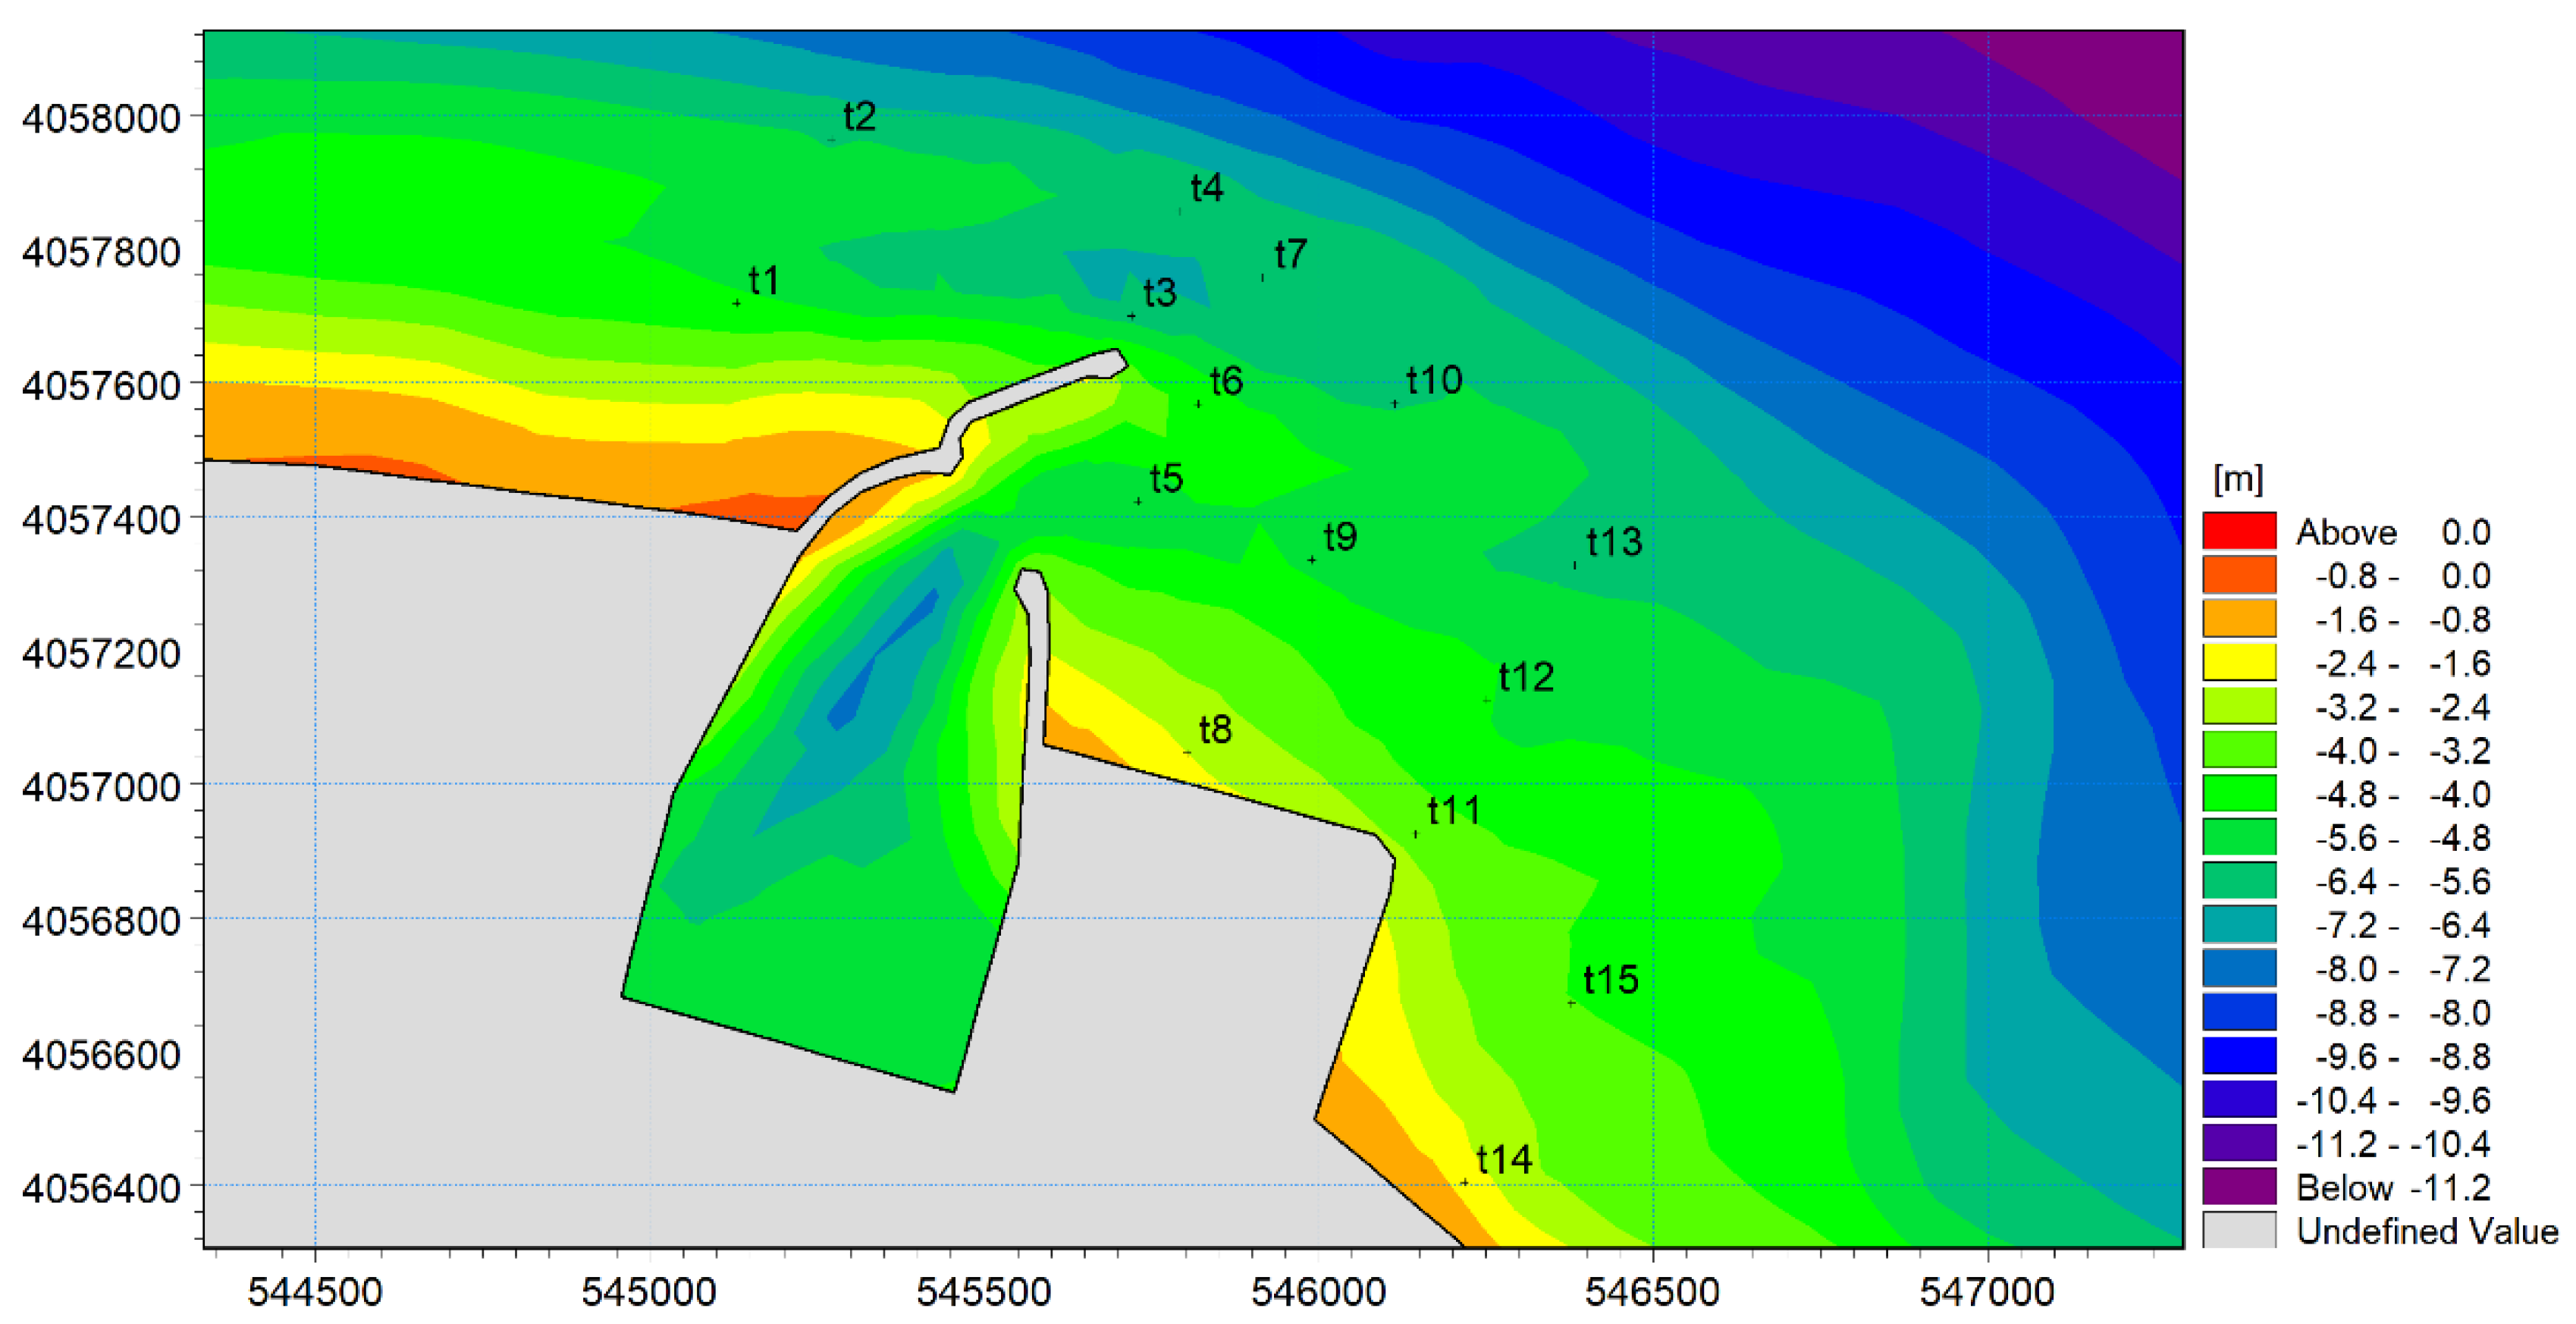
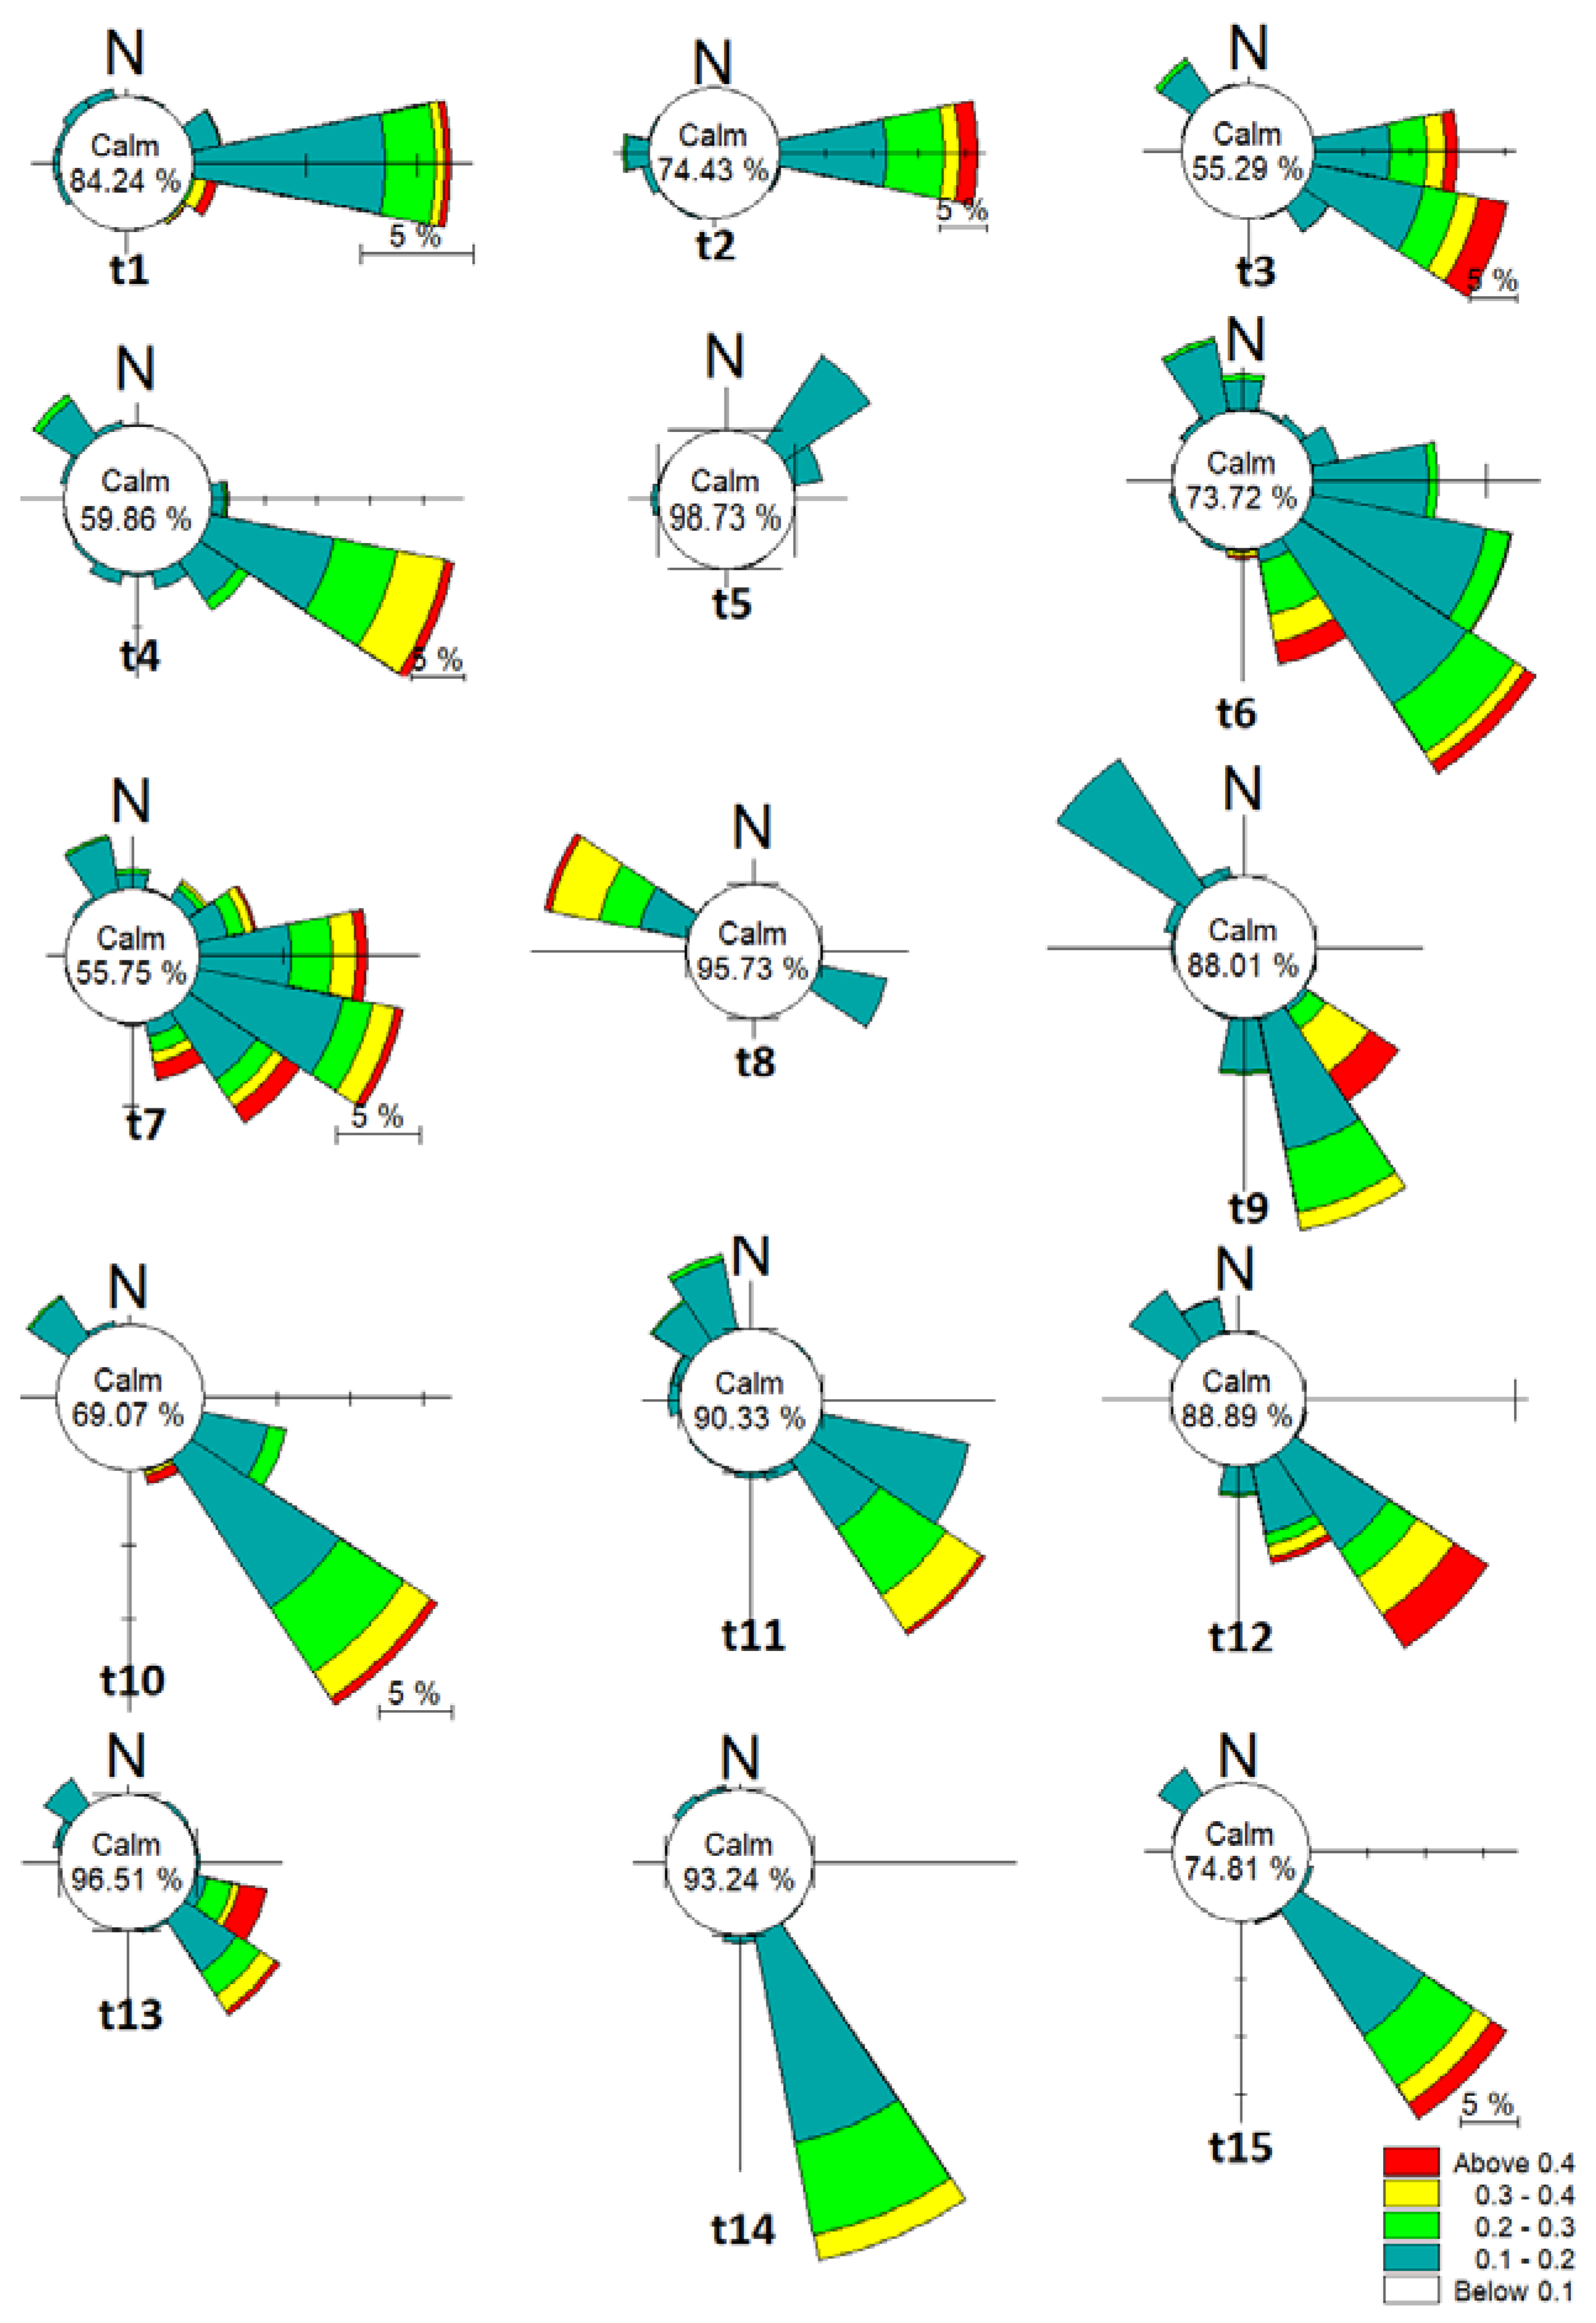
In order to study the spatial variation of current in areas surrounding Nowshahr port, several optional points were selected (Figure 21). Figure 22 presents current-roses in these different locations. Based on this figure, it is clear that in t1 and t2 there was an eastward current. Also, current velocities were larger in t2—which is located in deep waters—compared with t1 stations. In t3 and t4, circulation was affected by the interaction between flow velocities and main western breakwater which resulted in the strengthening of currents. Also, currents get deflected towards the port basin in t3 and t4. There was evidence for the existence of anti-cyclonic (clockwise) eddying circulation with no noticeable unidirectional current velocity.
In t6 and t7, the circulation widens in areas in front of port entrance resulting in the spreading of circulation features there. In t8 and t11, circulation was in form of clockwise motion and westward currents were formed. In case of eastward current in this station, there was no eddying circulation and current would deflect eastward after encountering eastern shoreline of the port. In t9 and t12, both eddying circulation and unidirectional currents were observed. In t10 and t13, main unidirectional currents were the main form of circulation flowing in an eastward direction. Weak currents were found in t14 and t15. Currents in both of these stations were affected by the presence of eastern shoreline of port, which would direct the currents in an eastward direction parallel to the coastline. These rose plots clear the understanding of the eddy formed in the eastward currents.
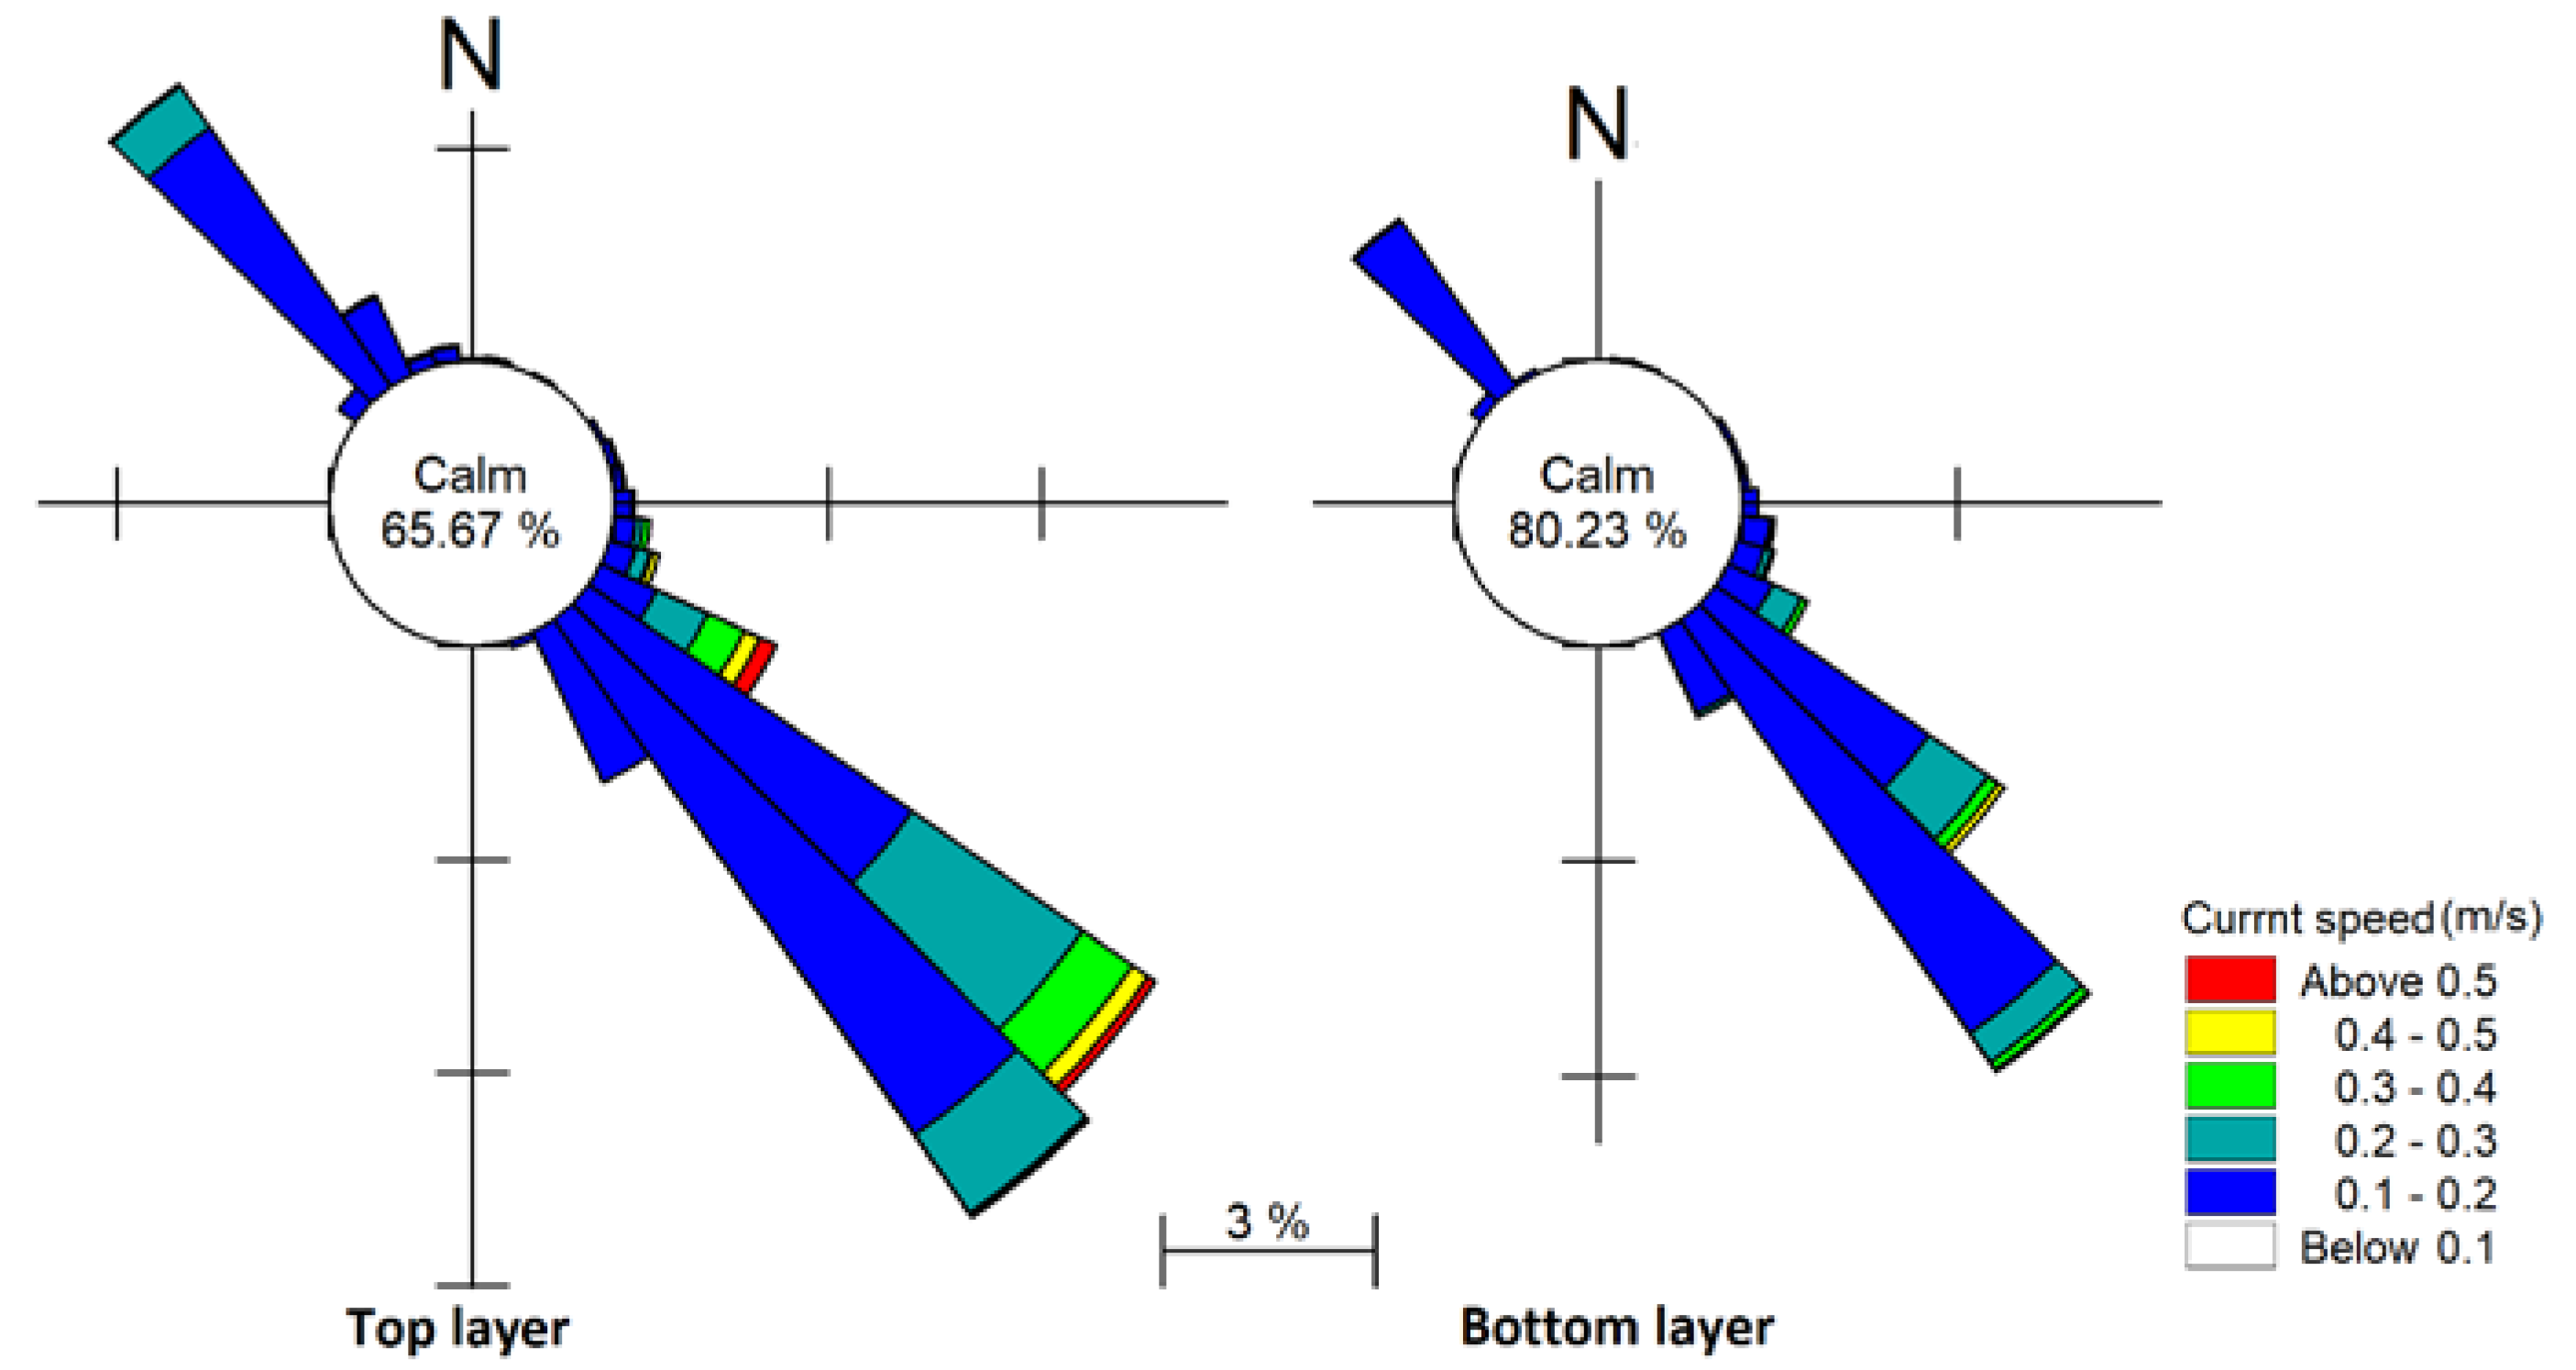
As mentioned, 3D simulation is applied for flow modeling. Figure 23 shows the comparison of current roses in the water surface and near the bed for 1 year simulation. As seen, the flow direction near the bed is a bit different from the one at the water surface. This could happen because the surface current is mostly affected by the surface wind tension and it flows parallel to the wind; while near the sea bed, water flows parallel to the bathymetric isolines. Therefore, the direction of the sea currents can be a little different at the surface and near the sea bed. On the other hand, the flow velocity is also affected by the bed roughness and current velocities near the sea bed are less than the velocities near the surface. Based on the analysis of model results for the flows with velocities higher than 0.1 m/s, the average flow direction and velocity differences between the surface and near the sea bed were 5 to 6 degrees and 0.09 m/s, respectively. 
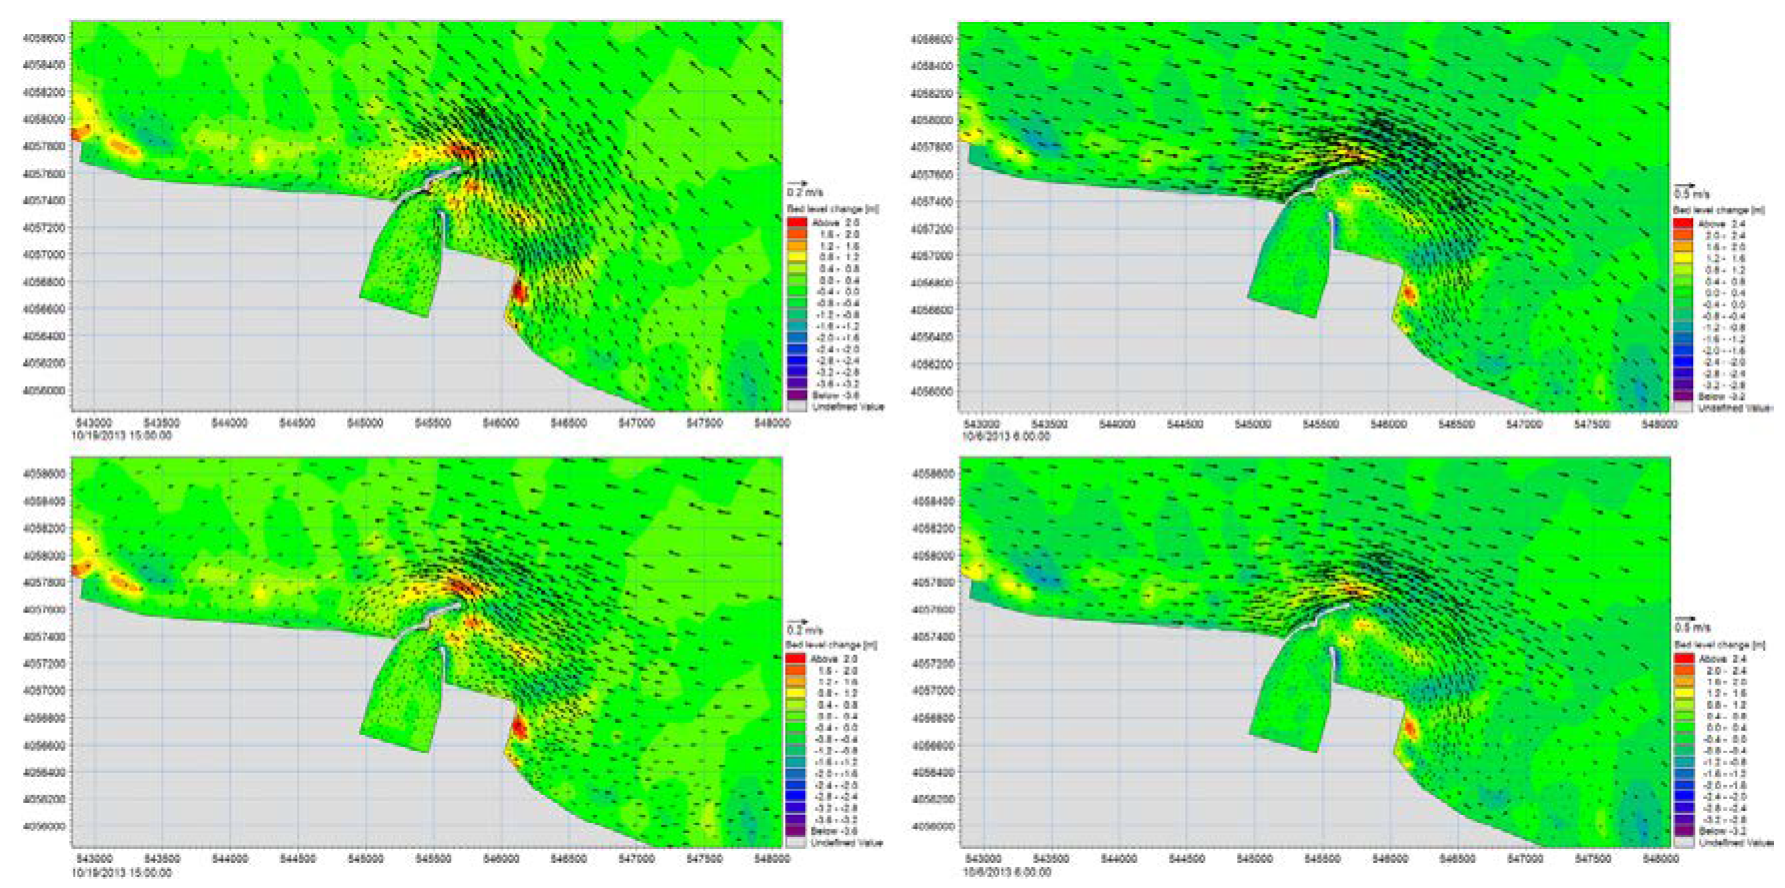
Figure 24 shows two samples of storms around the Nowshahr port at the surface and bottom layer. The current speed and direction differences between the two layers can be seen in this figure. Based on the results, the differences between top and bottom layers are not significant to affect the sediment patterns.
Following analysis of current variations in various locations surrounding Nowshahr port and in different depths, many aspects of causes of sedimentation could be evaluated. Analysis of one year of model simulations indicated that eastward currents could transport riverine derived sources of sediment (from the western rivers like Chaloos and Koorkoorsar) towards the entrance of the port. There, some of the sediments would settle due to a reduction in velocities and remaining sediments would then bypass the entrance of port and move towards down-drift side. It is expected that bypassed sediments would settle in reclaimed lands in the down-drift side of port along eastern shoreline. During storm conditions, high sea waves would hit lee breakwaters and eddying circulation features there would then transport the now suspended sediments of eastern shoreline. The ultimate destination of these sediments is again entrance of port. The riverine derived sources of sediment from the eastern rivers like Mashalak and Moghadam rivers are also transported into the entrance of port by the circulation. These are only the effects of eastward currents. The westward currents on the other hand which are less frequent are also currying the sediments into the port mouth. Therefore, the ultimate destination of all sediments in areas around the Nowshahr port is towards the entrance of port.
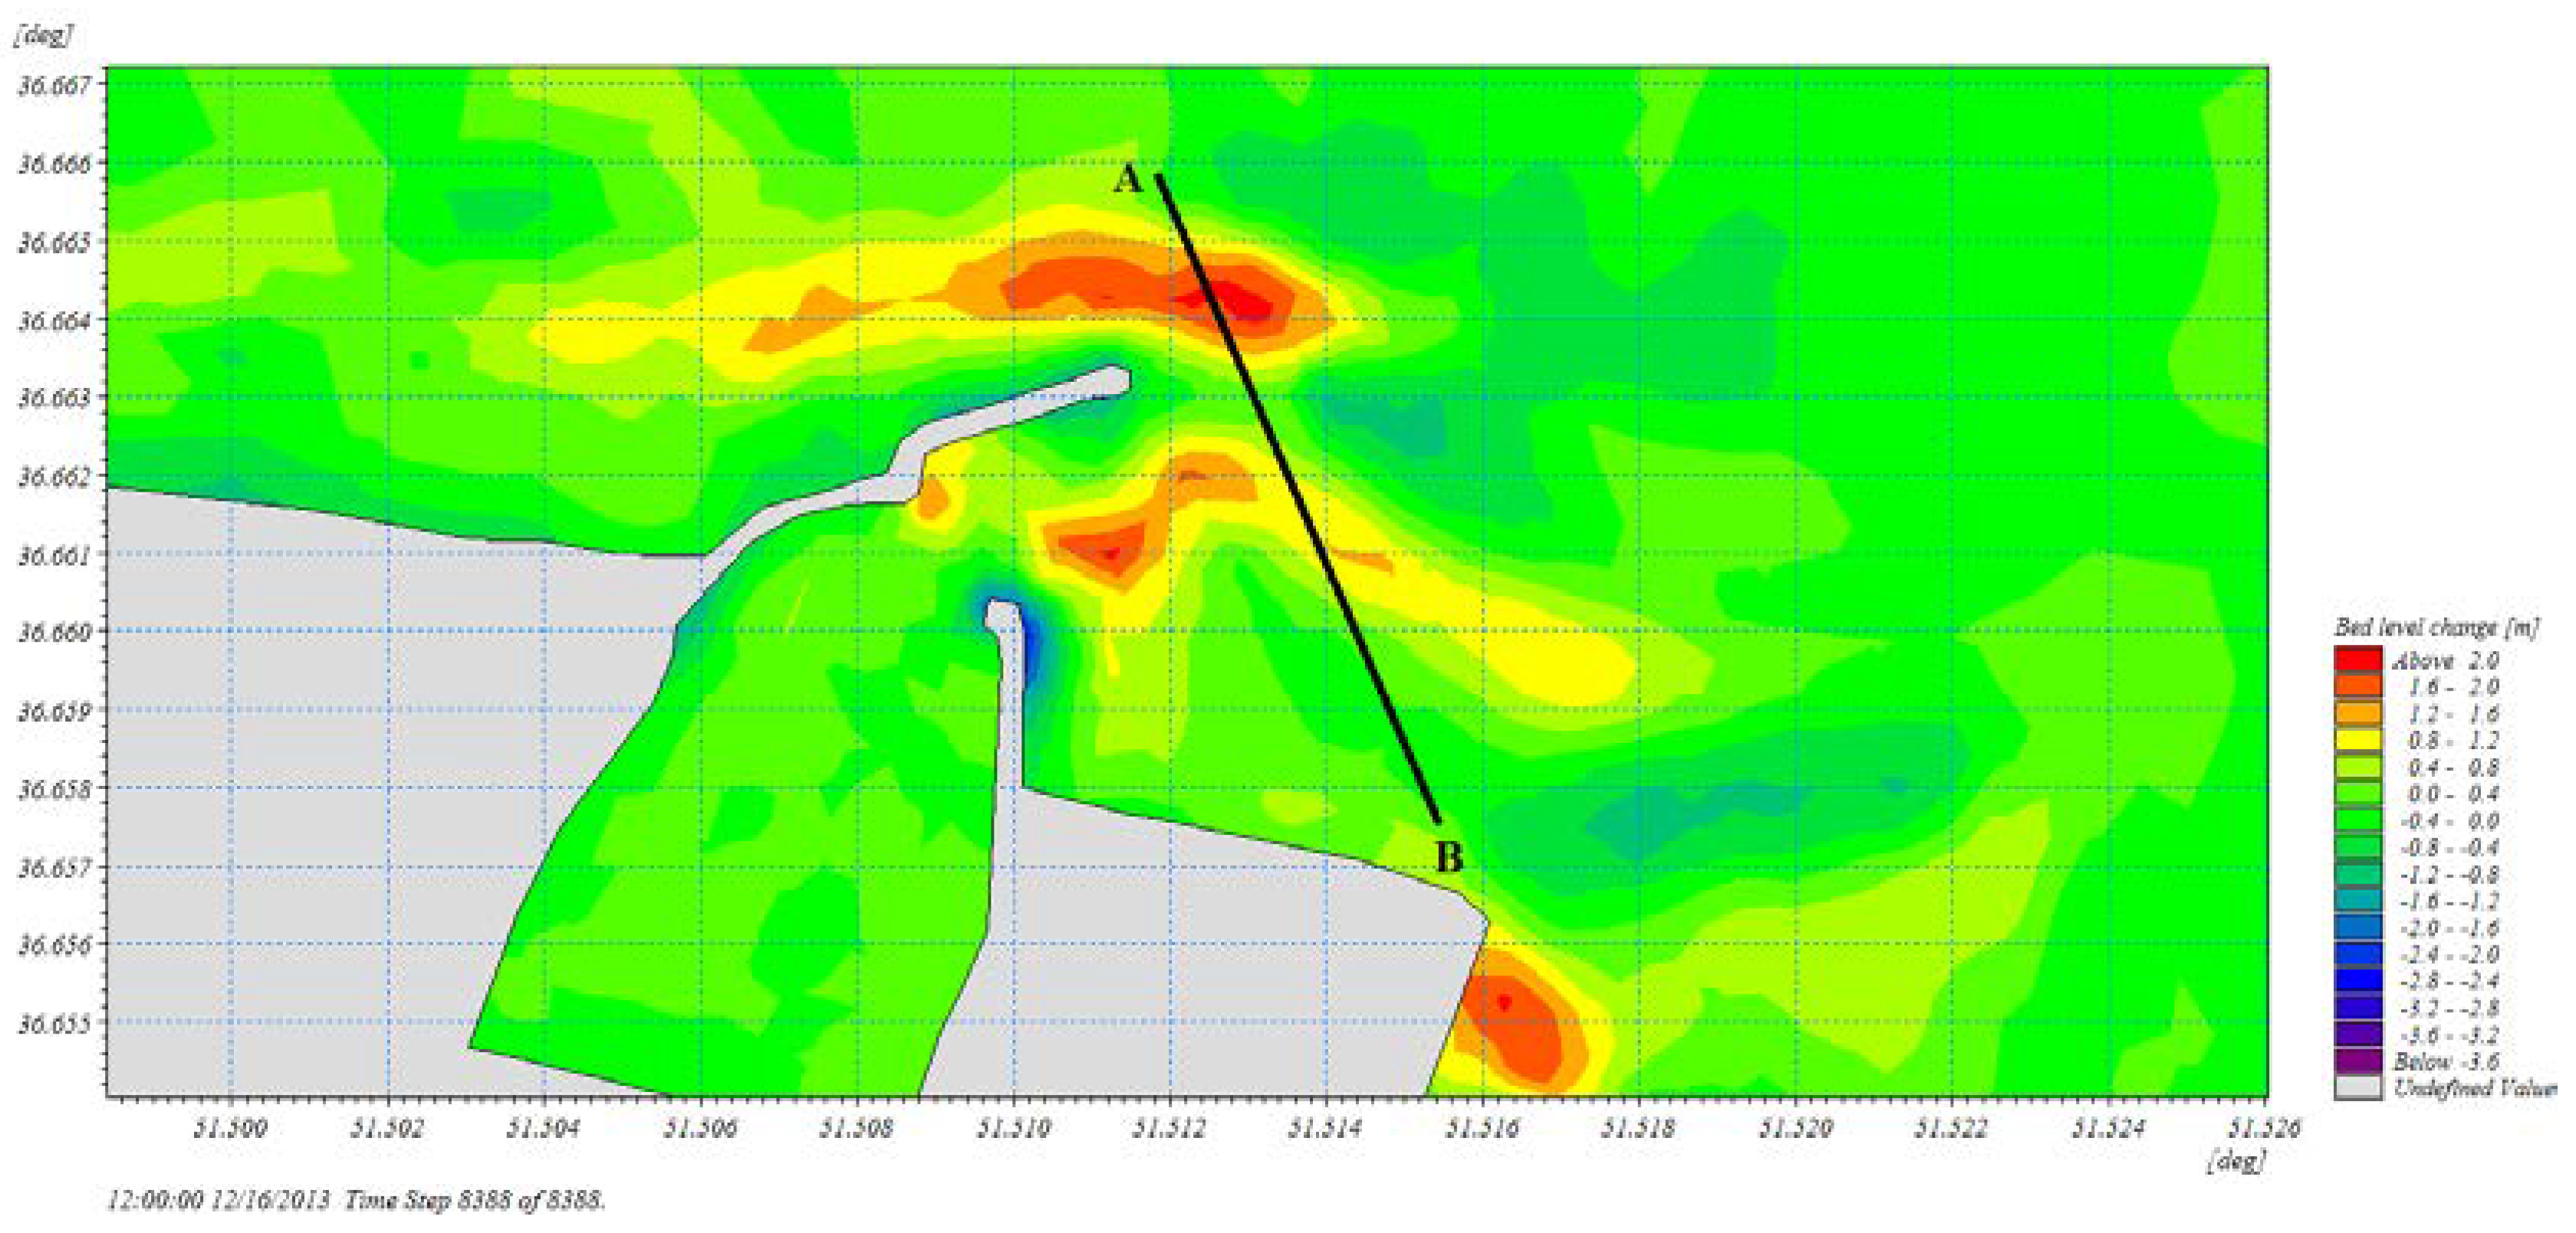
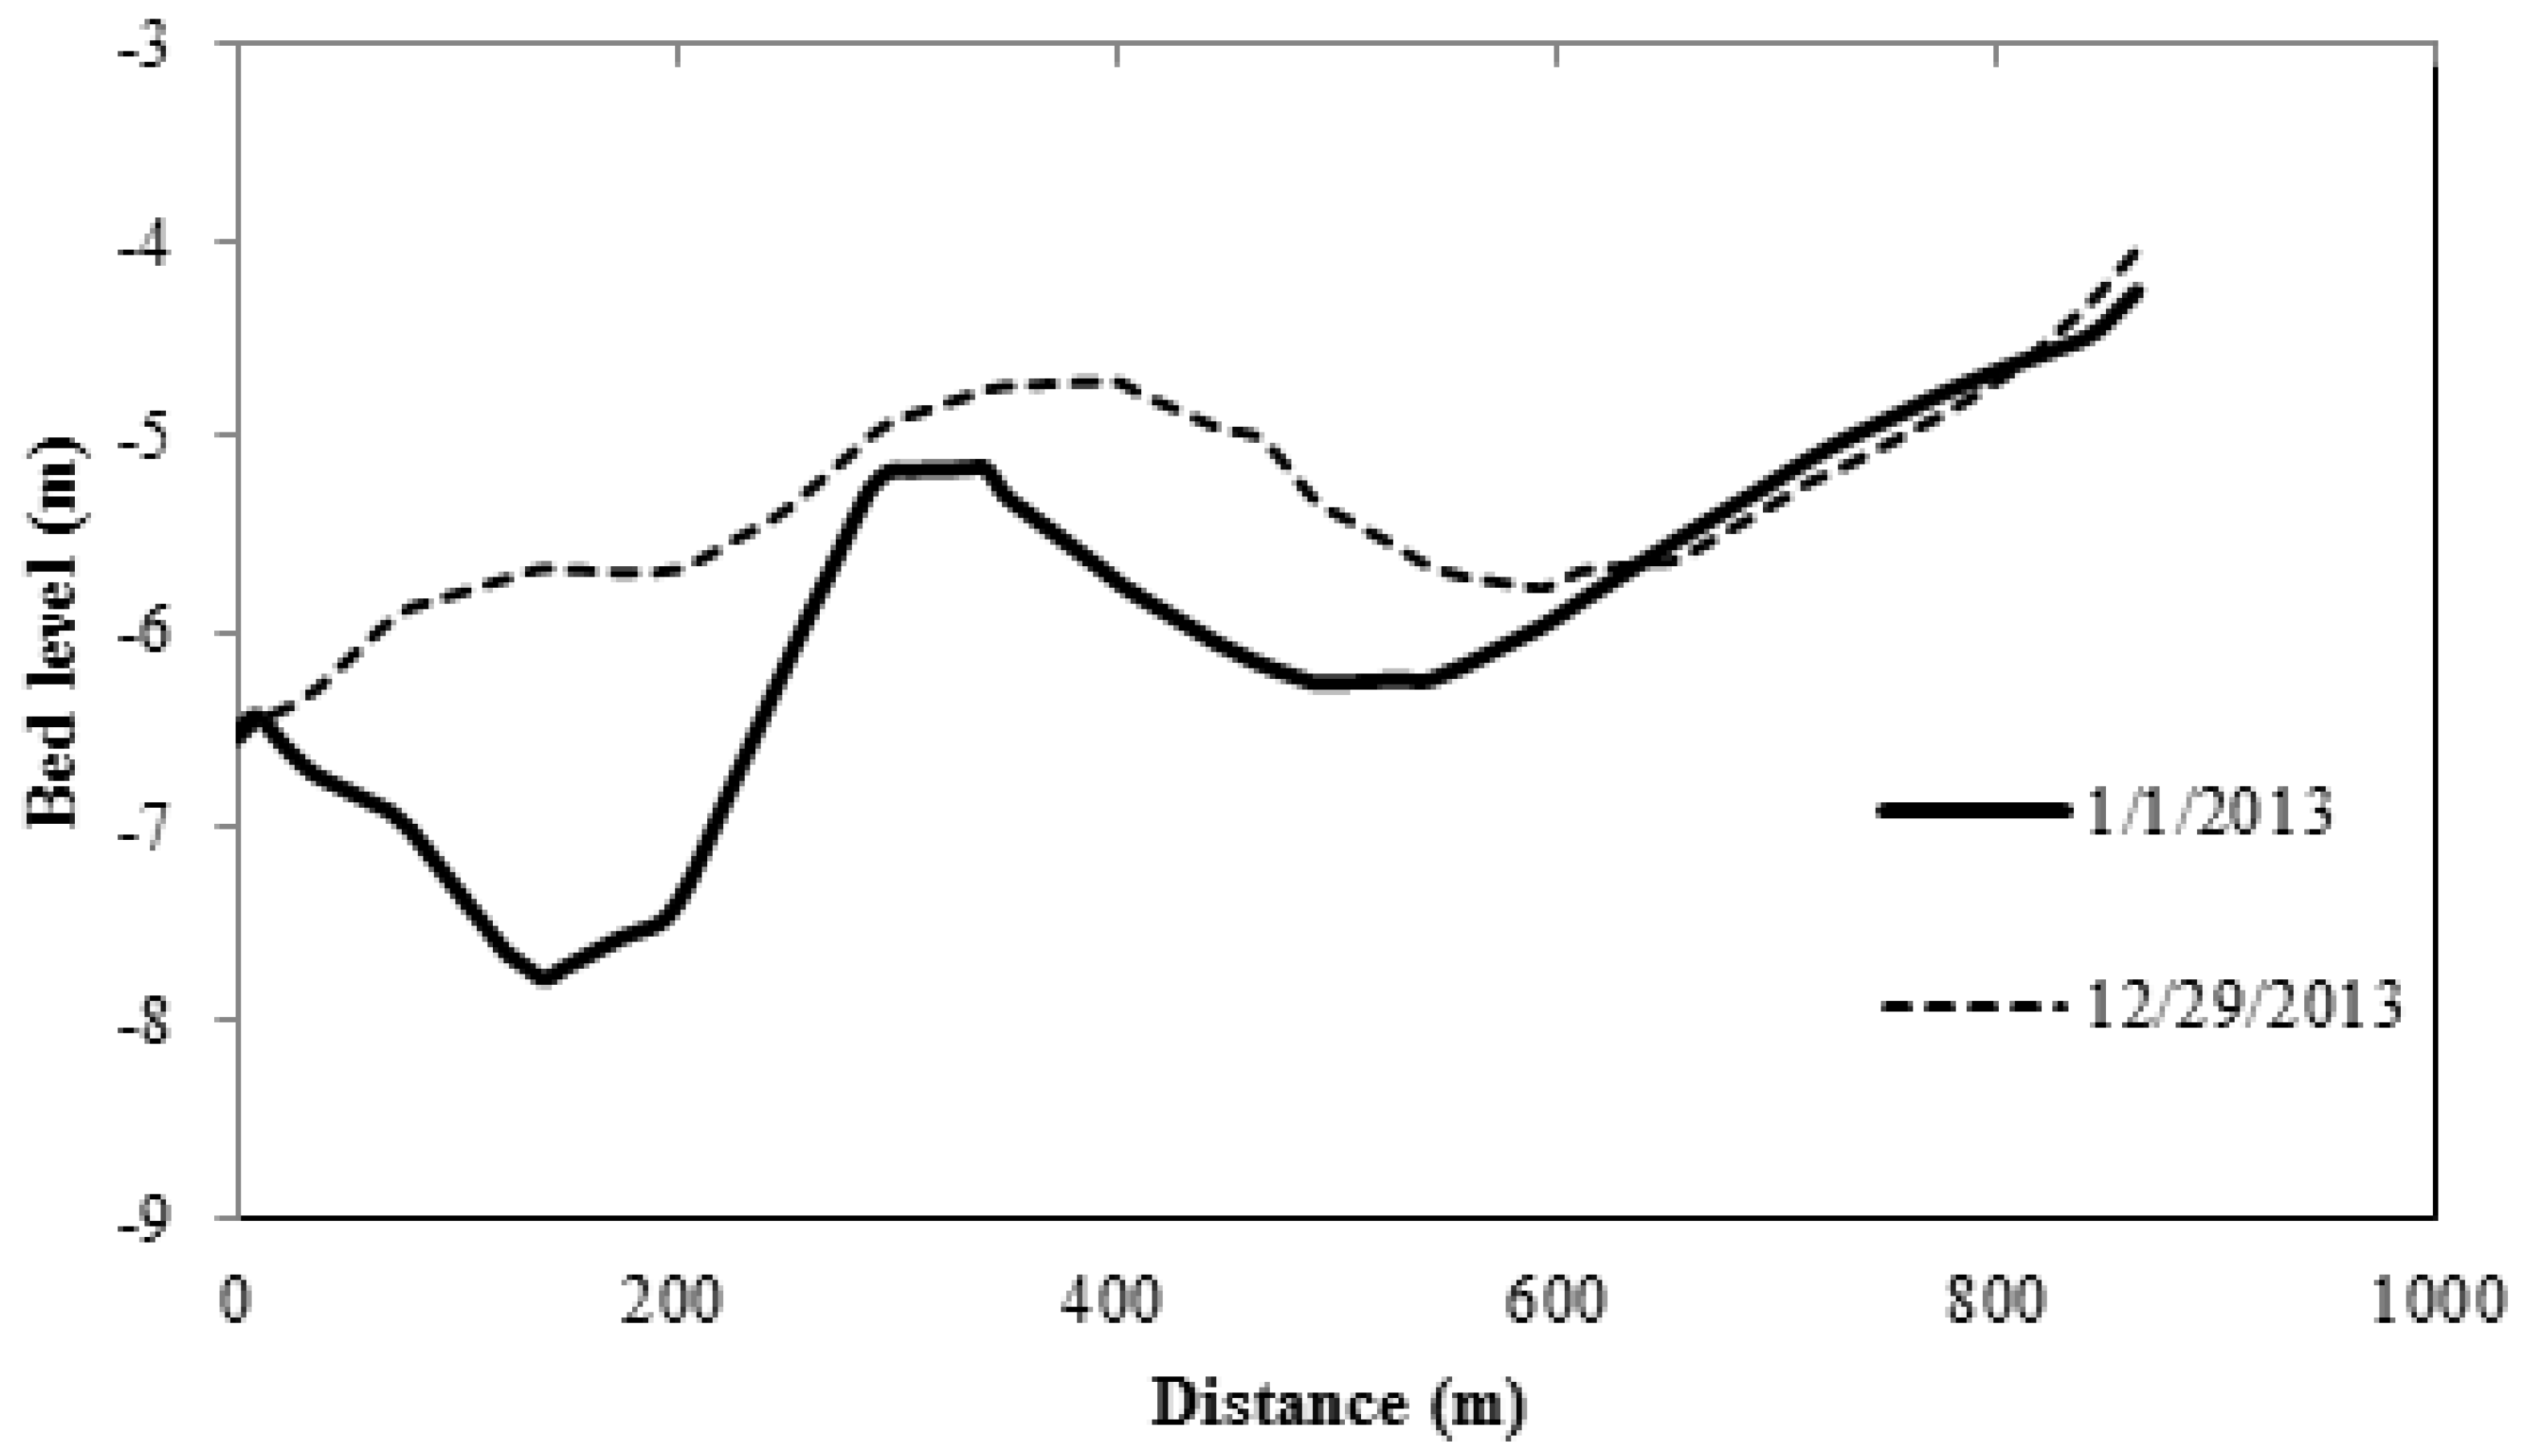
Figure 25 presents the results of sediment transport model indicating sedimentation patterns in areas adjacent to Nowshahr port. This figure illustrates variation of bottom level for 1-year simulation period. In accordance with this figure, it is evident that extensive sedimentation has taken place in front of port entrance and eastern reclaimed lands outside lee breakwater. In contrast, limited sedimentation has occurred inside the port basin. An optional line was marked on this figure so that the variation of bottom level could best be described (Figure 25). In the areas surrounding main breakwater (western arm) net sedimentation of 2 m was observed (Figure 26). Inside the access channel, sedimentation reached 1 m in an annual period. This value is in agreement with dredging values that were obtained in past years.

5. Conclusions

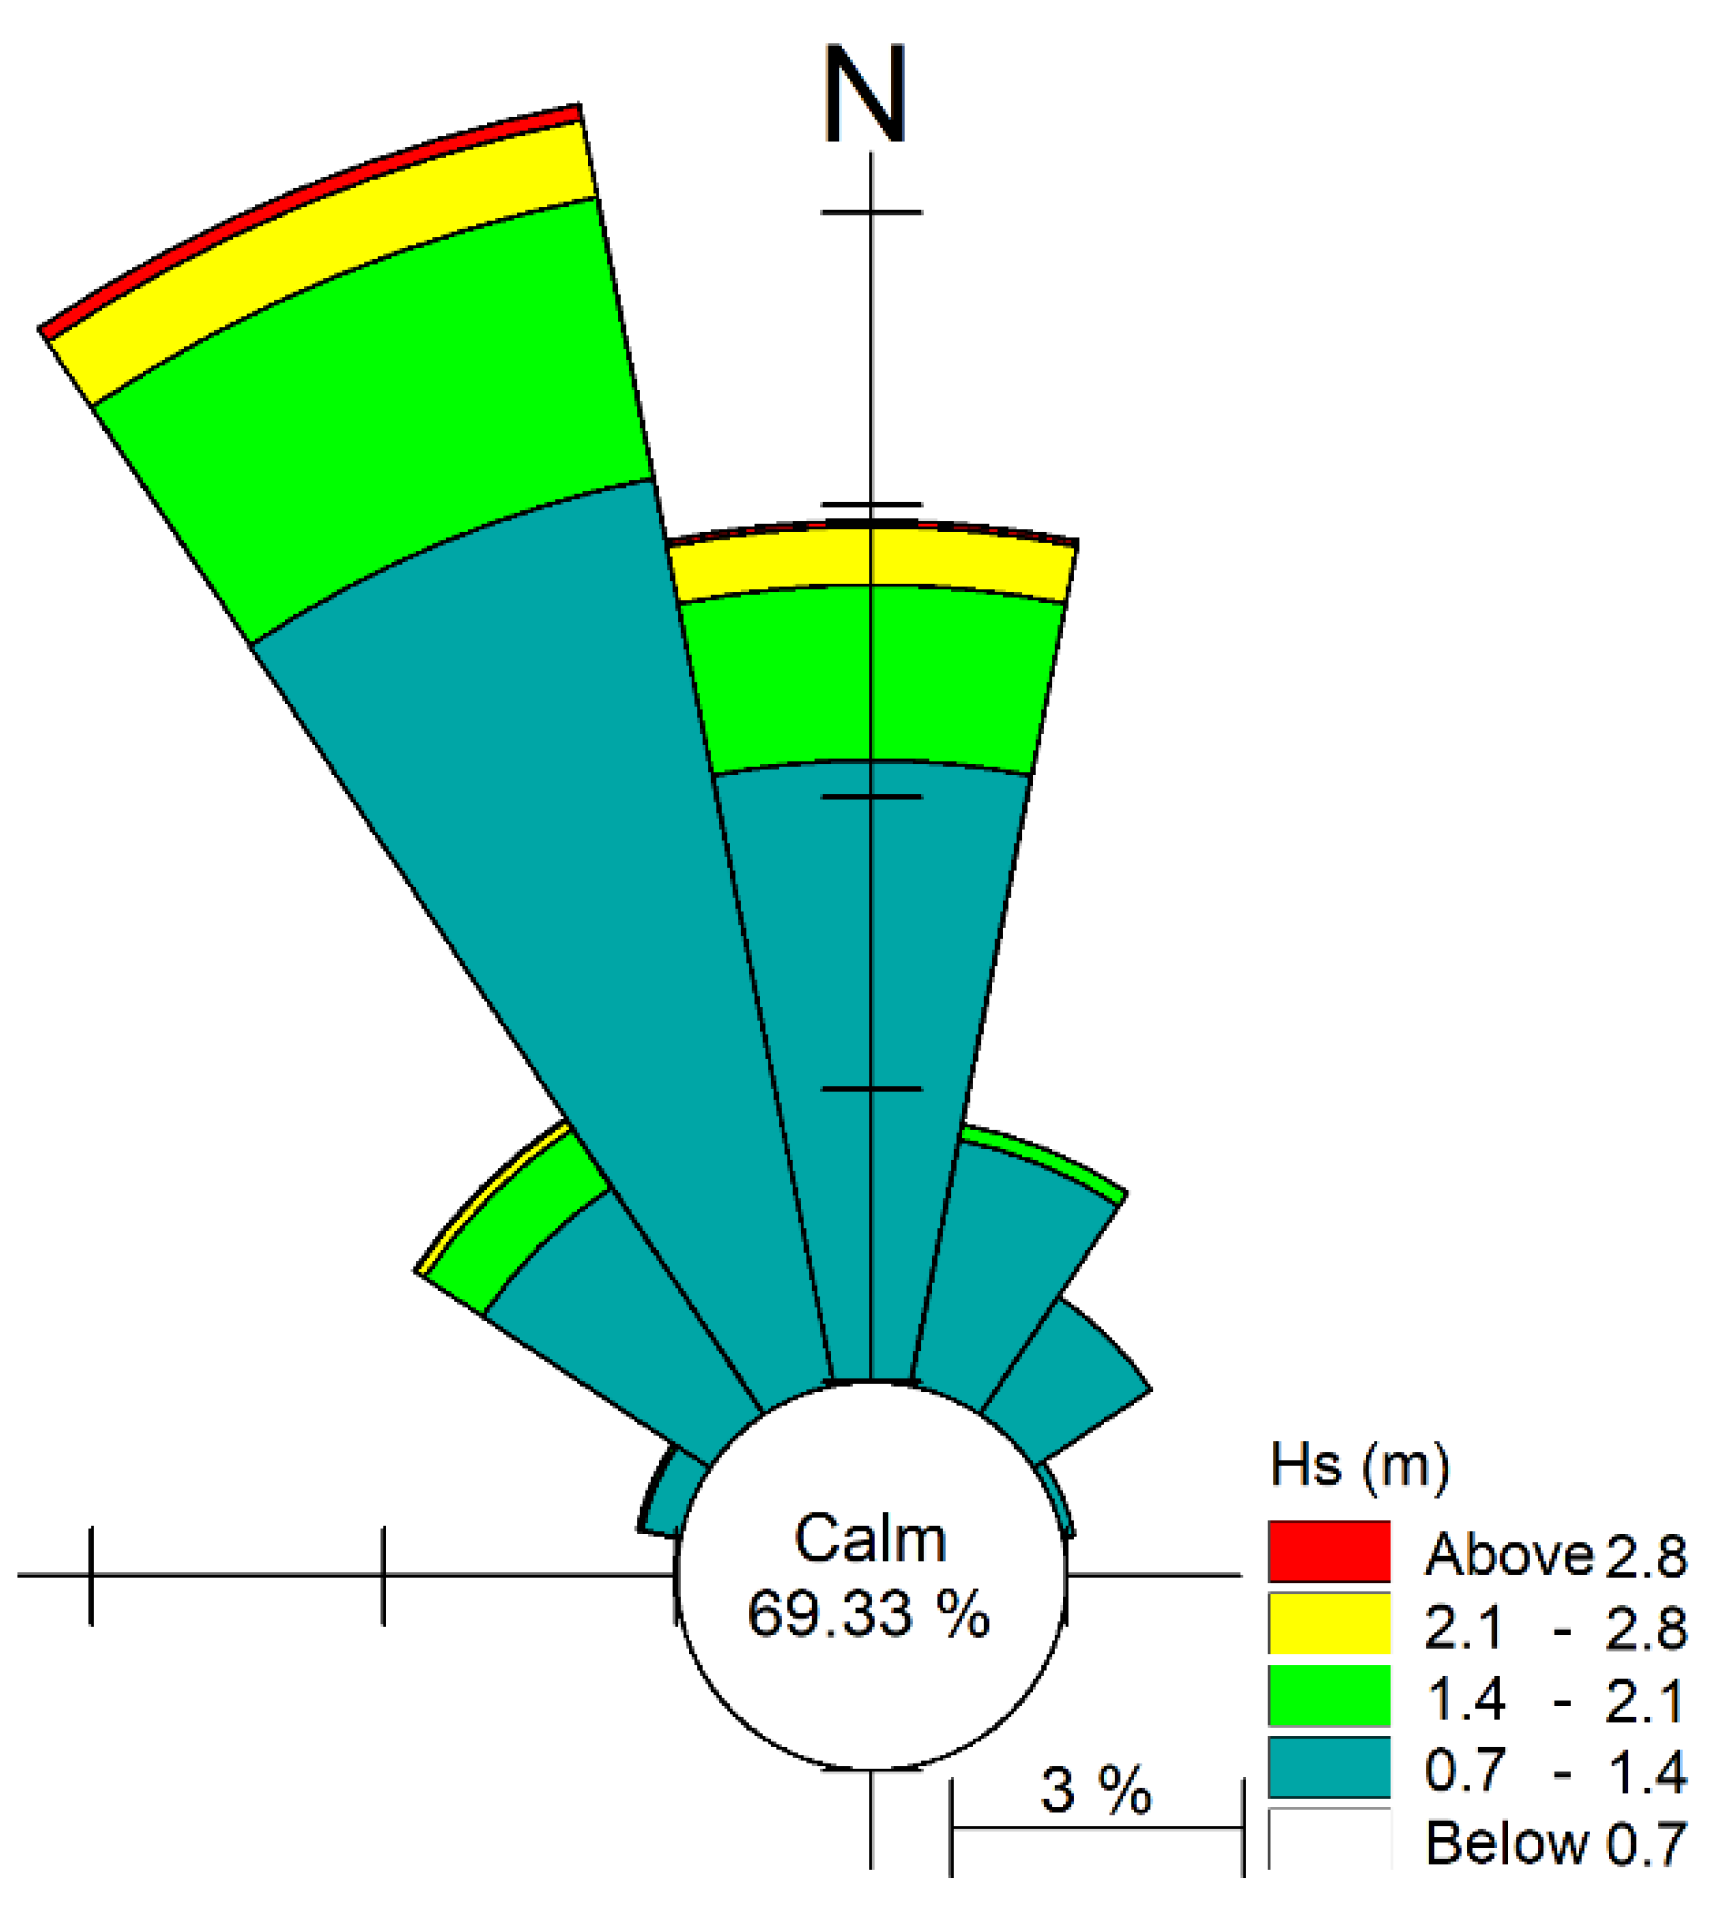
In this study, sedimentation in areas adjacent to Nowshahr port was evaluated in detail. Both field measurements and numerical modeling were used in this study. First, field measurements were evaluated in order to gain an in-depth view of the hydrodynamics of the study area. Investigation of wind data has shown that dominant wind direction in region is eastward (about 70% of the annual period) and westward (about 30% of the annual period). The observation of the current measurements also indicates that the two dominant current directions were eastward and westward. Based on the evaluation of wave data, the dominant wave direction is from the north-west. Therefore, wave-induced currents in the surf zone were from west to east, too. Due to direction of current, accretion (erosion) of sediments occurred in western (eastern) areas of Nowshahr port. Numerical models then were calibrated and validated against existing field measurements. The results of the numerical simulation have shown that an intermittent eddying circulation was formed directly in front of eastern section of Nowshahr port due to the interaction between eastward currents and breakwater arms. Any sediment arriving in front of the reclamation land could be carried by this circulation towards port entrance and its access channel. Based on the analysis of annual data, supply of sediments from the Mashalak River located to the east of Nowshahr port was estimated to be around 40,000 m3 per annum. This is one of the sediment sources near the port. Results from the sediment model indicated that the model has captured major features of sedimentation patterns in the study area. Furthermore, in accordance with results of numerical modeling, sedimentation of up to 1 m was predicted in areas of access channel of Nowshahr port, in agreement with previous estimates based on annual dredging volumes.

Author Contributions

This study has been performed as a part of a Ph.D. thesis bay A.M. (Ayyuob Mahmoodi) as the student, M.A.L.N. and A.M. (Abbas Mansouri) as supervisors, and also M.S.B. as advisor. A.M. (Ayyuob Mahmoodi) wrote the manuscript with support and advice from all the other authors and they are all discussed the results and contributed to the final manuscript. All authors have read and agreed to the published version of the manuscript.

Funding

This research received no external funding.

Acknowledgments

The authors would like to thank PMO Pouya Tarh Pars Consulting Engineers Company, for the valuable dataset.

Conflicts of Interest

The authors declare that there is no conflict of interest regarding the publication of this article.

References

  1. Caceres, R.; Zyserman, J.A.; Perillo, G.M.E. Analysis of sedimentation problems at the entrance to Mar del Plata Harbor. J. Coast. Res. 2016, 32, 301–314. [Google Scholar]
  2. Van Rijn, L.C. Estuarine and coastal sedimentation problems. Int. J. Sedim. Res. 2005, 20, 39–51. [Google Scholar]
  3. Bali, M.; Jandaghi Alaee, M.; Moeini, M.H. Hydrodynamic and Sedimentation Study in Noshahr Port. In Proceedings of the 18th Marine Industries Conference (MIC), Kish Island, Iran, 17–19 October 2016. [Google Scholar]
  4. Yuksek, O. Effects of breakwater parameters on shoaling of fishery harbors. J. Waterw. Port Coast. Ocean Eng. 1995, 121, 13–22. [Google Scholar] [CrossRef]
  5. Sume, V.; Yuksek, O. Investigation of shoaling of coastal fishery structures in the Eastern Black Sea coasts. J. Fac. Eng. Archit. Gazi Univ. 2018, 33, 843–852. [Google Scholar]
  6. Frihy, O.E.; Abd El Moniem, A.B.; Hassan, M.S. Sedimentation processes at the navigation channel of the Damietta Harbour on the Northeastern Nile Delta coast of Egypt. J. Coast. Res. 2002, 18, 459–469. [Google Scholar]
  7. Mojabi, M.; Hejazi, K.; Karimi, M. Numerical investigation of effective harbor geometry parameters on sedimentation inside square harbors. Int. J. Mar. Sci. Eng. 2013, 3, 57–68. [Google Scholar]
  8. Stock, F.; Knipping, M.; Pint, A.; Ladstätter, S.; Delile, H.; Heiss, A.G.; Laermanns, H.; Mitchell, P.D.; Ployer, R.; Steskal, M.; et al. Human impact on Holocene sediment dynamics in the Eastern Mediterranean–the example of the Roman harbour of Ephesus. Earth Surf. Process. Landf. 2016, 41, 980–996. [Google Scholar] [CrossRef]
  9. Nezammahalleh, M.A.; Yamani, M.; Soltani, S.; Maldar, B.A.; Rastegar, A. Modeling of Hydrodynamic Factors for Management of Coastal Hazards, Case Study: Khamir Port, Persian Gulf, Iran. Int. J. Mar. Sci. Eng. 2014, 4, 25–36. [Google Scholar]
  10. Portela, L.I.; Ramos, S.; Teixeira, A.T. Effect of salinity on the settling velocity of fine sediments of a harbour basin. J. Coast. Res. 2013, 65, 1188–1194. [Google Scholar] [CrossRef]
  11. Sharaan, M.; Ibrahim, M.G.; Iskander, M.; Masria, A.; Nadaoka, K. Analysis of sedimentation at the fishing harbor entrance: Case study of El-Burullus, Egypt. J. Coast. Conserv. 2018, 22, 1143–1156. [Google Scholar] [CrossRef]
  12. Jafari, E.; Alaee, M.J.; Nazarali, M.; Bali, M. Sea Water Temperature Observation and Simulation in the Caspian Sea. In Proceedings of the International Conference on Coasts, Ports and Marine Structures (ICOPMAS), Tehran, Iran, 31 October–2 November 2016. [Google Scholar]
  13. Moeini, M.H.; Jafari, E.; Bali, M.; Alaee, M.; Pattiaratchi, C. Simulation of the sea water circulation and coastal currents in the Caspian Sea. In Proceedings of the International Conference on Coasts, Ports and Marine Structures (ICOPMAS), Tehran, Iran, 31 October–2 November 2016. [Google Scholar]
  14. Rostami, S.; Nezamivand Chegini, A.; Gobraei, A.; Lashteneh Neshaei, M.; Esfahanizadeh, M. Investigation of sedimentation process in Noshahr port basin. In Proceedings of the 10th Iranian Hydraulic Conference, Rasht, Iran, 8 November 2011. [Google Scholar]
  15. Mahmoodi, A.L.; Mansori, A.; Shafaei Bajestan, M. Numerical study of current and sedimentation in Noshahr port. J. Mar. Technol. 2018, 5, 105–116. [Google Scholar]
  16. Pouya Tarh Pars (PTP). Monitoring and Modeling Study of Iranian Coasts, Phase 5: Northern Coasts, Report Phases 1 and 2 of Noshahr Port (Special Regions); PTP: Tehran, Iran, 2014. [Google Scholar]
  17. Tehran Berkeley, C.E. First Phase Studies of the East and West Conservation Management Project of Noshahr Port; General Directorate of Port and Maritime Organization of Mazandaran Province: Tehran, Iran, 2011. [Google Scholar]
  18. DHI Institute. MIKE 21 & MIKE 3 Flow Model FM Hydrodynamic and Transport Module Scientific Documentation; DHI Water & Environment, Inc.: Horshølme, Denmark, 2011; 52p. [Google Scholar]
  19. DHI Institute. MIKE 21 Spectral Wave Module; DHI Water & Environment, Inc.: Horshølme, Denmark, 2011; 66p. [Google Scholar]
  20. DHI Institute. Noncohesive Sediment Transport in Currents and Waves; DHI Water & Environment, Inc.: Horshølme, Denmark, 2011; 66p. [Google Scholar]
  21. Ghader, S.; Namin, M.; Chegini, F.; Bohluly, A. Hindcast of surface wind field over the Caspian sea using WRF model. In Proceedings of the International Conference on Coasts, Ports and Marine Structures (ICOPMAS), Tehran, Iran, 24–26 November 2014. [Google Scholar]
  22. Iranian Port and Maritime Organization. Monitoring and Modeling Study of Iranian Coasts, Phase 5: Northern Coasts; Iranian Port and Maritime Organization: Tehran, Iran, 2015.
Figure 1. Position of Nowshahr port along the southern coastline of the Caspian Sea.
Jmse 08 00284 g001
Figure 2. The initial layout of Nowshahr port (aerial picture is taken around 1952).
Jmse 08 00284 g002
Figure 3. Changes in Nowshahr port layout since the year 1989 until now. Commission year: Initial layout in 1939, main breakwater extension in 1996, and reclamation land in 2012.
Jmse 08 00284 g003
Figure 4. Thirty-one-year wind rose derived from the Weather Research Forecast (WRF) model in Nowshahr port.
Jmse 08 00284 g004
Figure 5. Large-scale bathymetry of Caspian Sea and location of Nowshahr port along the southern coastline (top panel) and local bathymetry of Nowshahr port obtained in 2018 (bottom panel).
Jmse 08 00284 g005
Figure 6. The measured wave rose in the year 2013 in a station near Nowshahr port.
Jmse 08 00284 g006
Figure 7. Current rose obtained at a station at 10 m depth located near the surface (top panel, depth 1.5 m) and near bottom (bottom panel, depth 8.5 m) in areas adjacent to Nowshahr port.
Jmse 08 00284 g007
Figure 8. Average particle diameter in coastal sediments in areas near Nowshahr port.
Jmse 08 00284 g008
Figure 9. Model domain and mesh definition file used in coupled simulations of wave, current and sediment. Also shown is the location of ADCP station.
Jmse 08 00284 g009
Figure 10. Comparison of modeled and measured wave height and direction for October 2013. Red color indicates measurements and black color indicates model results. The results of sensitivity analysis on the white capping and bed roughness coefficients are also presented.
Jmse 08 00284 g010
Figure 11. Comparison of modeled and measured current speed and direction for October 2013. Red color indicates measurements and black color indicates model results. The result of the sensitivity analysis on the roughness height coefficient is also presented.
Jmse 08 00284 g011
Figure 12. Comparison of modeled and measured water level for October 2013. Red color indicates measurements and black color indicates model results.
Jmse 08 00284 g012
Figure 13. Model simulation of significant wave height (black solid line) and wave direction (black arrows) in the year 2013. Also shown is measured significant wave height (red dots) and wave direction (red arrows).
Jmse 08 00284 g013
Figure 14. The measured and simulated annual wave rose for the year 2013.
Jmse 08 00284 g014
Figure 15. Model simulation of current speed (black solid line) and direction (black arrows) in the year 2013. Also shown is measured current speed (red dots) and direction (red arrows).
Jmse 08 00284 g015
Figure 16. Measured and simulated annual current rose for the year 2013.
Jmse 08 00284 g016
Figure 17. Temporal variation of wind speed and direction during a typical wind storm in southern parts of the Caspian Sea (the winds are from WRF model).
Jmse 08 00284 g017
Figure 18. WRF wind field (top panels) and surface current field obtained from the hydrodynamic (HD) model (bottom panels) during two distinct storm events on 11th (left panels) and 17th (right panels) of January 2013.
Jmse 08 00284 g018
Figure 19. Wind field (top panel) from WRF and surface current field (bottom panel) from the model in areas adjacent Nowshahr port during a typical eastward storm event on 6th October 2013.
Jmse 08 00284 g019
Figure 20. Wind field (top panel) and surface current field (bottom panel) in areas adjacent Nowshahr port during a typical westward storm event on 19th October 2013.
Jmse 08 00284 g020
Figure 21. Spatial distribution of stations for studying current variations in the annual period in areas adjacent to Nowshahr port.
Jmse 08 00284 g021
Figure 22. Current-roses in various locations indicated in Figure 21.
Jmse 08 00284 g022
Figure 23. The comparison of current roses in the water surface and near the bed for 1 year simulation.
Jmse 08 00284 g023
Figure 24. Two samples of storms around the Nowshahr port at the surface (upper figures) and bottom layer (lower figures).
Jmse 08 00284 g024
Figure 25. Bed level change in 1-year simulation period. Also shown is the location of an optional line chosen for the investigation of bed level changes during simulation.
Jmse 08 00284 g025
Figure 26. Variation of bottom level along AB line shown in Figure 25 one year after simulation. The thick (dashed) black line indicates initial bed level elevation (m).
Jmse 08 00284 g026
Table 1. Values of several statistical parameters that were used for evaluating the performance of coupled model against existing observations. Wave height data in October 2013 is used for derivation of these values.
Error IndicatorValue
Model Skill0.94
SI0.33
R0.89
BIAS0.02
RMSE0.22
Table 2. Values of several statistical parameters that were used for evaluating the performance of coupled model against existing observations. Current speed data in October 2013 is used for derivation of these values.
Error IndicatorValue
Model Skill0.78
SI0.67
R0.61
BIAS−0.03
RMSE0.09
Table 3. Values of model parameters utilized in the coupled simulation of wave, current, and sediment.
Model ParameterValue
Time step (s)60
Number of time steps105,120
Directional discretization of wave16 directions in 360 degrees
Number of frequencies25
Minimum frequency (Hz)0.055
Delta parameter0.8
Bed roughness coeff.—Wave model0.002
White capping coefficient2
Bed roughness coeff.—Current model (Manning parameter)50
Average bed particle diameter200 microns
Sediment variation coefficient1.1
Roughness height—ST model0.02

