


Abstract
Typhoon avoidance is critical for ship maneuvering safety under extreme meteo-ocean conditions. This study proposes a data-driven framework that converts AIS trajectories into interpretable course deviation and speed change responses for navigational decision support. After AIS cleaning, temporal resampling, and matching with gridded wind, wave, and current fields, rule-based sliding-window and regression procedures, informed by experienced captains and company staff, automatically generate proxy labels for deviation and speed reduction. Samples are stratified by vessel size to reflect differences in inertia and maneuverability, and XGBoost classifiers are trained with simple resampling to mitigate class imbalance. The framework is demonstrated on a single-event case study of Typhoon Yagi in the South China Sea, covering 8609 vessels and reconstructed sailing fragments. On the test set, the deviation model achieves 89.8% accuracy and high recall for deviation cases, while the speed change model reaches 82% balanced accuracy under the proxy-label setting. Results suggest a scale-dependent response: smaller vessels exhibit more frequent course deviation, whereas larger vessels more often reduce speed under severe wind-wave loading. The framework offers a proof-of-concept approach to derive behavior-based indicators from AIS and environmental data and may support situational assessment under adverse weather.
1. Introduction
Maritime transport is the foundation of global logistics, moving close to 90% of international goods by volume [1]. As trade expands, maritime traffic is expected to keep growing, creating both economic opportunities and new challenges for safety and traffic management. One of the most serious threats to safe navigation comes from extreme weather events, especially typhoons. Under such conditions, vessels may deviate from their planned routes, reduce speed or wait in sheltered waters. These actions are essential for safety but produce irregular and complex movement patterns. Under normal conditions, trajectories often follow stable routes. In contrast, during strong winds, high waves, and unstable currents, behaviors become more diverse and harder to interpret. The difficulty lies not only in detecting such changes, but in understanding how they relate to vessel maneuverability, environmental forcing, and available sea room. Improving the ability to recognize typhoon avoidance behavior would support maritime awareness, traffic control and operational safety in risk-prone waters.
The Automatic Identification System (AIS), introduced under the International Convention for the Safety of Life at Sea (SOLAS), provides continuous and wide-coverage vessel movement data. It is mandated for all passenger ships, ships of 300 gross tonnage (GT) and above on international voyages, and cargo ships of 500 GT and above on non-international voyages [2]. Because of these advantages, AIS has become a key data source for research on vessel behavior and trajectory analysis, including traffic flows, risk assessment, and environmental impacts [3]. Many studies apply semantic trajectory mining to detect patterns and anomalies in ship movements [4]. However, most of this work focuses on normal operational conditions. Automatic recognition of avoidance behaviors during typhoons remains limited. A few case studies have examined how ships respond to hazardous scenarios, such as real-time multi-vessel risk assessment in maritime traffic surveillance [5]. These analyses provide useful insights but do not form a general or unified framework. In particular, the semantic modeling of course deviation and speed change behaviors under extreme weather has not been systematically developed. Challenges such as data imbalance, noisy signals, and limited labels further complicate the task. Furthermore, prior studies on AIS-based behavior recognition under adverse weather often do not jointly account for hydrodynamic constraints, vessel scale differences, and environmental variability, which are critical to modeling maneuvering responses under storm conditions.
To address these gaps, this paper proposes an integrated framework to analyze typhoon-related vessel response patterns using AIS data and external environmental fields. In this study, these response patterns are operationalized as proxy-defined avoidance behaviors, specifically course deviation and speed change. The framework is modular but connected: it uses an adaptive sliding-window procedure and simple rule-based criteria to detect and label speed change and course deviation episodes for both large and small vessels, and then trains an XGBoost model using these rule-based labels. Here, XGBoost mainly serves as a compact probabilistic model that learns to approximate the rule-based labeling on noisy and imbalanced AIS data, supporting efficient large-scale screening under consistent criteria. Accordingly, the main contribution of this study lies in the proxy-driven dual-behavior framework and vessel scale aware labeling strategy under typhoon conditions, rather than in proposing a novel classifier architecture. Therefore, the reported performance should be understood mainly as how well XGBoost matches the rule-based labels, rather than as a direct measure of true avoidance behavior. In this sense, the framework functions as an operational analysis tool; it applies consistent extraction and labeling logic, outputs probabilities that can be used for ranking and adjustable thresholds, and links the results to key vessel and environmental indicators in an interpretable way. The present study focuses on one typhoon case, Yagi in the South China Sea, and is intended as a first step toward broader validation across different events and regions.
This study serves as an initial step toward a more general framework for typhoon-related vessel behavior analysis. The main contributions of this study are as follows:
- (a)
- To develop an integrated AIS-based workflow for recognizing and screening both speed change and course deviation response patterns under typhoon conditions, linking vessel trajectories with environmental forcing fields.
- (b)
- To design a vessel scale aware adaptive sliding-window labeling strategy that differentiates large and small vessels, reducing missed detections while limiting over-labeling under noisy and irregular AIS sampling.
- (c)
- To train an XGBoost-based probabilistic surrogate on imbalanced and noisy AIS data to approximate rule-based labels, providing a compact and reusable rule compression model rather than an independently validated behavior detector.
- (d)
- To produce threshold-adjustable probability scores and interpretable feature-based outputs for scenario-conditioned screening, supporting efficient pattern-level analysis and maritime situational assessment in severe weather.
The remainder of the paper is organized as follows: Section 2 reviews related work on vessel behavior recognition, semantic trajectory analysis, and typhoon avoidance studies. Section 3 details the proposed methodology, including sliding-window detection, thresholding strategies, and classification. Section 4 presents experimental results, including model evaluation and a preliminary cross-event sanity check. Section 5 discusses limitations and contributions. Finally, Section 6 concludes the paper with key insights and directions for future research.
2. Literature Review
Conventional vessel monitoring methods, such as radar and visual observation, often suffer from high costs and limited coverage. With the advancement of big data and intelligent technologies, the AIS has become the primary source of maritime traffic information, providing continuous, stable, and high-frequency data for large-scale analysis. Early progress in marine spatial data infrastructures greatly improved the accessibility and interoperability of maritime information systems, laying the groundwork for AIS-based research [6,7]. These initiatives established standardized frameworks for coastal data collection and sharing, enabling the integration of AIS with other geospatial datasets. Building on this foundation, regional applications of AIS have demonstrated its effectiveness for waterway traffic analysis. For instance, Wu analyzed transportation dynamics in the southeast Texas waterway using AIS data, showing how spatiotemporal trajectories can reveal navigation efficiency and congestion patterns. This line of research illustrates the growing role of AIS in supporting maritime safety and operational planning [8].
This advantage has driven extensive research in recent years. Aarsæther and Moan used AIS data to estimate navigation patterns and extract traffic flow parameters [9]. Willems introduced an AIS-based revisualization method to support coastal surveillance and decision-making [10]. Zhang applied large-scale AIS data to analyze traffic demand and spatiotemporal dynamics in the Port of Singapore, demonstrating the applicability of AIS at the port level [11]. Silveira investigated traffic patterns along the Portuguese coast to assess collision risk, highlighting the value of AIS in maritime safety analysis [12].
Beyond traffic flow analysis, researchers have also explored vessel behavior modeling and semantic enrichment of trajectories. Wen developed a semantic model of vessel behavior based on maritime rules and applied dynamic Bayesian networks to infer potential actions [13]. Wan proposed a knowledge-graph-based semantic framework to identify illegal behaviors such as falsified ship identities [14]. Song introduced a cognitive space framework for semantic modeling, aiming to enhance the interpretability of maritime behavior [15]. Yan designed an intelligent route extraction method that converts AIS trajectories into semantic waypoints, providing a foundation for behavior recognition [16]. A comprehensive review of AIS-based intelligent navigation highlights the progress in behavior modeling, trajectory prediction, and anomaly detection, consolidating these diverse approaches into a unified perspective [17].
In efforts to improve the efficiency of AIS-based analysis, researchers have developed various methods for trajectory compression and feature extraction. Tang proposed an adaptive-threshold Douglas–Peucker algorithm that compresses trajectories while preserving critical information [18]. Building on this, Zhou introduced a multi-objective approach that incorporates spatial, directional, and kinematic features [19].
The sliding-window segmentation concept was first introduced for online time-series analysis [20], providing an efficient means of capturing local variations in sequential data. Building on this idea, sliding-window techniques have been widely employed to capture local dynamic characteristics in AIS trajectories. Gao and Shi applied an improved sliding-window method to extract spatiotemporal key points from AIS trajectories [21]. Sliding-window approaches remain essential for capturing temporal dynamics in streaming data, and recent advances in adaptive window normalization have further enhanced their stability under non-stationary conditions [22], supporting the applicability of these methods to complex maritime behavior analysis. Together, these methods demonstrate the versatility of AIS data for trajectory compression and feature extraction. However, most approaches still concentrate on routine navigation states, leaving complex avoidance maneuvers insufficiently addressed.
Recent advances in numerical navigation models have incorporated oceanic and atmospheric simulations to evaluate vessel performance under adverse weather conditions [23]. These studies enhance the physical understanding of ship maneuverability in dynamic sea states but do not directly address large-scale behavioral recognition from AIS trajectories. Data-driven analyses have also been applied to examine how typhoon evolution affects navigation safety. For instance, Wu developed a polar coordinate framework to quantify the impact of tropical cyclones on ship trajectories, revealing systematic deviations during storm encounters. Such studies highlight the growing potential of integrating meteorological and AIS data for understanding weather-induced vessel behavior [24].
Recent studies have also advanced intelligent ship navigation through collision-avoidance path planning that incorporates ship maneuverability and COLREGs [25], as well as learning-enhanced route planning methods (e.g., A* combined with DDQN) that integrate geographic and meteorological information [26]. However, these studies focus on prescriptive route planning and control, whereas the present study addresses post hoc recognition and screening of observed typhoon-related response patterns from AIS trajectories and metocean fields. AIS-based risk analysis has been actively studied, with recent work developing risk indicators from vessel motion and traffic patterns for safety assessment. However, avoidance behaviors under typhoon conditions remain insufficiently studied [27]. While maritime anomaly detection has been extensively reviewed in terms of data sources and methodological approaches [28], avoidance behaviors under typhoon conditions remain insufficiently studied. In particular, although AIS data have been widely used for traffic flow analysis, semantic modeling, and trajectory processing, limited attention has been paid to vessel responses under extreme weather. Existing methods provide effective tools for anomaly detection or trajectory compression but are not designed to capture the distinctive dynamics of typhoon avoidance. Addressing this gap requires integrating kinematic features from AIS trajectories with environmental information to develop dedicated models that can more accurately identify and classify vessel avoidance behavior.
This study presents a unified, data-driven framework for screening and scoring proxy-defined vessel avoidance response patterns under typhoon conditions using AIS data. Typhoon response often involves abrupt course deviations or speed changes, yet it has received limited systematic attention in existing maritime behavior studies. To address this gap, the proposed methodology establishes an end-to-end pipeline from AIS preprocessing to rule-based candidate detection and model-based classification, enabling scalable and automated identification of avoidance candidates for situational awareness.
3. Methodology
The methodology is structured in three major stages. As shown in Figure 1, the first stage preprocesses raw AIS trajectories by reconstructing, cleaning, and temporally aligning the data, followed by coordinate transformation from the WGS-84 system to the UTM projection. Non-navigational samples are removed, and the processed trajectories are integrated with meteorological variables such as wind, wave, and current. This step yields standardized AIS data where each AIS point is paired with the wind, wave, and current conditions at the same time and location, enabling subsequent analysis.
Figure 1.
Framework of vessel typhoon avoidance behavior recognition.
The second stage finds two typhoon-related response modes using two detectors, one for course deviation detection and one for speed change detection, with vessel-specific settings based on deadweight tonnage. In practice, we run course deviation detection first using regression-based track baselines, with a global method for large vessels and a local sliding window method for small vessels. The main thresholds were chosen during method development as conservative values that are larger than typical short-term AIS noise and that give stable candidate coverage. After deviation segments are found, we remove them before running speed change detection, which flags sustained speed adjustments using window-based speed fluctuation rules. This step-by-step design avoids counting the same turning episode twice and produces two non-overlapping labeled datasets for the two separate classifiers.
In the final stage, an XGBoost classifier is trained using dynamic, environmental, and static features. The dataset is balanced via Synthetic Minority Over-sampling Technique (SMOTE) resampling to mitigate class imbalance, and model optimization is achieved through tuned hyperparameters. Model interpretation is conducted using SHAP values, which elucidate the contribution of each feature to the prediction results and highlight how dynamic, environmental, and static variables jointly influence typhoon avoidance behaviors.
By integrating these three stages into a coherent pipeline, the framework provides a practical, interpretable, and scalable solution for screening and scoring typhoon-related avoidance candidates from AIS data.
3.1. Data Preprocessing
The AIS, widely applied in maritime monitoring, provides multidimensional vessel information, including the Maritime Mobile Service Identity (MMSI), geographic coordinates (latitude and longitude), speed over ground (SOG), course over ground (COG), navigational status, and timestamp. Compared with traditional monitoring approaches, AIS data offer significant advantages of high frequency, continuity, and broad coverage, making them a primary data source for analyzing vessel responses within typhoon-affected regions.
In this study, AIS data are used to capture short-term behavioral responses of vessels under typhoon conditions. Such responses depend heavily on meteorological factors and often exhibit strong temporal locality. For instance, when a vessel enters the peripheral wind field of a typhoon, its trajectory may display sudden course deviations, speed reductions, or drifting over a short duration. These trajectory changes can be considered indicative of avoidance maneuvers. Since avoidance behaviors are typically short-lived and highly dynamic, AIS data require high temporal resolution and spatial continuity. Noisy or incomplete data may obscure real responses and cause misjudgment during recognition or classification. Therefore, data cleaning and standardization are regarded as essential prerequisites before analysis.
- (a)
- Time Synchronization and Interpolation
AIS message intervals are not always uniform, resulting in temporal gaps within trajectories. To guarantee comparability across vessels, a time-domain interpolation method was applied to map all trajectories to a standardized time series. For short gaps (typically ≤5 min), linear interpolation was used to preserve continuity, following practices commonly adopted in AIS-based trajectory studies [29,30]. To further ensure cross-vessel comparability, the cleaned trajectories were resampled into fixed time intervals, yielding synchronized time series suitable for subsequent segmentation and analysis [31]. After interpolation for short gaps, we resampled each trajectory to a fixed time step of Δt = 2 min. This choice balances two competing needs: capturing short-lived avoidance responses while reducing variability caused by irregular AIS reporting intervals. Under this setting, the local window used in the detector corresponds to window-size times Δt minutes, which makes the segmentation time scale explicit and comparable across vessels. The choice of Δt is further justified by a sensitivity analysis reported in Section 4.3.
- (b)
- Standard AIS cleaning
Following established AIS preprocessing practices [29,30], we removed records with missing or invalid MMSI, position, or timestamps. We also filtered duplicate reports and physically implausible position jumps that can be caused by transmission errors. These steps reduce noise while preserving the trajectory structure needed for subsequent segmentation and behavior detection.
- (c)
- Integration of Meteorological Data
Vessel behaviors under typhoon conditions are shaped not only by their kinematic responses but also by the surrounding wind, wave, and current fields. In this study, wind fields are obtained from operational gridded products of the China Meteorological Administration (CMA) (0.25° × 0.25°, 3-hourly). Wave and surface-current fields are obtained from operational marine forecast products provided by the National Marine Environmental Forecasting Center (NMEFC). All fields are accessed through the company’s internal met-ocean database [32]. For each AIS record, the environmental variables are estimated at the ship location by inverse-distance weighting of the four surrounding grid points at the two nearest analysis times, and the values are linearly interpolated in time to the AIS timestamp.
Specifically, the value at time is
where
X(λ, ϕ, tk) denotes the target environmental variable at the ship location (λ, ϕ) and analysis time tk. Xi(tk) is the value at the surrounding grid point, di is the horizontal distance from the ship to that grid point, and wi is the inverse-distance weight satisfying.
For an AIS timestamp t between two consecutive analysis times t0 and t1, we then linearly interpolate in time between the two spatially interpolated values:
where α is the normalized time fraction between t0 and t1. Each AIS trajectory point is therefore associated with a consistently interpolated set of wind, wave, and current conditions. Each AIS trajectory point is associated with a consistently interpolated set of wind, wave, and current conditions, which form the environmental features listed in Table 1 for subsequent avoidance-behavior recognition.
Table 1.
Summary of vessel-level and segment-level counts.
The met ocean products are available at 3 hourly resolution, which matches the practical decision horizon of typhoon navigation where route adjustments and risk exposure evolve over hours rather than minutes. Our objective is to associate vessel kinematics with a consistent background forcing field, not to resolve minute-scale environmental fluctuations. Therefore, linear time interpolation between the two nearest analysis times is used to align each AIS record with coherent wind wave and current features, while we acknowledge that very rapid changes within a 3-h window cannot be represented by the gridded products.
- (d)
- Behavior Categorization and Avoidance Identification
After cleaning and environmental integration, AIS trajectories were used to classify vessel behaviors. Based on trajectory continuity, speed variations, and geographic context, typical behaviors were categorized as follows: normal sailing, berthing, anchoring, waiting, abnormal course deviation, and abnormal speed change. Among these, particular attention is given to short-term abnormal responses triggered by external meteorological disturbances, defined here as avoidance behaviors.
Avoidance behaviors differ significantly from conventional anomaly detection. Traditional methods often rely on historical trajectory comparison or multi-vessel clustering, assuming that deviations from statistical norms imply anomalies. However, avoidance under typhoon conditions is not solely dependent on historical features; it is driven by external weather changes that prompt vessels to make rapid and pronounced adjustments. Thus, trajectory-based analysis alone is insufficient, and real-time typhoon information must be incorporated for accurate recognition.
- (e)
- Definition of Typhoon Risk Area
A typhoon typically consists of the eye, eyewall, and surrounding wind fields. Vessel behavioral changes usually begin when entering the peripheral wind zone and become more pronounced near the strong winds of the eyewall. In this study, we adopt 13.9 m/s (Beaufort force 7) as an operationally defined and conservative wind threshold, consistent with typhoon avoidance practice that vessels should not enter the Beaufort-7 wind field; areas with wind speed ≥ 13.9 m/s are treated as the high-risk peripheral zone. This definition is used primarily for candidate AIS segment extraction rather than as an optimized physical hazard boundary.
Building on this, a “typhoon avoidance risk area” is defined as a circular region centered on the typhoon eye, with a radius
where
R7 denotes the Level-7 wind radius and ΔRbuffer represents an additional safety margin.
The buffer distance is determined by combining the operational experience of the partner shipping company with the uncertainty in the forecast of typhoon track and wind-field extent. According to company guidelines and master feedback, main routes are typically planned to maintain a separation of approximately 150–200 km outside the Level-7 wind field, providing room to absorb forecast errors and to execute advance rerouting or speed reduction. Considering the spatial scale of the study area and the layout of major routes, ΔRbuffer is set to 150 km as a typical lower-bound margin within the 150–200 km operational range to define the typhoon risk area used for data extraction. In this study, ΔRbuffer is used only to build a conservative candidate-extraction envelope, so that potentially affected AIS segments are not missed. It is not tuned to maximize detection performance and is not interpreted as a physical hazard boundary. The main analyses rely on the subsequent contracted-domain filtering; therefore, moderate changes in ΔRbuffer mainly affect sample coverage rather than the qualitative pattern contrasts.
A larger buffer or a lower wind threshold would include more AIS segments but may introduce more non-typhoon-related maneuvers (i.e., higher noise), whereas a smaller buffer or a higher threshold would reduce the candidate set but may miss early avoidance responses. Therefore, the selected threshold and buffer are intended to provide a pragmatic coverage–noise trade-off for screening, rather than an optimized configuration.
Although this spatiotemporal filtering reduces behaviors unrelated to the typhoon, some detected maneuvers may still be influenced by collision avoidance, local route constraints, obstacles, or sea-state limitations.
Vessels located within this risk area and simultaneously exhibiting course deviation or speed change patterns are flagged as candidate avoidance behaviors for subsequent modeling and further screening.
3.2. Deviation Detection
Under typhoon conditions, vessels often deviate from their original routes to mitigate risk, making trajectory-based course deviation detection a central task in avoidance behavior analysis. AIS provides continuous position records, enabling trajectory anomaly detection by measuring deviations from a data-driven baseline track. In this study, the baseline is estimated from the AIS trajectory itself using segmented (global) regression for large vessels and sliding-window (local) regression for small vessels. Under strong beam wind and following-sea conditions, the hydrodynamic turning moment increases, making small vessels more sensitive to heading disturbances. In contrast, large vessels exhibit delayed steering response due to greater inertia and deeper draught. These maneuvering constraints motivate the separation of deviation and speed change patterns, as course alterations require sufficient sea room, whereas speed regulation remains feasible even under restricted maneuvering conditions. To account for differences in vessel dynamics and sensitivity to environmental disturbances, this study divides vessels into two categories based on DWT: large vessels (DWT > 5000 t) and small vessels (DWT ≤ 5000 t), ensuring that detection methods align with vessel-specific maneuvering characteristics.
Large vessels are characterized by high inertia, deep draught, and large turning radii, which make their trajectories relatively stable. Minor local fluctuations do not necessarily indicate avoidance maneuvers, and simple local thresholds may either miss substantial course changes or be overly sensitive to noise. Therefore, a modified global segmented regression method is applied along the entire track to highlight pronounced deviation behavior. The AIS trajectory of each large vessel is treated as an ordered sequence of position records and divided into overlapping segments of fixed length (20 AIS points) with a step of 10 points between segment starts, corresponding to 50% overlap. Within each segment, a straight line is fitted to the longitude–latitude pairs by least squares, and the absolute residuals between observed positions and the fitted line are used as local deviation measures. Note that the longitude–latitude regression is applied locally over short trajectory segments and serves as a tangent approximation at the maneuver scale, rather than assuming a globally monotonic track. For each point on the track, residuals from all segments that cover this point are accumulated to obtain a cumulative deviation value, which is then normalized by the maximum cumulative deviation along the trajectory so that all values fall in the range [0, 1]. Finally, the empirical 0.9-quantile of the normalized cumulative deviations is used as a threshold: points belonging to the upper 10% of this distribution are flagged as deviation points, and consecutive flagged points are merged into continuous deviation segments for subsequent analysis.
In contrast, small vessels are more maneuverable and strongly influenced by wind and current forces, resulting in frequent small-scale oscillations in their trajectories. Applying the same global method used for large vessels risks misclassifying these normal disturbances as deviation events. To address this, a local sliding-window regression method is adopted for small vessels. Within short temporal windows, local linear fits approximate the expected trajectory, and deviations are calculated by comparing observed points with predicted positions. When deviations exceed a fixed threshold, the points are flagged as deviation points and treated as course deviation candidates under typhoon context. This rule-based flagging does not by itself verify true avoidance intent, but provides a consistent proxy for downstream analysis. The specific regression model and detection rules for both vessel types are summarized as follows. A limitation is that strongly nonlinear trajectories, such as looping or holding patterns, may be less well captured by a local linear baseline. In this study, non-navigating and low speed samples are removed during preprocessing, which reduces the occurrence of such patterns in the analyzed data.
The trajectory regression is modeled as a linear function:
where
- is the predicted latitude;
- x is the longitude;
- a, b are the regression coefficients.
The trajectory point deviation is defined as:
where
- is the deviation value;
- is the observed latitude.
The deviation detection rule for small vessels is given as:
where
- δ = 0.009, approximately equal to 1 km in the latitudinal direction.
For large vessels, local deviations obtained from the segmented regression are first accumulated along the track. Let Ei denote the cumulative deviation at point i, obtained by summing the deviation values from all regression segments that include this point. To make these values comparable along the trajectory, the cumulative deviations are normalized by the maximum value:
where
- Ei′ is the normalized cumulative deviation at point i.
The deviation detection rule for large vessels is defined as:
where
- Ei′ is the normalized cumulative deviation at the i point;
- θ = Q1−p() is the quantile threshold;
- p = 10%
When consecutive deviation points appear in the trajectory, the vessel is identified as being in the avoidance phase. When deviations return to normal levels, the vessel is considered to have exited the avoidance phase.
For large vessels, the deviation threshold is quantile-based (p = 10%) on a normalized cumulative deviation series, which makes the rule adaptive to trajectory scale and reduces dependence on an absolute tuned value. For small vessels, δ is set to approximately 1 km in the latitudinal direction to represent a clear cross-track displacement beyond typical short-term jitter, and it is not tuned to optimize classification metrics.
During development, we also examined heading-change and curvature-based features. However, we retained local regression residuals as the deviation proxy because they are more robust and comparable under heterogeneous AIS sampling rates and vessel-to-vessel variability.
When transferring to other regions or AIS qualities, δ can be rescaled to match local position noise and typical route width, while the quantile rule for large vessels can be kept to preserve its adaptive property.
3.3. Speed Change Detection
Vessels may also adjust their speed, either by deceleration or acceleration, to mitigate risks during typhoon conditions. Detecting speed change features in trajectories is therefore an important component of avoidance behavior analysis. Speed variations usually appear as local fluctuations within short time intervals. To capture such dynamics, a sliding-window method is applied. In this approach, a fixed-length window is set on the speed time series and moved sequentially forward. At each position, local statistics are computed to identify short-term fluctuations, helping to reduce the influence of uneven sampling and noise.
Different vessel types exhibit varying dynamic characteristics and sensitivities to disturbances. Under strong wind–wave forcing, propulsion load and added resistance increase substantially, especially in head-sea and quartering-sea conditions. Large vessels with greater displacement and deeper draught exhibit slower acceleration response due to higher inertia and engine governor lag, making speed regulation a more feasible avoidance strategy than abrupt course changes when maneuvering space is limited. By contrast, small vessels experience a stronger relative influence from wave-induced thrust variation and can modify speed more rapidly, but are also more prone to rapid heading adjustments. These hydrodynamic and propulsion-response differences motivate the vessel-type-specific speed change detection strategy adopted in this study.
Large vessels, due to high inertia, tend to show relatively smooth speed profiles. Minor fluctuations within short intervals may not correspond to avoidance maneuvers. If the entire window is labeled as a speed change, over-annotation may occur. To address this, large vessels adopt a fixed-threshold and center-point smoothing strategy: when conditions are met, only the center point and its immediate neighbors are labeled as speed change points.
In contrast, small vessels are more maneuverable and strongly affected by wind and waves, resulting in frequent fluctuations in their speed curves. If the large-vessel strategy is applied, many genuine avoidance maneuvers may be missed. Therefore, for small vessels we use a recall-first candidate extraction strategy, with false positives constrained by the density and consistency checks above and by subsequent screening. The threshold is chosen from {0.8, 1.0, 1.2, 1.5} conservatively as the lowest value that improves coverage without generating overly dense or unstable labels under the rule-based filtering described below.
In vessel motion analysis, speed variation can be calculated using the difference in speed between consecutive trajectory points, as expressed by:
where
- is the instantaneous rate of speed change, measured in knots per second (kn/s);
- and are the speeds at consecutive time points, measured in knots (kn);
- and are the corresponding timestamps.
This method reflects short-term speed changes; however, AIS data often suffer from uneven sampling intervals and measurement noise. Direct differencing can therefore produce instability and misclassification.
To address this issue, a sliding-window method is employed. With a window length of 5, the fluctuation of speed within the window is defined as:
where
- is the speed fluctuation, measured in knots (kn);
- is the maximum speed within the window, measured in knots (kn);
- is the minimum speed within the window, measured in knots (kn).
When the fluctuation exceeds a predefined threshold τ, the vessel is considered to be in a speed change episode. The detection rule is formulated as:
where
- is the label of the trajectory point at time t.
For large vessels, the threshold is fixed at 1.0 kn. When the condition is met, only the center point and its immediate neighbors are labeled as speed change points. For small vessels, the entire window is labeled when the condition is satisfied. The threshold is selected from the candidate set, and the value producing the largest number of detected speed change points is chosen as the final threshold.
3.4. XGBoost Classification
In this study, the gradient boosting tree model XGBoost was used to classify two types of avoidance behavior under typhoon conditions: speed change and course deviation. The model is not introduced for algorithmic novelty, but because it is robust, widely used and well suited to large AIS datasets. It can capture nonlinear relationships and provide feature importance, which helps to detect and interpret subtle vessel behavior patterns [33].
Before modeling, standardized preprocessing was applied. The raw AIS dataset contained dynamic information such as speed, course, position and timestamp, together with auxiliary identifiers. Non-behavioral fields (for example, MMSI and system_time) were removed. Categorical variables were encoded as numbers, invalid values (missing or infinite) were imputed using median values, and all variables were converted to a uniform data type to improve stability.
The rule-based sliding window and threshold methods described in Section 3 were first applied to assign deviation and speed change labels. These labels are generated automatically by the rule-based detection steps and used as training targets for XGBoost. They reflect the rule criteria applied to the AIS data and provide a consistent reference for learning probability scores of avoidance behavior. For speed change detection, the label behavior was set to 0 (normal) or 1 (speed-change). For course deviation detection, the label deviation was set to 0 (normal) or 1 (deviation). The dataset was split into training and testing subsets using an 80/20 stratified split to maintain the class ratio. To address class imbalance, SMOTE was applied to the training set to generate synthetic samples of the minority class and increase the representation of avoidance cases [34].
The classifier was trained using the binary logistic objective. Each iteration added a new tree to reduce the residual errors from the previous step. Key parameters included 300 trees, a learning rate of 0.05 and a maximum depth of 6, which gave a balance between accuracy and generalization.
The model produced both binary predictions and probability scores. Binary outputs were used to compute accuracy, precision, recall, F1 score and AUC, while the probability values allowed graded interpretation of avoidance likelihood. ROC curves were obtained by thresholding the predicted probabilities and sweeping the threshold from 0 to 1. In addition, XGBoost provided feature importance rankings, indicating which variables contributed most to the predicted behavior. Taken together, the XGBoost model, the preprocessing steps, the SMOTE-based imbalance correction and the vessel type stratification provide a structured basis for the behavioral analysis, which can be adapted to other regions after recalibration of detection thresholds and risk area definitions.
From an operational point of view, the classifier plays a complementary role to the rule-based detectors. Once the rules have been used to label a large historical archive, XGBoost learns a compact mapping from AIS and environmental features to avoidance probability. This allows faster evaluation than repeatedly running the full sliding window procedures online, smooths over noisy or partially observed patterns, and produces continuous risk scores and feature importance that are not directly available from the original threshold rules.
4. Model Validation
The case study in this research focuses on Typhoon Yagi, a tropical cyclone that developed on 1 September 2024 and dissipated on 8 September 2024, as shown in Figure 2. At its peak intensity, Yagi reached ten-minute sustained winds of 105 knots and a minimum central pressure of 915 hPa. The affected area included the Philippines, Hainan, Guangdong, Guangxi and Vietnam, covering much of the northern South China Sea and the Gulf of Tonkin. These waters are crossed by major shipping routes such as the central South China Sea passage, the Gulf of Tonkin approach and the corridor linking the Bashi Channel to the Strait of Malacca, which connect East Asia with Southeast Asia and onward to the Middle East and Europe.
Figure 2.
TC track [35].
During the passage of Typhoon Yagi, maritime traffic in these regions was noticeably disrupted. Many vessels deviated from their planned routes, reduced speed or anchored temporarily to avoid adverse conditions. Using AIS data collected during this event, the proposed framework was applied to identify deviation and speed change behavior under real typhoon influence. This case study is used to test the method in an extreme weather scenario and to examine its potential relevance for maritime safety in a high traffic, typhoon-prone region of the South China Sea.
The AIS trajectory dataset used in this study was provided by COSCO Shipping Technology Co., Ltd. (Shanghai, China). Following the method described in Section 3, the extraction region was centered on the eye of Typhoon Yagi at 08:00 on 5 September 2024. Consistent with the risk-area definition in Section 3.1(e), the spatial boundary was defined as the radius of the Level-7 wind field plus a safety buffer of 150 km. For implementation in the Yagi case, this circular risk area was approximated by a rectangular envelope constrained by the geographic coordinates 112.69° E, 15.40° N; 112.69° E, 22.60° N; 120.31° E, 22.60° N; and 120.31° E, 15.40° N. Within this region, a total of 8609 vessels were extracted, covering the period from 20:00 on September 4 to 20:00 on 5 September 2024. These vessels operated in close proximity to the typhoon, spanning different sea states and operational phases before, during, and after the storm. This sampling strategy ensured the inclusion of both stable trajectories and short-term abnormal responses, thereby providing a diverse and representative foundation for avoidance behavior modeling.
The dataset features can be broadly divided into three categories:
- (1)
- Static vessel information, including MMSI, vessel type, and draught, which remain constant during a voyage;
- (2)
- Dynamic motion parameters, such as SOG, COG, heading, and positional coordinates, which describe the evolving navigation state of vessels;
- (3)
- Environmental conditions, encompassing wind, wave, and current attributes that directly influence vessel responses under typhoon conditions. Specifically, wind speed and direction characterize atmospheric forcing; wave height and direction represent sea state; and current velocity and direction capture hydrodynamic influences. These environmental features are essential for linking trajectory changes to external disturbances.
Taken together, these three categories provide a comprehensive view of vessel navigation, combining intrinsic vessel characteristics with exogenous environmental drivers and forming the empirical basis for subsequent identification and modeling of avoidance behaviors.
4.1. Data Reconstruction
In preprocessing, AIS trajectories were reconstructed by MMSI, sorted by time, and merged into continuous movement records. A segment-integrity criterion was applied to keep structurally complete and temporally consistent fragments. Segments with abnormal reporting intervals, missing positions, or inconsistent navigation status were removed to improve data reliability for subsequent analysis.
Following the filtering in Section 3.1, a total of 1465 actively navigating vessels were retained inside the typhoon risk area. At this stage, this risk area is intentionally defined as a conservative extraction envelope, so it can still include many routine coastal traffic streams and port-approach routes that are not primarily driven by typhoon avoidance. Therefore, we adopt a two-stage spatial filtering strategy: (i) broad extraction in the typhoon risk area to avoid missing candidates, and (ii) a contracted core-impact domain to reduce dominance of normal transits and concentrate on segments more likely to reflect typhoon-related decisions.
Behavior labels were assigned in two steps. First, deviation labels were generated using the rules in Section 3.2: a vessel was marked as having deviation behavior if at least one deviation segment was detected along its track. Second, speed change labels were generated using Section 3.3 with the same vessel-level rule. Using the broad risk-area extraction, 156 vessels showed at least one deviation episode and 237 vessels showed at least one speed change episode; these values describe vessel-level occurrences, not the segment-level samples used later for model training and testing.
To identify the core-impact domain, we used DBSCAN++ trajectory clustering (implemented in Python 3.12) as a diagnostic of traffic structure inside the risk area. As shown in Figure 3, the pre-contraction domain contains dense nearshore corridors where many vessels continue to follow stable routes even under the broad risk-area condition. Including these routine transits directly in supervised modeling would mix avoidance-related behaviors with normal passage-plan movements and reduce the clarity of the learned patterns. To reduce this influence, the analysis domain was contracted by 200 km on each side while keeping the same geometric center. This produces a contracted domain that remains inside the typhoon risk area but focuses on the core region of stronger typhoon impact and clearer behavioral responses.
Figure 3.
Trajectories of the top 10 large and small vessels before contraction.
Within the contracted domain, 14 vessels exhibited at least one deviation episode and 76 vessels exhibited at least one speed change episode. These cases are treated as high confidence avoidance candidates for supervised modeling because they are flagged by the rule-based detectors under the typhoon context time window and within the contracted domain that reduces the dominance of routine corridor traffic. Manual inspection is used only as a sanity check to exclude obvious misclassifications and AIS artifacts, for example, trivial straight-line transits with no noticeable maneuvering, abnormal jumps, or fragmented records. Representative examples are shown in Figure 4 and Figure 5 as screenshots from the partner shipping company software for qualitative illustration. The route color styling follows the partner system’s internal visual display and is not used as evidence or as model input.
Figure 4.
Example course deviation candidate track 1.
Figure 5.
Example course deviation candidate track 2.
We note that course alterations and speed changes can also be caused by collision avoidance, local route requirements, traffic separation schemes, bathymetric constraints, obstacles, or operational limits under severe sea states. The contracted-domain selection reduces such confounding effects by removing much of the routine corridor traffic, but it does not eliminate them completely; therefore, the labels should be interpreted as typhoon-related avoidance candidates rather than definitive causal attributions.
4.2. Model Performance
Before presenting the classification results, the construction of the training and test sets is briefly described. The labeled trajectory segments were divided into training and test sets using an 80/20 split at the vessel level. First, the 14 deviation vessels and 76 speed change vessels were randomly assigned so that about 80% of the vessels were used for training and the remaining 20% for testing. All segments belonging to the same MMSI were then placed in the corresponding subset. In this way, trajectories from a given vessel appear entirely in either the training set or the test set, which prevents information leakage between the two.
After this MMSI-based split, the deviation-detection test set contained 698 segments (627 normal and 71 deviation), and the speed change test set contained 1971 segments (1075 normal and 896 speed-change). These counts correspond to the sample sizes shown in the confusion matrices.
Evaluation on the test set, as summarized in Table 2, showed that the deviation classifier achieved an overall accuracy of 89.8%, with recall rates of 92.5% for non-deviation samples and 66.2% for deviation cases. As illustrated in Figure 6, the confusion matrix indicates that of the 71 deviation samples, 47 were correctly identified while 24 were misclassified as normal sailing, alongside 580 correctly classified non-deviation instances and 47 false alarms. Although the model produced a modest precision of 0.50 for the minority class, this reflects the sparsity of deviation events and the difficulty of separating them from routine navigational fluctuations. Because deviation detection is used as a safety-oriented screening step, recall for deviation cases is a key concern: missing a deviation event may lead to underestimating risk under typhoon conditions. In contrast, occasional false alarms mainly increase downstream review or filtering effort. Since the model outputs probabilities, the decision threshold can be adjusted in practice to trade precision for higher recall when needed.
Table 2.
Performance metrics of the XGBoost deviation model.
Figure 6.
Confusion matrix of the deviation model on the test dataset.
As shown in Figure 7, the ROC curve for the deviation model, with an AUC of 0.93 and narrow bootstrap confidence intervals, indicates good discriminative power despite class imbalance.
Figure 7.
ROC curve of the deviation model (AUC = 0.93); the dashed diagonal line indicates the no-skill reference line.
AUC 95% CIs were estimated using bootstrap resampling with replacement on the fixed test segments (B = 200; seed = 42); percentile intervals (2.5th–97.5th) are reported, and resamples containing a single class were discarded.
To evaluate performance against strong lower bounds and to provide more comprehensive metrics under class imbalance, Table 3 reports majority and random baselines together with balanced accuracy, MCC, PR-AUC and ROC-AUC. XGBoost clearly outperforms these lower bounds while maintaining good discriminative power.
Table 3.
Performance comparison of the deviation classifier against strong lower-bound baselines.
As summarized in Table 4, the speed change classifier was evaluated on 1971 trajectory records, achieving an overall accuracy of 81.99%, with recall rates of 83.2% for non-speed change samples and 80.6% for speed change events. As shown in Figure 8, the confusion matrix indicates that out of 896 positive samples, 722 were correctly detected, while 174 were misclassified as normal sailing, alongside 894 correctly classified negative cases and 181 false alarms. Unlike the deviation task, precision and recall for the minority class were closely aligned, at 0.80 and 0.81, respectively, producing a balanced F1-score of 0.803.
Table 4.
Performance metrics of the XGBoost speed change model.
Figure 8.
Confusion matrix of the speed change model on the test dataset.
As shown in Figure 9, the smoothed ROC curve analysis confirmed that the model consistently distinguished speed change trajectories from stable ones, with performance stable across resampling iterations. The macro-averaged F1-score of 0.8185 demonstrates balanced detection across categories, and weighted averages near 0.82 indicate robust dataset-level performance. These results suggest that speed change behaviors—characterized by frequent and sustained fluctuations—are more evenly distributed in the dataset and therefore captured with higher balance compared to deviation behaviors.
Figure 9.
ROC curve of the speed change model (AUC = 0.89); the dashed diagonal line indicates the no-skill reference line.
To assess whether the proposed proxy-driven framework remains stable beyond a single event, we conducted a preliminary cross-typhoon comparison using Typhoon Kong-rey (2024). AIS samples for Kong-rey were extracted from 21:00 on 28 October 2024 to 21:00 on 29 October 2024, and the typhoon risk area was built using the same wind-radius-based buffer method as in Section 3.1. All preprocessing steps, features, detection rules, model structure, and hyperparameters were kept identical to those used for Typhoon Yagi.
Table 5 reports the performance for deviation and speed change pattern detection under both typhoons. The deviation task shows highly consistent accuracy (0.8983 for Yagi vs. 0.8996 for Kong-rey) with similar positive-class recall. For the speed change task, Kong-rey achieves higher accuracy and F1-score, which is plausibly related to its more constrained strait-type navigation environment.
Table 5.
Cross-typhoon comparison of deviation and speed change detection performance.
Figure 10 compares the ROC curves for speed change discrimination (AUC: 0.905 for Yagi; 0.942 for Kong-rey). Because the deviation ROC curves are nearly identical across events, only the speed change ROC comparison is shown.
Figure 10.
Comparison of ROC curves for speed change detection under Typhoon Yagi and Typhoon Kong-rey; the green dashed diagonal line indicates the no-skill reference line.
This comparison is not intended to claim behavioral generalization across typhoons, since event characteristics and fleet composition differ. Instead, it provides an initial indication that the framework preserves stable discrimination of proxy-defined operational response patterns under different typhoon scenarios.
4.3. Sensitivity and Robustness Analysis
To assess parameter uncertainty, we conduct a sensitivity analysis covering (i) the resampling time step used in preprocessing, (ii) key detector parameters for speed change identification, (iii) the DWT threshold used to define vessel-size groups, and (iv) representative XGBoost hyperparameters. Unless otherwise stated, all analyses use the same preprocessing pipeline and evaluation protocol as in the main experiments.
Table 6 reports the effect of varying the local window size (window_size ∈ {3, 5, 7}) and the large-vessel threshold parameter (τ_large ∈ {0.8, 1.0, 1.2}). Increasing window_size yields more detected behavior points (from 9423 up to 35,643) and slightly increases the number of vessels flagged as exhibiting speed change behavior (from 545 up to 745). For a fixed window_size, increasing τ_large reduces detection counts. Importantly, changes in counts are smooth and monotonic across the tested settings, indicating that the detector output does not depend on a single tuned choice and providing an uncertainty range for the reported detection statistics.
Table 6.
Sensitivity of the speed change detector.
We further discuss time granularity through the sensitivity analysis on the sliding-window length. Since the window length directly defines the temporal context used by the detector, varying it provides a practical test of robustness to the decision time scale. The results show smooth performance changes without abrupt degradation across the tested window sizes, indicating that the detected avoidance patterns are not an artifact of a single temporal configuration.
Table 7 evaluates DWT cut-offs of 4000/5000/6000 t for defining Small versus Large vessel groups. The overall avoidance rate remains highly consistent across thresholds (Small: 0.218–0.227; Large: 0.268–0.276), and the high-wind avoidance rate for large vessels is similarly stable (0.329–0.336). This suggests that the size-dependent contrasts are not driven by a specific DWT cut-off. In practice, the cut-off can be adjusted to match local fleet composition while remaining within a range where key rate summaries are stable. High-wind samples for small vessels are sparse in this dataset; therefore, the corresponding high-wind rate for small vessels is not statistically informative and is reported only for completeness.
Table 7.
Sensitivity of size-dependent avoidance rates to the DWT threshold.
We also assessed sensitivity to the resampling time step used in preprocessing. Because temporal resampling affects both trajectory smoothness and the effective time scale of sliding windows, we evaluated several candidate time steps under the same pipeline and fixed split. The results in Table 8 show that performance varies smoothly and the default choice remains a reasonable trade off between temporal detail and robustness.
Table 8.
Sensitivity to resampling time step Δt.
Finally, we tested robustness to representative XGBoost hyperparameters under a fixed split and identical preprocessing and SMOTE settings. Varying tree depth (max_depth ∈ {4, 6, 8}) and the number of boosting rounds (n_estimators ∈ {200, 300, 500}) yields smooth performance changes without instability (Table 9 and Table 10). Overall, the results suggest that the reported classifier performance is not driven by a single hyperparameter choice and remains consistent within a reasonable hyperparameter range.
Table 9.
XGBoost max_depth sensitivity.
Table 10.
XGBoost n_estimators sensitivity.
4.4. Feature Importance Analysis
While the models demonstrate strong classification performance, interpretability remains essential in safety-critical maritime applications. Understanding which factors are most associated with the predictions allows operators to trust the outputs and to better contextualize potential risk indicators. To this end, feature importance was examined to highlight the relative contributions of input variables for both deviation and speed change models.
For the deviation model, Figure 11 shows that longitude ranks highest by gain. We note, however, that raw spatial coordinates can partly capture spatial clustering and route-specific patterns in the dataset, and therefore should be interpreted as proxy variables rather than causal drivers of deviation behavior. Temporal continuity (time_diff) and vessel attributes such as draught and DWT also featured prominently, highlighting the sensitivity of the model to both navigation dynamics and physical vessel constraints. Environmental drivers, including wave_direction, wind_val, and stream_direction, collectively accounted for a significant share of model gain, reflecting how external forces influence trajectory divergence under typhoon conditions. Accordingly, we caution against over-interpreting longitude/latitude as causal factors; their importance may reflect where avoidance behaviors are observed rather than why they occur. This ranking is consistent with domain expectations in the sense that positional evolution combined with wind–wave forcing can be informative for deviation screening, while the absolute coordinates mainly provide geographic context.
Figure 11.
Feature importances of the deviation mode.
In contrast, Figure 12 shows that the speed change model placed the highest importance on draught, suggesting that vessel size and loading condition are key determinants of maneuverability and acceleration patterns. SOG ranked second, directly capturing instantaneous motion variability. Environmental and hydrodynamic variables—wind_direction, wave_val, stream_direction, and stream_val—were also consistently influential, indicating that speed adjustments often arise as adaptive responses to external forcing. Spatial coordinates (lon and lat) were included in the top ten but ranked lower than in the deviation model, reflecting that velocity fluctuations are less spatially localized than trajectory deviations. Similar to the deviation task, these coordinates are treated as contextual features and may reflect traffic geography rather than causal mechanisms of speed adjustment.
Figure 12.
Feature importances of speed mode.
To reduce the influence of spatial clustering, future work will replace raw longitude and latitude with relative location features. For example, we will use the distance to the typhoon center, the direction from the vessel to the typhoon center, the distance to the R7 wind-radius boundary, and the vessel’s offset from the main shipping route. These features keep useful location information but depend less on the absolute map position.
Taken together, these importance rankings demonstrate that deviation behaviors are primarily governed by spatial displacement under environmental stress, whereas speed change behaviors are shaped by vessel-specific attributes and dynamic responses to surrounding conditions. This interpretability analysis not only validates the models against maritime operational logic but also enhances their trustworthiness for deployment in safety-critical monitoring.
4.5. Environmental Response Thresholds
To better understand how meteorological conditions influence vessel avoidance behavior, the combined probability of deviation and speed change was analyzed with respect to wind speed and significant wave height. For each environmental variable, vessels were divided into two size groups (small and large) based on their DWT. The avoidance probability in each wind or wave interval was calculated as the proportion of samples that showed either deviation or speed-change. For every bin and vessel group, 95% confidence intervals were computed using the Wilson binomial method to ensure reliability under uneven sample distributions. The lower panels report the number of segments in each bin for small and large vessels, which is critical for judging uncertainty because bins with very few samples yield wide confidence intervals.
Figure 13 presents the relationship between wind speed and avoidance probability. The results indicate size-dependent differences, especially in bins with adequate sample support. Small vessels begin to respond earlier, and their avoidance probability increases sharply as wind speed rises into the mid-range, suggesting a proactive strategy under moderate wind conditions where sample counts are still substantial. Large vessels, in contrast, remain stable across most of the range and show a noticeable increase only at higher wind speeds. In the highest wind bins, the number of segments is limited and the confidence intervals widen substantially; therefore, estimates in these bins are not used to draw strong conclusions and are reported mainly as indicative trends. Overall, within the wind-speed range that has sufficient samples, the pattern suggests scale dependence: small vessels tend to respond earlier, whereas large vessels show clearer increases only at higher wind levels. In the extreme bins, this trend should be treated as tentative due to limited data.
Figure 13.
Avoidance probability under different wind speeds.
Figure 14 shows the relationship between significant wave height and avoidance probability. The results show a broadly similar tendency, again most reliable where sample counts are adequate. Small vessels are more sensitive to moderate waves and show an increase in avoidance probability as sea conditions worsen, with relatively narrow confidence bands where sample counts are high. Large vessels maintain stable behavior under lower and moderate waves and start reacting mainly when the wave height becomes high, again with larger uncertainty in the sparsely populated extreme bins, so the high-wave estimates should be interpreted as indicative rather than definitive. This difference suggests that, for wave-height bins with adequate support, wave-related avoidance may follow a similar size-dependent pattern to the wind case, with small vessels taking early action and large vessels responding later.
Figure 14.
Avoidance probability under different wave heights.
Overall, avoidance behavior is closely related to both the intensity of environmental stress and the physical scale of the vessel. The combined analysis of wind and wave responses supports the interpretation that small vessels tend to use early spatial or speed adjustments to reduce exposure, while large vessels depend more on controlled speed management when course changes are limited near the typhoon center. This interpretation is driven primarily by the mid-range bins with sufficient samples, whereas the extreme conditions remain uncertain due to limited observations.
4.6. Spatial Distribution of Avoidance Behaviors
Figure 15 shows the spatial distribution of deviation and speed change behaviors within the analysis region, starting from 300 km away from the typhoon center to the outer boundary. The upper panels represent deviation behaviors, while the lower panels show speed change behaviors. The left column displays overall density distributions, and the right column illustrates directional patterns within each distance ring.
Figure 15.
Spatial distribution of deviation and speed change behaviors.
For deviation, the results indicate that most behaviors are concentrated in the outer northwest part of the domain. This pattern suggests that vessels tend to alter their routes in the peripheral area of the typhoon, where there is more freedom to change course before the environmental conditions become too severe. Inside the 300 km radius, very few deviation cases appear, confirming that large-scale course changes are less feasible near the typhoon center.
For speed-change, the behaviors are more widely distributed and extend closer to the inner region. This shows that speed adjustment is a more common and flexible strategy under strong meteorological stress, especially when vessels cannot deviate significantly from their planned routes. The directional maps also reveal a concentration along the northwest and northeast sectors, which correspond to the main direction of typhoon movement and dominant wind influence.
Overall, the spatial comparison shows that deviation is mainly an outer-ring phenomenon, while speed change remains active even in the inner area. This difference reflects two complementary strategies for typhoon avoidance: course adjustment when spatial flexibility allows, and speed regulation when navigation space becomes limited.
4.7. Discussion of Behavioral Patterns
In the Typhoon Yagi case, deviation and speed change patterns show different sensitivities to spatial contraction and vessel type. When the analysis domain is contracted toward the storm core, deviation cases decrease more strongly than speed change events. This suggests that, for this event and region, course deviation is more often observed as an outer-domain response where maneuvering space and rerouting options are available, whereas speed regulation remains common under stronger wind–wave forcing. The deviation model’s reliance on positional and environmental-direction variables is consistent with this outer-domain tendency, but the exact spatial boundary may vary across events and traffic settings.
The contracted inner domain is dominated by large vessels, while small-vessel samples become scarce, which may reflect earlier withdrawal or rerouting at larger radii in this dataset. Large-vessel responses are more frequently expressed through speed adjustment, plausibly related to maneuvering limits such as inertia, draught, and turning efficiency under heavy-sea conditions. These observations motivate practical implications for scenario-conditioned decision support: for Yagi-like conditions, outer-domain monitoring may emphasize early deviation signals, while inner-domain monitoring may prioritize staged deceleration patterns for large vessels. However, these behavioral contrasts should not be treated as general rules, because thresholds, spatial distributions, and vessel-size effects can be event- and region-dependent. Our preliminary cross-typhoon check supports stable discrimination of the proxy-defined patterns, but it does not imply that the same spatial or scale-dependent mechanisms will hold across typhoons.
5. Limitations and Applicability
5.1. Limitations
The proposed framework is intended as a proxy-driven operational analysis tool for extracting and screening typhoon-related response patterns from AIS and environmental fields. Several limitations should be considered when interpreting the results.
- (i)
- Limited event diversity and scenario dependence.
Most analyses are based on Typhoon Yagi in the South China Sea, so the reported patterns and spatial results depend on this specific event and its local traffic timing. The preliminary cross-event check supports stable proxy-pattern discrimination, but it does not prove that spatial patterns, thresholds, or vessel-size effects generalize to other storms. Broader validation across more typhoons and regions is still needed.
- (ii)
- Dependence on local route structure and navigation constraints.
The observed responses are shaped by the local route network, traffic corridors, ports, and anchorages, which limit where deviation and short-term speed changes can occur. Different regions may have very different route geometry and traffic organization, so some spatial findings may not transfer directly.
- (iii)
- Filtering scope and low-speed patterns.
During preprocessing, we remove non-navigational and low-speed AIS points to focus on vessels that are actively moving. As a result, low-speed waiting, drifting, or looping patterns may appear less often in the data we analyze. The deviation detector also relies on a local straight-line baseline, so it may not describe strongly curved looping tracks well. Therefore, our results mainly reflect typhoon-conditioned responses shown as route changes and speed adjustment during active navigation.
- (iv)
- Confounding from non-typhoon operational drivers.
Speed changes and course alterations can also be caused by collision avoidance, passage plans and local rules, obstacles and coastal geography, or operational limits in rough seas. Using environmental forcing and a contracted risk domain helps, but it cannot fully remove these effects. Therefore, the extracted patterns should be read as typhoon-conditioned operational responses, not direct proof of intentional avoidance decisions.
- (v)
- Proxy labels and data resolution constraints.
Model training uses rule-based proxy labels, so performance mainly shows how well XGBoost matches the rules rather than true avoidance behavior. In addition, the metocean fields have moderate resolution and may miss fine-scale coastal extremes, which can affect local feature accuracy and spatial interpretation. In practice, finer temporal discretization may trigger earlier detections but can be more sensitive to irregular sampling noise, while coarser discretization yields smoother indicators but may delay responsiveness. The chosen settings focus on clear behavior signals for situation awareness, not very fast point-by-point alarms. This fits the partner’s work process, because typhoon monitoring and route changes are usually made every few hours, so signals that stay stable over several updates are more useful than changes that move up and down from minute to minute.
5.2. Contributions, Practical Implications, and Future Work
The proposed framework is intended as a proxy-driven analysis framework for extracting and screening typhoon-related ship response patterns from AIS trajectories and environmental fields. Its main value lies not in the algorithmic novelty of the classifier itself, but in the integration of rule-based proxy labeling, vessel scale aware behavior definition, and probabilistic screening into a consistent workflow for scenario-conditioned analysis. The key contributions and future directions are summarized as follows.
- (i)
- A proxy-driven dual-behavior framework for typhoon-related response recognition.
This study develops an end-to-end workflow that links AIS trajectories with typhoon-related environmental fields and identifies two operationally meaningful response patterns, namely course deviation and speed change, under consistent proxy definitions. By combining trajectory processing, feature construction, and behavior-oriented labeling, the framework provides a reproducible basis for pattern-level analysis and cross-scenario comparison.
- (ii)
- Vessel scale aware proxy labeling under noisy and irregular AIS sampling.
The framework uses rule-based sliding-window and regression procedures, informed by domain knowledge, to generate proxy labels for different response modes, while stratifying samples by vessel size to reflect differences in inertia and maneuverability. This design helps convert heterogeneous AIS observations into a structured learning problem and improves the interpretability of the extracted patterns.
- (iii)
- Probabilistic surrogate learning for operational screening and threshold tuning.
XGBoost is used as a compact probabilistic surrogate of the proxy labels, producing screening scores that can rank vessels by response likelihood and support threshold adjustment for different operational needs. In this study, XGBoost is selected for robustness, interpretability, and computational efficiency under proxy-labeled and imbalanced AIS data, rather than for algorithmic novelty. More advanced sequence, graph-based, or reinforcement learning methods may be introduced in future work as benchmark models when larger multi-event labeled datasets become available.
- (iv)
- Practical deployment potential and future validation needs.
For practical use, the framework can be extended to a rolling analysis setting by combining streaming AIS with updated typhoon and metocean data and refreshing features and screening scores continuously. Future work should address data latency, forecast uncertainty, and non-typhoon confounding factors (e.g., route constraints and traffic interactions), and should further evaluate generalizability across more typhoons, regions, and seasons. Where feasible, external checks such as expert review of selected segments or additional operational records would strengthen confidence in the relationship between proxy-defined patterns and real operational decisions.
6. Conclusions
This study develops an exploratory data-driven framework to recognize typhoon avoidance-related vessel behaviors from AIS data. The workflow combines trajectory reconstruction, rule-based labeling of course deviation and speed-change, and supervised classification using XGBoost. Feature-importance analysis further links the predictions to vessel and environmental variables, improving the interpretability of the decision logic.
Using Typhoon Yagi as a case study, we observe a clear scale-dependent pattern. Course deviation occurs more often in the outer domain where maneuvering space is available and smaller vessels tend to withdraw or reroute earlier. Speed change is more frequent in the inner domain, particularly for large vessels, for which inertia, draught, and route constraints may limit course alterations. These tendencies align with basic maneuvering considerations and the wind-wave distribution in the study area.
The framework is demonstrated on one event with proxy rule-based labels, so the quantitative findings should be interpreted as case-specific. The proposed workflow provides a practical way to convert AIS and environmental data into behavior-based indicators that can inform further analysis of typhoon responses. Future work will also include benchmarking against more advanced model families on larger multi-event datasets. Any operational deployment would require multi-event validation and expert review.
Author Contributions
X.S.: Conceptualization, Data curation, Methodology, Formal analysis, Writing—original draft. Writing—review and editing. J.Y.: Supervision, Writing—review and editing, Project administration, Funding acquisition. Y.G.: Validation, Investigation, Resources, Data curation. S.W.: Supervision, Project administration, Funding acquisition, Resources, Data curation. N.W.: Resources, Data curation, visualization. M.C.: Resources, Data curation, Supervision. X.L.: Resources, Data curation. All authors have read and agreed to the published version of the manuscript.
Funding
Supported by the National Natural Science Foundation of China (Grant No. 52472362), the Open Research Fund of State Key Laboratory of Maritime Technology and Safety (Grant No. W24CG000037).
Data Availability Statement
Restrictions apply to the datasets. The AIS data used in this study were obtained from an internal COSCO Shipping system and are subject to proprietary and confidentiality restrictions, as well as internal reporting or approval requirements. Therefore, the raw AIS data are not publicly available. The derived results and analyses are presented in the manuscript, and further details can be requested from the corresponding author subject to prior written permission from COSCO Shipping.
Acknowledgments
COSCO Shipping Technology Co., Ltd., provided assistance for data collection of this study. The authors are grateful for this help.
Conflicts of Interest
Authors Shaohan Wang, Min Chen, and Xinxin Liu were employed by COSCO Shipping Technology Co., Ltd. The remaining authors declare that the research was conducted in the absence of any commercial or financial relationships that could be construed as a potential conflict of interest.
References
- United Nations Trade and Development (UNCTAD). Review of Maritime Transport 2024: Navigating Maritime Chokepoints; Stylus Publishing, LLC: Sterling, VA, USA, 2024. [Google Scholar] [CrossRef] [Scilit]
- Mou, J.M.; van der Tak, C.; Ligteringen, H. Study on collision avoidance in busy waterways by using AIS data. Ocean Eng. 2010, 37, 483–490. [Google Scholar] [CrossRef] [Scilit]
- Yang, D.; Wu, L.; Wang, S.; Jia, H.; Li, K.X. How big data enriches maritime research—A critical review of Automatic Identification System (AIS) data applications. Transp. Rev. 2019, 39, 755–773. [Google Scholar] [CrossRef] [Scilit]
- Bogorny, V.; Avancini, H.; de Paula, B.C.; Kuplich, C.R.; Alvares, L.O. Weka-STPM: A Software Architecture and Prototype for Semantic Trajectory Data Mining and Visualization. Trans. GIS 2011, 15, 227–248. [Google Scholar] [CrossRef] [Scilit]
- Arneborg, L.; Höglund, A.; Axell, L.; Lensu, M.; Liungman, O.; Mattsson, J. Oil drift modeling in pack ice—Sensitivity to oil-in-ice parameters. Ocean Eng. 2017, 144, 340–350. [Google Scholar] [CrossRef] [Scilit]
- Osborne, M.J.; Pepper, J. Creating Marine Spatial Data Infrastructure for the UK. In Coastal and Marine Geospatial Technologies; Green, D.R., Ed.; Springer: Dordrecht, The Netherlands, 2010; pp. 51–55. [Google Scholar] [CrossRef] [Scilit]
- Pepper, J. Unlocking the marine data treasure chest. In Coastal and Marine Geospatial Technologies; Green, D.R., Ed.; Springer: Dordrecht, The Netherlands, 2010; pp. 57–64. [Google Scholar] [CrossRef] [Scilit]
- Wu, X.; Mehta, A.L.; Zaloom, V.A.; Craig, B.N. Analysis of waterway transportation in Southeast Texas waterway based on AIS data. Ocean Eng. 2016, 121, 196–209. [Google Scholar] [CrossRef] [Scilit]
- Gunnar Aarsæther, K.; Moan, T. Estimating Navigation Patterns from AIS. J. Navig. 2009, 62, 587–607. [Google Scholar] [CrossRef] [Scilit]
- Willems, N.; Van De Wetering, H.; Van Wijk, J.J. Visualization of vessel movements. Comput. Graph. Forum 2009, 28, 959–966. [Google Scholar] [CrossRef] [Scilit]
- Zhang, L.; Meng, Q.; Fang Fwa, T. Big AIS data based spatial-temporal analyses of ship traffic in Singapore port waters. Transp. Res. Part E Logist. Transp. Rev. 2019, 129, 287–304. [Google Scholar] [CrossRef] [Scilit]
- Silveira, P.A.M.; Teixeira, A.P.; Soares, C.G. Use of AIS Data to Characterise Marine Traffic Patterns and Ship Collision Risk off the Coast of Portugal. J. Navig. 2013, 66, 879–898. [Google Scholar] [CrossRef] [Scilit]
- Wen, Y.; Zhang, Y.; Huang, L.; Zhou, C.; Xiao, C.; Zhang, F.; Peng, X.; Zhan, W.; Sui, Z. Semantic Modelling of Ship Behavior in Harbor Based on Ontology and Dynamic Bayesian Network. ISPRS Int. J. Geo-Inf. 2019, 8, 107. [Google Scholar] [CrossRef] [Scilit]
- Wan, H.; Fu, S.; Zhang, M.; Xiao, Y. A Semantic Network Method for the Identification of Ship’s Illegal Behaviors Using Knowledge Graphs: A Case Study on Fake Ship License Plates. J. Mar. Sci. Eng. 2023, 11, 1906. [Google Scholar] [CrossRef] [Scilit]
- Song, R.; Wen, Y.; Tao, W.; Zhang, Q.; Papadimitriou, E.; van Gelder, P. Semantic Modeling of Ship Behavior in Cognitive Space. J. Mar. Sci. Eng. 2022, 10, 1347. [Google Scholar] [CrossRef] [Scilit]
- Yan, Z.; Xiao, Y.; Cheng, L.; He, R.; Ruan, X.; Zhou, X.; Li, M.; Bin, R. Exploring AIS data for intelligent maritime routes extraction. Appl. Ocean. Res. 2020, 101, 102271. [Google Scholar] [CrossRef] [Scilit]
- Tu, E.; Zhang, G.; Rachmawati, L.; Rajabally, E.; Huang, G.-B. Exploiting AIS data for intelligent maritime navigation: A comprehensive survey from data to methodology. IEEE Trans. Intell. Transp. Syst. 2017, 19, 1559–1582. [Google Scholar] [CrossRef] [Scilit]
- Tang, C.; Wang, H.; Zhao, J.; Tang, Y.; Yan, H.; Xiao, Y. A method for compressing AIS trajectory data based on the adaptive-threshold Douglas-Peucker algorithm. Ocean Eng. 2021, 232, 109041. [Google Scholar] [CrossRef] [Scilit]
- Zhou, Z.; Zhang, Y.; Yuan, X.; Wang, H. Compressing AIS Trajectory Data Based on the Multi-Objective Peak Douglas–Peucker Algorithm. IEEE Access 2023, 11, 6802–6821. [Google Scholar] [CrossRef] [Scilit]
- Keogh, E.; Chu, S.; Hart, D.; Pazzani, M. An online algorithm for segmenting time series. In Proceedings of the 2001 IEEE International Conference on Data Mining, San Jose, CA, USA, 29 November–2 December 2001; IEEE: New York, NY, USA, 2001; pp. 289–296. [Google Scholar] [CrossRef] [Scilit]
- Gao, M.; Shi, G.-Y. Ship spatiotemporal key feature point online extraction based on AIS multi-sensor data using an improved sliding window algorithm. Sensors 2019, 19, 2706. [Google Scholar] [CrossRef] [Scilit]
- Papageorgiou, G.; Tjortjis, C. Adaptive sliding window normalization. Inf. Syst. 2025, 129, 102515. [Google Scholar] [CrossRef] [Scilit]
- Chen, C.; Shiotani, S.; Sasa, K. Numerical ship navigation based on weather and ocean simulation. Ocean Eng. 2013, 69, 44–53. [Google Scholar] [CrossRef] [Scilit]
- Wu, J.; Meng, X.; Hu, S.; Zhou, J.; Yin, J. Typhoon evolution characteristics and influence on ship navigation with polar coordinate data-driven: A case of historical tropical cyclone trajectory. Ocean Eng. 2025, 340, 122256. [Google Scholar] [CrossRef] [Scilit]
- He, Y.; Li, Z.; Mou, J.; Hu, W.; Li, L.; Wang, B. Collision-avoidance path planning for multi-ship encounters considering ship manoeuvrability and COLREGs. Transp. Saf. Environ. 2021, 3, 103–113. [Google Scholar] [CrossRef] [Scilit]
- Chen, X.; Hu, R.; Luo, K.; Wu, H.; Biancardo, S.A.; Zheng, Y.; Xian, J. Intelligent ship route planning via an A* search model enhanced double-deep Q-network. Ocean. Eng. 2025, 327, 120956. [Google Scholar] [CrossRef] [Scilit]
- Bai, X.; Cheng, L.; Iris, Ç. Data-driven financial and operational risk management: Empirical evidence from the global tramp shipping industry. Transp. Res. Part E Logist. Transp. Rev. 2022, 158, 102617. [Google Scholar] [CrossRef] [Scilit]
- Riveiro, M.; Pallotta, G.; Vespe, M. Maritime anomaly detection: A review. WIREs Data Min. Knowl. Discov. 2018, 8, e1266. [Google Scholar] [CrossRef] [Scilit]
- Liu, Y.; Shi, Z.; Fu, B.; Xu, H.; Wu, H. Marine Trajectory Reconstruction Method Based on Navigation State Recognition and Bi-Directional Kinematic Interpolation. J. Mar. Sci. Eng. 2024, 12, 2164. [Google Scholar] [CrossRef] [Scilit]
- Lv, T.; Tang, P.; Zhang, J.; Ding, B.Y. A Real-Time AIS Data Cleaning and Indicator Analysis Algorithm Based on Stream Computing. Sci. Program. 2023, 2023, 8345603. [Google Scholar] [CrossRef] [Scilit]
- Zhao, L.; Jiang, X.; Lu, W.; Kang, L.; Wang, Y. Research on shipping statistics method based on AIS big data mining analysis. In Proceedings of the Fourth International Conference on Geology, Mapping, and Remote Sensing (ICGMRS 2023), Wuhan, China, 14–16 April 2023; SPIE: Bellingham, WA, USA, 2024; pp. 283–292. [Google Scholar] [CrossRef] [Scilit]
- World Meteorological Centre Beijing (WMC Beijing). CMA Upgrades Its Global Forecasting System; National Meteorological Centre, China Meteorological Administration: Beijing, China, 2023. (Updated 8 Mar 2023). Available online: https://www.wmc-bj.net/publish/cms/view/wmcbj_a6684add56eb4a92973b7680920af593.html (accessed on 15 February 2026).
- Chen, T.; Guestrin, C. XGBoost: A scalable tree boosting system. In Proceedings of the 22nd ACM SIGKDD International Conference on Knowledge Discovery and Data Mining, San Francisco, CA, USA, 13–17 August 2016; Association for Computing Machinery: New York, NY, USA, 2016; pp. 785–794. [Google Scholar] [CrossRef] [Scilit]
- Chawla, N.V.; Bowyer, K.W.; Hall, L.O.; Kegelmeyer, W.P. SMOTE: Synthetic Minority Over-sampling Technique. J. Artif. Intell. Res. 2002, 16, 321–357. [Google Scholar] [CrossRef] [Scilit]
- Supportstorm. Yagi 2024 track.png (Track Map of Typhoon Yagi (Enteng), 2024 Pacific Typhoon Season); Wikimedia Commons, 2024. Available online: https://commons.wikimedia.org/wiki/File:Yagi_2024_track.png (accessed on 15 February 2026).
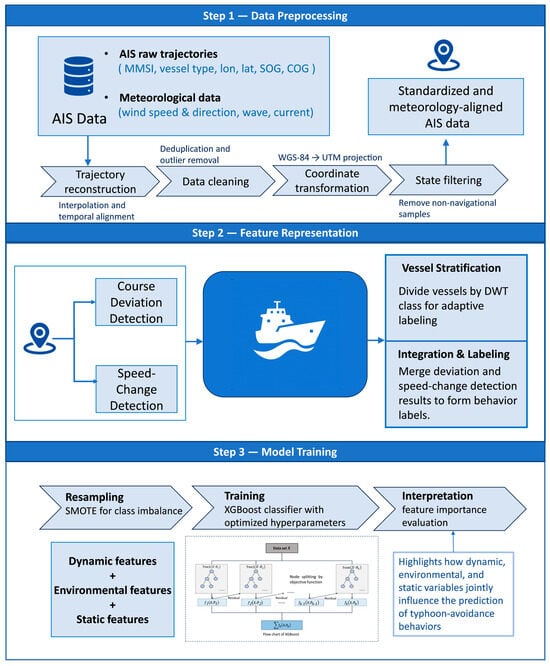
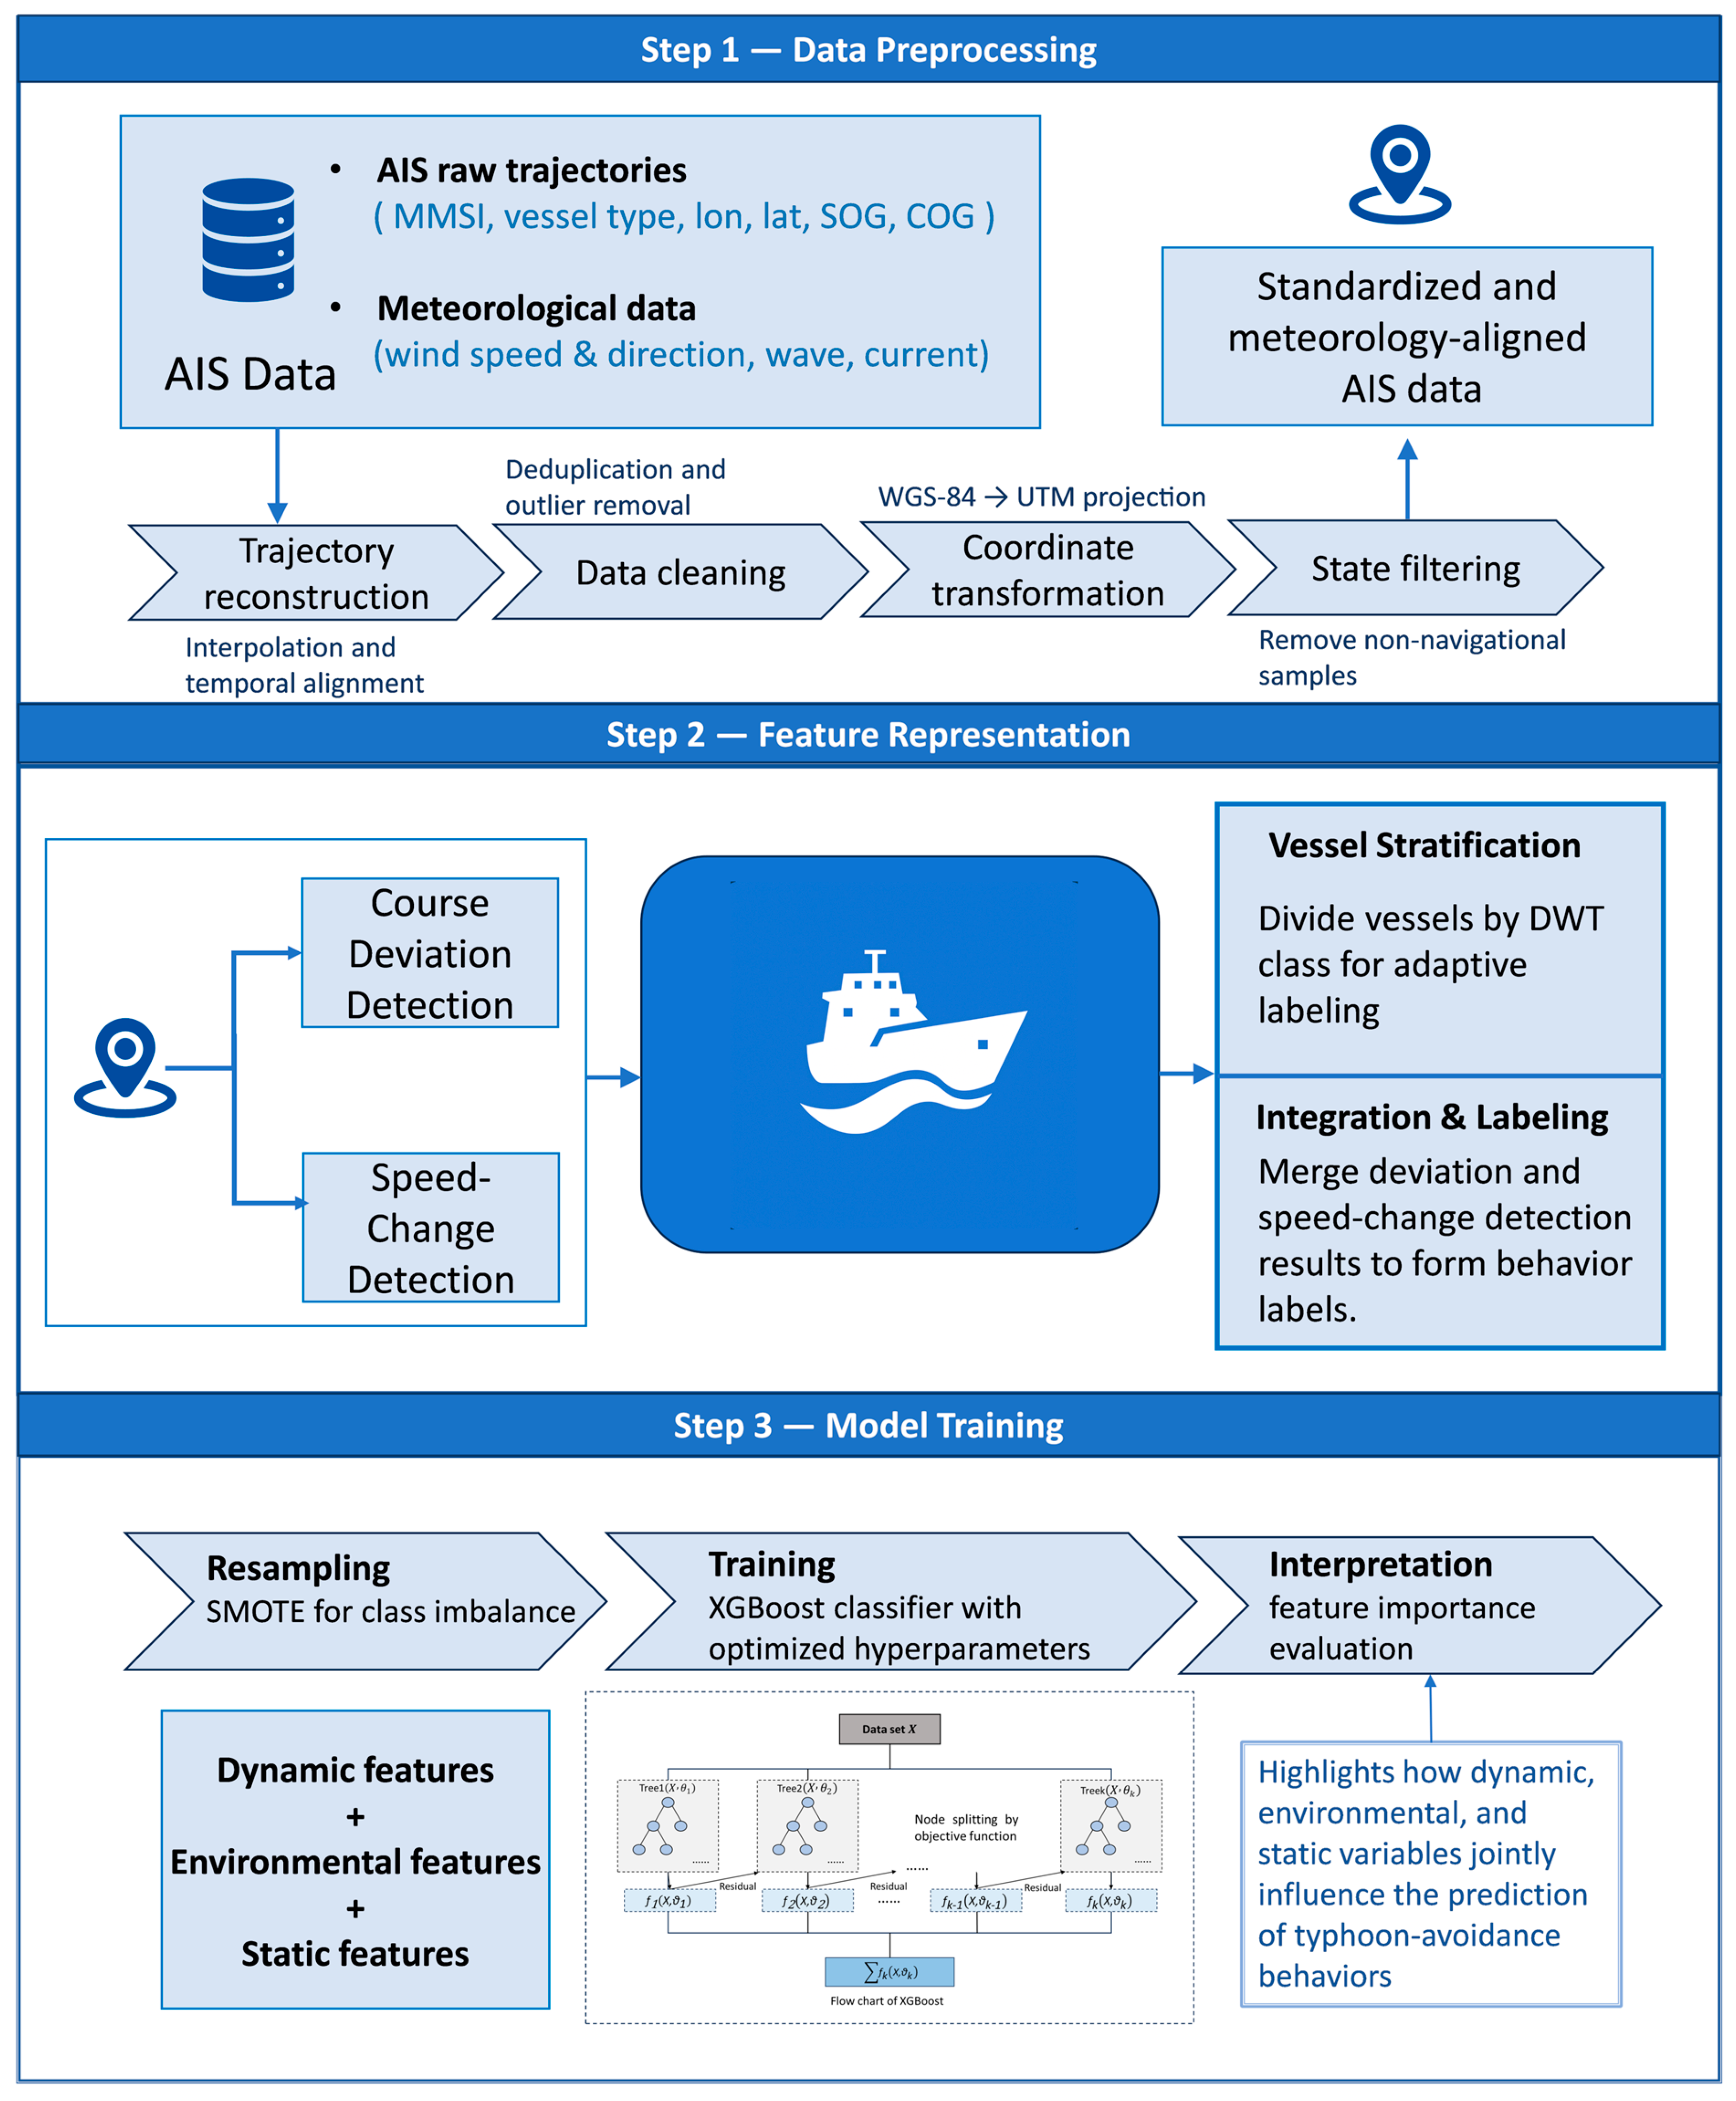
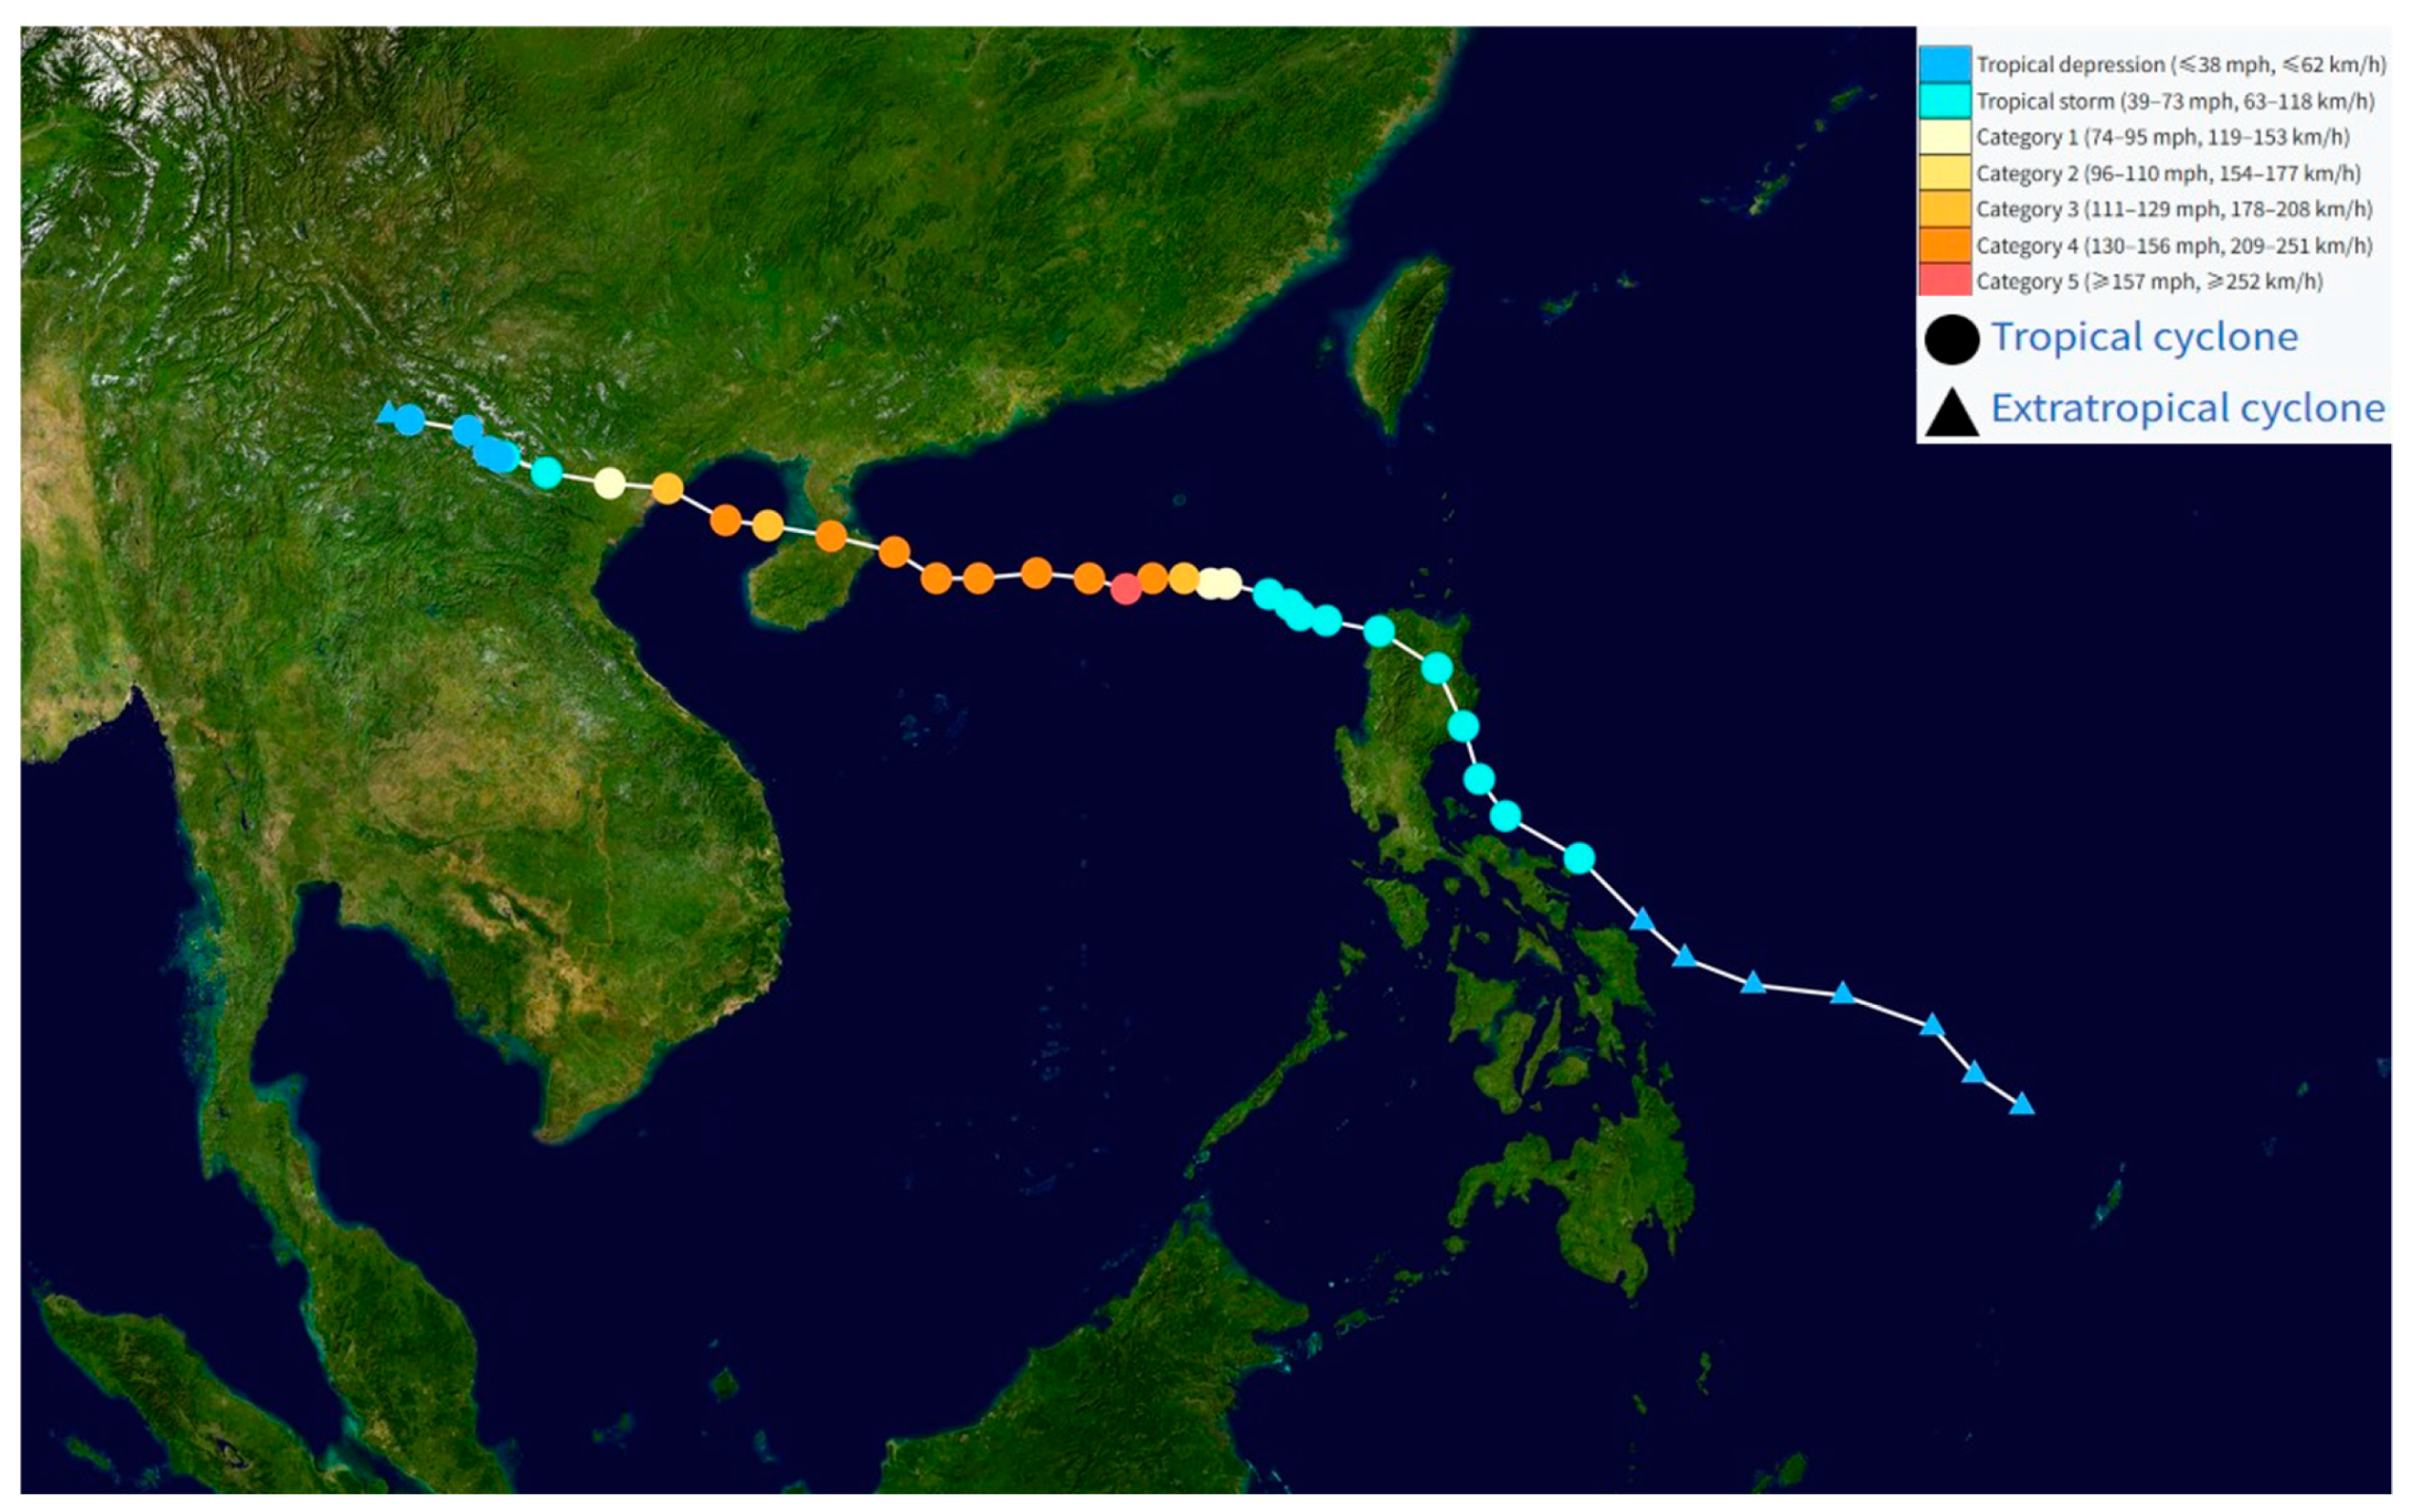
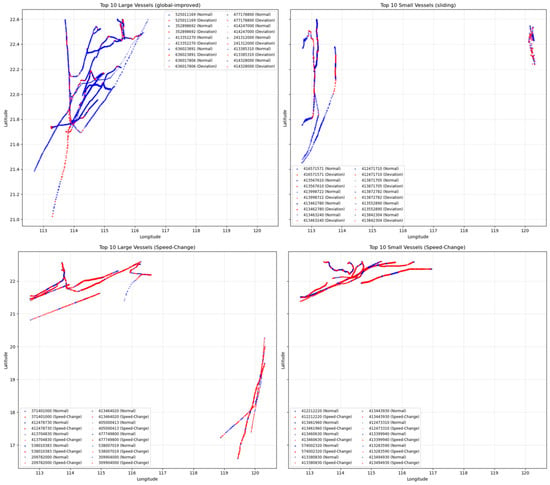
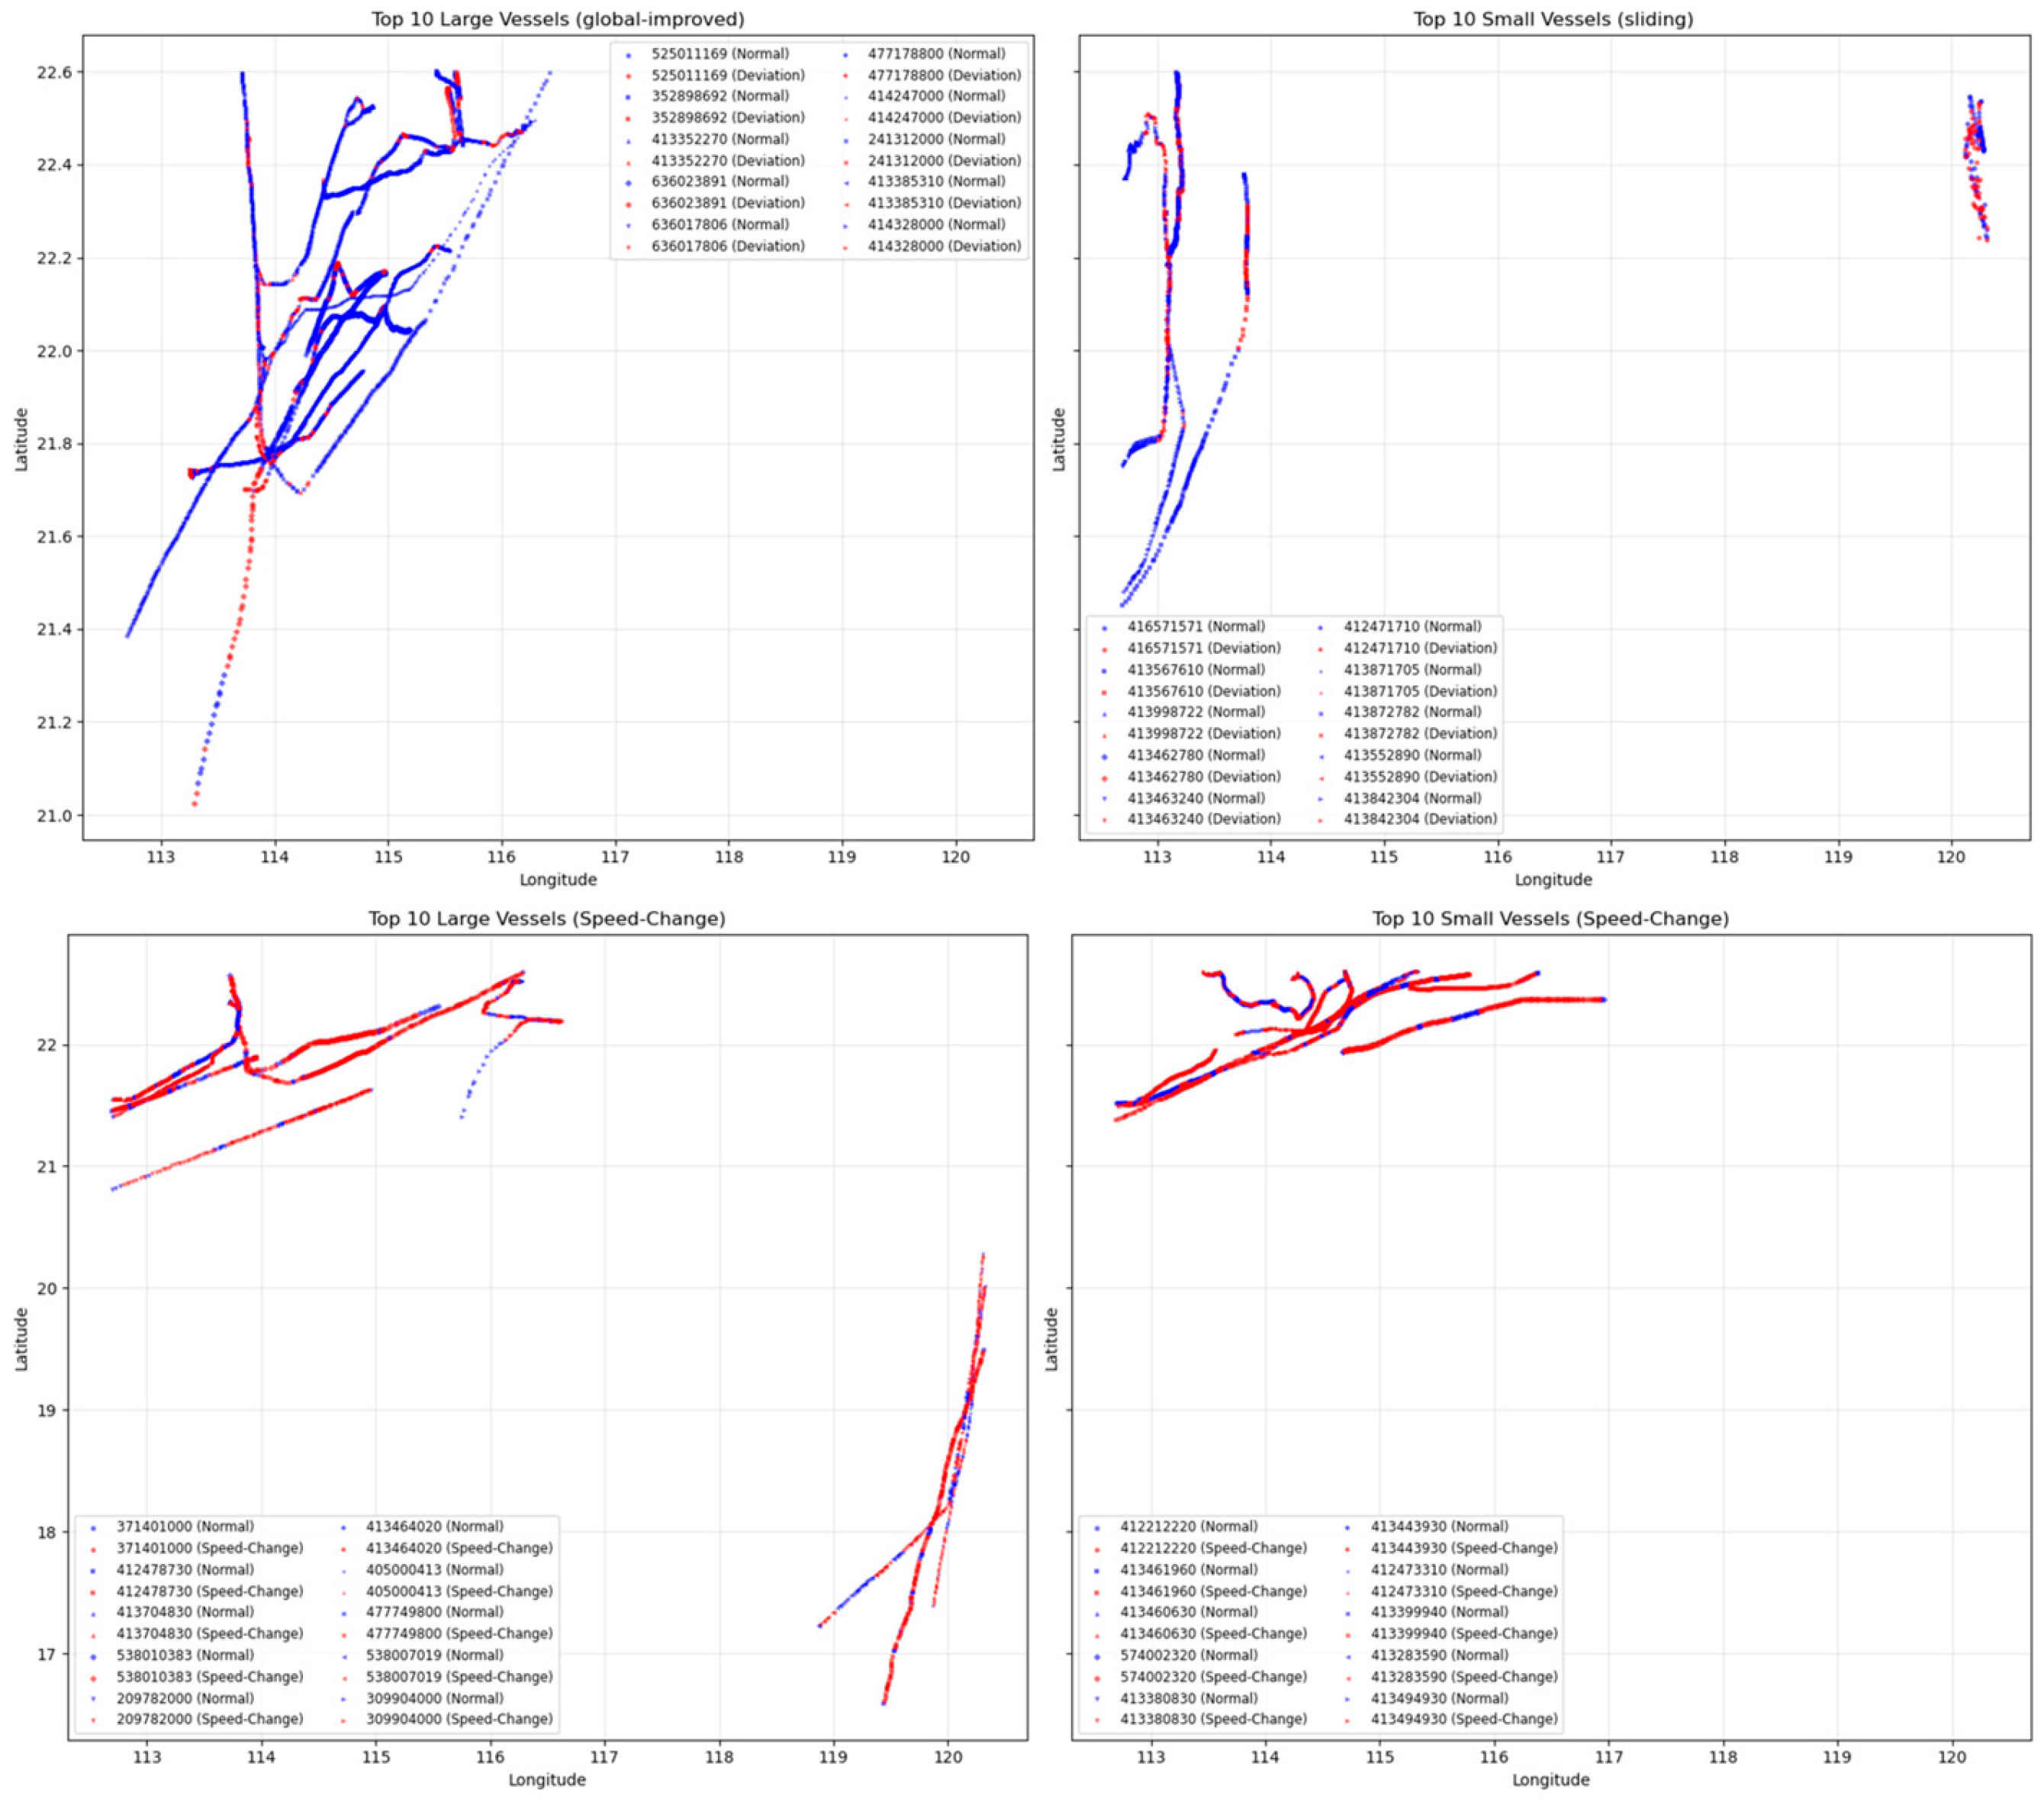
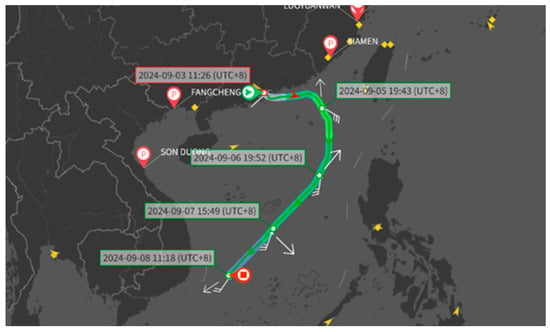
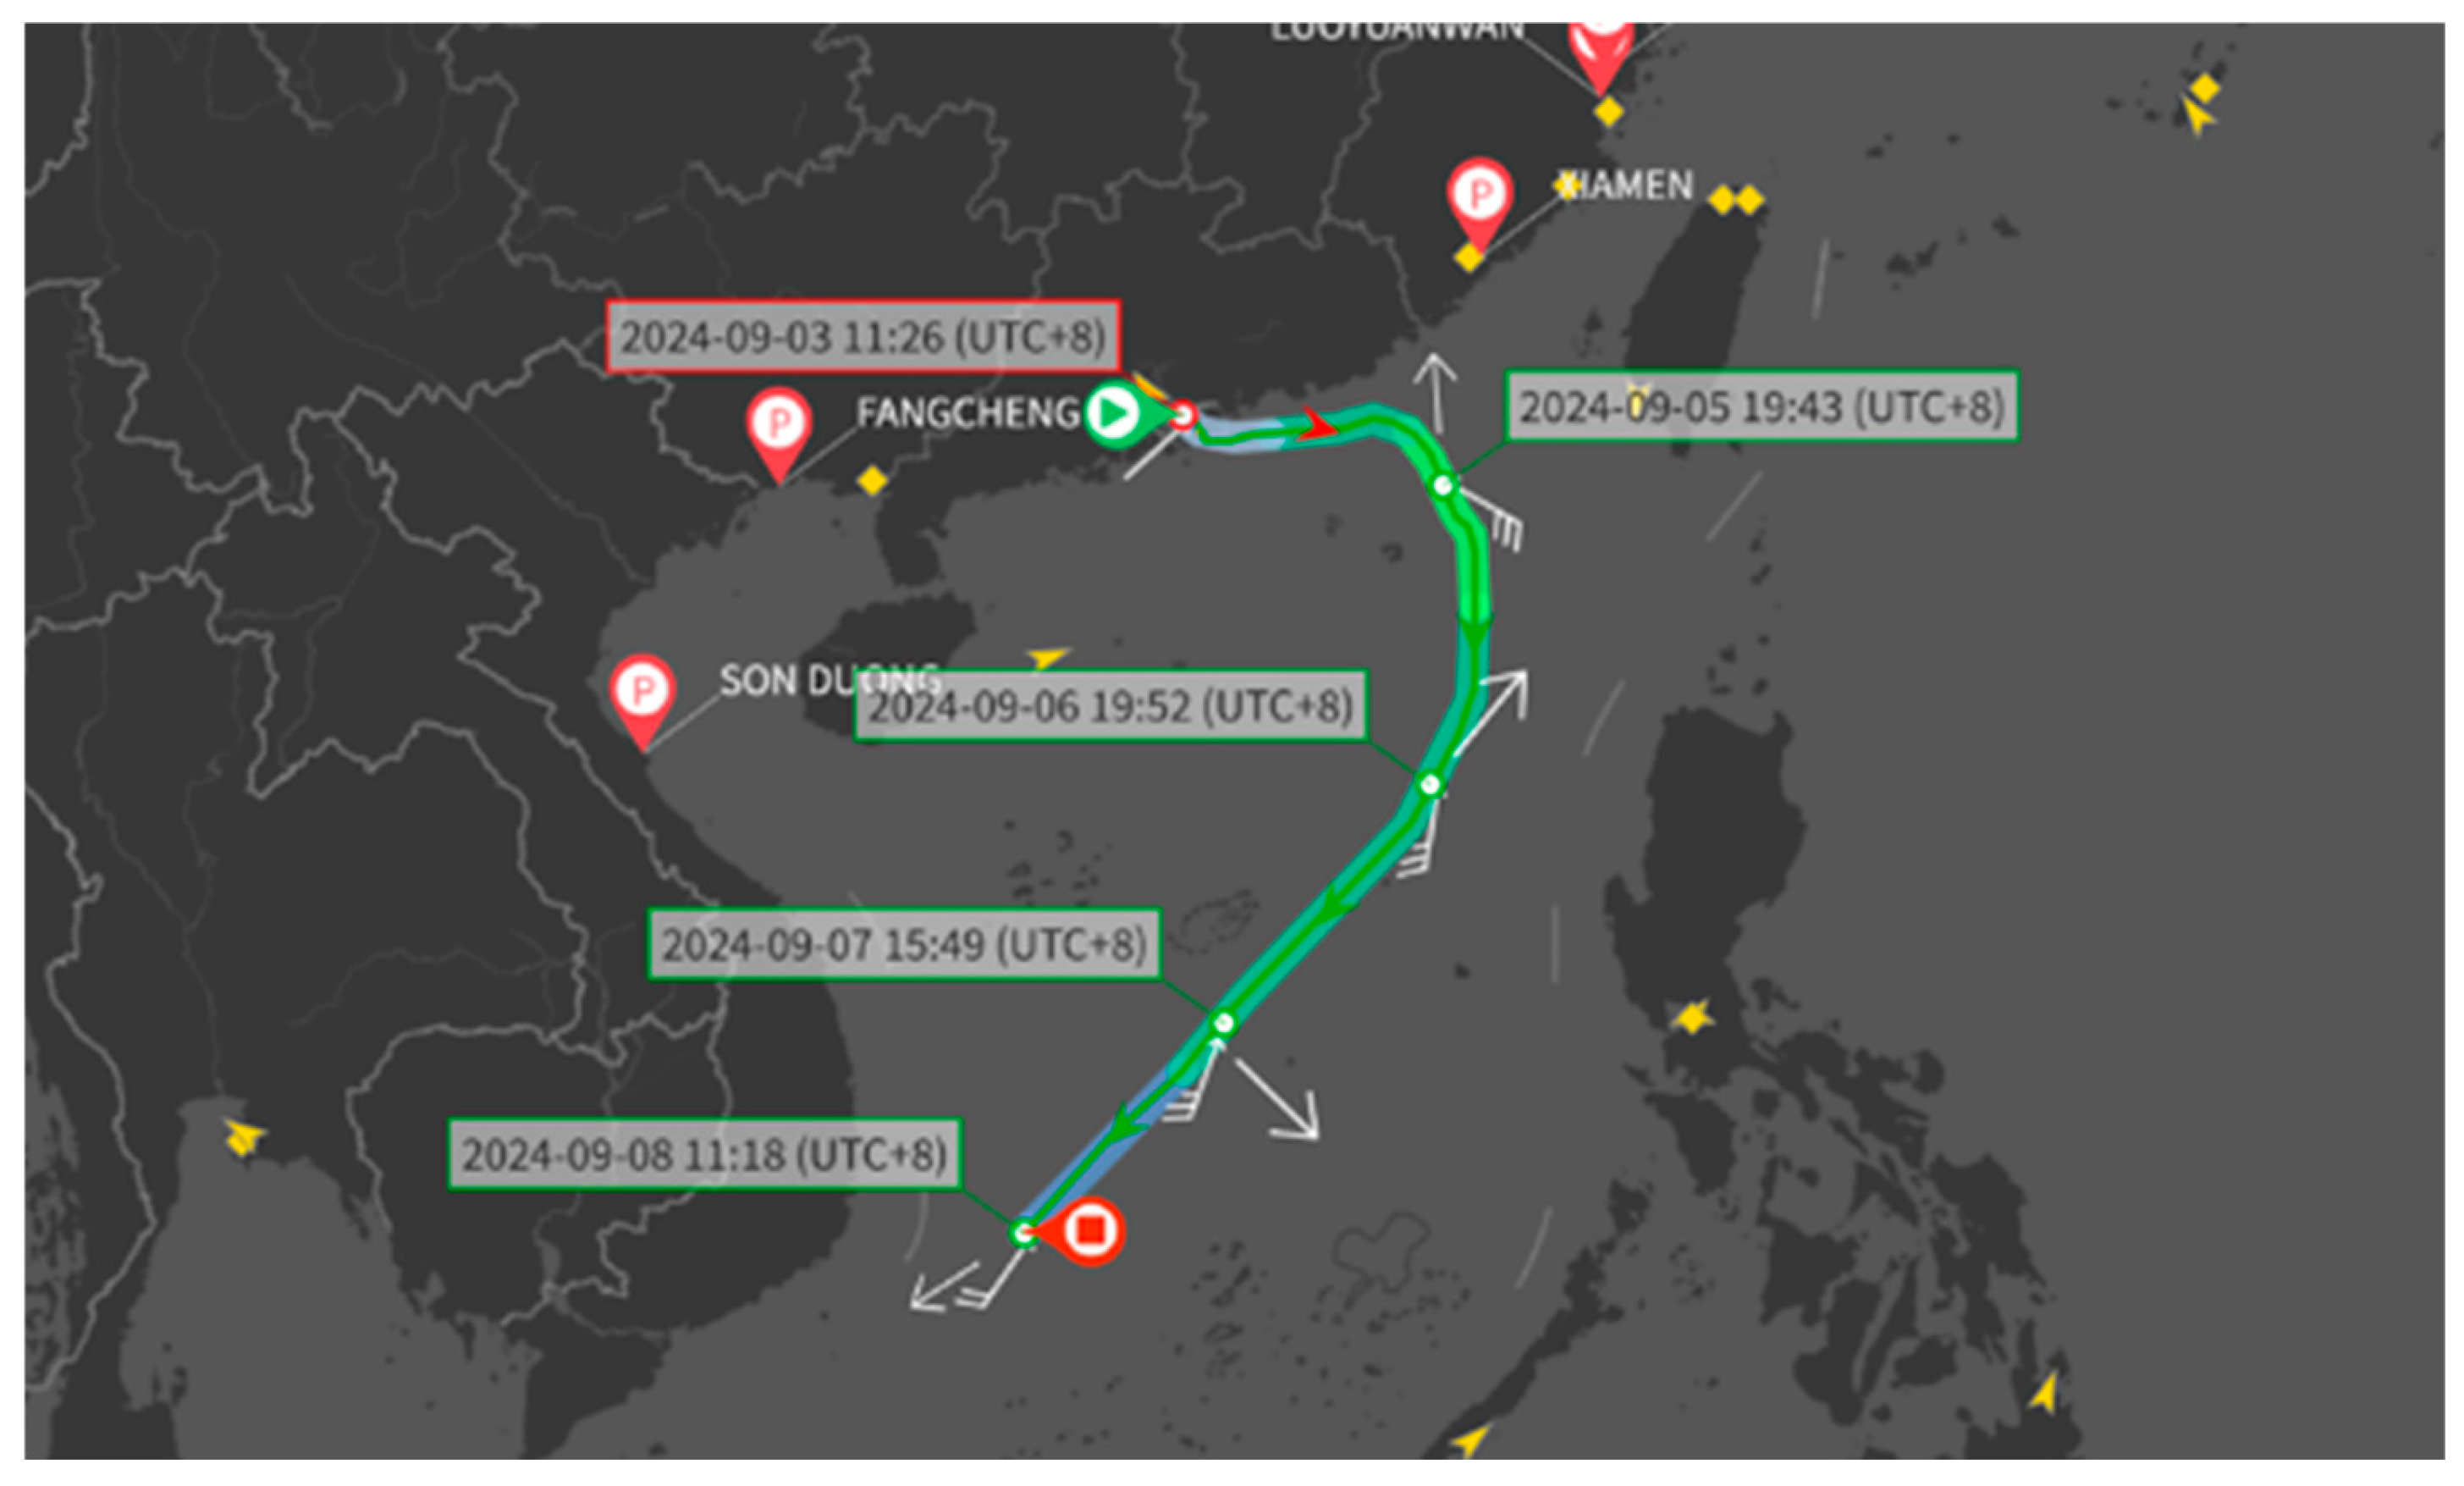
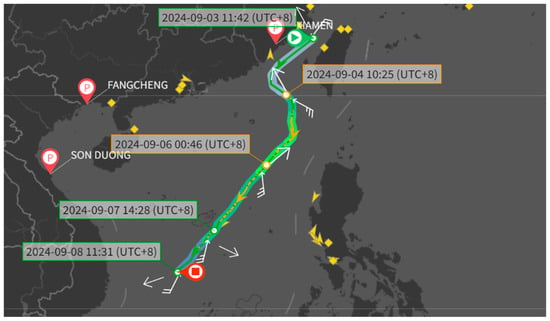
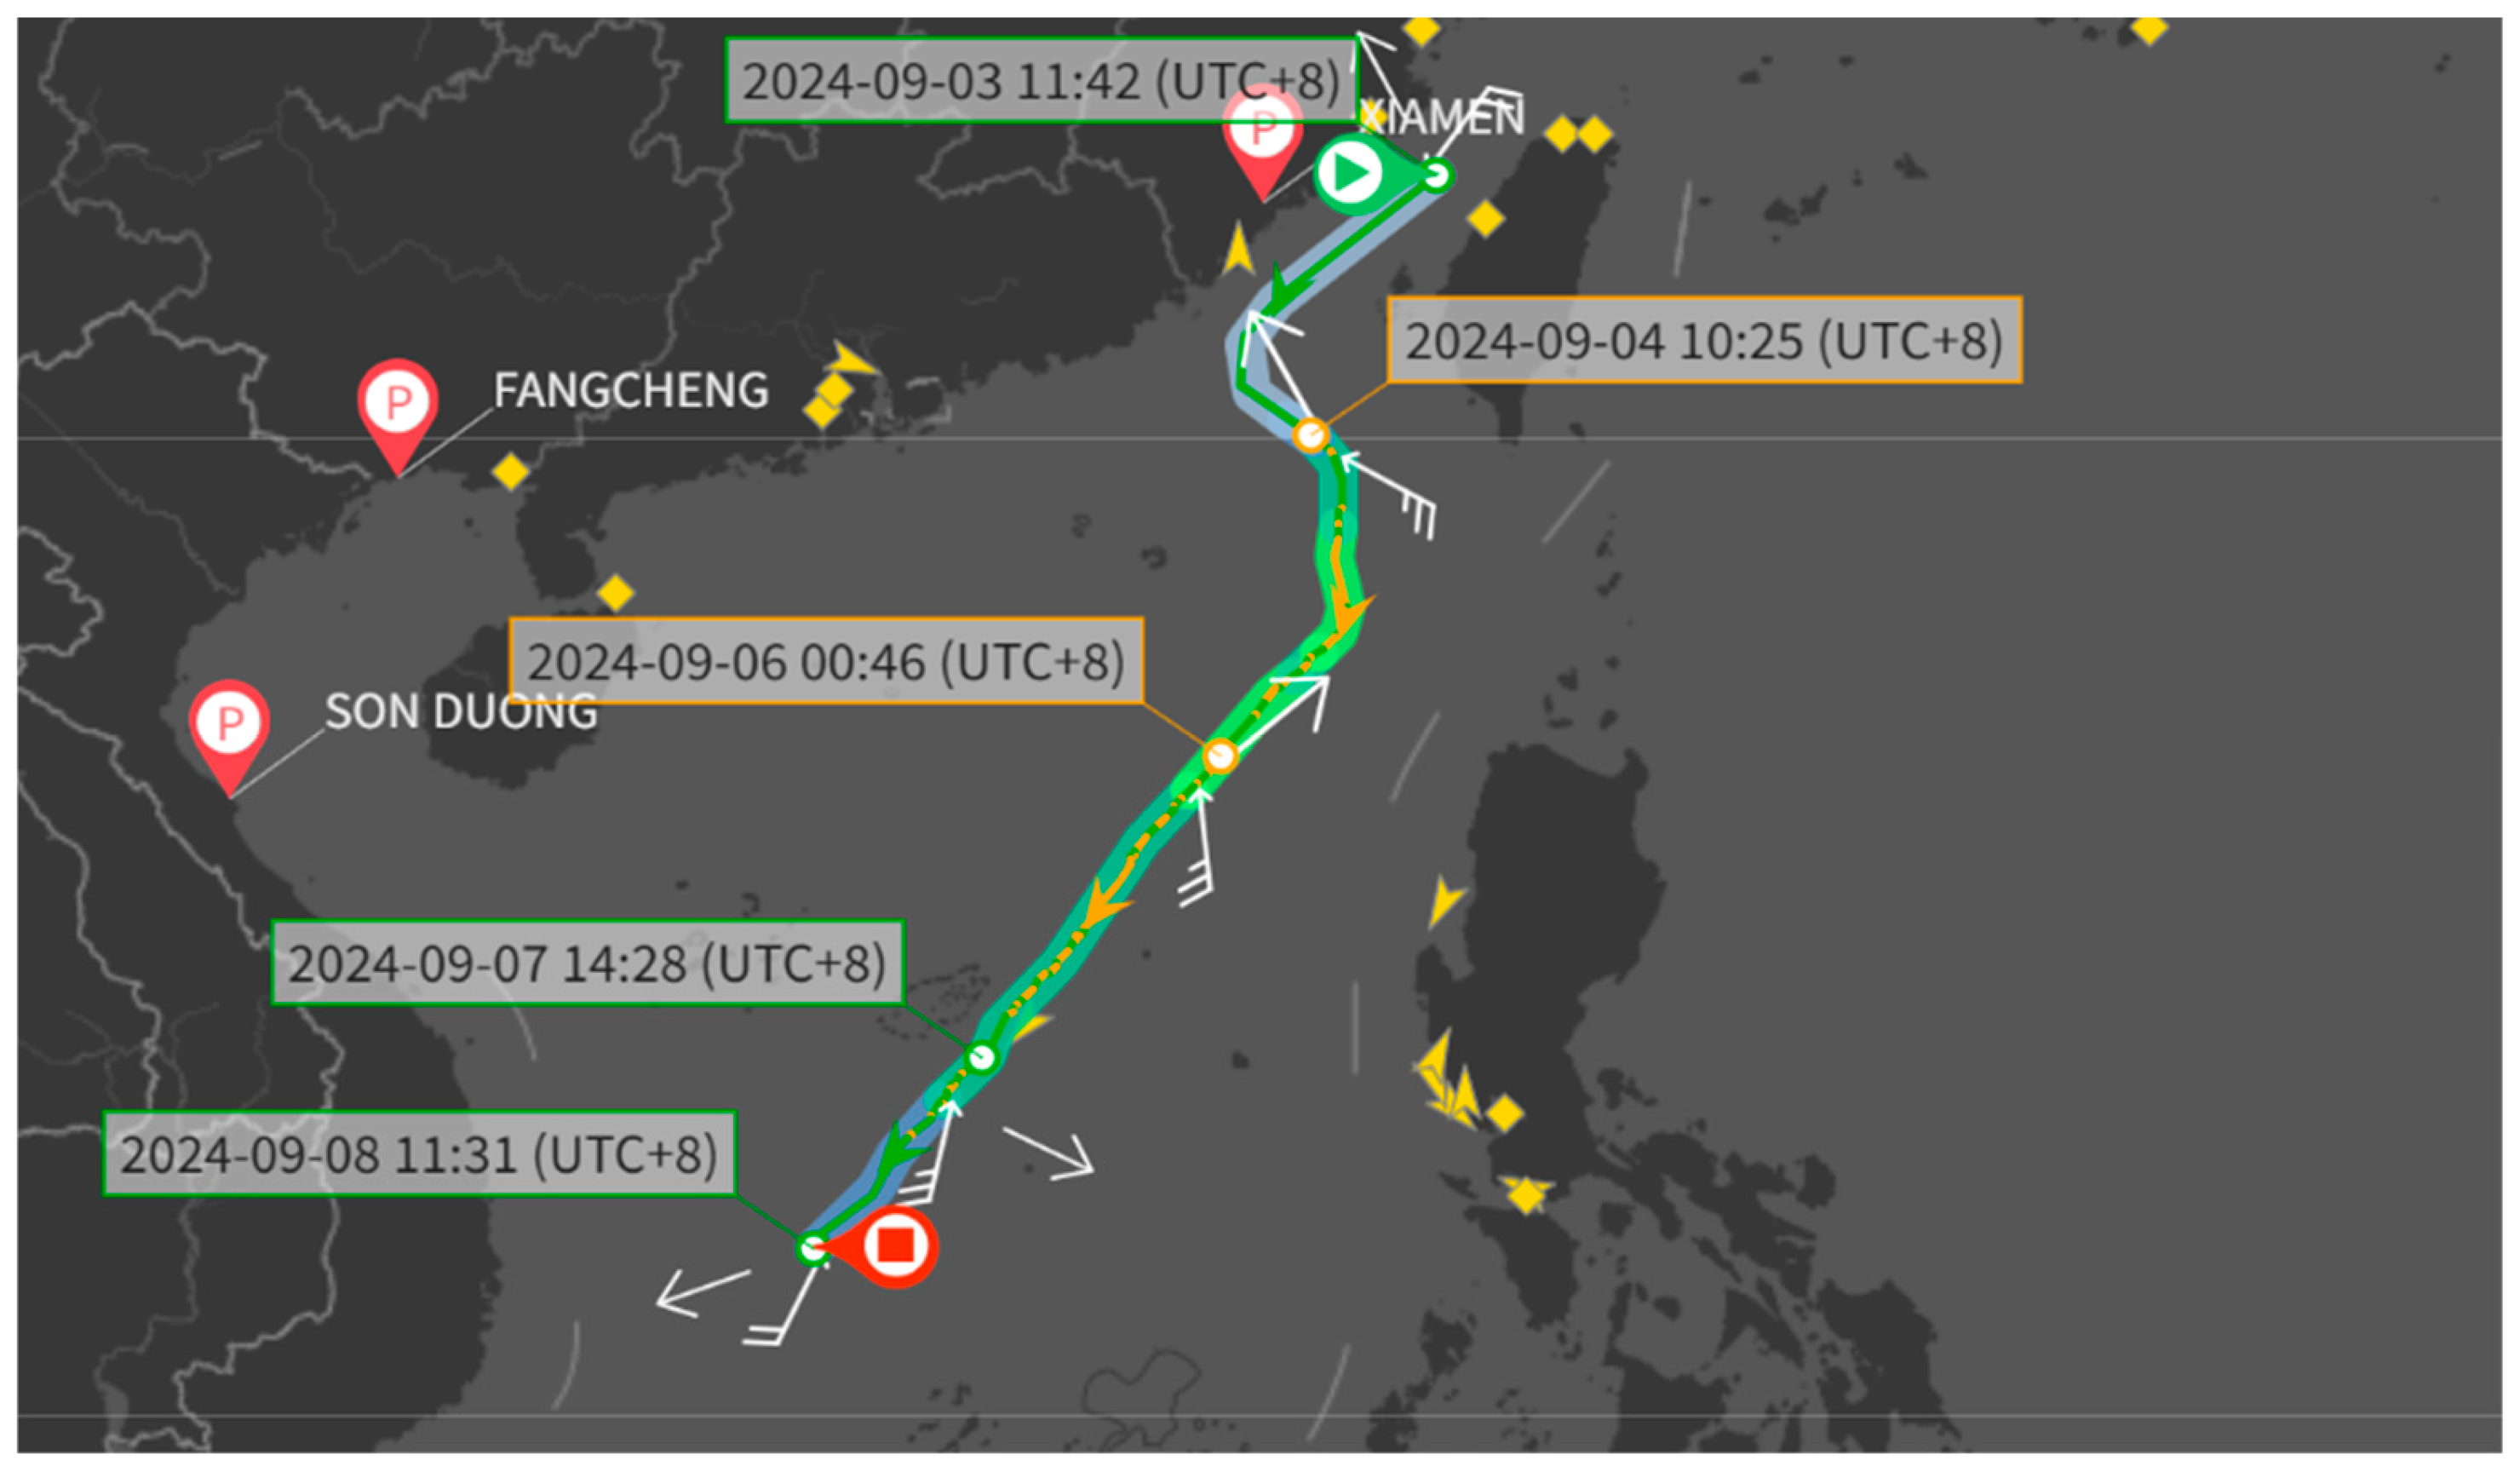
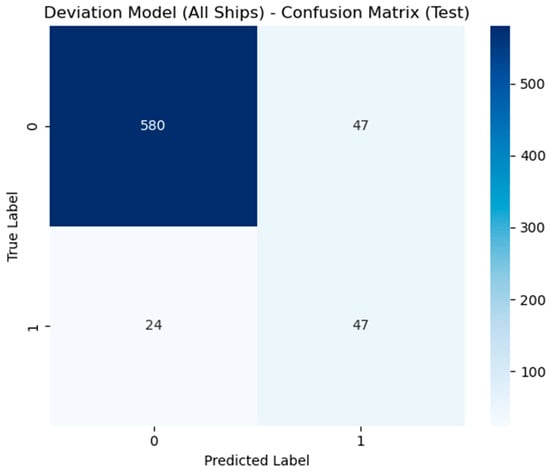
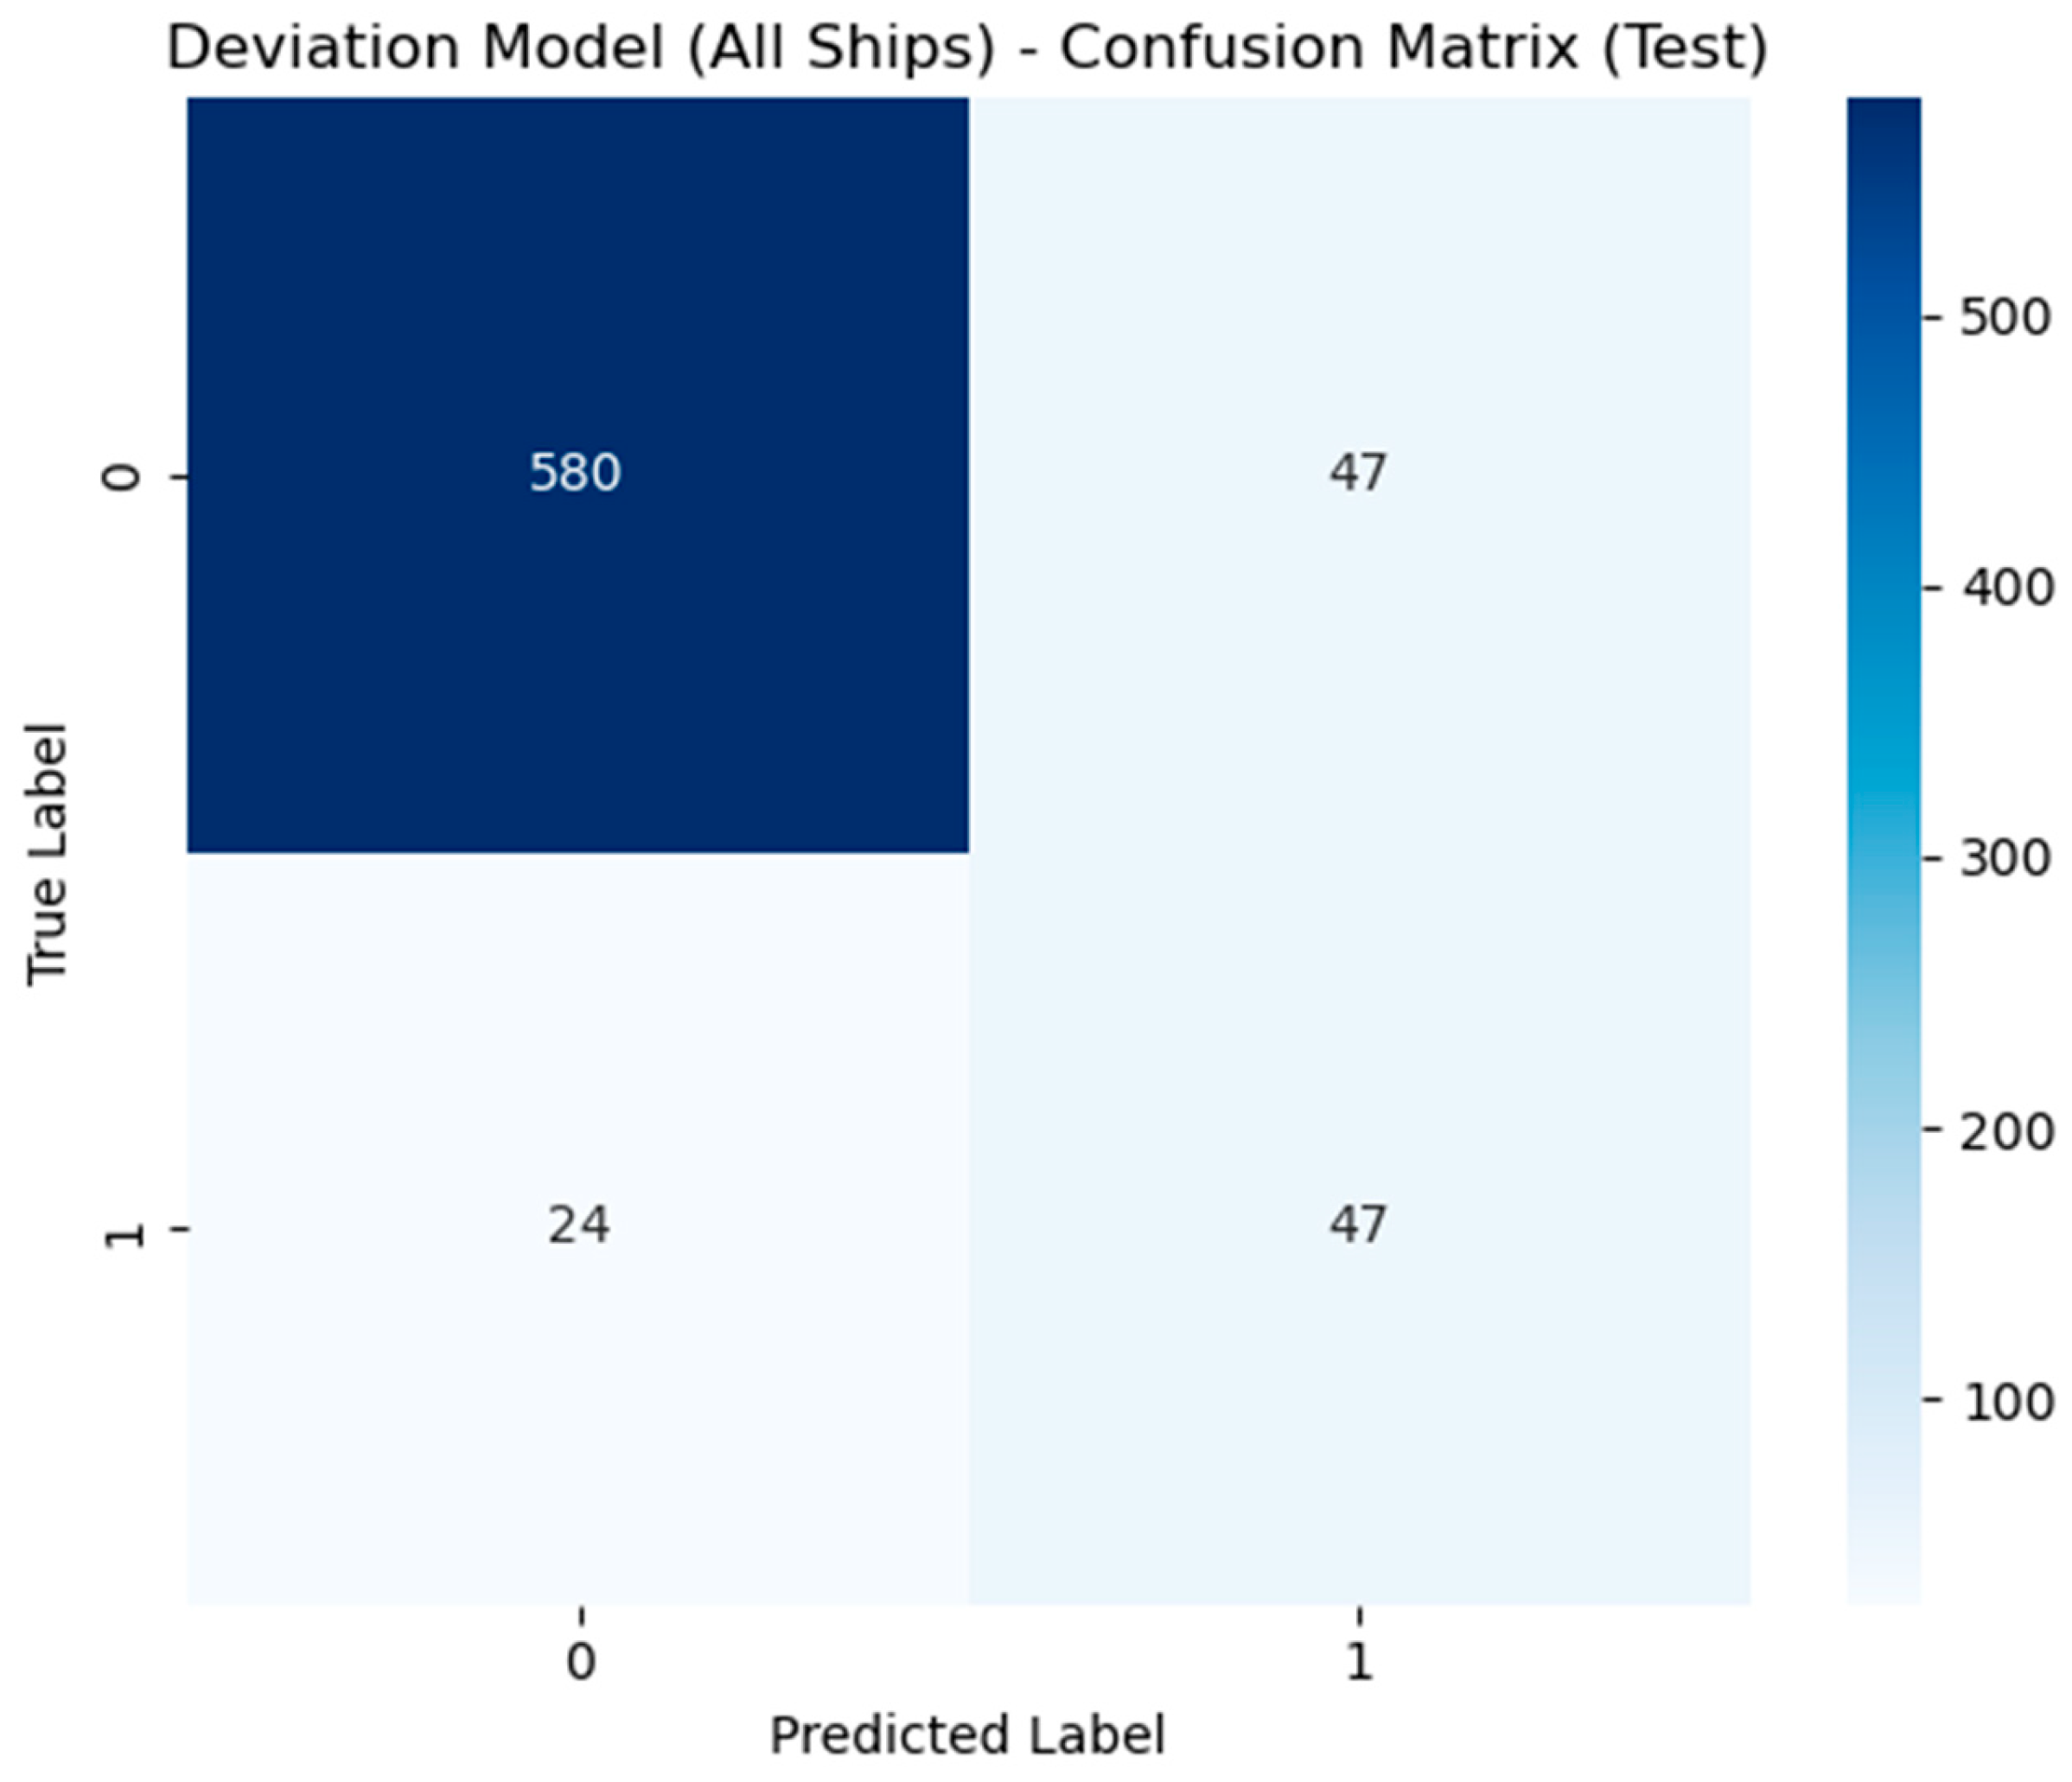
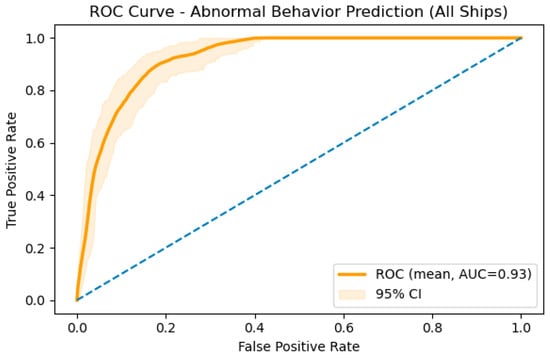
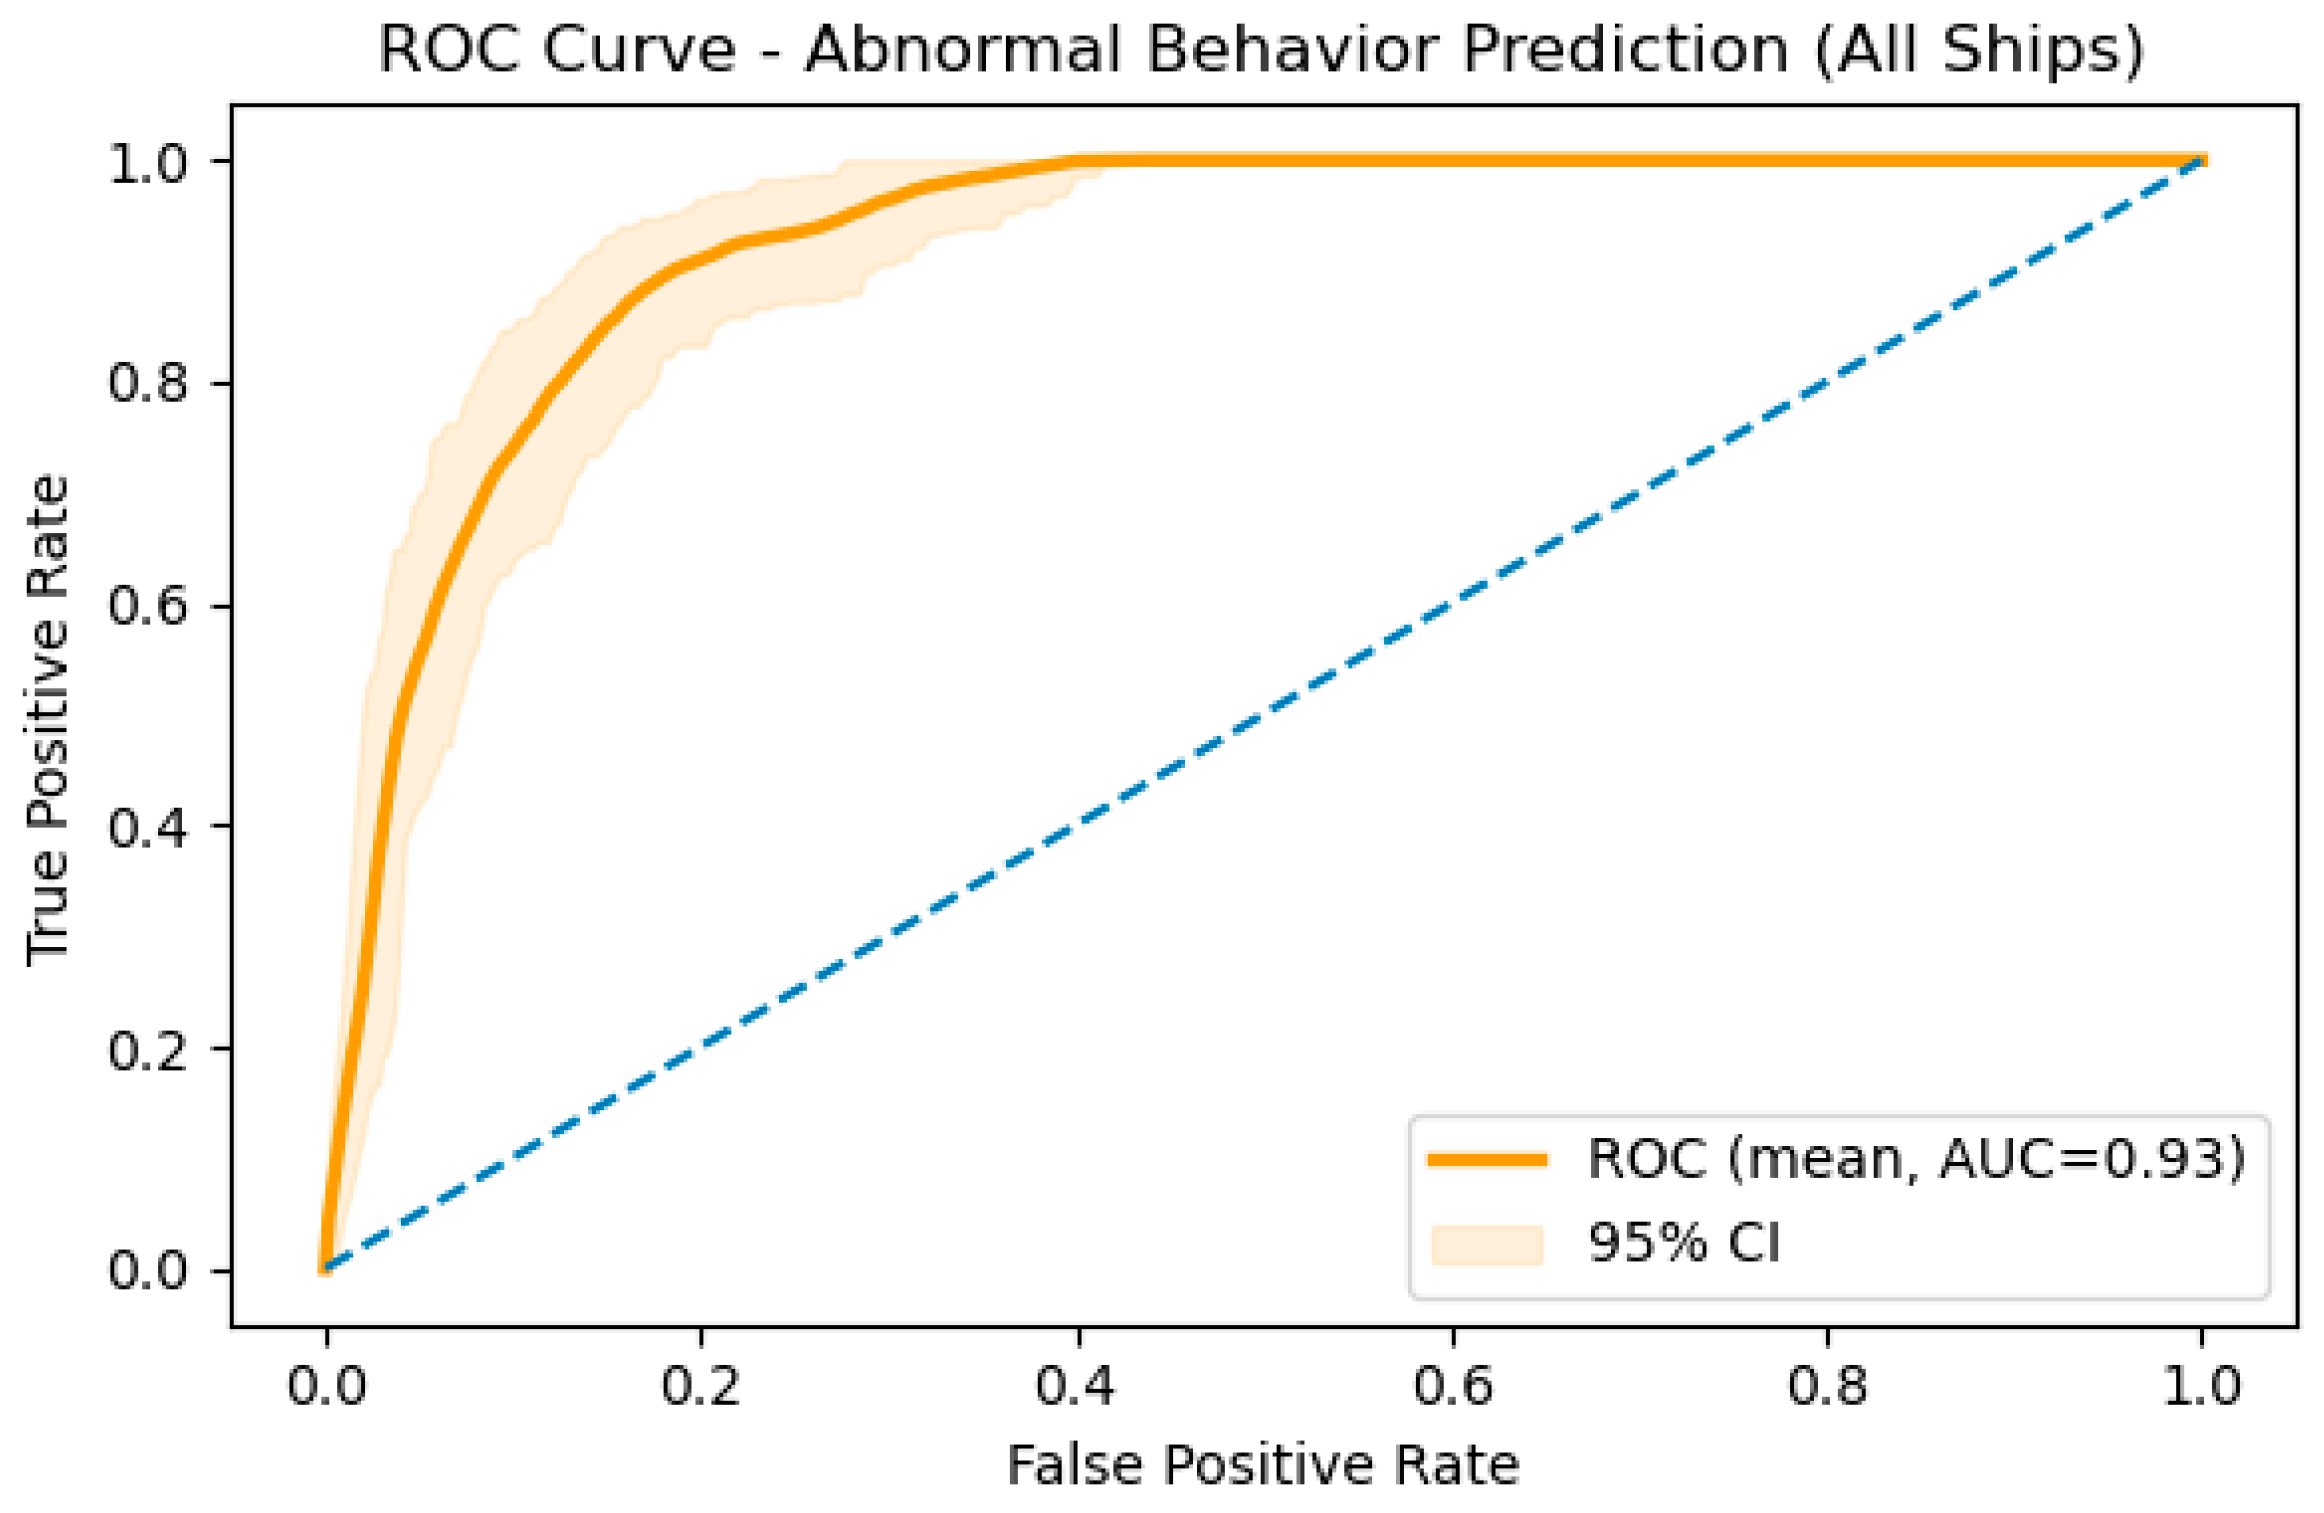
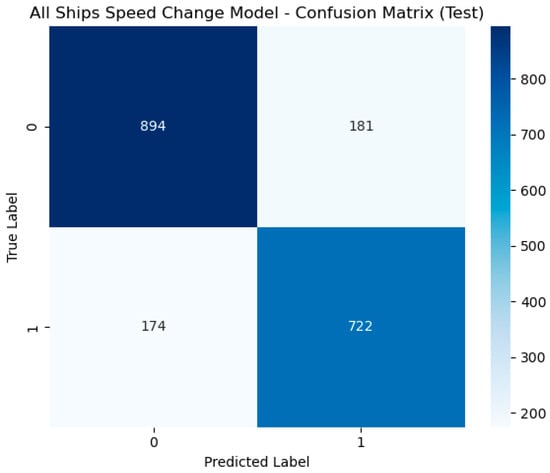
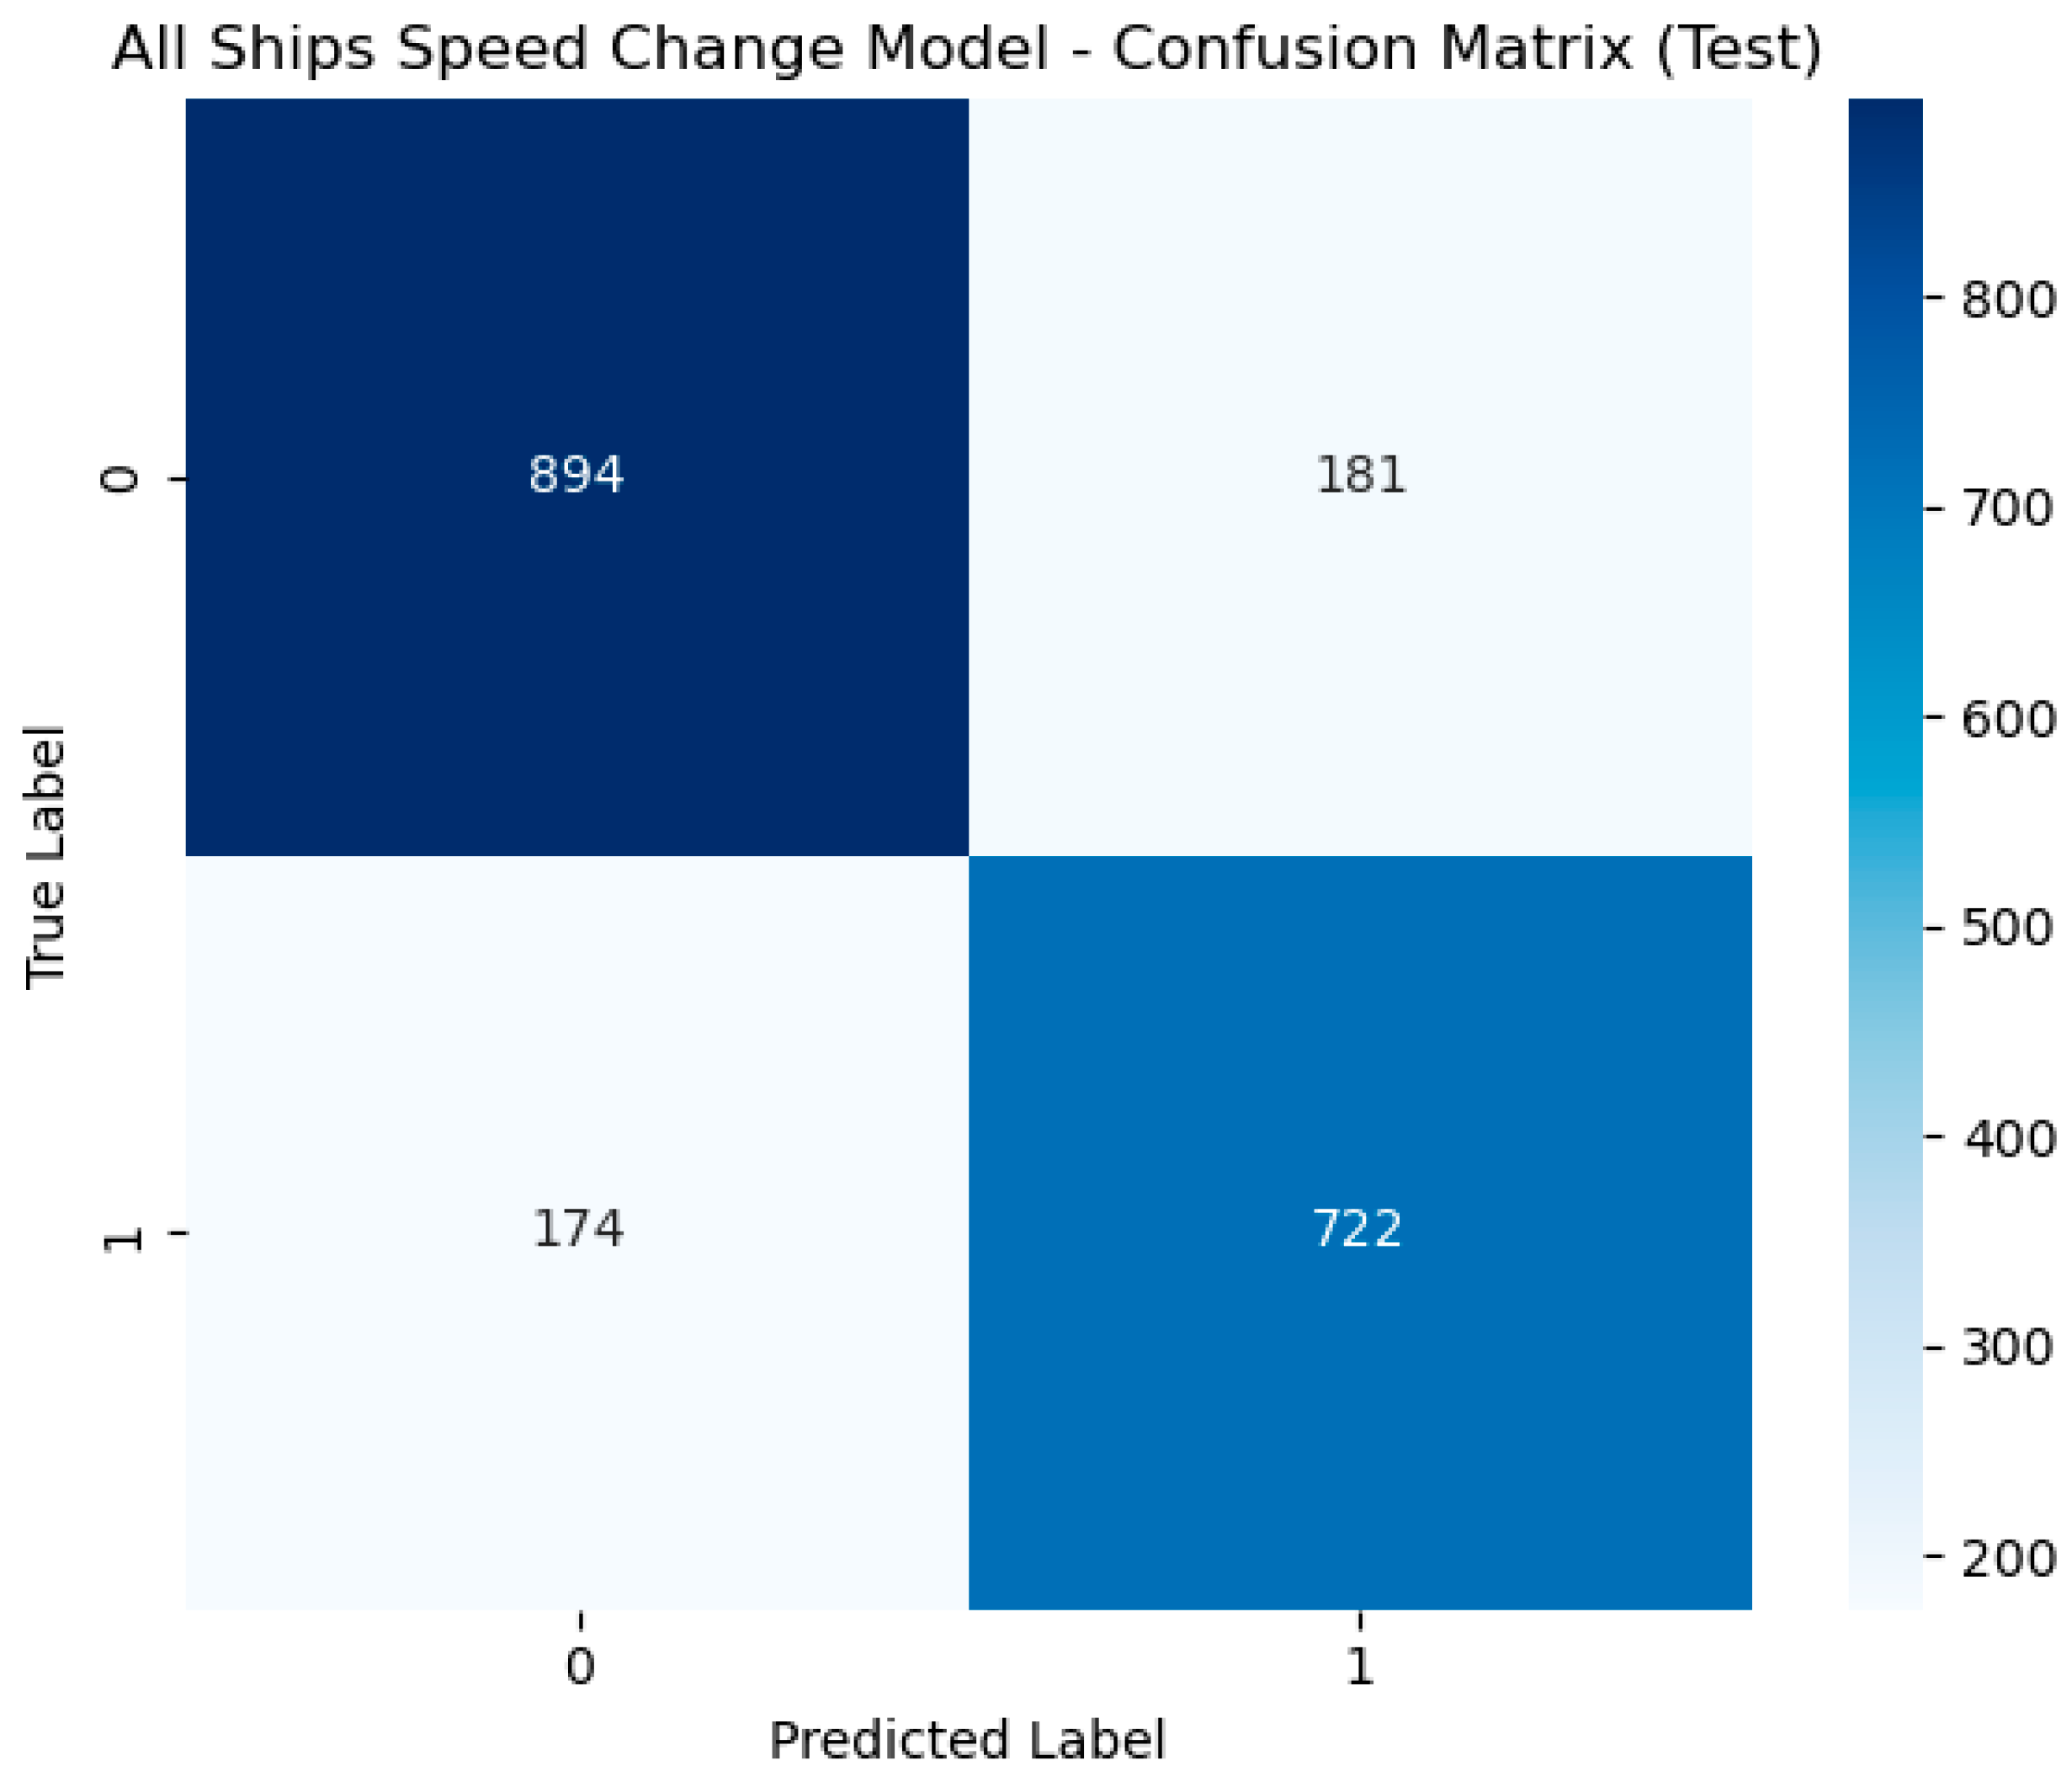
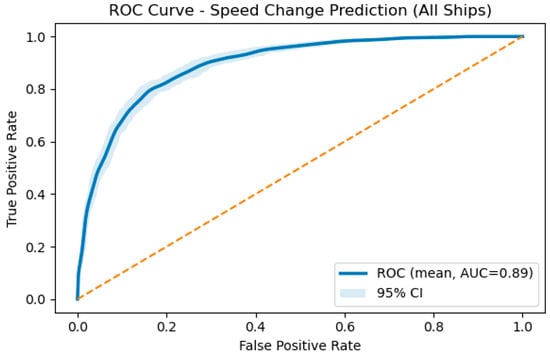
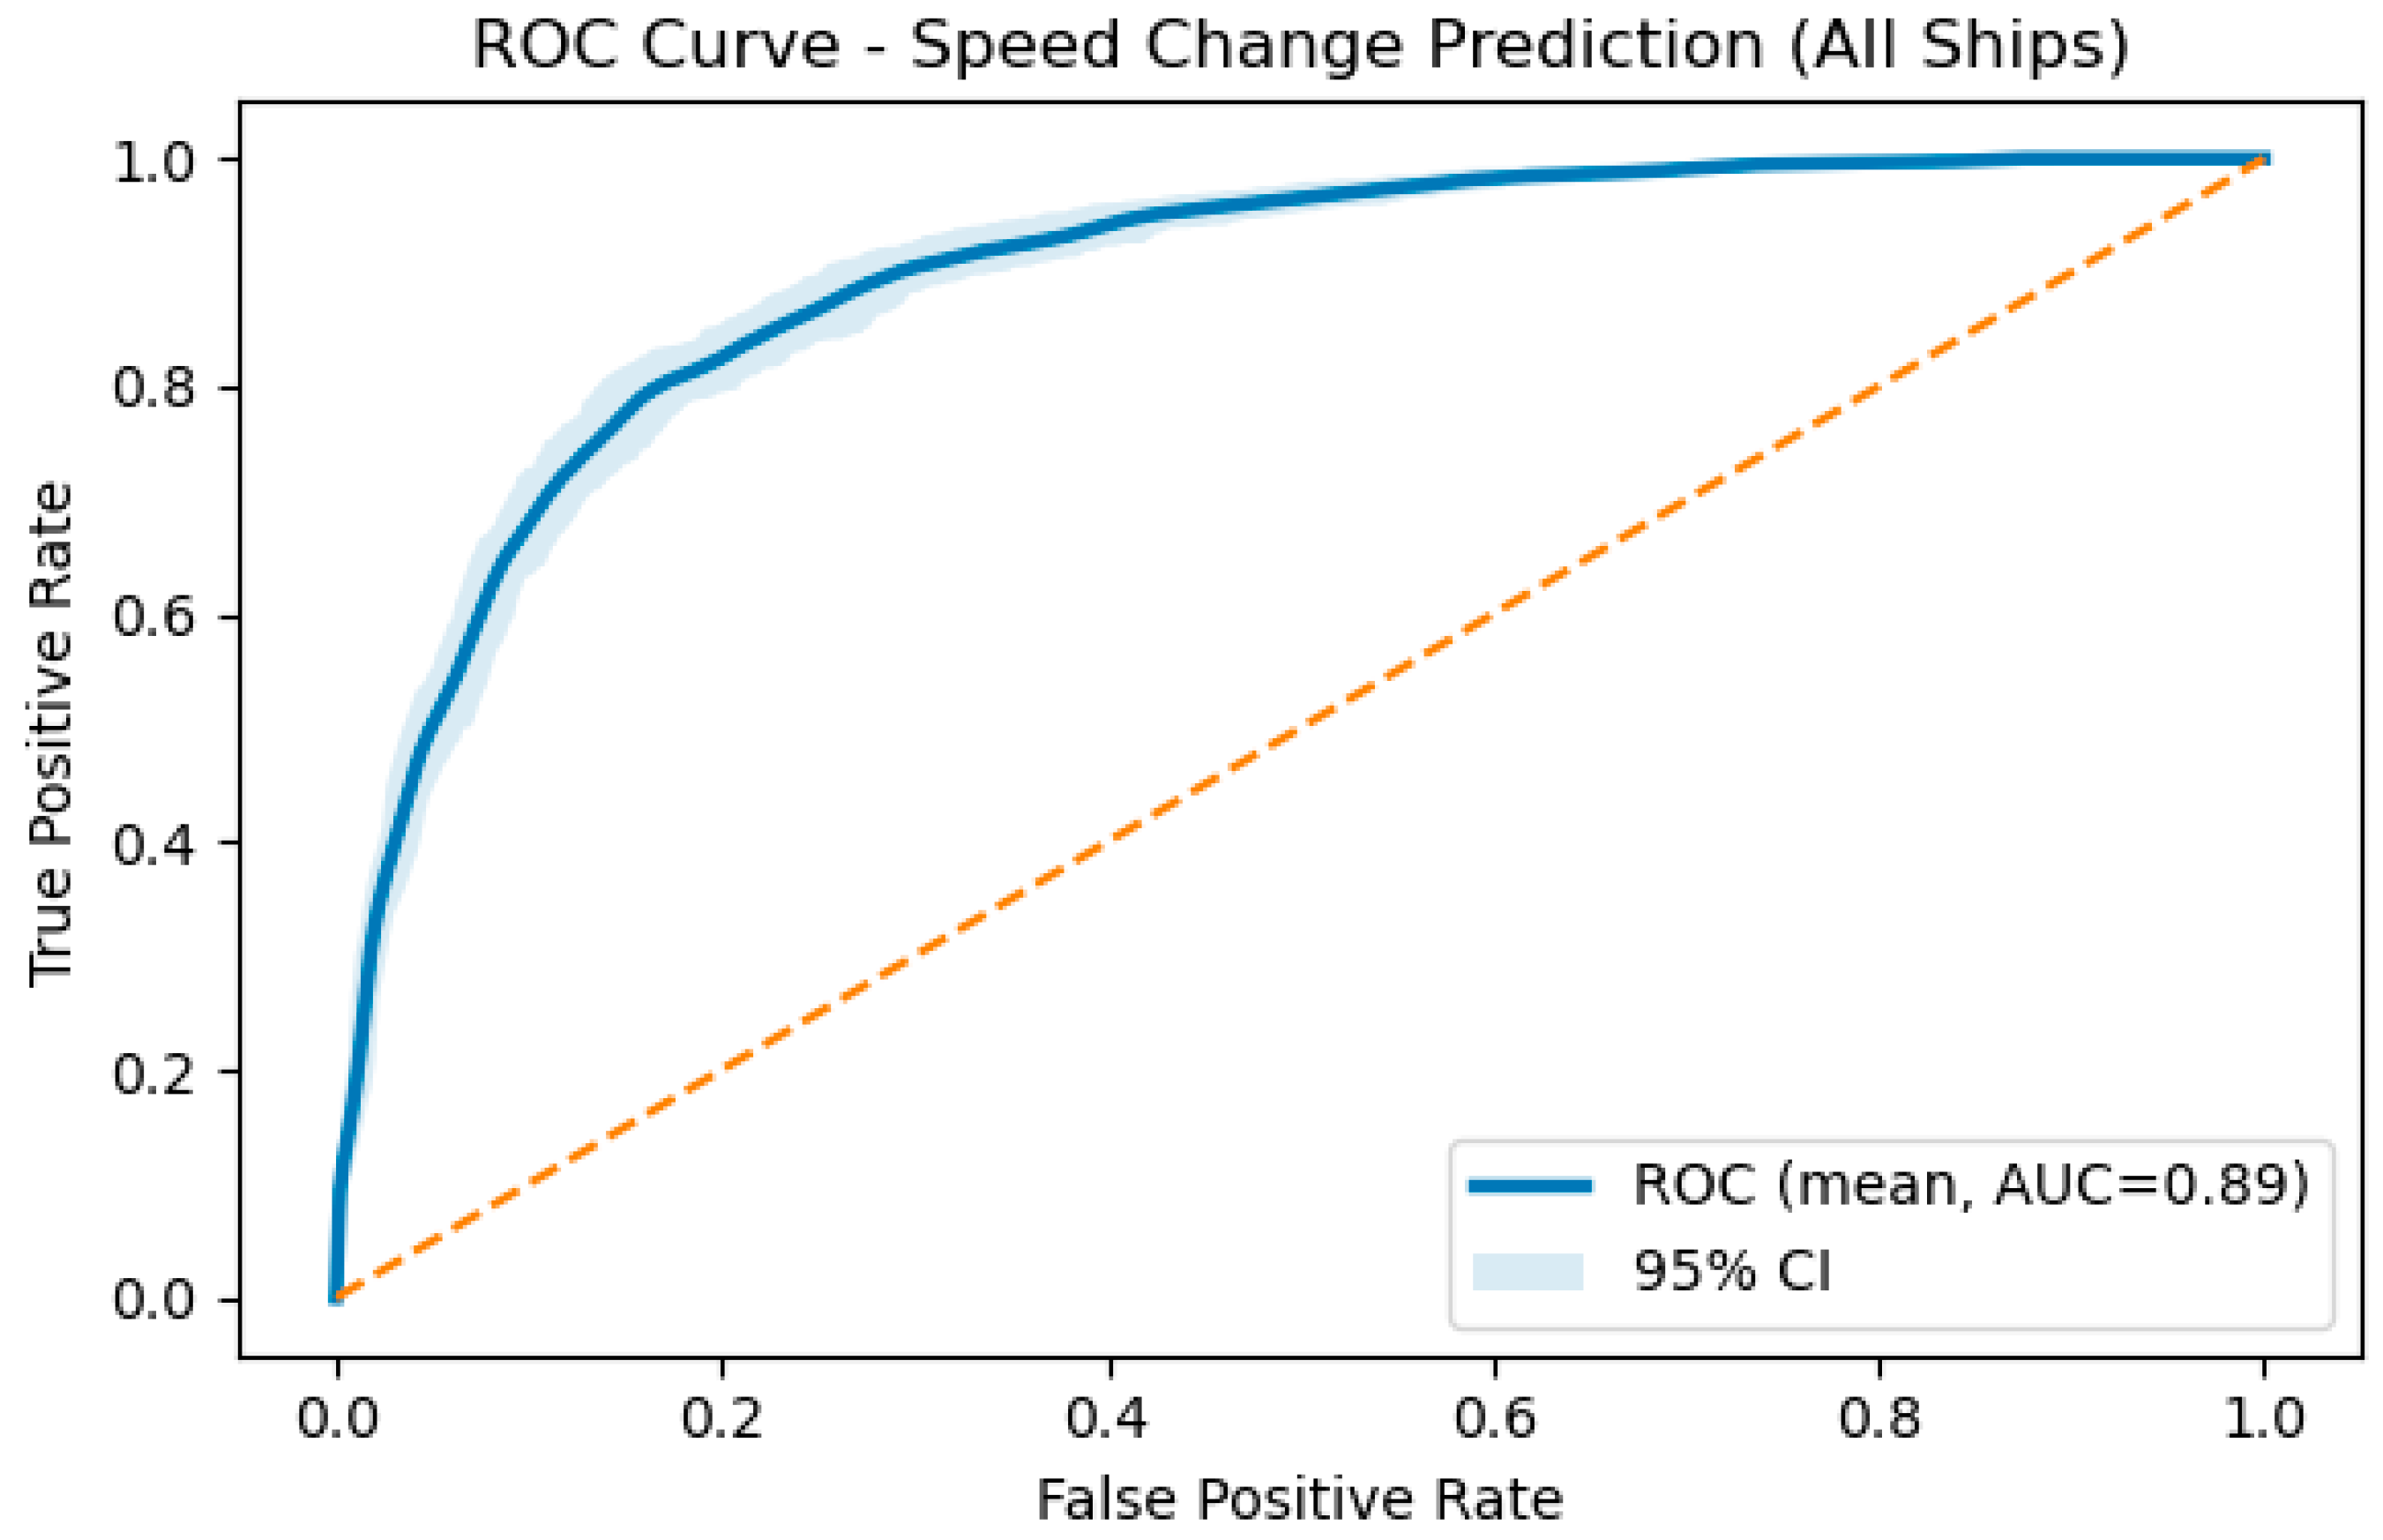
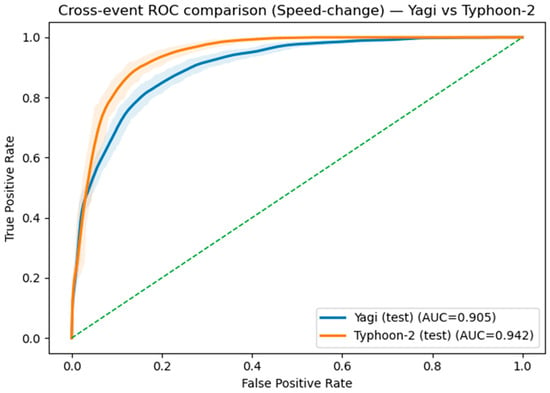
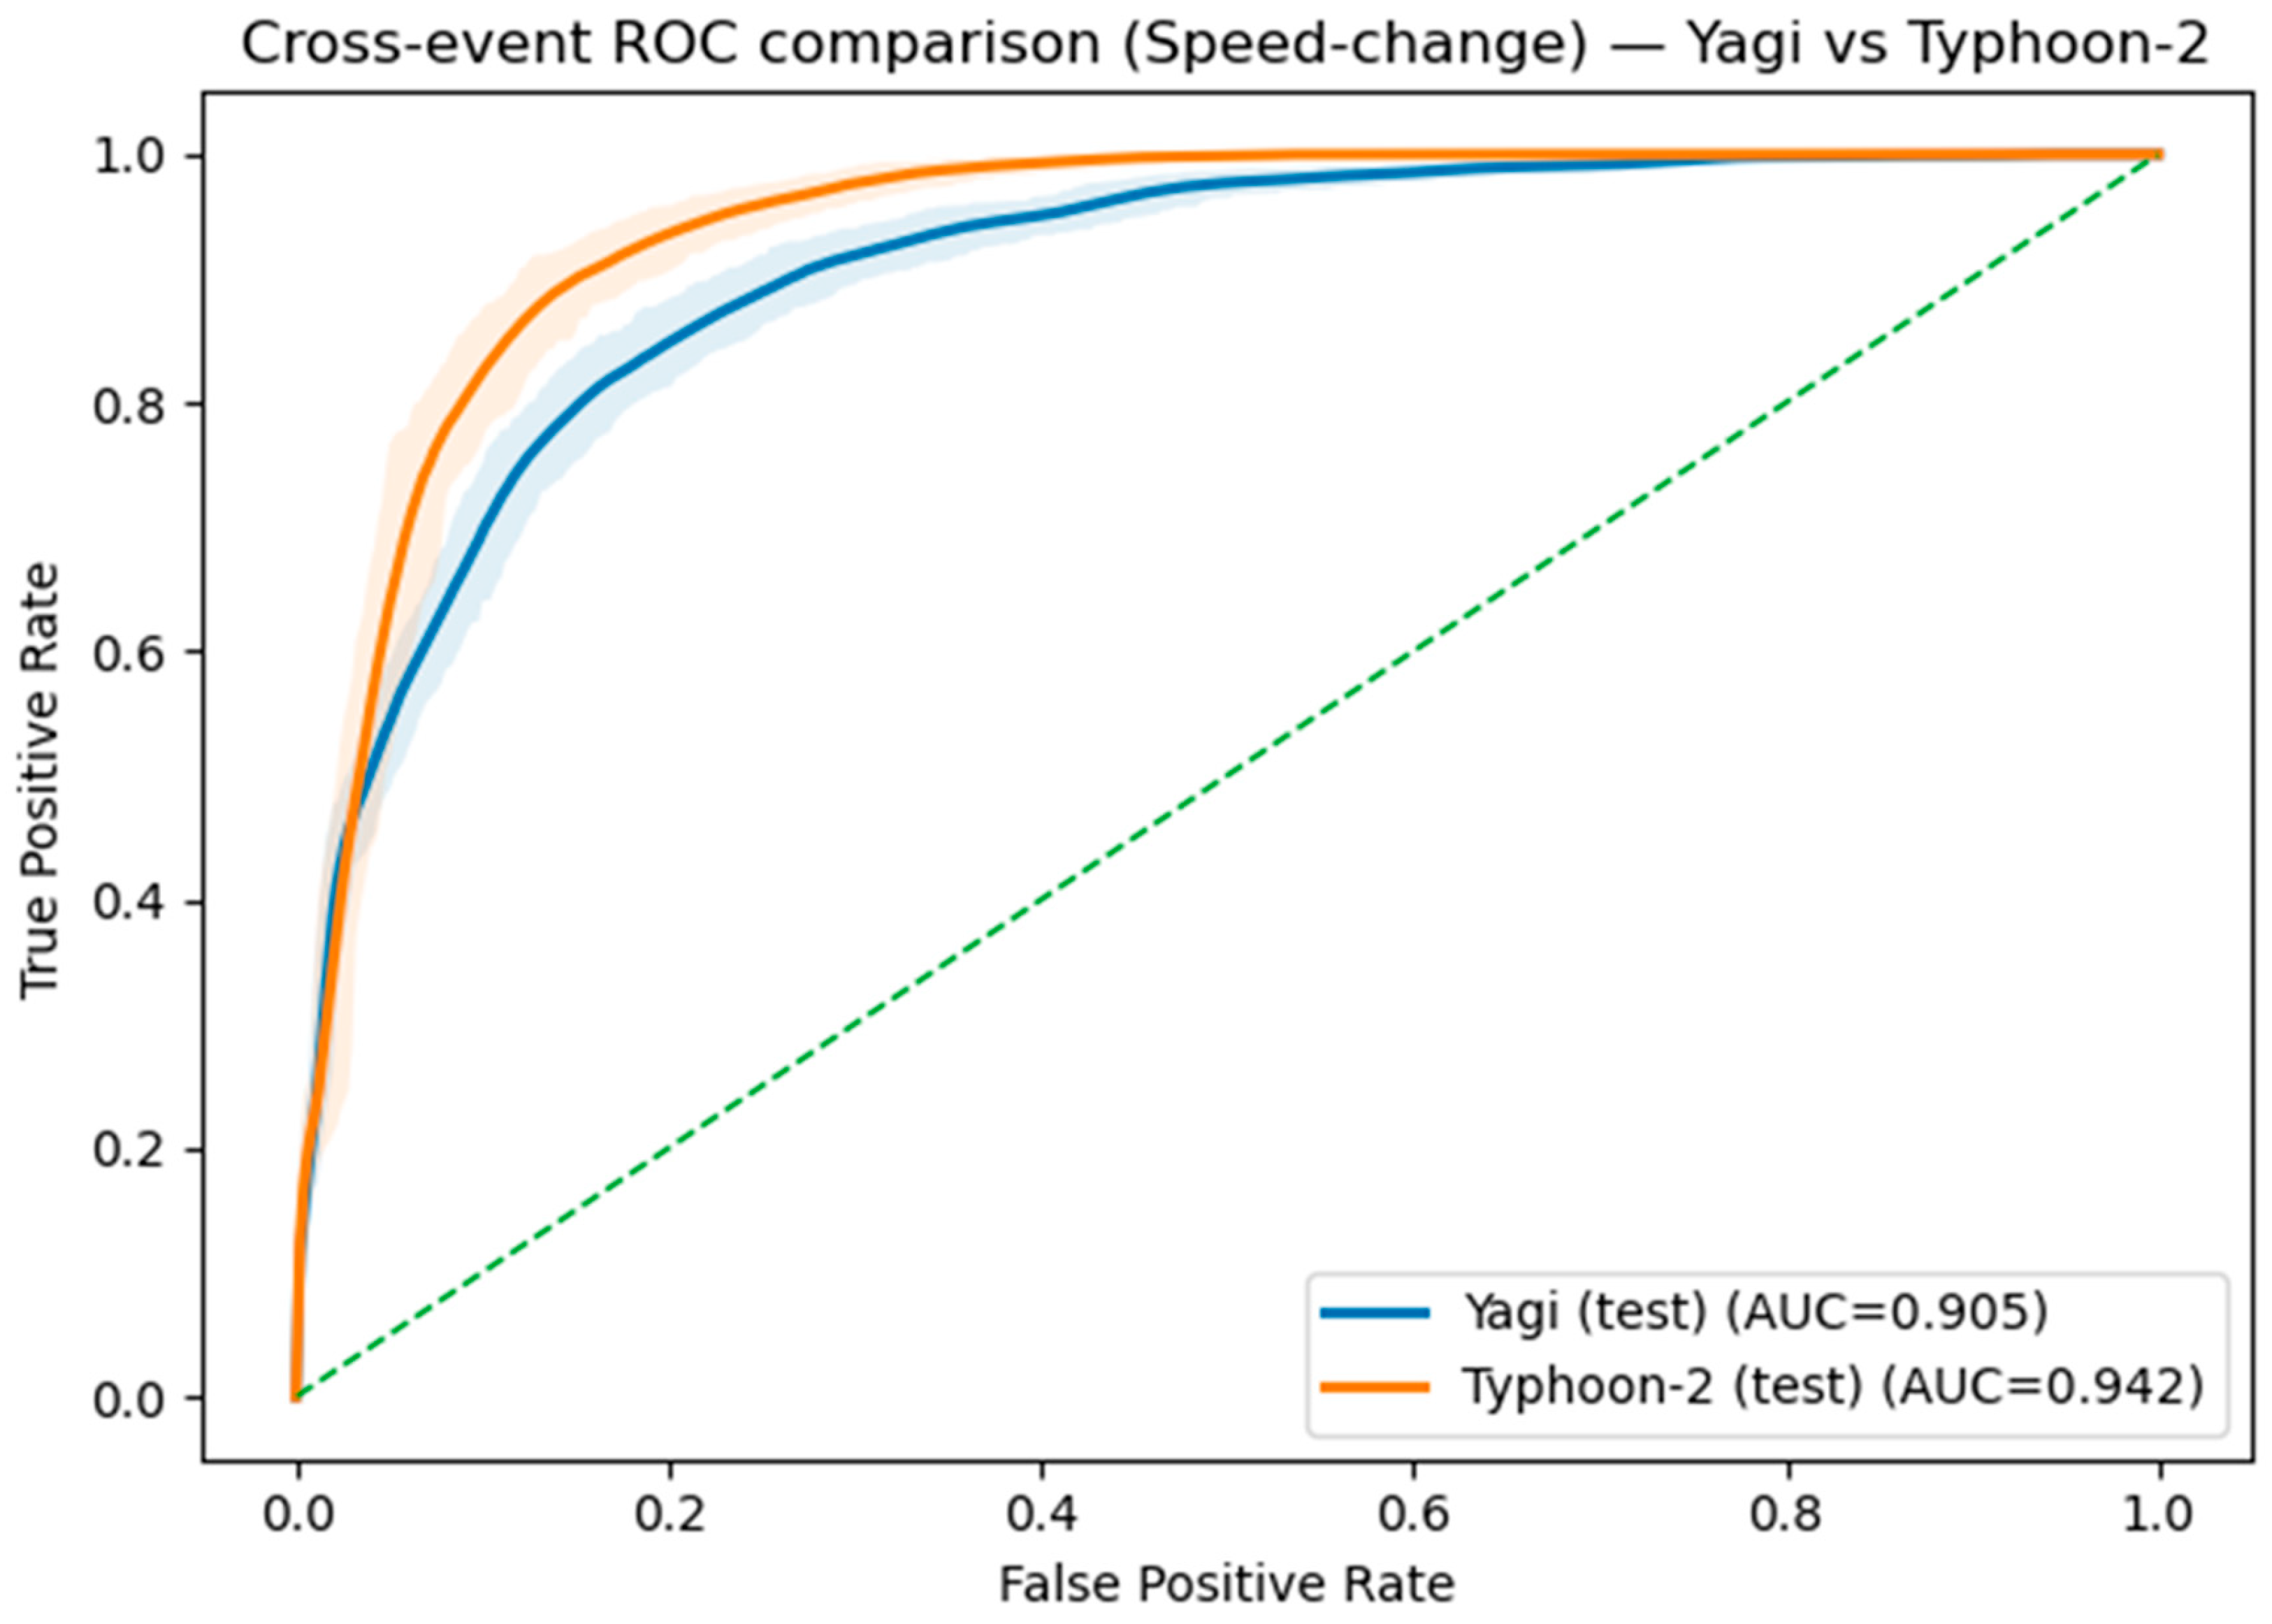
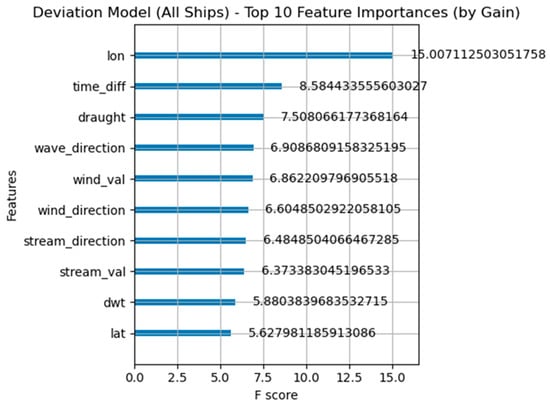
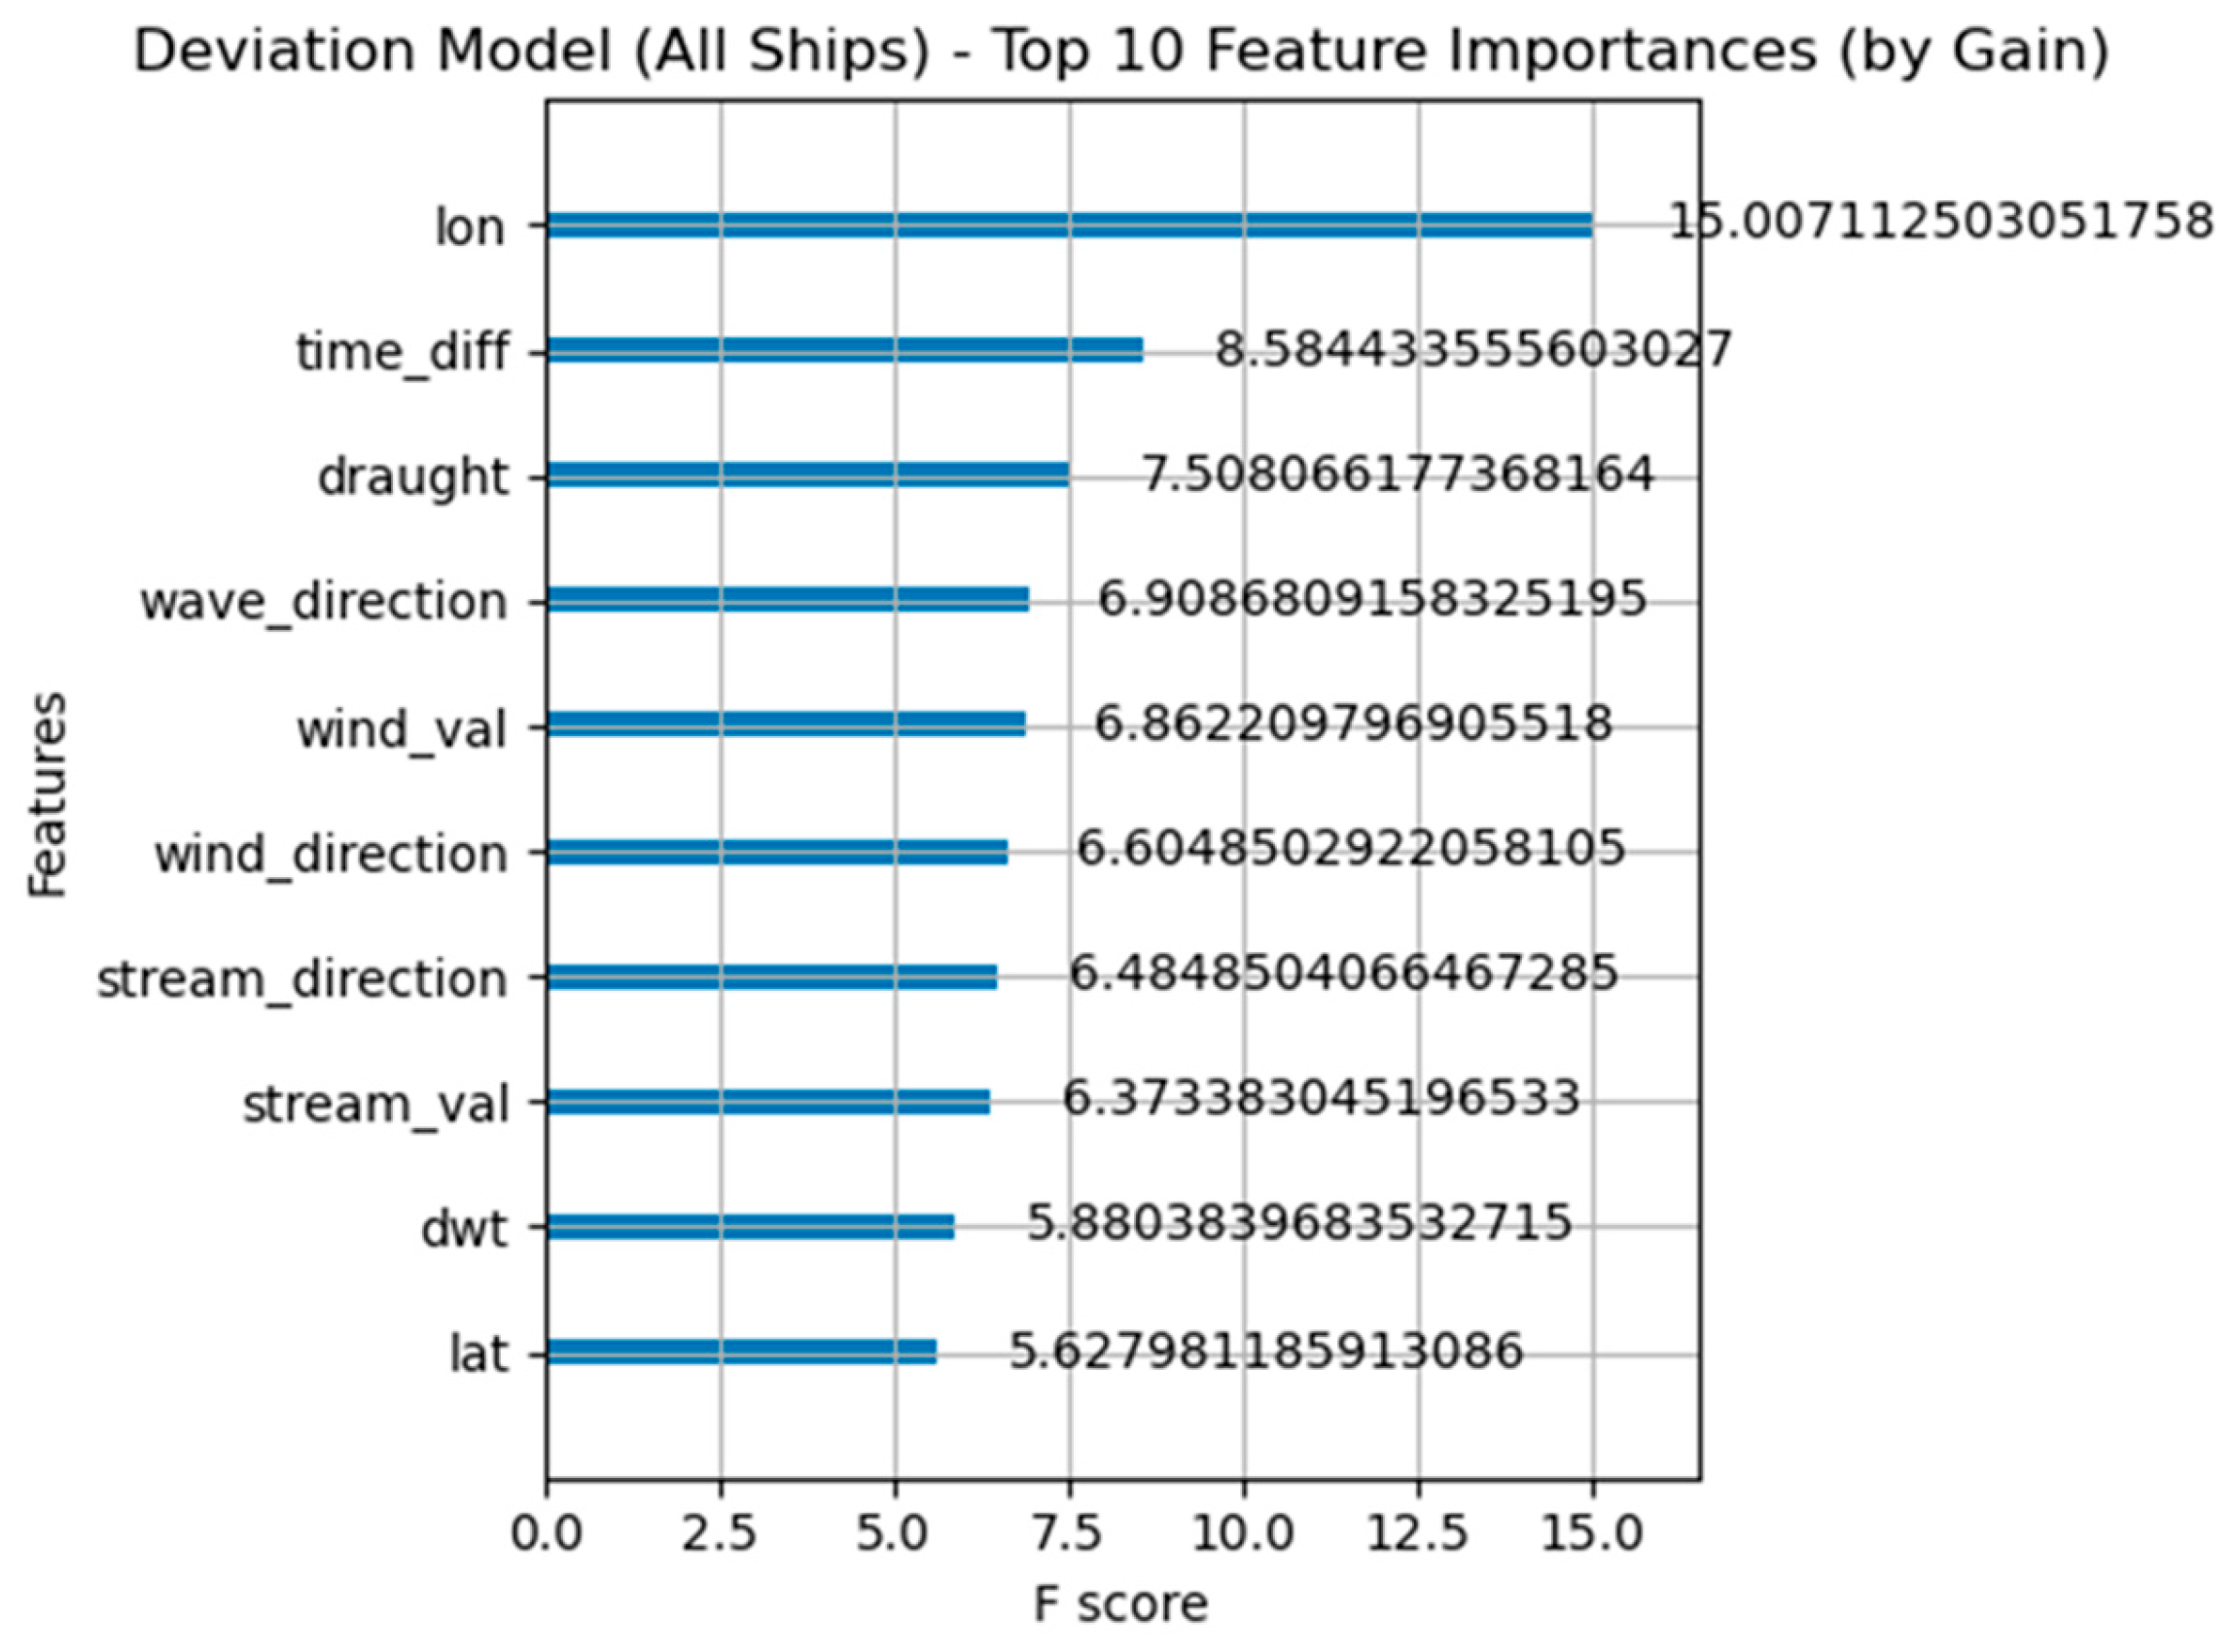
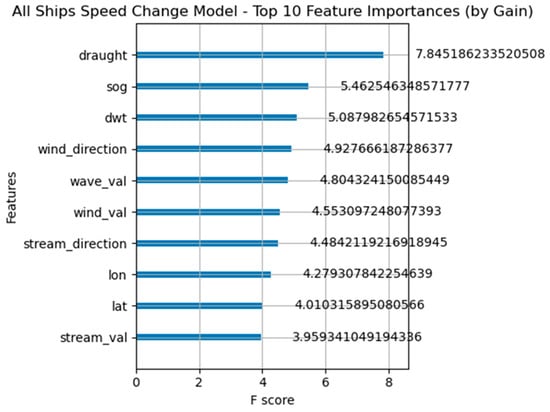
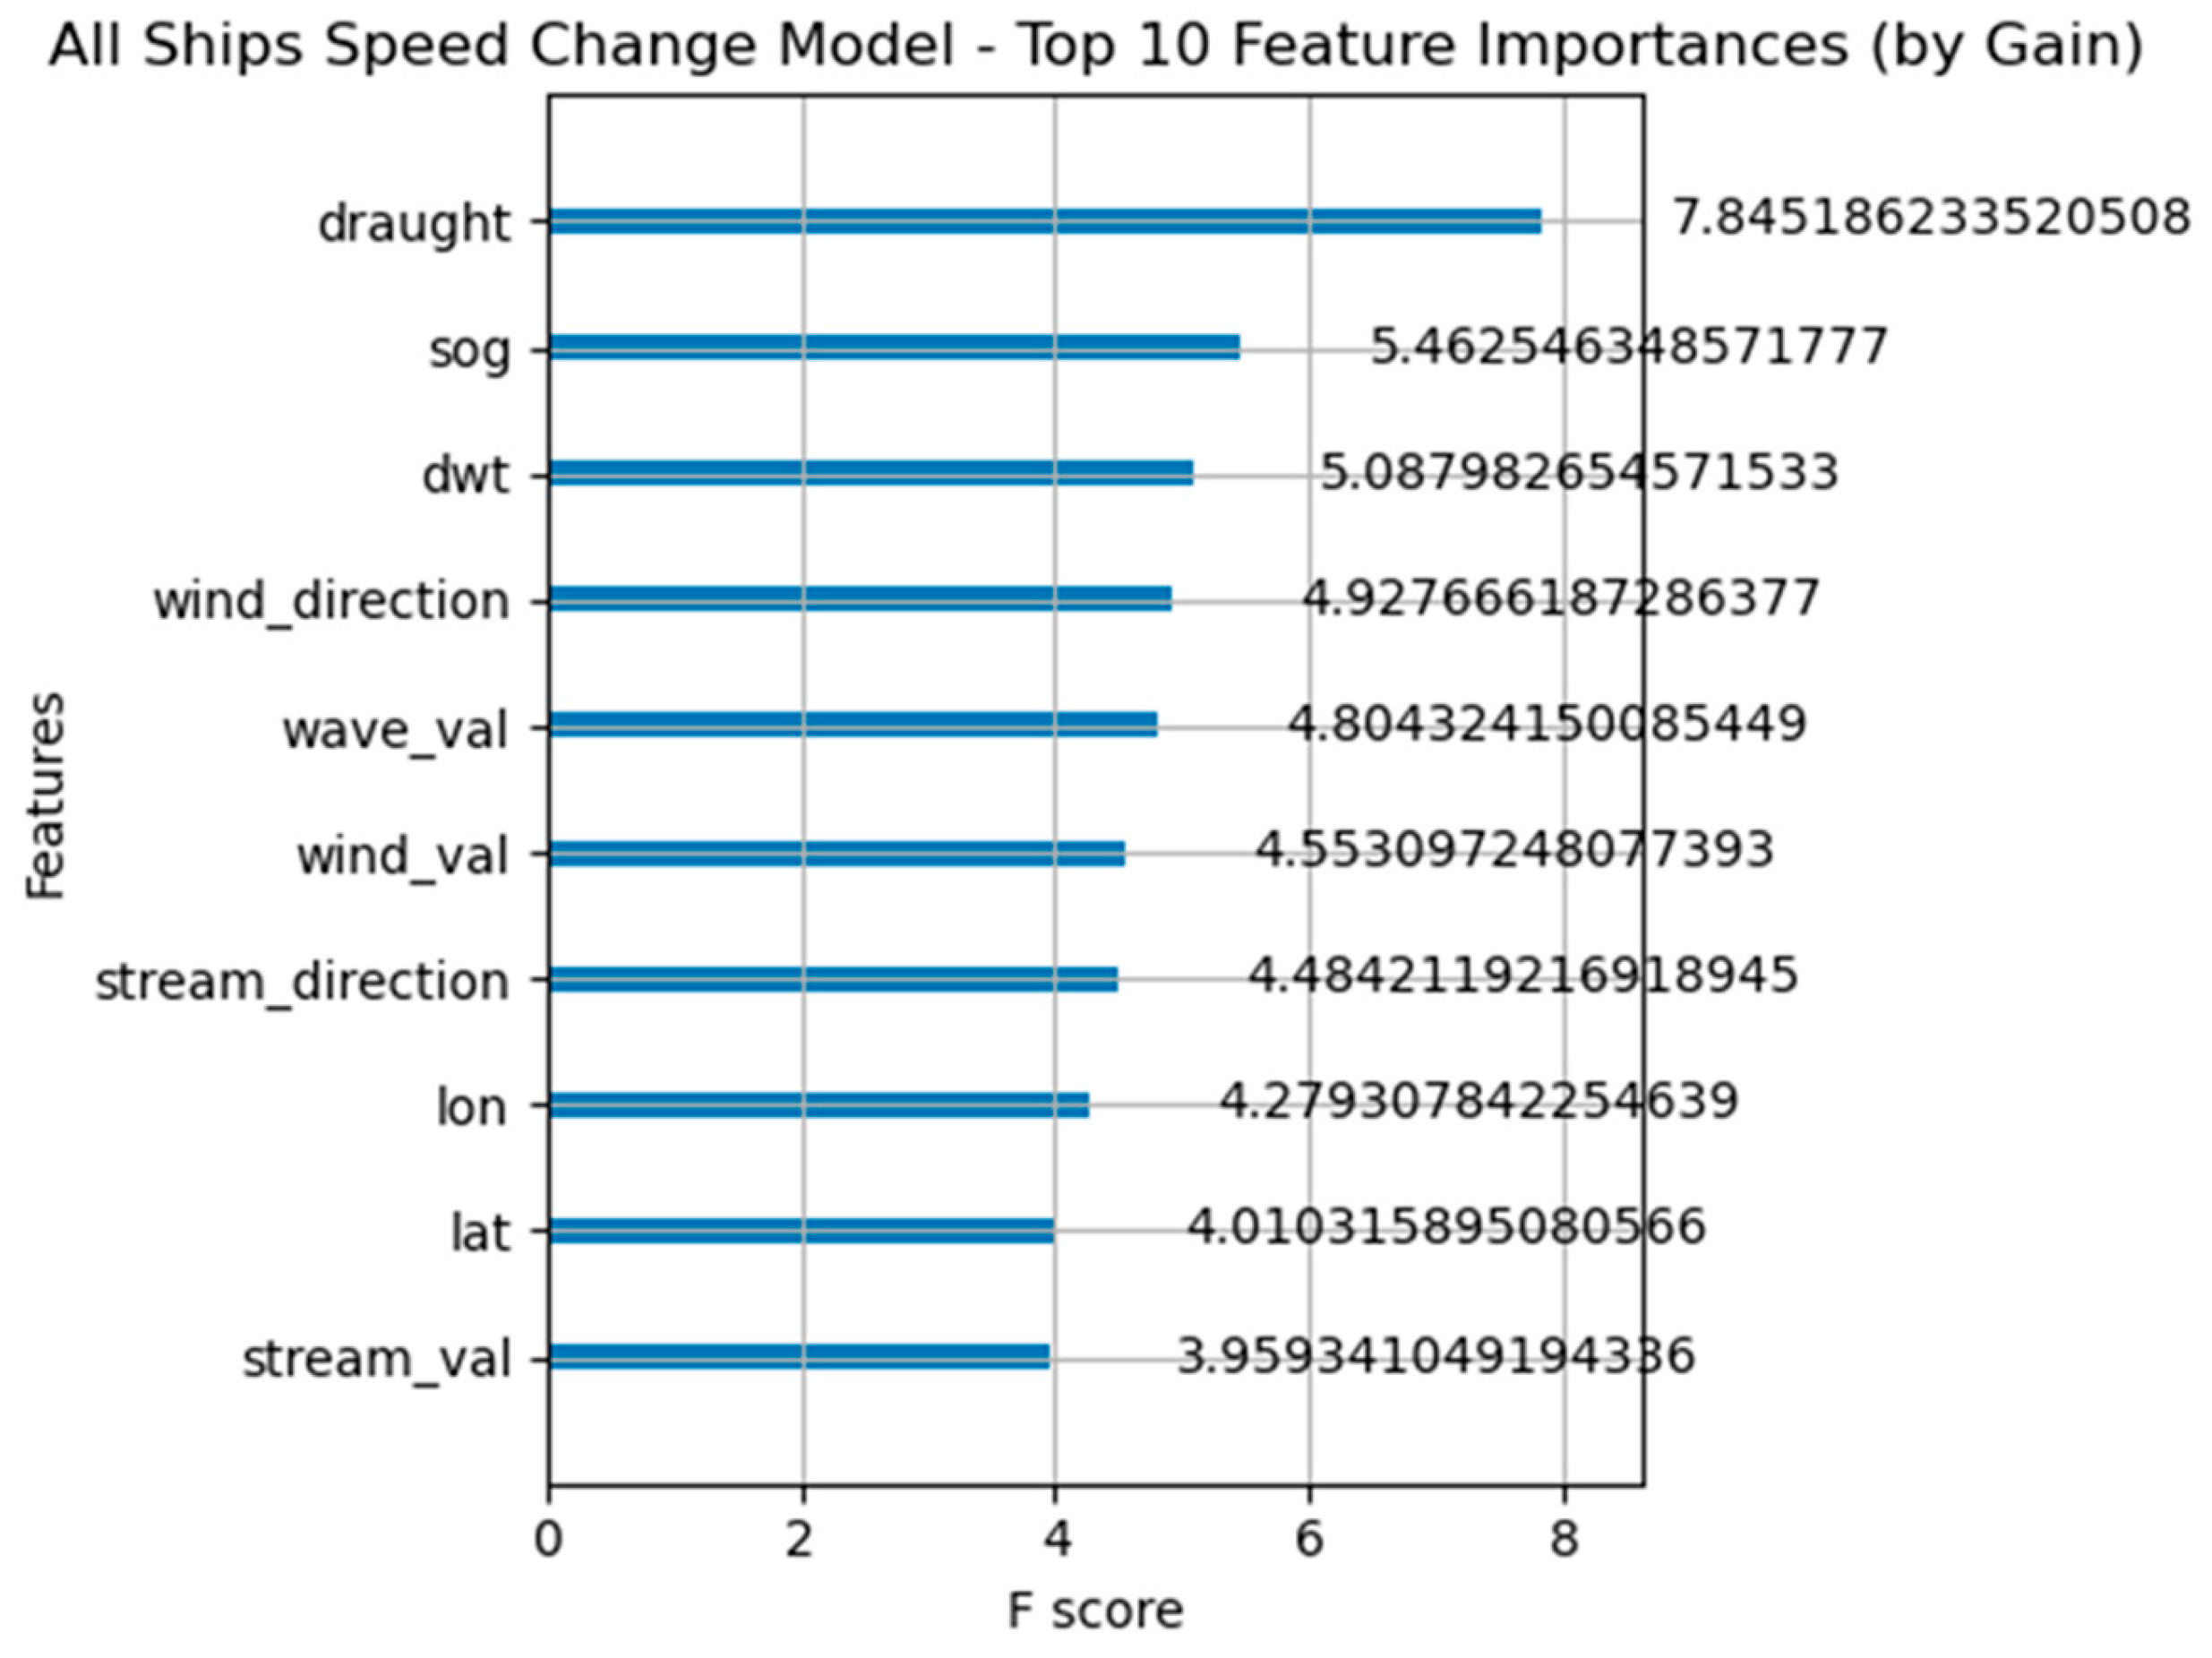
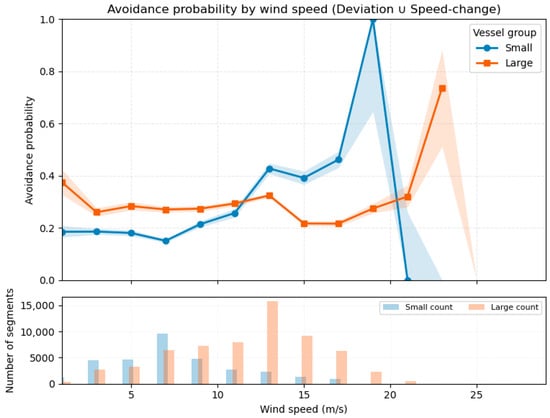
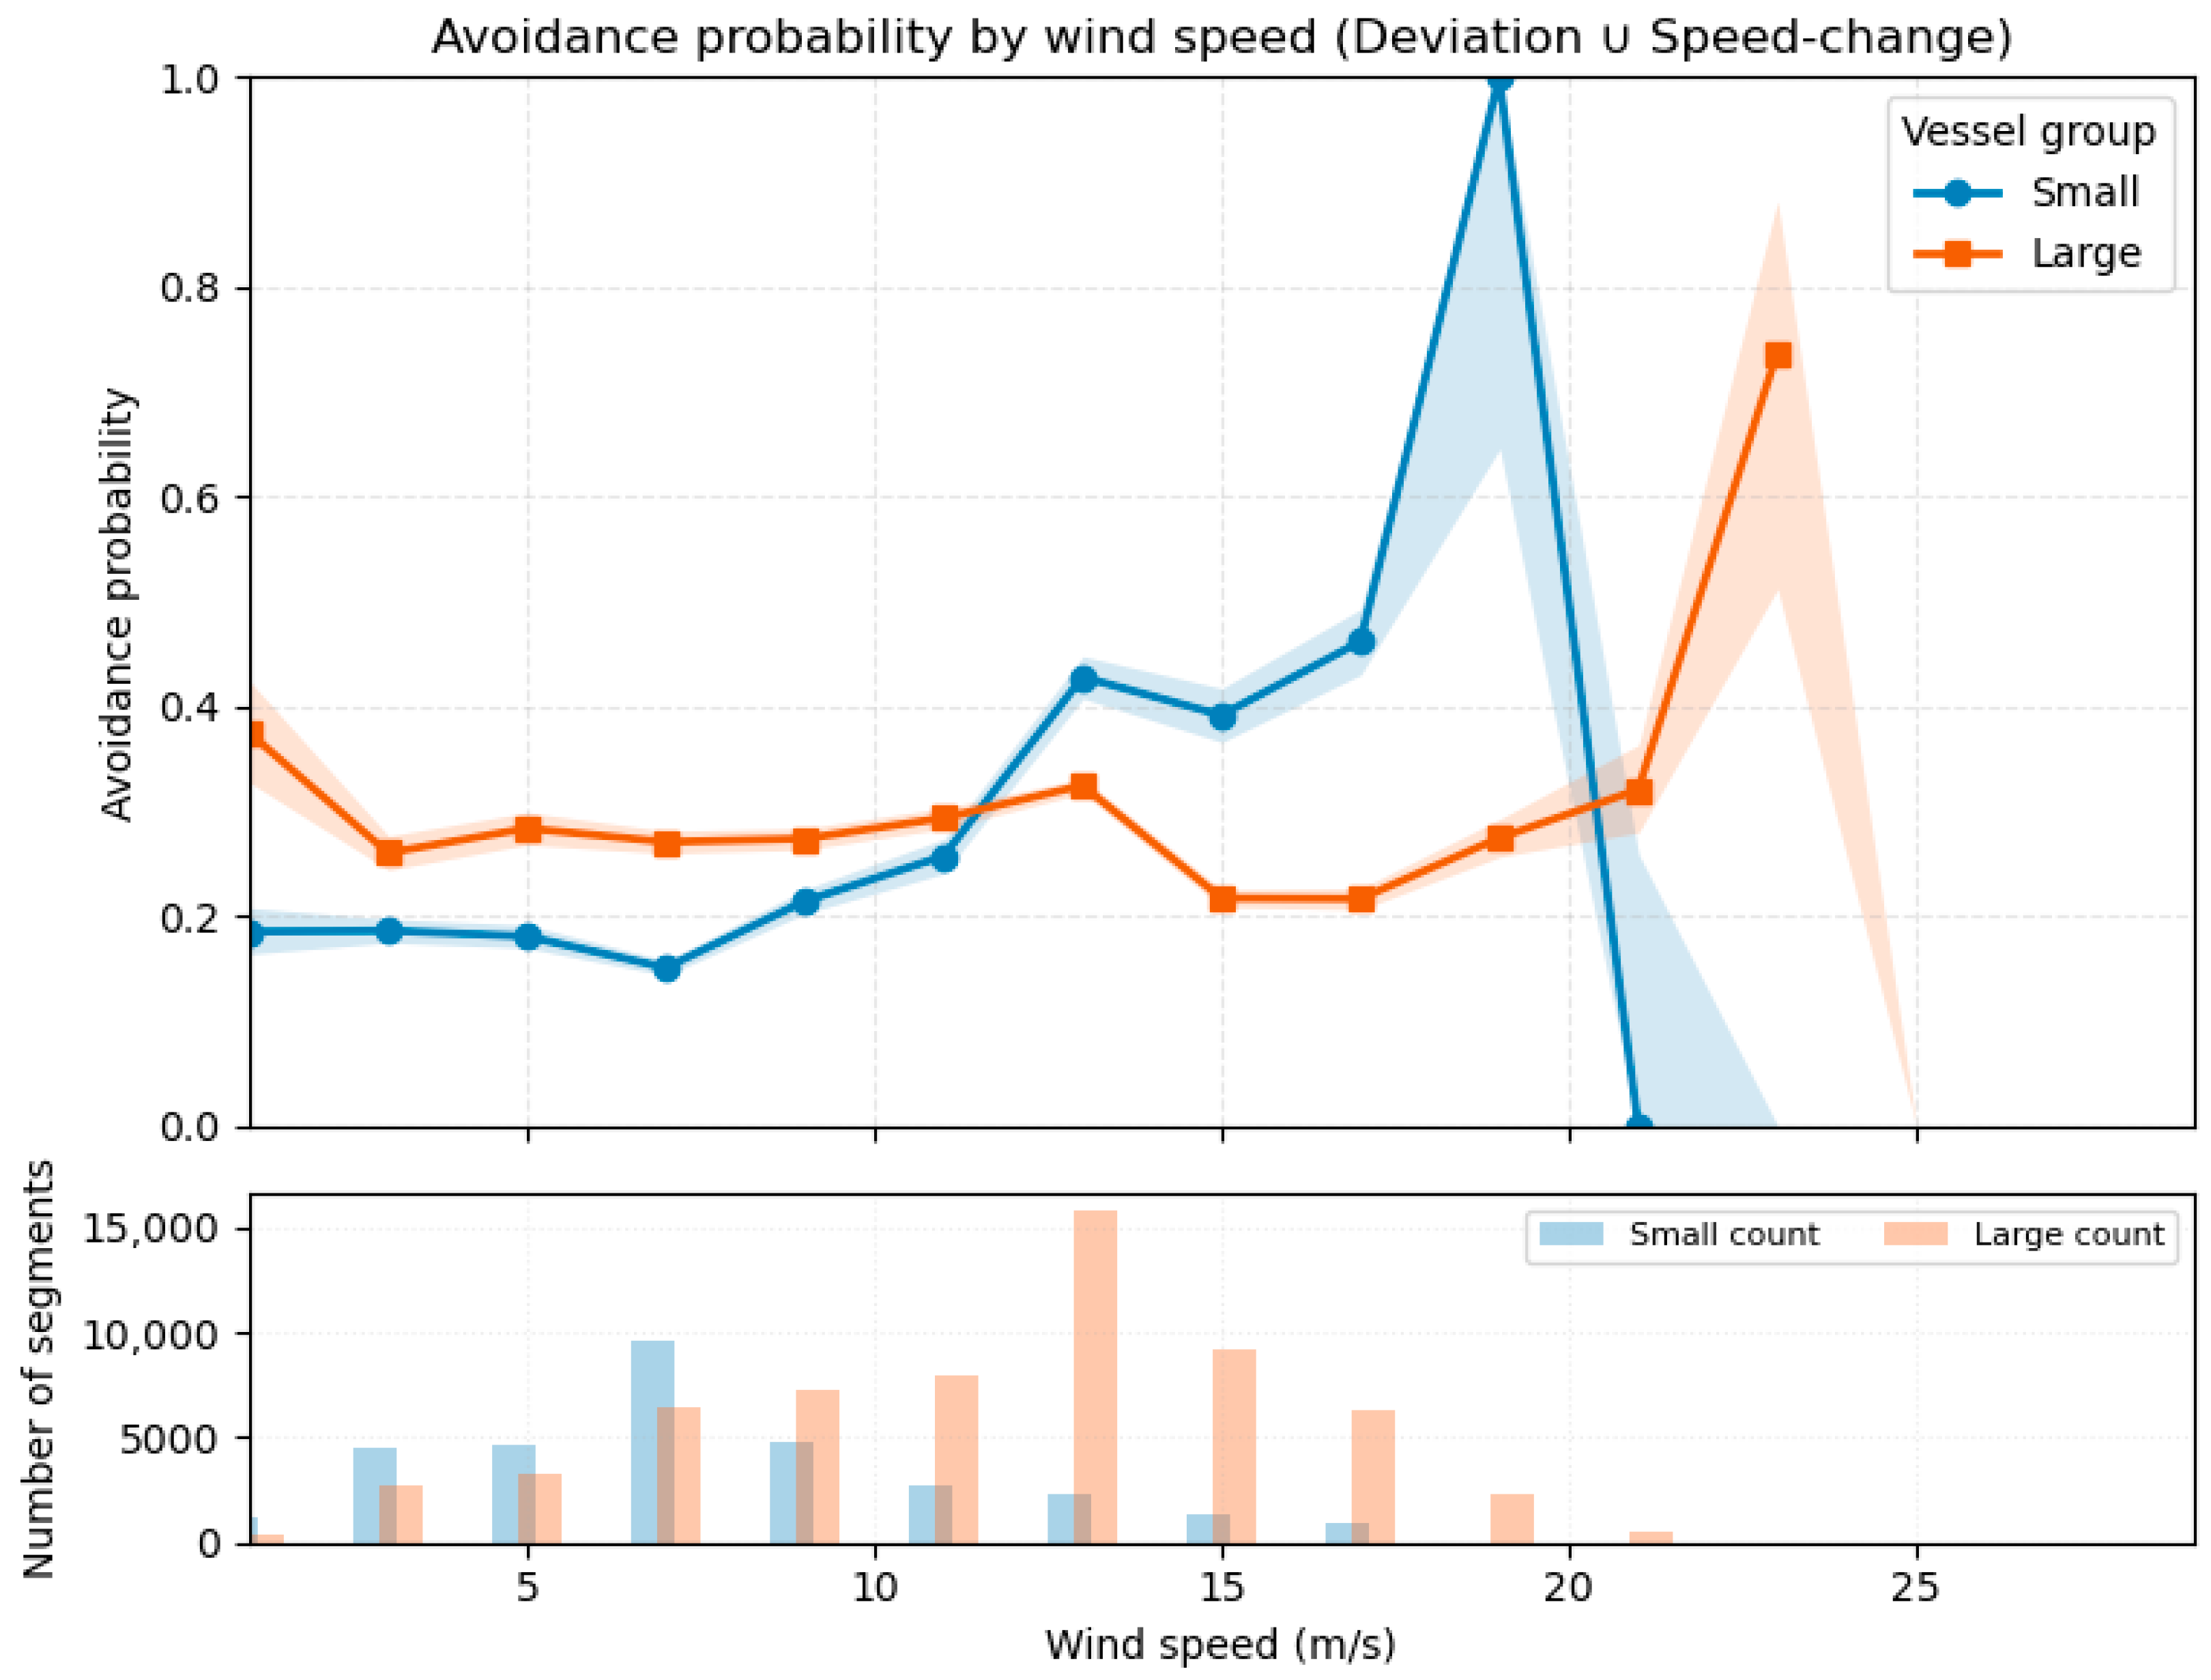
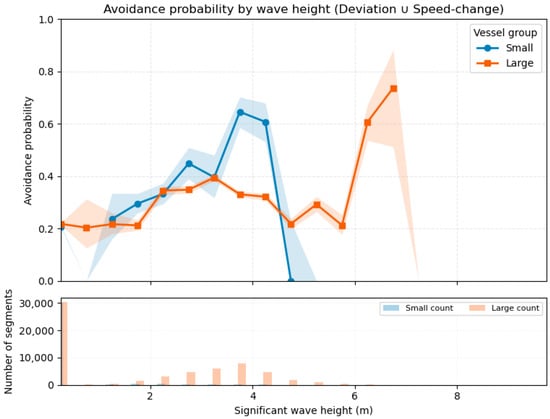
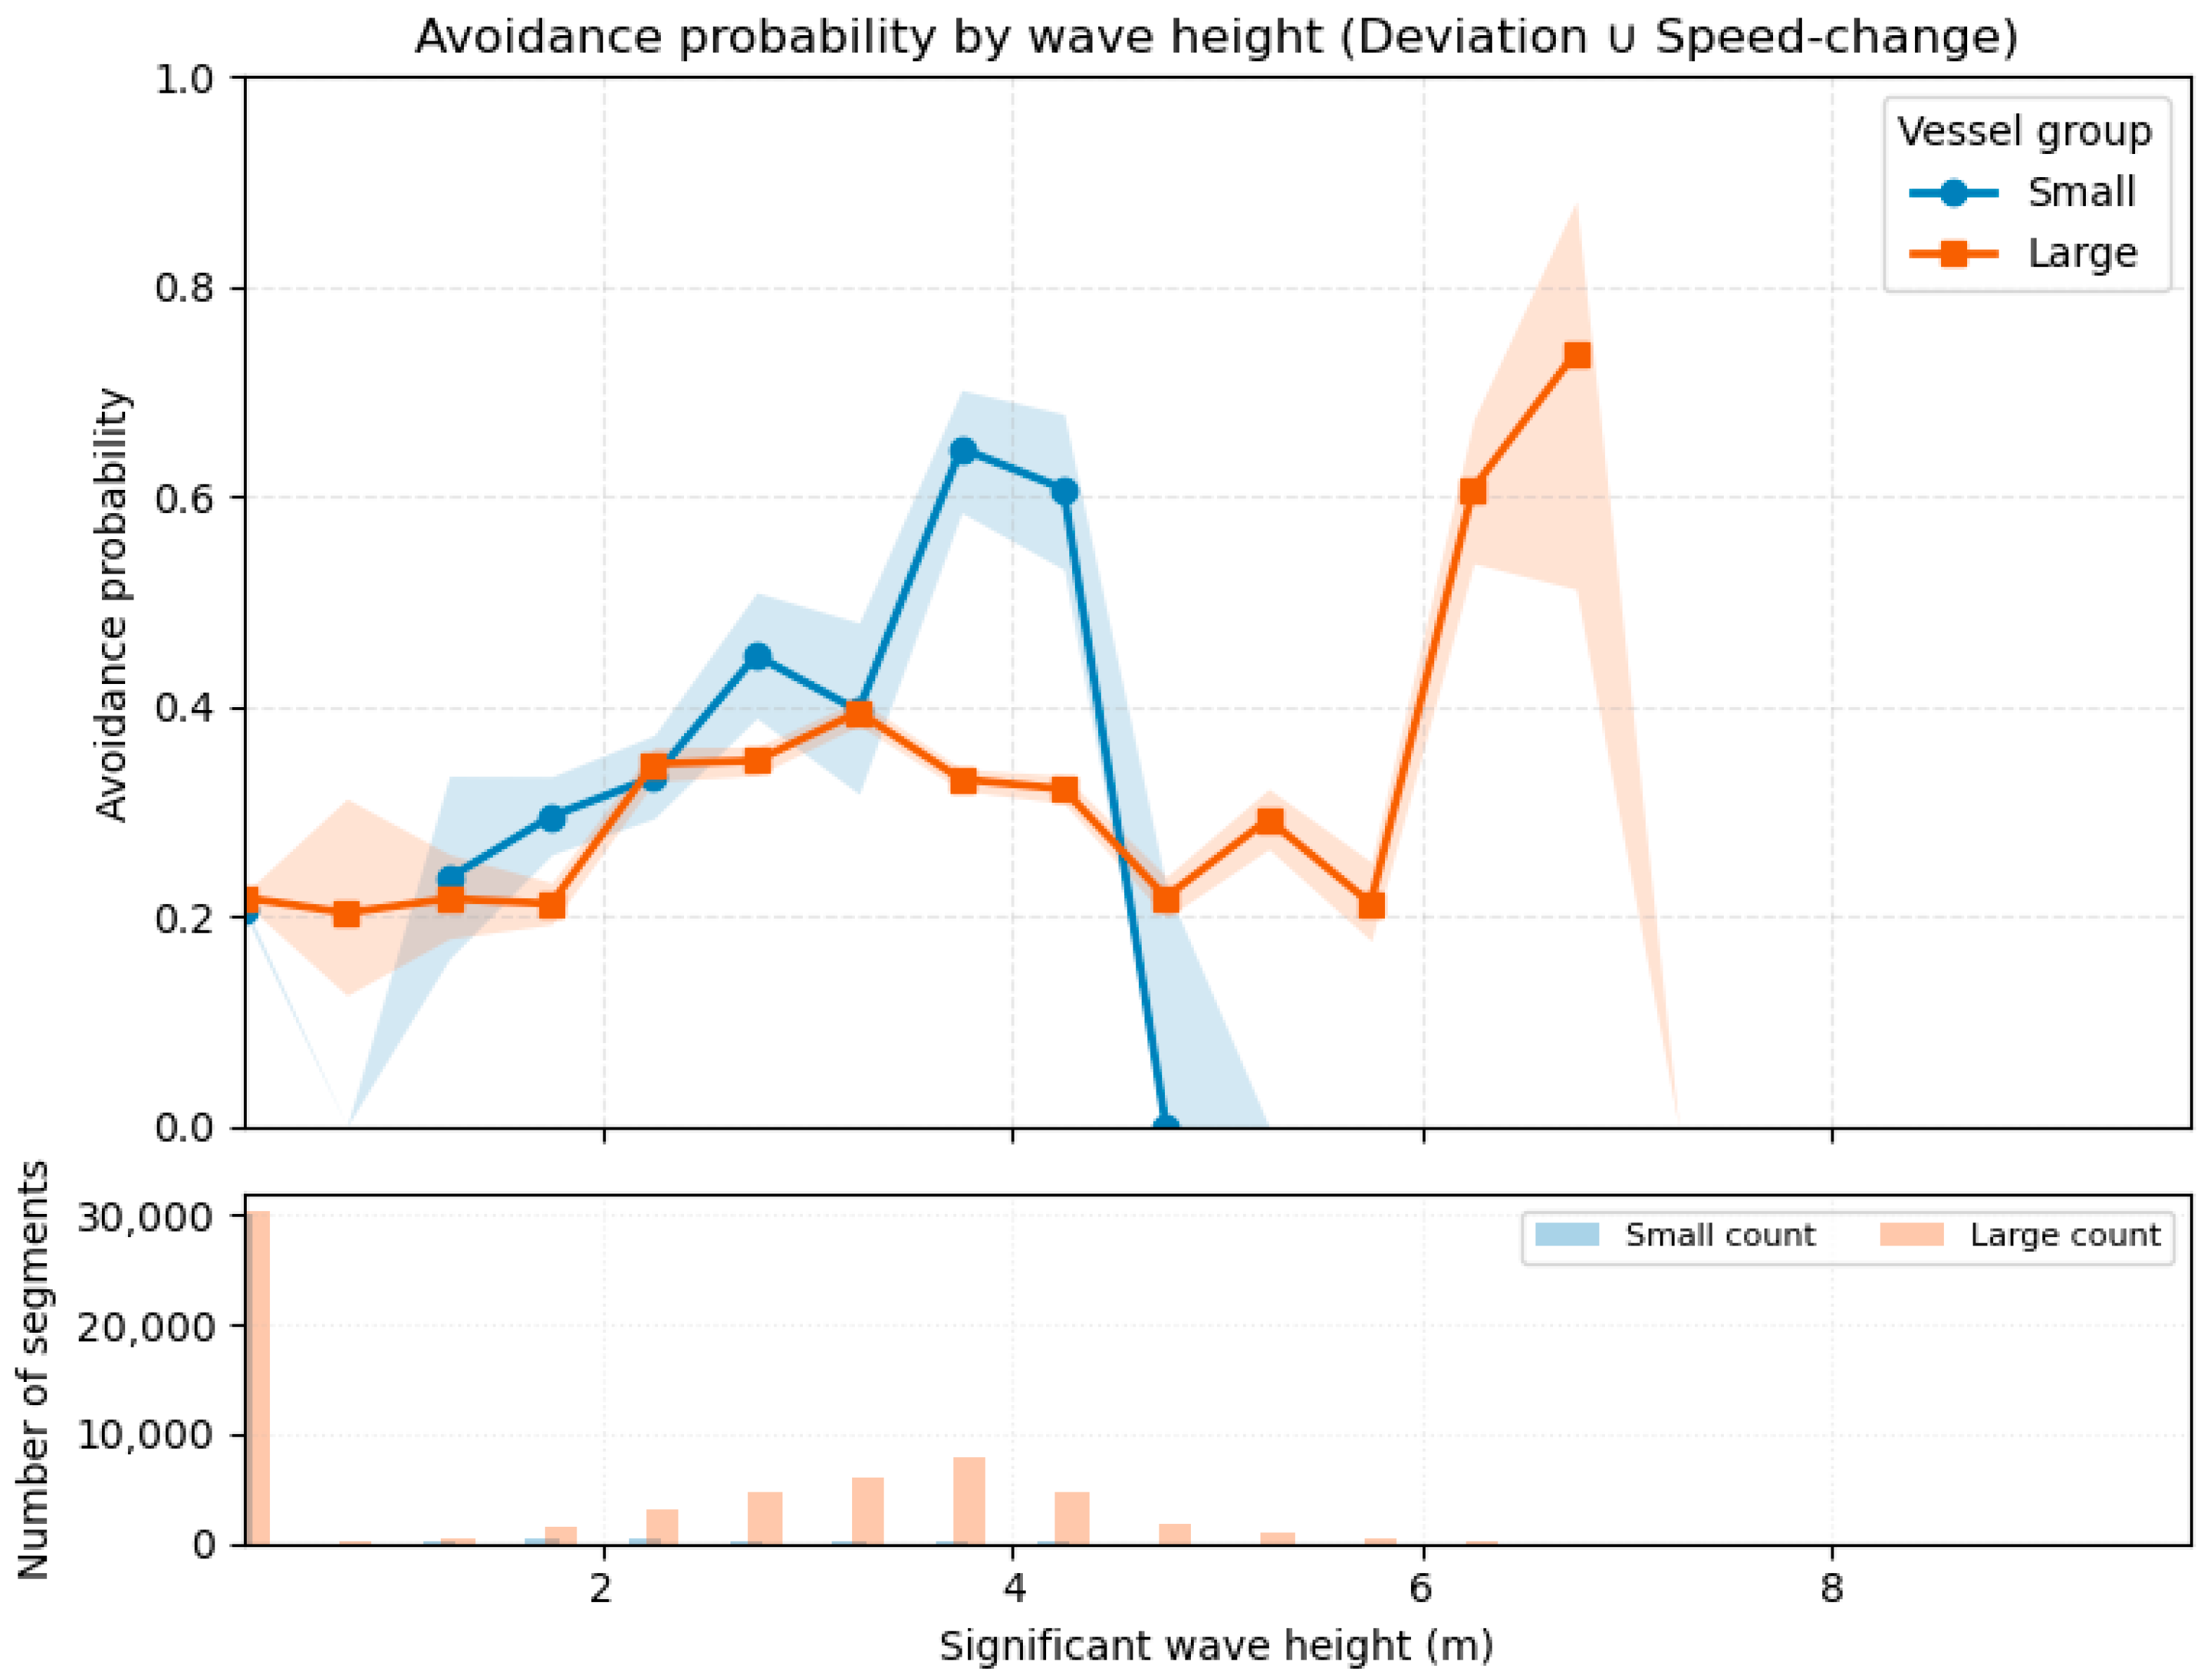
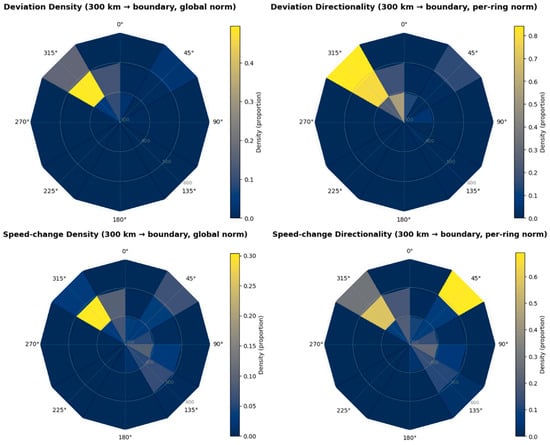
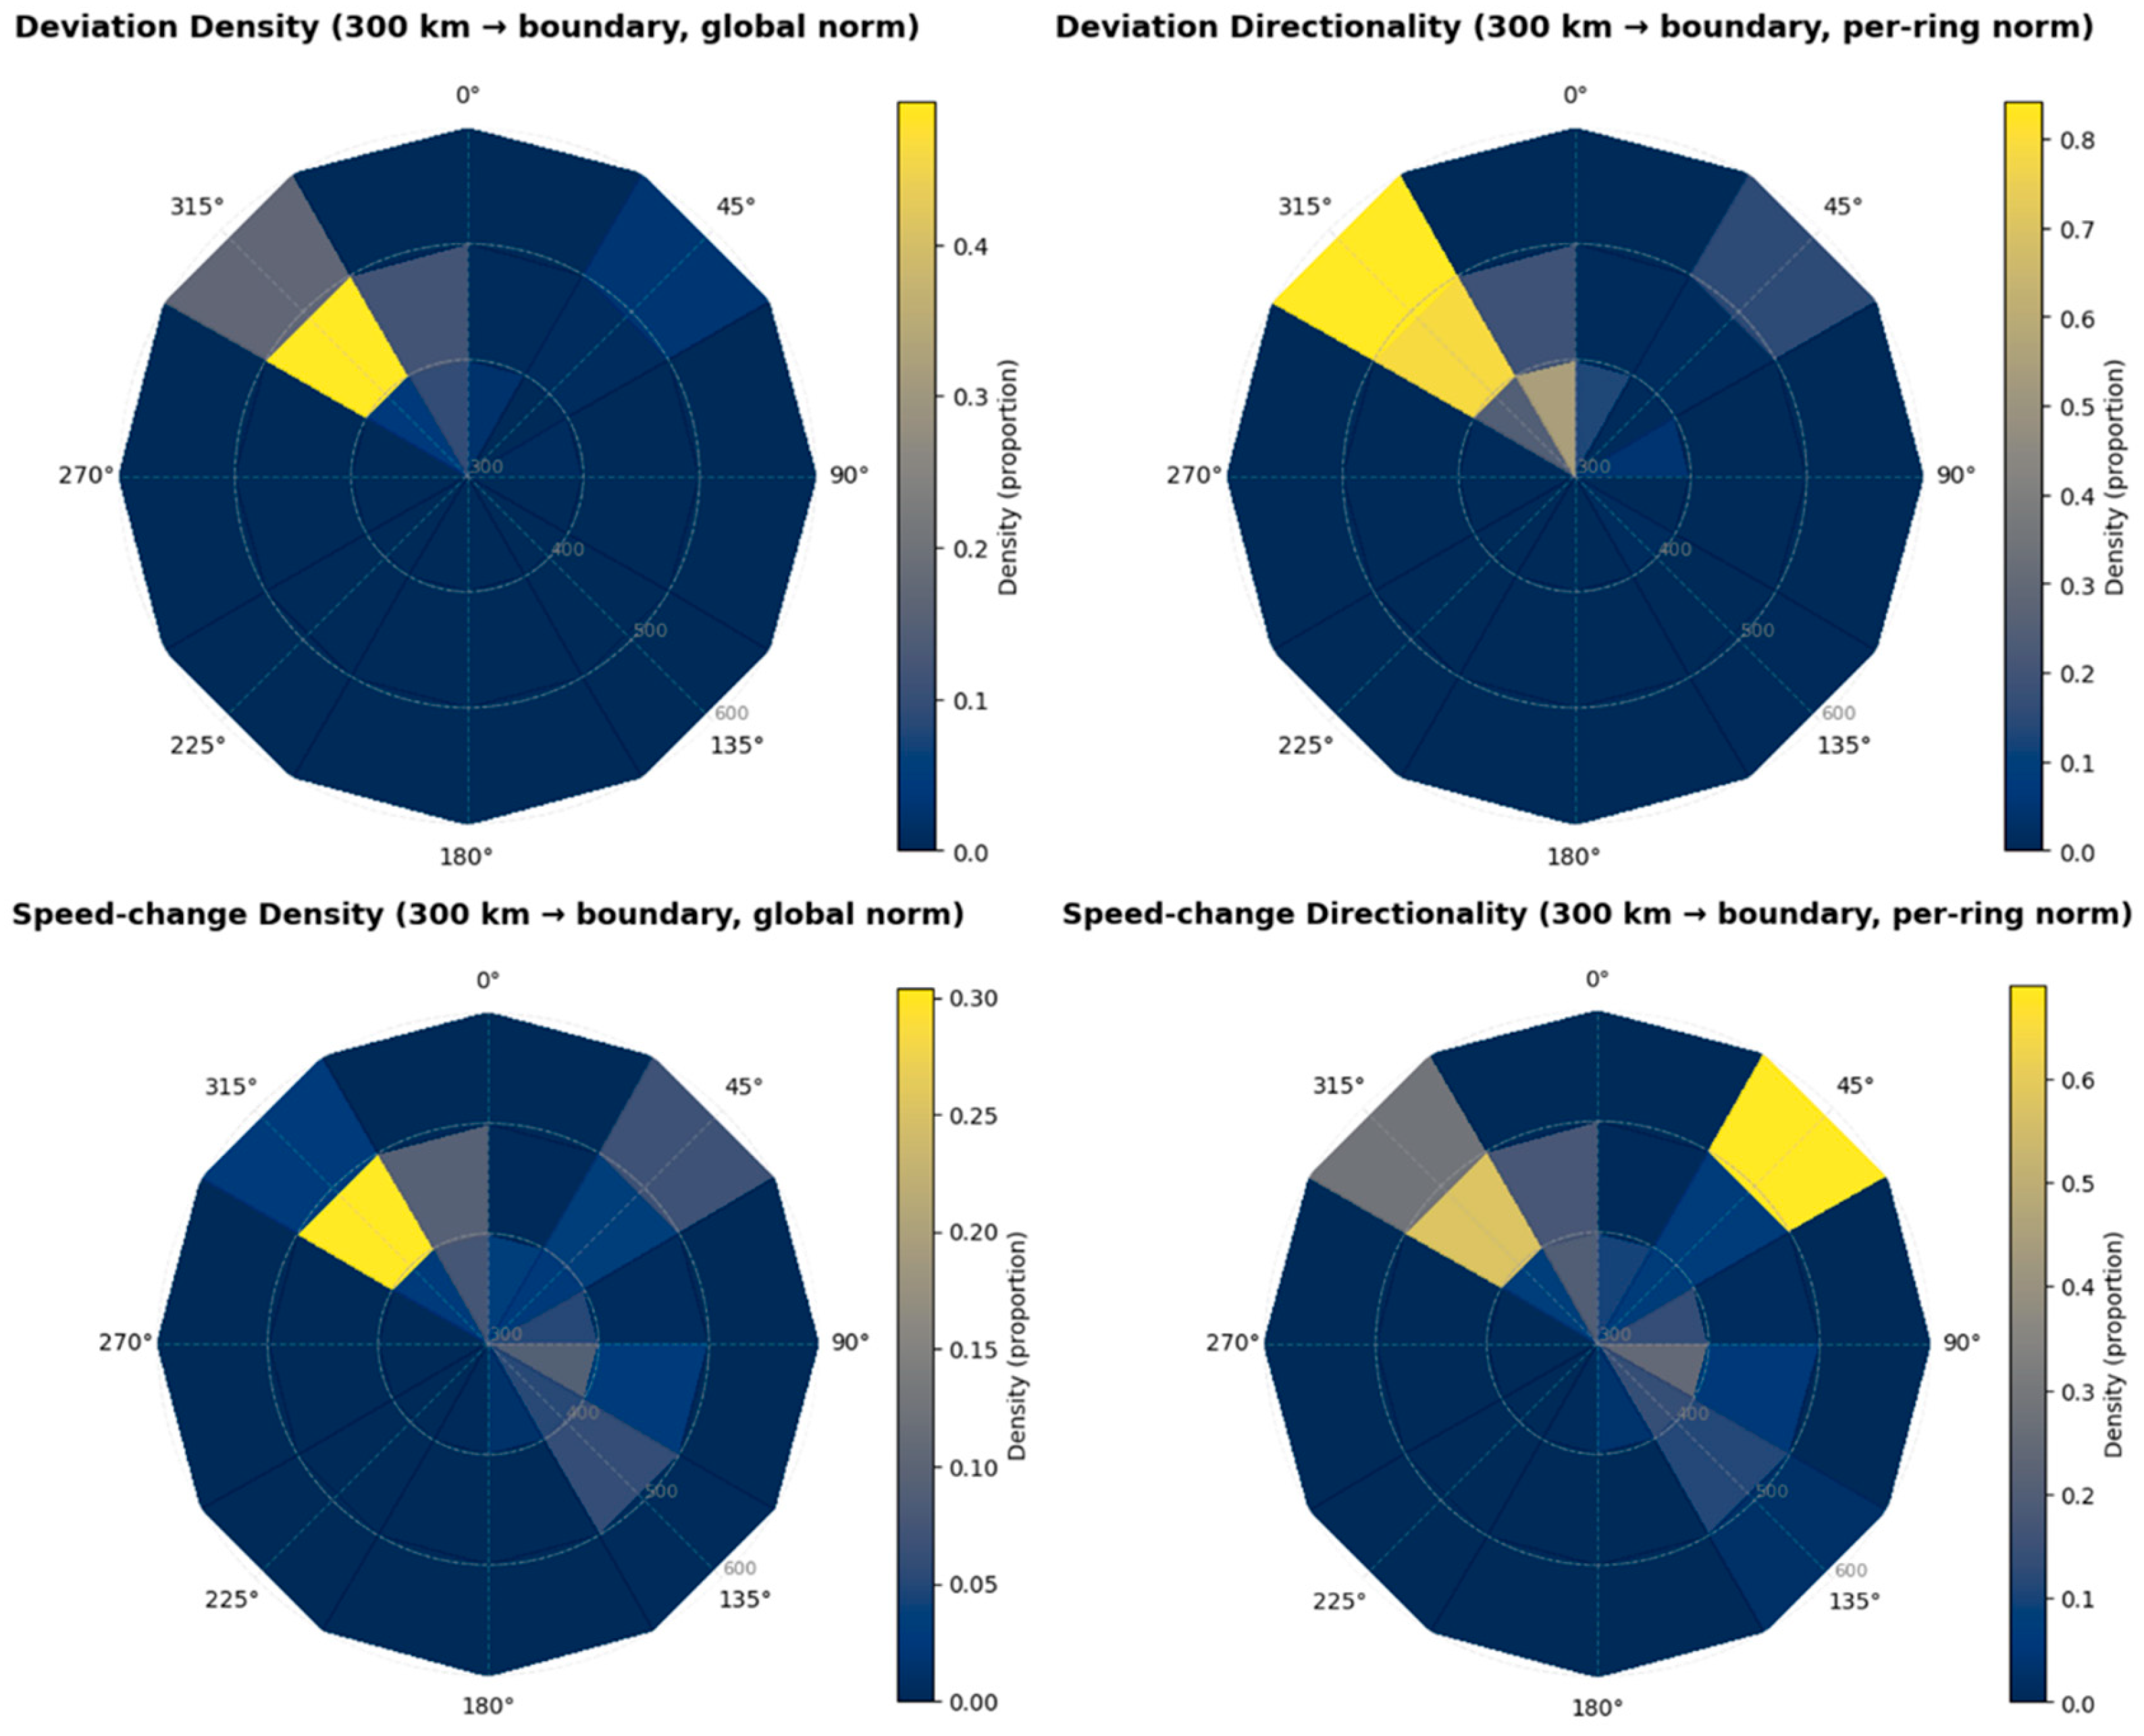

Disclaimer/Publisher’s Note: The statements, opinions and data contained in all publications are solely those of the individual author(s) and contributor(s) and not of MDPI and/or the editor(s). MDPI and/or the editor(s) disclaim responsibility for any injury to people or property resulting from any ideas, methods, instructions or products referred to in the content. |
© 2026 by the authors. Licensee MDPI, Basel, Switzerland. This article is an open access article distributed under the terms and conditions of the Creative Commons Attribution (CC BY) license.