Abstract
Accurate and automatic real-time recognition of shrimp with and without shells is the key to improve the efficiency of automatic peeling machines and reduce the labor cost. Existing methods cannot obtain excellent accuracy in the absence of target samples because there are too many species of shrimp to obtain a complete dataset. In this paper, we propose a tactile recognition method with universal applicability. First, we obtained tactile data, e.g., the texture and hardness of the surface of the shrimp, through a novel layout using the same type of sensors, and constructed fusion features based on the energy and nonstationary volatility (ENSV). Second, the ENSV features were input to an adaptive recognition boundary model (ARBM) for training to obtain the recognition boundary of shrimp with and without shells. Finally, the effectiveness of the proposed model was verified by comparison with other tactile models. The method was tested with different species of shrimp and the results were 88.2%, 87.0%, and 89.4%, respectively. The recognition accuracy of the overall, shrimp with shells and shrimp without shells verified the generalizability of the proposed method. This method can help to improve the efficiency of automatic peeling machines and reduce the labor cost.
1. Introduction
The shrimp industry is a key sector of the fishing industry [1]. Research on equipment for the automated processing of shrimp is important because manual processing not only leads to low productivity and high production costs but also reduces the quality of shrimp products [2,3]. The typical process used by shrimp peeling equipment is to first remove the head of the shrimp, followed by the shell, by squeezing it through a roller sleeve [4,5]. The automated recognition of shrimp with and without shells must be explored because existing automatic peeling machines are not perfect and require the secondary manual recognition of shrimp with shells.
Machine vision is widely used as a nondestructive detection technique for the quality evaluation and body measurement of shrimp [6,7,8] Some scholars have implemented shrimp detection tasks by extracting color, shape, and texture features from images and combining them with machine learning models [9,10,11]. Deep learning, which can automatically learn the feature representations of original image pixel data without relying on specific features, has achieved great success in the field of image recognition [12,13]. Zhang et al. proposed a YOLOv3 multisource fish detection framework based on multiscale fusion and identified fish bodies in fish images based on a CenterNet target detection network with an average accuracy of 90.2% [14]. Conrady et al. constructed a sea bream recognition model based on a mask region-based convolutional neural network (R-CNN) with good accuracy [15]. However, the visual method can recognize samples that are similar to the training samples [16]. As there are more than 2000 shrimp species, it is difficult to obtain a comprehensive sample dataset. In addition, its processing is mainly in the form of video [17], which limits its application in shrimp identification because of its long training time and high equipment requirements.
Tactile sensing is another form of perception that ignores the influence of shrimp species. Tactile sensing recognizes and detects the objects to be measured by analyzing the tactile time-series signals of these objects [18,19]. It is widely used in different fields owing to its high processing speed and recognition accuracy for objects with large force differences [20,21,22] Wang’s team and Zhang’s team applied principal component analysis (PCA) to reduce the dimensionality of tactile signals and recognize different objects by machine learning methods [23,24]. Keser’s team and Qin’s team used the discrete wavelet transform (DWT) method to generate feature vectors of tactile sample signals and then implemented the classification of tactile signals [25,26]. In the abovementioned studies, most of the tactile data on the object being tested are homogeneous, and whole or partial features are directly extracted for recognition by manual experience. However, the tactile data obtained from the surface of the shrimp is inhomogeneous, and shrimp with shells have complex and variable shell attachment sites, making it difficult to obtain accurate experimental results.
In this paper, we propose a method to identify shrimp with and without shells by tactile sensation. First, we use two sensors of the same type to obtain tactile data on the texture and hardness of the shrimp surface, and construct fusion features based on energy and nonstationary volatility (ENSV). Then, based on the feature distribution of the ENSV, an adaptive recognition boundary model (ARBM) is constructed. Finally, we verify the feasibility and generalizability of the proposed method. The main contributions of this study are as follows.
- (1)
- This is an attempt to identify shrimp with and without shells using a tactile method to address the problem of the non-universality of existing recognition methods because of the large number of shrimp species.
- (2)
- A physically meaningful ENSV-ARBM tactile signal processing scheme is proposed to amplify the tactile differences between shrimp with and without shells and reduce the effect of uncertainty in the recognition of shrimp with and without shell samples.
- (3)
- The proposed method can meet the requirements of automatic peeling machines for accurate recognition of different species of shrimp in real time, which helps to improve the efficiency of automatic peeling machines and reduce the labor cost.
2. Materials and Methods
2.1. Experimental Setup
In this study, a tactile sensor was developed. When the tactile sensor slides across the surface of an object, it senses the surface texture and hardness information of the object and transmits signals over time through two sensing cells. The tactile sensor consists of four carbon fiber plates (Zesheng Carbon Fiber Products Factory, Zhongshan, China) and two piezoelectric film polyvinylidene fluoride (PVDF) sensors (Jiangmen Antai Electronics Co., Ltd., Jiangmen, China). The fabrication of the tactile sensor proposed in this study is simple, as shown in Figure 1a.
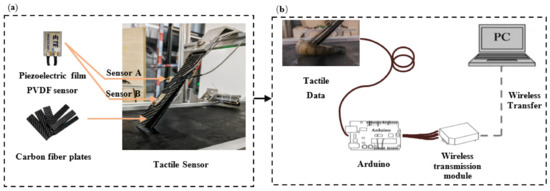
Figure 1.
Schematic diagram of tactile sensor. (a) The physical diagram of tactile sensor; (b) diagram of experimental setup of tactile time-series acquisition.
Four carbon fiber plates were offset and stacked in turn. When the tactile sensor touches an object, it amplifies the vibration features to show the tactile features of the object. Two piezoelectric film PVDF sensors with a copper block embedded in each end increases the visibility and recognizability of the tactile signal.
One piezoelectric film PVDF sensor (Sensor A) is horizontally installed in the middle of four carbon fiber plates. The copper block extends out of the carbon fiber plate and is in a suspended state. In this manner, the piezoelectric film PVDF sensor can obtain the surface texture information when the object is touched by the tactile sensor. The other piezoelectric film PVDF sensor (Sensor B) is installed in the middle of the longest carbon fiber plate. The copper block faces downward along the carbon fiber sheet. In this manner, the piezoelectric film PVDF sensor can obtain the hardness information when the object is touched by the tactile sensor. The material specifications of the tactile sensor are listed in Table 1.

Table 1.
Material and structural parameters of the tactile sensors.
The conveyor belt speed is fixed, the carbon fiber plate of the tactile sensor scans the surface of the shrimp. Sensor A captures information about the texture of the shrimp’s body by vibrating as the carbon fiber plate comes into contact with the shrimp. Sensor B, which is bent by the force created by the contact, captures information about the hardness of the shrimp. Shrimp with shells generally have a hard and rough surface, whereas shrimp without shells have a soft and smooth surface. This differential data of the shrimp’s body surface is obtained through the use of two sensing units.
The experimental setup for tactile time-series acquisition is shown in Figure 1b. First, the shrimp were transported by a conveyor belt. When the shrimp pass the laser sensor, the data from the tactile sensor were acquired. Then, the Arduino (Shanghai Longzhan Information Technology Co., Ltd., Shanghai, China) collected the output signals of the tactile sensor. These were transmitted to the Bluetooth module and wirelessly transmitted to the computer in real time for processing and analysis. The data visualization interface is based on the LabVIEW software for computing. Finally, the obtained tactile signals were processed in a MATLAB (mathematical tool) environment.
2.2. Data Processing
Tactile time-series data were obtained from shrimp with and without shells. First, discrete tactile data were preprocessed by theoretical waveform analysis. Second, the ENSV features were extracted from the preprocessed tactile data. Finally, the ENSV was input into the ARBM to obtain the recognition models of shrimp with and without shells.
2.2.1. Tactile Signal Acquisition and Preprocessing
The tactile sensors described in Section 2.1 were used to acquire tactile data from the shrimp. All samples were placed on a conveyor belt moving at a speed of 0.1 m/s for tactile data acquisition. Taking into account the distance between the end of the tactile sensor and the laser sensor, data acquisition starts 2000 ms after the laser sensor is activated to analyze the data efficiently and reduce storage space. The sampling frequency of the analog signal of the tactile sensor was set to 1300 Hz, which is twice of that of the tactile data frequency to ensure that the tactile data does not overlap in the frequency domain. To obtain the complete tactile sensing process of the shrimps, the data capacity of one sample was set to 5000 data points (2500 data points each for the Sensor A and Sensor B). The acquisition ends after 5000 data were collected for each sample.
The raw signal plot is shown in Figure 2a. The blue waveform represents the data acquired by Sensor A, i.e., the shrimp surface texture information. The red waveform represents the data acquired by Sensor B, i.e., the shrimp hardness information. During the dynamic process of data acquisition, the raw output signal contains a DC component, which leads to a nonzero starting signal and different starting values for the two sensing cells.
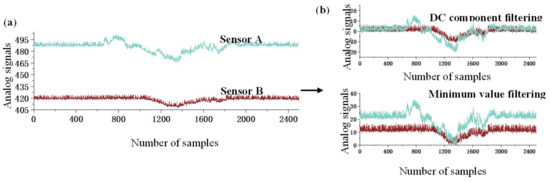
Figure 2.
Data preprocessing process diagram. (a) Waveform diagram of the original tactile signal; (b) Waveform diagram of the tactile data after preprocessing.
When the energy features were extracted, the direct calculation of energy features would result in large energy values for each segment. When the nonstationary volatility was extracted, the direct calculation of nonstationary volatility of tactile signals would result in small nonstationary volatility values for each segment. Both cases affect the recognition accuracy of the sensor. Therefore, it is necessary to filter the DC components of the signal. However, when the DC component is filtered, the tactile signal will contain data less than 0, which leads to errors in the calculation of nonstationary volatility values. The data after preprocessing are shown in Figure 2b.
To reduce the interference of DC components in feature extraction, two tactile signal preprocessing methods were used. These are the direct filtering of the DC components from tactile signals when extracting energy features, and the minimum value filtering of tactile signals when extracting nonstationary volatility features. The specific raw signal processing is expressed as Formulas (1) and (2).
where SCN is the filtered DC component signal, is the number of sampling points per sensing cell ( = 2500), is the original tactile signal, is the average value of the raw tactile signal, is the minimum value of the filtered signal, and is the minimum value of the raw tactile signal.
Tactile signals are directly used to train the model to recognize different objects by undergoing a complex learning process that ignores the detailed feature information about the surface texture and hardness [27]. The segmentation of the preprocessed tactile signal can tap into the details of the tactile signal, and reducing the signal length to process at each instant while keeping the signal characteristics [28]. The sliding window method was used to segment the data with a certain step size to ensure data continuity after segmentation. The effects of data segmentation are shown in Figure 3a,b. The number of segments is calculated by
where is the number of segments ( is an integer), is the length of the preprocessed data, is the window data length, and is the sliding step of the segments. The window data length and sliding step length were set as 50 and 10, respectively.
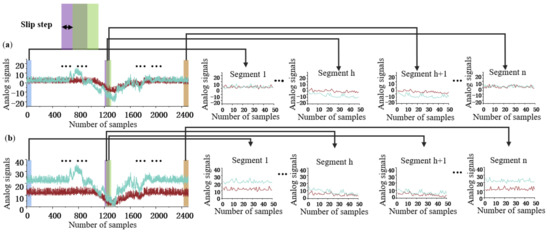
Figure 3.
Schematic diagram of tactile data segmentation. (a) Schematic diagram of tactile signal segmentation with DC component filtering; (b) schematic diagram of tactile signals segmentation with minimum value filtering.
2.2.2. ENSV Features Extraction
Machine learning techniques combined with feature extraction methods can improve the recognition accuracy as well as speed-up the training process. We selected the ENSV features as the feature vector for the recognition of shrimp with and without shells. The energy feature in ENSV characteristics can well reflect the changes of the force on the sensor, and the nonstationary volatility feature can make the sensor more clear in the force process. The fusion of the two features can reduce the interference of invalid information and amplify the tactile differences between shrimp with and without shells.
First, the energy features of each segment were extracted after DC component filtering. Second, the nonstationary volatility features of each segment were extracted after minimum filtering. Finally, the energy and nonstationary volatility features were fused to obtain the identification feature vector. The feature extraction process is shown in Figure 4.
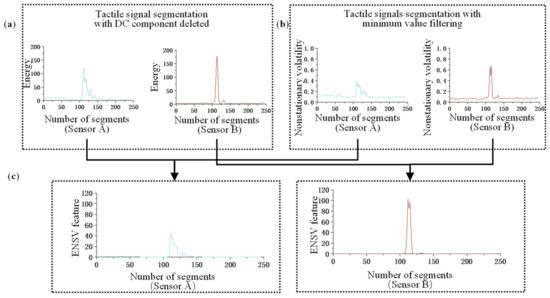
Figure 4.
Feature extraction process diagram. (a) The result of the energy features of each segment; (b) the result of the nonstationary degree of fluctuation of each segment; (c) the result of feature fusion.
In the process of acquiring tactile signals, there is a difference in the blocking force between the tactile sensor and shrimp with and without shells. The surface of shrimp without shells is smooth and soft, producing a small blocking force. In contrast, the surface of shrimp with shells is rough and hard, producing a large blocking force. To describe the process of changing force on the tactile sensor as it slides across the shrimp surface, we extracted the energy of each segment as a feature after DC component filtering. The calculation formula is expressed as (4). The effect is shown in Figure 4a.
where is the average energy of each segment. is the tactile data of each segment after DC component filtering, ( = 1, 2, …, 2500). is the sequence number of the sampling point. The formula of the segmented energy feature vector is expressed as (5).
When the tactile sensor is not in contact with the shrimp, the tactile sensor data is stable. When the tactile sensor is in contact with the shrimp, it deforms and vibrates, and tactile signals produce nonstationary volatilities. This type of volatility differs from that of a stationary signal. We extracted the nonstationary volatility of each segment as a feature after minimum value filtering. The effect is shown in Figure 4b.
Ideally, for stationary volatility data, the sum of squares of any two tactile data points is equal to two times the square of the initial value. Let be the value of any sampling point in a segment after the minimum value is deleted. is the value of exploring sampling points backwards from the nth sampling point. These are expressed as
where Sw is a function that varies with the sampling point , represented as . In an ideal case, the is constant for stationary data. The mathematical expectation of the in a certain segment is
The relative mean square deviation of and its mathematical expectation E is
σWi increases with the degree of nonstationarity. If the data are stationary under ideal conditions, then = 0. The degree of nonstationary volatility of the feature vector is expressed as
This feature amplifies the textural and hardness characteristics of the tactile sensor during contact with the shrimp, and reduces the data interference in the noncontact state. The expression of this feature is provided in (10) and illustrated in Figure 4c.
2.2.3. ARBM Construction
As mentioned in the introduction, shrimp with shells have complex shell attachment sites. Therefore, we propose an ARBM to solve this problem. First, the ENSV feature vectors were pretrained using a back-propagation (BP) neural network fitting model, as shown in Figure 5. Then, the feature vectors of shrimp samples with and without shells were assumed to be located in different circular regions, and the center of each class was calculated, as shown in Figure 6a. Finally, the radius of the recognition boundary was obtained by training. The recognition boundary of shrimp without shells was retained, while that of shrimp with shells was discarded. The shrimp with and without shells are located outside and inside the boundary, respectively, as shown in Figure 6b.
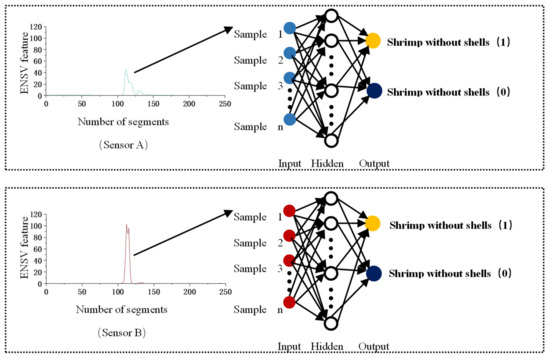
Figure 5.
Pretraining flow chart.
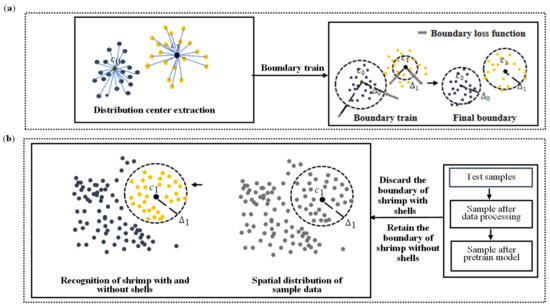
Figure 6.
Boundary training and recognition schematic. (a) The boundary training schematic; (b) the recognition schematic.
Pretraining
We pretrained the model using shrimp with and without shells as prior knowledge. This enables more respective clustering of the ENSV feature vector distributions of shrimp with and without shells. Artificial neural networks were used to classify the feature dataset [29]. In general, BP neural networks do not have strict data distribution requirements. These can automatically transform the initial “bottom” feature representation into the “top” feature representation through multilevel and nonlinear transformations [30]. This part uses ENSV as prior knowledge for the pretraining process. The data from Sensor A and Sensor B are trained separately. The number of neural nodes in the input layer corresponds to the number of segments of the samples. The model input is the ENSV feature vectors extracted from the sample. The number of neurons in the hidden layer is 10. The number of neural nodes in the output layer corresponds to whether the shrimps have shells (1 for shrimp with shells and 0 for shrimp without shells), as shown in Figure 5.
Boundary Training
In this section we input the data to the pretrained neural network fitting model. Then the fitted values of shrimp with and without shells from different sensors are obtained. Place the values of Sensor A and Sensor B in the same two-dimensional coordinate system. The flow chart of boundary training and recognition is shown in Figure 6.
Pretraining uses the ENSV features of Sensor A and Sensor B as input quantities and shrimp with and without shells as output quantities. This process groups shrimp by their class and separates different classes. To make data computation more efficient and improve real-time processing, we use a circular boundary defined by only two parameters (radius and cluster center) to simplify the data analysis. Before training the recognition model, the centers of the feature vector distributions of shrimp with and without shells must be determined. Shrimp with shells are one class, while shrimp without shells are another. The sample dataset of a class is treated as a cluster, and the cluster centers are determined by calculating the mean feature vector of each cluster.
where is the set of ENSV and its label. For shrimp with and without shells, = 1 and = 0, respectively. is the number of sample sets marked as the same class. is the cluster center.
Define as the radius of the recognition boundary relative to the center of the circle . The ENSV should satisfy the following constraints:
where represents the Euclidean distance between and . The SoftPlus activation function was used to map the radius and radius parameters.
where is the cluster radius and is the radius parameter.
On the one hand, it is hoped that the recognition boundary can surround most shrimp with and without shells. On the other hand, it is also hoped that the boundary of the circle is not too far from the center of the cluster. Therefore, the following boundary loss function is adopted.
where M is the total number of shrimp samples with and without shells, and is the label of the ith sample. is defined as
Then, the radius parameter is optimized using a random gradient descent:
where is the learning rate of the boundary parameters. The is calculated by
If , then ; if , then . In this way, the learned radius parameters not only surrounds most shrimp with and without shells, but also avoids the cluster centers of each type.
After learning the center and recognition boundary radius of shrimp with and without shells, we discarded the boundary of shrimp with shells and retained that of shrimp without shells. This is because shrimp with shells have different shell attachment areas, resulting in a wider spatial distribution of feature vectors for tactile recognition. In contrast, the feature vectors of shrimp without shells are relatively fixed. The presence of interference samples affects the recognition accuracy when training is conducted using only shrimp samples without shell samples. In addition, the maximum number of shrimp with shells must be recognized to ensure the effectiveness of the industrial production process.
During the test, the distance between the test sample and the class center of shrimp without shells was calculated. When the distance is less than the radius of the boundary of the shrimp without shells, it is judged as shrimp without shells; otherwise, it is judged as shrimp with shells.
3. Results and Discussion
Two experiments were conducted to evaluate the performance of the proposed method in recognizing shrimp with and without shells. In one experiment, the species Macrobrachium rosenbergii was selected as the training sample, and the trained ARBM was compared with the proposed tactile recognition model. In the other experiment, five different shrimp species were selected for testing, and the trained ARBM model was compared with the vision model. The overall recognition accuracy for shrimp with and without shells is the performance evaluation index expressed as (18)–(20).
where is the overall recognition accuracy, is the number of correct recognitions of shrimp with shells, is the number of correct recognitions of shrimp without shells, is the number of incorrect recognitions of shrimp with shells, is the number of incorrect recognitions of shrimp without shells, is the recognition accuracy of shrimp with shells, and is the recognition accuracy of shrimp without shells.
3.1. Compare Different Tactile Recognition Models
To verify the validity of the ENSV-ARBM, we selected headless Macrobrachium rosenbergii shrimps as our experimental samples. The samples of Macrobrachium rosenbergii had a length of 8.2–9.8 cm and a weight of 35.2–40.1 g. Five hundred (500) shrimp with shells and another 500 without shells were examined.
First, the speed of the conveyor was fixed at 0.1 m/s. The shrimps passed the tactile sensor at specific time intervals, which must be longer than the time required to fully acquire the tactile sensations of a shrimp. After each shrimp passes the tactile sensor, the corresponding tag is manually recorded and the tactile data is saved. The experiment is conducted in MATLAB 2022a 64-bit (MATLAB, 2022a) platforms using a 2.7 GHz notebook computer with an Intel(R) Core (TM) CPU and 8 GB RAM. The samples of the tactile recognition of shrimp are shown in Figure 7. The device described in Section 2.1 was selected for data collection. Tactile data were collected from all experimental samples (i.e., 500 shrimp with shells and 500 without shells). Finally, 70% of shrimp with and without shells were randomly selected as the training set, 15% as the validation set, and 15% as the test set.
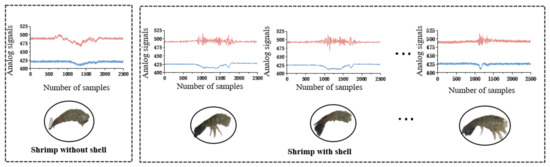
Figure 7.
Plot of raw data of shrimp with and without shells.
The identification of shrimp with and without shells is based on the difference in their waveforms. When a tactile sensor scans a shrimp with shells, the grooves on its body cause the sensor to produce a more pronounced jitter and oscillation signal. As the surface area of the shrimp shell increases, the duration of the oscillation signal generated by the sensor decreases. Sensor B, located on the outermost carbon fiber plate, detects a certain protruding waveform due to the increased hardness of the shrimp’s body. On the other hand, when a tactile sensor scans a shrimp without shells, the friction gradually increases as it scans the shrimp’s smooth and soft body. As a result, the waveforms obtained from Sensors A and B on the surface carbon fiber plate are smoother and contain less energy. The results of the comparisons with tactile perception methods proposed in the literature are listed in Table 2.
Table 2.
Comparison of the results of the proposed scheme with other tactile methods.
The statistical results in Table 2 show that ENSV-ARBM method has the highest , , and of 88.7%, 85.3%, and 92.0%, respectively. The ENSV feature is a fusion of the energy and nonstationary volatility features, in which the energy feature reflects the dynamic changes in the force during the tactile process, and the nonstationary volatility feature extracts the fluctuating data during the contact between the sensor and shrimp surface. The fusion of these two features can effectively amplify the differences in the surface texture and hardness between shrimp with and without shells as well as mask invalid data to identify the physically significant features of both types of shrimps. The ARBM is a recognition model based on the spatial distribution of the data, which enables the secondary classification of shrimp with and without shells. The model uses the distribution boundary of the sample space of shrimp without shells as a classification boundary in the presence uncertainty regarding the attachment surface of shrimp samples with shells.
The results in Table 2 demonstrate the effectiveness of the ENSV-ARBM-based tactile recognition of shrimp with and without shells. The overall recognition rate is better than that of the other tactile recognition algorithms. Shrimp without shells are smooth and soft to the touch, whereas shrimp with shells are rough and hard to the touch. By effectively extracting the texture and hardness tactile features of different shrimp body surfaces, the recognition accuracy of shrimp with and without shells can be improved. In addition, the stable tactile data boundaries of shrimp without shells reduces the problem of the complex shell attachment locations of shrimp with shells.
3.2. Compare Different Vision Recognition Models
To verify the generalizability of the proposed ENSV-ARBM for the tactile recognition of shrimp with and without shells, we selected five different shrimp species for comparative experiments using the machine vision approach and the tactile approach described in Section 3.1. These include Panulirus argus, Macrobrachium rosenbergii, Penaeus chinensis, Oratosquilla oratoria, and Metapenaeus ensis, as shown in Figure 8. There were 100 shrimp with shells and 100 shrimp without shells for each species.
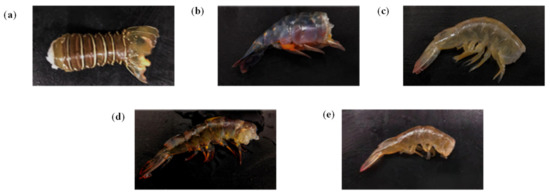
Figure 8.
Photos of five different shrimp species. (a) Panulirus argus; (b) Macrobrachium rosenbergii; (c) Penaeus chinensis; (d) Penaeus japonicus; and (e) Metapenaeus ensis.
After decapitation, we measured the size and weight of the shrimp samples using a ruler and an electronic scale, respectively. The samples of Panulirus argus had a length of 13.1–15.9 cm and a weight of 69.3–72.5 g. The samples of Macrobrachium rosenbergii had a length of 8.2–9.8 cm and a weight of 35.2–40.1 g. The samples of Penaeus chinensis had a length of 10.7–12.8 cm and a weight of 33.3–39.8 g. The samples of Oratosquilla oratoria had a length of 11.3–13.1 cm and a weight of 35.4–42.5 g. The samples of Metapenaeus ensis had a length of 7.3–8.4 cm and a weight of 28.7–32.0 g.
In the area of tactile recognition, we selected the ENSV-ARBM-based tactile recognition method for our experiments. The trained model in Section 3.1 was selected to test the five different shrimp species. In the area of visual recognition, we used an industrial camera (HIKVISION) with a CMOS sensor as the data source for visual recognition. The sensor size is 22.3 mm × 14.9 mm, the effective pixels are 18 million, and the acquired image resolution is 2928 × 3904 (pixels). To test the fairness of the assessment, samples of 500 shrimp with shells and 500 without shells were photographed along the conveyor belt. The image information obtained was fed into the YOLOv3 and R-CNN frameworks for training purposes. The trained model then was applied to test the recognition of five different shrimp species with and without shells. The experimental results are listed in Table 3 and Table 4.
Table 3.
Comparison of results between the proposed scheme and other tactile methods.
Table 4.
Comparison of results between the proposed scheme and other vision methods.
From Table 3, we can see that our proposed tactile perception method is better compared to other tactile methods. From Table 4, in terms of the average overall recognition accuracy, the ENSV-ARBM-based tactile recognition method exhibited the best performance for the , , and with 88.2%, 87.0%, and 89.4%, respectively. This was followed by the YOLOv3. R-CNN exhibited the worst performance for the , , and with 82.8%, 83.8%, and 81.8%, respectively. With regard to the recognition accuracy for each shrimp species, the vision recognition methods for the Macrobrachium rosenbergii and Panulirus argus were better than the tactile recognition approach.
Macrobrachium rosenbergii and Panulirus argus, with and without shells, were visually distinguished. The Penaeus chinensis and Metapenaeus ensis have transparent shells; hence, the visual recognition method misidentified shrimp with shells as shrimp without shells when the shells were attached to the tail. For Penaeus japonicus, both shrimp with and without shells showed a black color; hence, the visual method misidentified shrimp without shells as shrimp with shells.
The ENSV-ARBM-based tactile recognition method identifies whether shrimps have shells mainly through the dynamic changes in the texture and hardness of the shrimp surface. Although the flesh and shell of different shrimp species have different forms, textures, and colors, the variations in texture and hardness are similar. The machine vision training samples must be comprehensive, whereas the tactile method only identifies the physical features of texture and hardness of shrimp with or without shells; hence, it has better universality. The experimental results demonstrate the universality of ENSV-ARBM-based tactile recognition and provides good results for the recognition of different shrimp species.
4. Conclusions
A tactile recognition method based on ENSV-ARBM is proposed to address the problem of recognizing shrimp with and without shells. The method uses Macrobrachium rosenbergii shrimp as our training samples. We obtained tactile information by a self-designed tactile sensor and achieved the recognition of shrimp with and without shells by the proposed ENSV-ARBM method.
The effectiveness of the proposed ENSV-ARBM approach to tactile perception was verified by comparison with other tactile models. The method we propose amplifies the tactile differences between shrimp with and without shells. In addition, it overcomes the problems of uneven distribution of tactile data and the lack of shrimp samples to enable the recognition of shrimp with and without shells. The method was tested with different species of shrimp and the results were 88.2%, 87.0%, and 89.4% for , , , respectively, which verified the generalizability of the proposed method.
In conclusion, it has an advantage over other methods in the universality of different species of shrimp recognition and can meet the requirements of real-time and high-accuracy recognition for embedded devices. The method can provide an effective solution for automatic peeling machine to recognition shrimp with and without shells.
Author Contributions
Conceptualization, X.C. and Y.X.; methodology, X.C., T.W. and Y.X.; software, Y.X.; validation, X.C., Y.X. and P.D.; formal analysis, Y.X.; investigation, P.D.; resources, E.Z.; data curation, C.T.; writing—original draft preparation, Y.X.; writing—review and editing, X.C.; visualization, C.W.; supervision, X.C.; project administration, X.C.; funding acquisition, X.C. All authors have read and agreed to the published version of the manuscript.
Funding
This research was funded by Guangdong Province key areas of research and development program, grant number 2021B0202060002.
Institutional Review Board Statement
Not applicable.
Informed Consent Statement
Not applicable.
Data Availability Statement
The data presented in this study are available on request from the corresponding author. The data are not publicly available since future studies are related to current data.
Conflicts of Interest
The authors declare no conflict of interest.
References
- Chang, Z.Q.; Neori, A.; He, Y.Y.; Li, J.T.; Qiao, L.; Preston, S.I.; Liu, P.; Li, J. Development and current state of seawater shrimp farming, with an emphasis on integrated multi-trophic pond aquaculture farms, in China—A review. Rev. Aquac. 2020, 12, 2544–2558. [Google Scholar] [CrossRef]
- Zhao, L.T.; Xi, M.J.; Wang, W.; Chu, X.; Zhao, X.; Yuan, Y.; Liu, S.Q. A review of technology development process of a typical shrimp peeling machine. J. Adv. Mech. Des. Syst. Manuf. 2015, 9, JAMDSM0013. [Google Scholar] [CrossRef]
- Zhang, X.H.; Zhao, Q.L.; Zhao, Y.D.; Wang, Z.H.; Yi, J.G. Parameter and pretreatment condition optimization of dual rollers extrusion peeling device for Litopenaeus vannamei. Editor. Off. Trans. Chin. Soc. Agric. Eng. 2014, 30, 308–314. [Google Scholar] [CrossRef]
- Yi, J.G.; Ma, J.Y.; Wang, Z.H.; Zhang, X.H.; Yang, S.H. Status and Development of Shrimp Processing Equipment. Mod. Agric. Equip. 2020, 41, 2–11. [Google Scholar]
- Zhang, X.H.; Zhao, Q.L.; Wang, Z.H.; Yi, J.G.; Wang, J. Parameter optimization experiment of adjustable five rollers shrimp peeling machine. Trans. Chin. Soc. Agric. Eng. 2016, 32, 247–254. [Google Scholar]
- Hosseinpour, S.; Rafiee, S.; Mohtasebi, S.S.; Aghbashlo, M. Application of computer vision technique for on-line monitoring of shrimp color changes during drying. J. Food Eng. 2013, 115, 99–114. [Google Scholar] [CrossRef]
- Hong, H.M.; Yang, X.L.; You, Z.H.; Cheng, F. Visual quality detection of aquatic products using machine vision. Aquac. Eng. 2014, 63, 62–71. [Google Scholar] [CrossRef]
- Hong, C.; Liu, Z.H.; Wang, X.Q.; Gao, L.; Zheng, Z.Y.; Xu, Z.L.; Jun, Z. Construction of completeness recognition method for shrimp (Litopenaeus vannamei) based on morphological characteristics. J. Food Saf. Qual. 2021, 2, 8666–8673. [Google Scholar]
- Hu, W.C.; Yang, C.Y.; Huang, D.Y. Robust real-time ship detection and tracking for visual surveillance of cage aquaculture. J. Vis. Commun. Image Represent. 2011, 22, 543–556. [Google Scholar] [CrossRef]
- Lee, D.J.; Xiong, G.M.; Lane, R.M.; Zhang, D. An Efficient Shape Analysis Method for Shrimp Quality Evaluation, 2012 12th International Conference on Control, Automation. In Proceedings of the 2012 12th International Conference on Control Automation Robotics & Vision (ICARCV), Guangzhou, China, 5–7 December 2012; pp. 865–870. [Google Scholar]
- Zhang, D.; Lillywhite, K.D.; Lee, D.J.; Tippetts, B.J. Automatic shrimp shape grading using evolution constructed features. Comput. Electron. Agric. 2014, 100, 116–122. [Google Scholar] [CrossRef]
- Liu, Z.H.; Jia, X.J.; Xu, X.S. Study of shrimp recognition methods using smart networks. Comput. Electron. Agric. 2019, 169, 104926. [Google Scholar] [CrossRef]
- Liu, Z.H. Soft-shell Shrimp Recognition Based on an Improved AlexNet for Quality Evaluations. J. Food Eng. 2020, 266, 109698. [Google Scholar] [CrossRef]
- Zhang, L.; Huang, L.; Li, B.B.; Chen, X.; Duan, Q.L. Fish School Counting Method Based on Multi-scale Fusion and No Anchor YOLO v3. Trans. Chin. Soc. Agric. Mach. 2021, 52, 237–244. [Google Scholar]
- Conrady, C.R.; Er, S.; Attwood, C.G.; Roberson, L.A.; Vos, L. Automated detection and classification of southern African Roman seabream using mask R-CNN. Ecol. Inform. 2022, 69, 101593. [Google Scholar] [CrossRef]
- Ramik, D.M.; Sabourin, C.; Moreno, R.; Madani, K. A machine learning based intelligent vision system for autonomous object detection and recognition. Appl. Intell. 2014, 40, 358–375. [Google Scholar] [CrossRef]
- Kiyokawa, T.; Tomochika, K.; Takamatsu, J.; Ogasawara, T. Fully Automated Annotation With Noise-Masked Visual Markers for Deep-Learning-Based Object Detection. IEEE Robot. Autom. Lett. 2019, 4, 1972–1977. [Google Scholar] [CrossRef]
- Chen, X.S.; Mao, Y.Y.; Ma, X.; Qi, L. A Tactile Method for Rice Plant Recognition Based on Machine Learning. Sensors 2020, 20, 5135. [Google Scholar] [CrossRef]
- Chen, X.S.; Mao, Y.Y.; Xiong, Y.S.; Qi, L.; Jiang, Y.; Ma, X. Intra-row weed density evaluation in rice field using tactile method. Comput. Electron. Agric. 2022, 193, 106699. [Google Scholar] [CrossRef]
- Iskarous, M.M.; Thakor, N.V. E-Skins: Biomimetic Sensing and Encoding for Upper Limb Prostheses. Proc. IEEE 2019, 107, 2052–2064. [Google Scholar] [CrossRef]
- Luo, S.; Mou, W.X.; Althoefer, K.; Liu, H.B. iCLAP: Shape recognition by combining proprioception and touch sensing. Auton. Robot. 2019, 43, 993–1004. [Google Scholar] [CrossRef]
- Niu, H.S.; Li, H.; Gao, S.; Li, Y.; Wei, X.; Chen, Y.K.; Yue, W.J.; Zhou, W.J.; Shen, G.Z. Perception-to-Cognition Tactile Sensing Based on Artificial-Intelligence-Motivated Human Full-Skin Bionic Electronic Skin. Adv. Mater. 2022, 34, 2202622. [Google Scholar] [CrossRef] [PubMed]
- Wang, S.A.; Alessandro, A.; Perla, M.; Fulvio, M.; Giorgio, C. Fabric Classification Using a Finger-Shaped Tactile Sensor via Robotic Sliding. Front. Neurorobotics 2022, 16, 808222. [Google Scholar] [CrossRef] [PubMed]
- Zhang, Z.; Zhou, J.; Yan, Z.; Wang, K.; Mao, J.; Jiang, Z. Hardness recognition of fruits and vegetables based on tactile array information of manipulator. Comput. Electron. Agric. 2021, 181, 105959. [Google Scholar] [CrossRef]
- Keser, S.; Hayber, S.E. Fiber optic tactile sensor for surface roughness recognition by machine learning algorithms. Sens. Actuators A-Phys. 2021, 332, 113071. [Google Scholar] [CrossRef]
- Qin, L.H.; Yi, Z.K.; Zhang, Y.L. Enhanced surface roughness discrimination with optimized features from bio-inspired tactile sensor. Sens. Actuators A-Phys. 2017, 264, 133–140. [Google Scholar] [CrossRef]
- Kawazoe, M.; Kosemura, Y.; Miki, N. Encoding and presentation of surface textures using a mechanotactile display. Sens. Actuators A-Phys. 2017, 261, 30–39. [Google Scholar] [CrossRef]
- Soualhi, M.; Nguyen, K.; Medjaher, K. Pattern recognition method of fault diagnostics based on a new health indicator for smart manufacturing. Mech. Syst. Signal Process. 2020, 142, 106680. [Google Scholar] [CrossRef]
- Bakker, T.; Wouters, H.; Asselt, K.; Bontsema, J.; Tang, L.; Müller, J.; Straten, G. A vision based row detection system for sugar beet. Comput. Electron. Agric. 2008, 60, 87–95. [Google Scholar] [CrossRef]
- Ruan, X.; Zhu, Y.; Li, J.; Cheng, Y. Predicting the citation counts of individual papers via a BP neural network. J. Informetr. 2020, 14, 101039. [Google Scholar] [CrossRef]


Disclaimer/Publisher’s Note: The statements, opinions and data contained in all publications are solely those of the individual author(s) and contributor(s) and not of MDPI and/or the editor(s). MDPI and/or the editor(s) disclaim responsibility for any injury to people or property resulting from any ideas, methods, instructions or products referred to in the content. |
© 2023 by the authors. Licensee MDPI, Basel, Switzerland. This article is an open access article distributed under the terms and conditions of the Creative Commons Attribution (CC BY) license (https://creativecommons.org/licenses/by/4.0/).