Abstract
Background: Since the confirmation of the first patient infected with SARS-CoV-2 in Spain in January 2020, the epidemic has grown rapidly, with the greatest impact on the region of Madrid. This article describes the first 2226 adult patients with COVID-19, consecutively admitted to La Paz University Hospital in Madrid. Methods: Our cohort included all patients consecutively hospitalized who had a final outcome (death or discharge) in a 1286-bed hospital of Madrid (Spain) from 25 February (first case admitted) to 19 April 2020. The data were manually entered into an electronic case report form, which was monitored prior to the analysis. Results: We consecutively included 2226 adult patients admitted to the hospital who either died (460) or were discharged (1766). The patients’ median age was 61 years, and 51.8% were women. The most common comorbidity was arterial hypertension (41.3%), and the most common symptom on admission was fever (71.2%). The median time from disease onset to hospital admission was 6 days. The overall mortality was 20.7% and was higher in men (26.6% vs. 15.1%). Seventy-five patients with a final outcome were transferred to the intensive care unit (ICU) (3.4%). Most patients admitted to the ICU were men, and the median age was 64 years. Baseline laboratory values on admission were consistent with an impaired immune-inflammatory profile. Conclusions: We provide a description of the first large cohort of hospitalized patients with COVID-19 in Europe. Advanced age, male sex, the presence of comorbidities and abnormal laboratory values were more common among the patients with fatal outcomes.
1. Introduction
As of this writing, Spain has the second highest number of confirmed severe acute respiratory coronavirus 2 (SARS-CoV-2) infections worldwide after the United States. The first infection in Spain was confirmed on 31 January 2020, in La Gomera in the Canary Islands [1]. In the Madrid region, the first infection was registered on 25 February 2020. Madrid is a densely populated area with 6.7 million inhabitants [2] and has felt the greatest impact from the pandemic in Spain. The number of confirmed cases in Madrid was 58,819 as of 25 April (26.3% of cases in Spain) [3], reaching a peak of 3419 new cases on 30 March.
The progression of the outbreak in Madrid is similar to that observed in the most affected areas in Western countries, such as the Lombardy region in Italy and New York City in the US. The healthcare systems of these regions are under massive stress, and the cumulative COVID-19 mortality per 100,000 inhabitants since the start of the pandemic has been high: 132 deaths in Lombardy, 140 in New York City and 190 in Madrid (as of 25 April) [4,5,6].
The La Paz University Hospital is a large teaching hospital with a catchment area of 527,366 inhabitants in the north of Madrid. Shortly after the outbreak, the hospital’s procedures were adapted to cope with the rise in COVID-19 cases. By 25 April, the hospital had admitted over 2500 patients with COVID-19, one of the largest single-site cohorts in Europe. These patients’ clinical information was collected using a standardized protocol.
In this article, we describe the first 2226 adult patients consecutively admitted with a confirmed diagnosis of SARS-CoV-2 infection to La Paz University Hospital and who had died or been discharged by 19 April.
2. Methods
2.1. Study Population
Our study included all individuals, 18 years or older, who were hospitalized in the wards (or emergency department, due to the lack of available beds in the wards) of La Paz University Hospital with a diagnosis of COVID-19 and who either died or were discharged by 19 April. Patients discharged from the emergency department after a stay of less than 24 h were not considered hospitalized and were not included in this analysis.
2.2. Data Collection
We employed a modified version of the electronic case record form (eCRF) for severe acute respiratory infections, developed by the World Health Organization/International Severe Acute Respiratory and Emerging Infection Consortium [7]. Our eCRF includes 372 variables, grouped into demographics, medical history, infection-exposure history, symptoms, complications, treatments (excluding clinical trials) and disease progression during hospitalization (see Supplementary Material).
We collected the clinical data directly extracting the information from the hospital’s database, when possible, or by a manual and individual review of the patients’ electronic clinical records, including the clinical notes (DXC-HCIS- Healthcare Information System). The clinical data collected at hospital admission included age, sex, smoking status, transmission, comorbidities, symptoms on admission, respiratory status and time from disease onset. Complications during hospitalization and intensive care unit (ICU) admission were also recorded. The data collection effort was conducted by a volunteer team of resident doctors and senior medical students. Data monitoring was conducted by our hospital’s Central Clinical Research Unit.
Laboratory results (hematology, biochemistry, microbiology) were extracted from various hospital data management systems, and information regarding the drugs used during hospitalization was extracted from the electronic prescription system.
2.3. Statistical Analysis
Continuous variables are presented as means and standard deviations (SD) or medians and interquartile ranges (IQR), and categorical variables are listed as numbers and percentages (%). To analyze predictors of in-hospital death, we employed a multivariate logistic regression model. We selected the variables for inclusion in the model on the basis of previous findings and considering the total number of deaths in our study to avoid overfitting the model. In a sensitivity analysis to explore potential collider bias, we restricted the fit of the model to patients admitted before 20 March(results did not materially change). We performed the statistical calculations using R (version 3.4.0) [8].
The study was approved by the Research Ethics Committee of La Paz University Hospital (PI-4072) and by the Spanish Agency of Medicines and Medical Devices (HUL-AIN-2020-01) and was registered in the European Union Electronic Register of Post-Authorization Studies (EUPAS34331).
3. Results
A total of 3127 patients were consecutively treated in the emergency department of La Paz University Hospital between 25 February and 19 April 2020. Of these, 2226 adult patients were hospitalized and either died (460, 20.7%) or were discharged (1766, 79.3%) and were therefore included in our analysis. Figure 1 shows the bed occupancy by patients with COVID-19 over time, with a peak of 1033 beds, 106 of which were in the ICU (compared with 30 ICU beds before the COVID-19 pandemic).
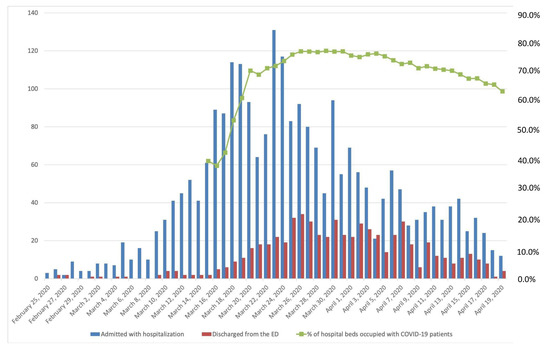
Figure 1.
Patients treated by the emergency department per day between 25 February 2020, and 19 April 2020. The blue lines indicate patients admitted and hospitalized, and the red lines indicate patients discharged from the emergency department. The green line represents the percentage of hospital beds (including ICU) occupied by patients with COVID-19.
The median time from clinical onset to hospital admission was 6 days (IQR, 3–9). At admission, the patients had a median age of 61 (IQR, 46–78) years, 52% were women, 41% had arterial hypertension, 19% had chronic heart disease, and 17% had diabetes mellitus. The most common symptoms at admission were fever, cough and dyspnea, and the median oxygen saturation at admission was 95% (IQR, 92–97). The most common complications during hospitalization were acute confusional syndrome, acute kidney failure and acute respiratory distress syndrome (Table 1).

Table 1.
Characteristics at admission and complications during hospitalization.
Most of the patients were treated with drugs presumed to have antiviral activity against SARS-CoV-2. The most frequent combination was hydroxychloroquine plus azithromycin followed by hydroxychloroquine in isolation.
At the time of the analysis, 237 patients had been admitted to the ICU, 116 remained in the ICU, 55 had died, 20 were discharged from the hospital, and 46 remained confined to a standard hospital bed. Table 2 shows the demographic characteristics, comorbidities and respiratory status on the day of emergency department admission of the 75 patients (3.4%) transferred to the ICU who had died or been discharged by 19 April. Compared with the entire cohort, the patients admitted to the ICU were older (median age, 64 vs. 61 years), had a higher male/female ratio (3.2 vs. 0.93) and had a higher prevalence of arterial hypertension (52 vs. 41.3%), obesity (30.7% vs. 10.9%), diabetes mellitus (28.0% vs. 17.1%) and chronic obstructive pulmonary disease (17.3% vs. 6.9%).
Table 2.
Demographics, Comorbidities and Respiratory Status on Admission of the Intensive Care Patients.
Table 3 shows the mortality by age group and sex for the 2226 patients. The overall mortality was 26.6% for the men and 15.1% for the women. Mortality increased with age, reaching over 60% for patients over 80 years of age.
Table 3.
Mortality distribution by age group and sex.
Table 4 shows the laboratory findings at admission for the entire cohort and for the ICU subgroup. In the cohort, the baseline creatine kinase, creatinine, D-dimer, ferritin, lactate dehydrogenase, procalcitonin, C-reactive protein and high-sensitivity cardiac troponin I levels and prothrombin times were higher among the non-survivors than the survivors. In the cohort admitted to the ICU, the most notable differences with the whole cohort were higher levels of D-dimer, ferritin, C reactive protein and troponin. Within the ICU cohort, the lymphocyte counts and procalcitonin and C-reactive protein levels at hospital admission were also clearly higher in the patients who died compared with those who survived.
Table 4.
Laboratory findings on admission.
In the multivariable logistic regression model, we found that male sex, older age, an oxygen saturation <90% on admission, lower lymphocyte count and high C-reactive protein levels were associated with a high probability of death (Table 5).
Table 5.
Risk factors associated with in-hospital death.
4. Discussion
To the best of our knowledge, this is the first report of a large cohort of patients hospitalized with COVID-19 in Europe. Our cohort includes all patients with a final outcome (discharge or death) consecutively admitted to our hospital during the worst phase of COVID-19 in Madrid’s hospital system.
Similar to other cohorts [9,10,11,12,13,14,15], the hospitalized patients in Madrid were elderly and had numerous comorbidities, the most common of which were arterial hypertension and diabetes. Our male/female ratio was 0.9, which is lower than the 1.5 reported in the series from Wuhan (China) [12] and New York City [10]. In Madrid, the male/female ratio for individuals older than 60 and 75 years was 0.74 and 0.61, respectively [16]. Differences compared with other cohorts could be partially explained by the different male/female ratio in the Madrid population pyramid. Despite our lower male/female ratio compared with other reports, the mortality for each age group was notably higher for the male patients than for the female patients, as reported in other cohorts. It is relevant that one third of the patients included in our cohort were nursing homes residents.
The overall mortality (20.7%) in our series by age group was similar to that of the New York cohort (21%) [10] and lower than that of a Wuhan cohort (28.3%) [12]. In our cohort, older age and the presence of comorbidities were more common among the patients with fatal outcomes, both for the entire cohort and for those admitted to the ICU.
The most frequent symptoms at admission were fever, cough and dyspnea; myalgia and diarrhea were also common. Notably, 12.8% of the patients had anosmia as a presenting symptom, as described in other cohorts [17]. The time from disease onset was short (6 days), and the patients’ respiratory status on admission (as reflected by oxygen saturation) was generally poor, with half of the patients presenting an oxygen saturation of < 95%. General symptoms, such as diarrhea, myalgia, headache and anosmia, were more common among survivors, while respiratory symptoms such as dyspnea and sputum production were more prevalent among the non-survivors, who also had a lower median oxygen saturation on admission (90% vs. 96%). In any case, these findings need to be confirmed in other large cohorts and meta-analyses.
The laboratory values on admission were consistent with an impaired immune-inflammatory profile, characterized by lymphopenia and elevated D-dimer, procalcitonin, ferritin and C-reactive protein levels. Most of these abnormal laboratory readings were more common in the patients with fatal outcomes. Creatine kinase and troponin levels on admission were also higher in the patients with fatal outcomes, a finding also reported in other series [18].
Most of our patients underwent treatments presumed to have activity against SARS-CoV-2. The indication for treatment in Spain has changed during the course of the pandemic but has always been based on the indications by the Spanish Ministry of Health and the availability of treatments. Our hospital has also participated in several clinical trials, the results of which we cannot provide in this manuscript (remdesivir, tocilizumab, sarilumab). We have included in this article the use of treatments with potentially antiviral effects available in our hospital but that have not been included in a clinical trial (hydroxychloroquine, azithromycin and lopinavir/ritonavir). It is also noteworthy that, at the start of the pandemic in Spain, only symptomatic treatment was indicated. At present, there are no clinical trial data that support the use of any of these treatments for improving the outcomes of patients with COVID-19.
This study has a number of limitations. First, the data were collected from various databases, both manually and automatically. The data manually entered into the eCRF were monitored and curated. Second, we did not conduct a follow-up of the patients after discharge. Third, our reported mortality rates might change once the entire cohort of hospitalized patients has been analyzed.
In summary, this study provides initial data on the clinical and laboratory features and outcomes of patients hospitalized with COVID-19 infection in a large teaching hospital in Madrid during the peak of the pandemic in Spain.
Supplementary Materials
The following are available online at https://www.mdpi.com/2077-0383/9/6/1733/s1, 1. COVID@HULP Working Group list of members and Acknowledgments, 2. Electronic case record form (eCRF).
Author Contributions
Conceptualization, A.M.B., A.J.C., E.R. and J.R.A.; Data curation, J.M.-V., M.Q., A.M.-V., G.M.-A. and D.P.A.; Formal analysis, A.M.B., A.J.C., J.M.-V., E.R. and J.F.; Investigation, A.M.B., F.A., R.Á.-S., J.M.-V., M.Q., J.C.F., R.M.T.S.-O., J.G.-R., A.M.-V., A.B., E.R., G.M.-A., N.G.-A., M.C.N., M.M.-d.-G., F.M.R., F.R.-B., A.M.-Q., A.R.N., J.M., C.J.C.S. and J.F.; Methodology, A.M.B., A.J.C., E.R., G.M.-A., J.F. and J.R.A.; Supervision, A.M.B., M.Q., E.R.C., C.P.S., J.J.R. and J.R.A.; Validation, J.F.; Visualization, J.R.A.; Writing – original draft, A.M.B., A.J.C., E.R. and J.F.; Writing – review & editing, A.M.B., A.J.C., E.R., M.A.H., J.F. and J.R.A. All authors have read and agreed to the published version of the manuscript.
Funding
This research received no external funding.
Acknowledgments
We thank all La Paz Hospital staff, whose selfless dedication is allowing us to face the worst healthcare challenge of our history. We also want to acknowledge Hospital Management for its support to the Covid@HULP project.
Conflicts of Interest
The authors declare no conflict of interest.
References
- Spiteri, G.; Fielding, J.; Diercke, M.; Campese, C.; Enouf, V.; Gaymard, A.; Bella, A.; Sognamiglio, P.; Moros, M.J.S.; Riutort, A.N.; et al. First cases of coronavirus disease 2019 (COVID-19) in the WHO European Region, 24 January to 21 February 2020. Eurosurveillance 2020, 25. [Google Scholar] [CrossRef] [PubMed]
- Instituto Nacional de Estadística. Población Residente por Fecha, Sexo y Edad. Madrid, España. Available online: https://www.ine.es/jaxiT3/Tabla.htm?t=9663&L=0 (accessed on 26 April 2020).
- Centro de Coordinación de Alertas y Emergencias Sanitarias. Enfermedad por el Coronavirus (COVID-19). España: Ministerio de Sanidad. Available online: https://www.mscbs.gob.es/profesionales/saludPublica/ccayes/alertasActual/nCov-China/situacionActual.htm (accessed on 26 April 2020).
- COVID-19. Situación Actual en la Comunidad de Madrid. Informe de Situación del 27 de Abril. Available online: https://www.comunidad.madrid/sites/default/files/doc/sanidad/200425_cam_covid19.pdf (accessed on 26 April 2020).
- Ministero della Salute. Covid-19, i casi in Italia il 25 Aprile ore 18. Available online: http://www.salute.gov.it/imgs/C_17_notizie_4605_0_file.pdf (accessed on 26 April 2020).
- New York City Health. COVID-19: Data. Available online: https://www1.nyc.gov/site/doh/covid/covid-19-data.page (accessed on 26 April 2020).
- Novel Coronaviris (nCoV) Acute Respiratory Infection Clinical Characterisation Data Tools. nCoV Case Records Form Version 1.3. 24 Feb 2020. Adapted from Sprint Sari Case Report form by ISARIC. Available online: https://media.tghn.org/medialibrary/2020/03/ISARIC_COVID-19_CRF_V1.3_24Feb2020.pdf (accessed on 16 February 2020).
- R Core Team. R: A Language and Environment for Statistical Computing; R Foundation for Statistical Computing: Vienna, Austria. Available online: https://www.R-project.org. (accessed on 10 April 2020).
- Goyal, P.; Choi, J.J.; Pinheiro, L.C.; Schenck, E.J.; Chen, R.; Jabri, A.; Satlin, M.J.; Campion, T.R., Jr.; Nahid, M.; Ringel, J.B.; et al. Clinical Characteristics of Covid-19 in New York City. New Engl. J. Med. 2020. [Google Scholar] [CrossRef] [PubMed]
- Richardson, S.; Hirsch, J.S.; Narasimhan, M.; Crawford, J.M.; McGinn, T.; Davidson, K.W.; Barnaby, D.P.; Becker, L.B.; Chelico, J.D.; Cohen, S.L.; et al. Presenting Characteristics, Comorbidities, and Outcomes Among 5700 Patients Hospitalized With COVID-19 in the New York City Area. JAMA 2020. [Google Scholar] [CrossRef] [PubMed]
- Garg, S.; Kim, L.; Whitaker, M.; O’Halloran, A.; Cummings, C.; Holstein, R.L.; Prill, M.; Chai, S.J.; Kirley, P.D.; Alden, N.B.; et al. Hospitalization rates and characteristics of patients hospitalized with laboratory-confirmed coronavirus disease 2019—COVID-NET, 14 States, 1–30 March 2020. MMWR Morb. Mortal. Wkly. Rep. 2020, 69, 458–464. [Google Scholar] [CrossRef] [PubMed]
- Zhou, F.; Yu, T.; Du, R.; Fan, G.; Liu, Y.; Liu, Z.; Xiang, J.; Wang, Y.; Song, B.; Gu, X.; et al. Clinical course and risk factors for mortality of adult inpatients with COVID-19 in Wuhan, China: A retrospective cohort study. Lancet 2020, 395, 1054–1062. [Google Scholar] [CrossRef]
- Wang, D.; Hu, B.; Hu, C.; Zhu, F.; Liu, X.; Zhang, J.; Wang, B.; Xiang, H.; Cheng, Z.; Xiong, Y.; et al. Clinical Characteristics of 138 Hospitalized Patients With 2019 Novel Coronavirus-Infected Pneumonia in Wuhan, China. JAMA 2020. [Google Scholar] [CrossRef] [PubMed]
- Huang, C.; Wang, Y.; Li, X.; Ren, L.; Zhao, J.; Hu, Y.; Zhang, L.; Fan, G.; Xu, J.; Gu, X.; et al. Clinical features of patients infected with 2019 novel coronavirus in Wuhan, China. Lancet 2020, 395, 497–506. [Google Scholar] [CrossRef]
- Guan, W.J.; Ni, Z.Y.; Hu, Y.; Liang, W.H.; Ou, C.Q.; He, J.X.; Liu, L.; Shan, H.; Lei, C.L.; Hui, D.S.; et al. Clinical Characteristics of Coronavirus Disease 2019 in China. N. Engl. J. Med. 2020. [Google Scholar] [CrossRef] [PubMed]
- Centro Internacional sobre el Envejecimiento. Estimaciones de la Población de la Provincia de Madrid. España. Available online: https://cenie.eu/es/observatorio/demografia/madrid (accessed on 26 April 2020).
- Spinato, G.; Fabbris, C.; Polesel, J.; Cazzador, D.; Borsetto, D.; Hopkins, C.; Boscolo-Rizzo, P. Alterations in smell or taste in mildly symptomatic outpatients with SARS-CoV-2 infection. JAMA 2020. [Google Scholar] [CrossRef] [PubMed]
- Shi, S.; Qin, M.; Shen, B.; Cai, Y.; Liu, T.; Yang, F.; Gong, W.; Liu, X.; Liang, J.; Zhao, Q.; et al. Association of cardiac injury with mortality in hospitalized patients with COVID-19 in Wuhan, China. JAMA Cardiol. 2020. [Google Scholar] [CrossRef] [PubMed]

© 2020 by the authors. Licensee MDPI, Basel, Switzerland. This article is an open access article distributed under the terms and conditions of the Creative Commons Attribution (CC BY) license (http://creativecommons.org/licenses/by/4.0/).