Benefits of Resistance Training in Early and Late Stages of Frailty and Sarcopenia: A Systematic Review and Meta-Analysis of Randomized Controlled Studies
Abstract
1. Introduction
2. Materials and Methods
2.1. Registration of Systematic Review Protocol
2.2. Identification and Selection of Studies
2.3. Eligibility Criteria
2.4. Data Extraction
2.5. Methodological Quality
2.6. Statistical Analysis
3. Results
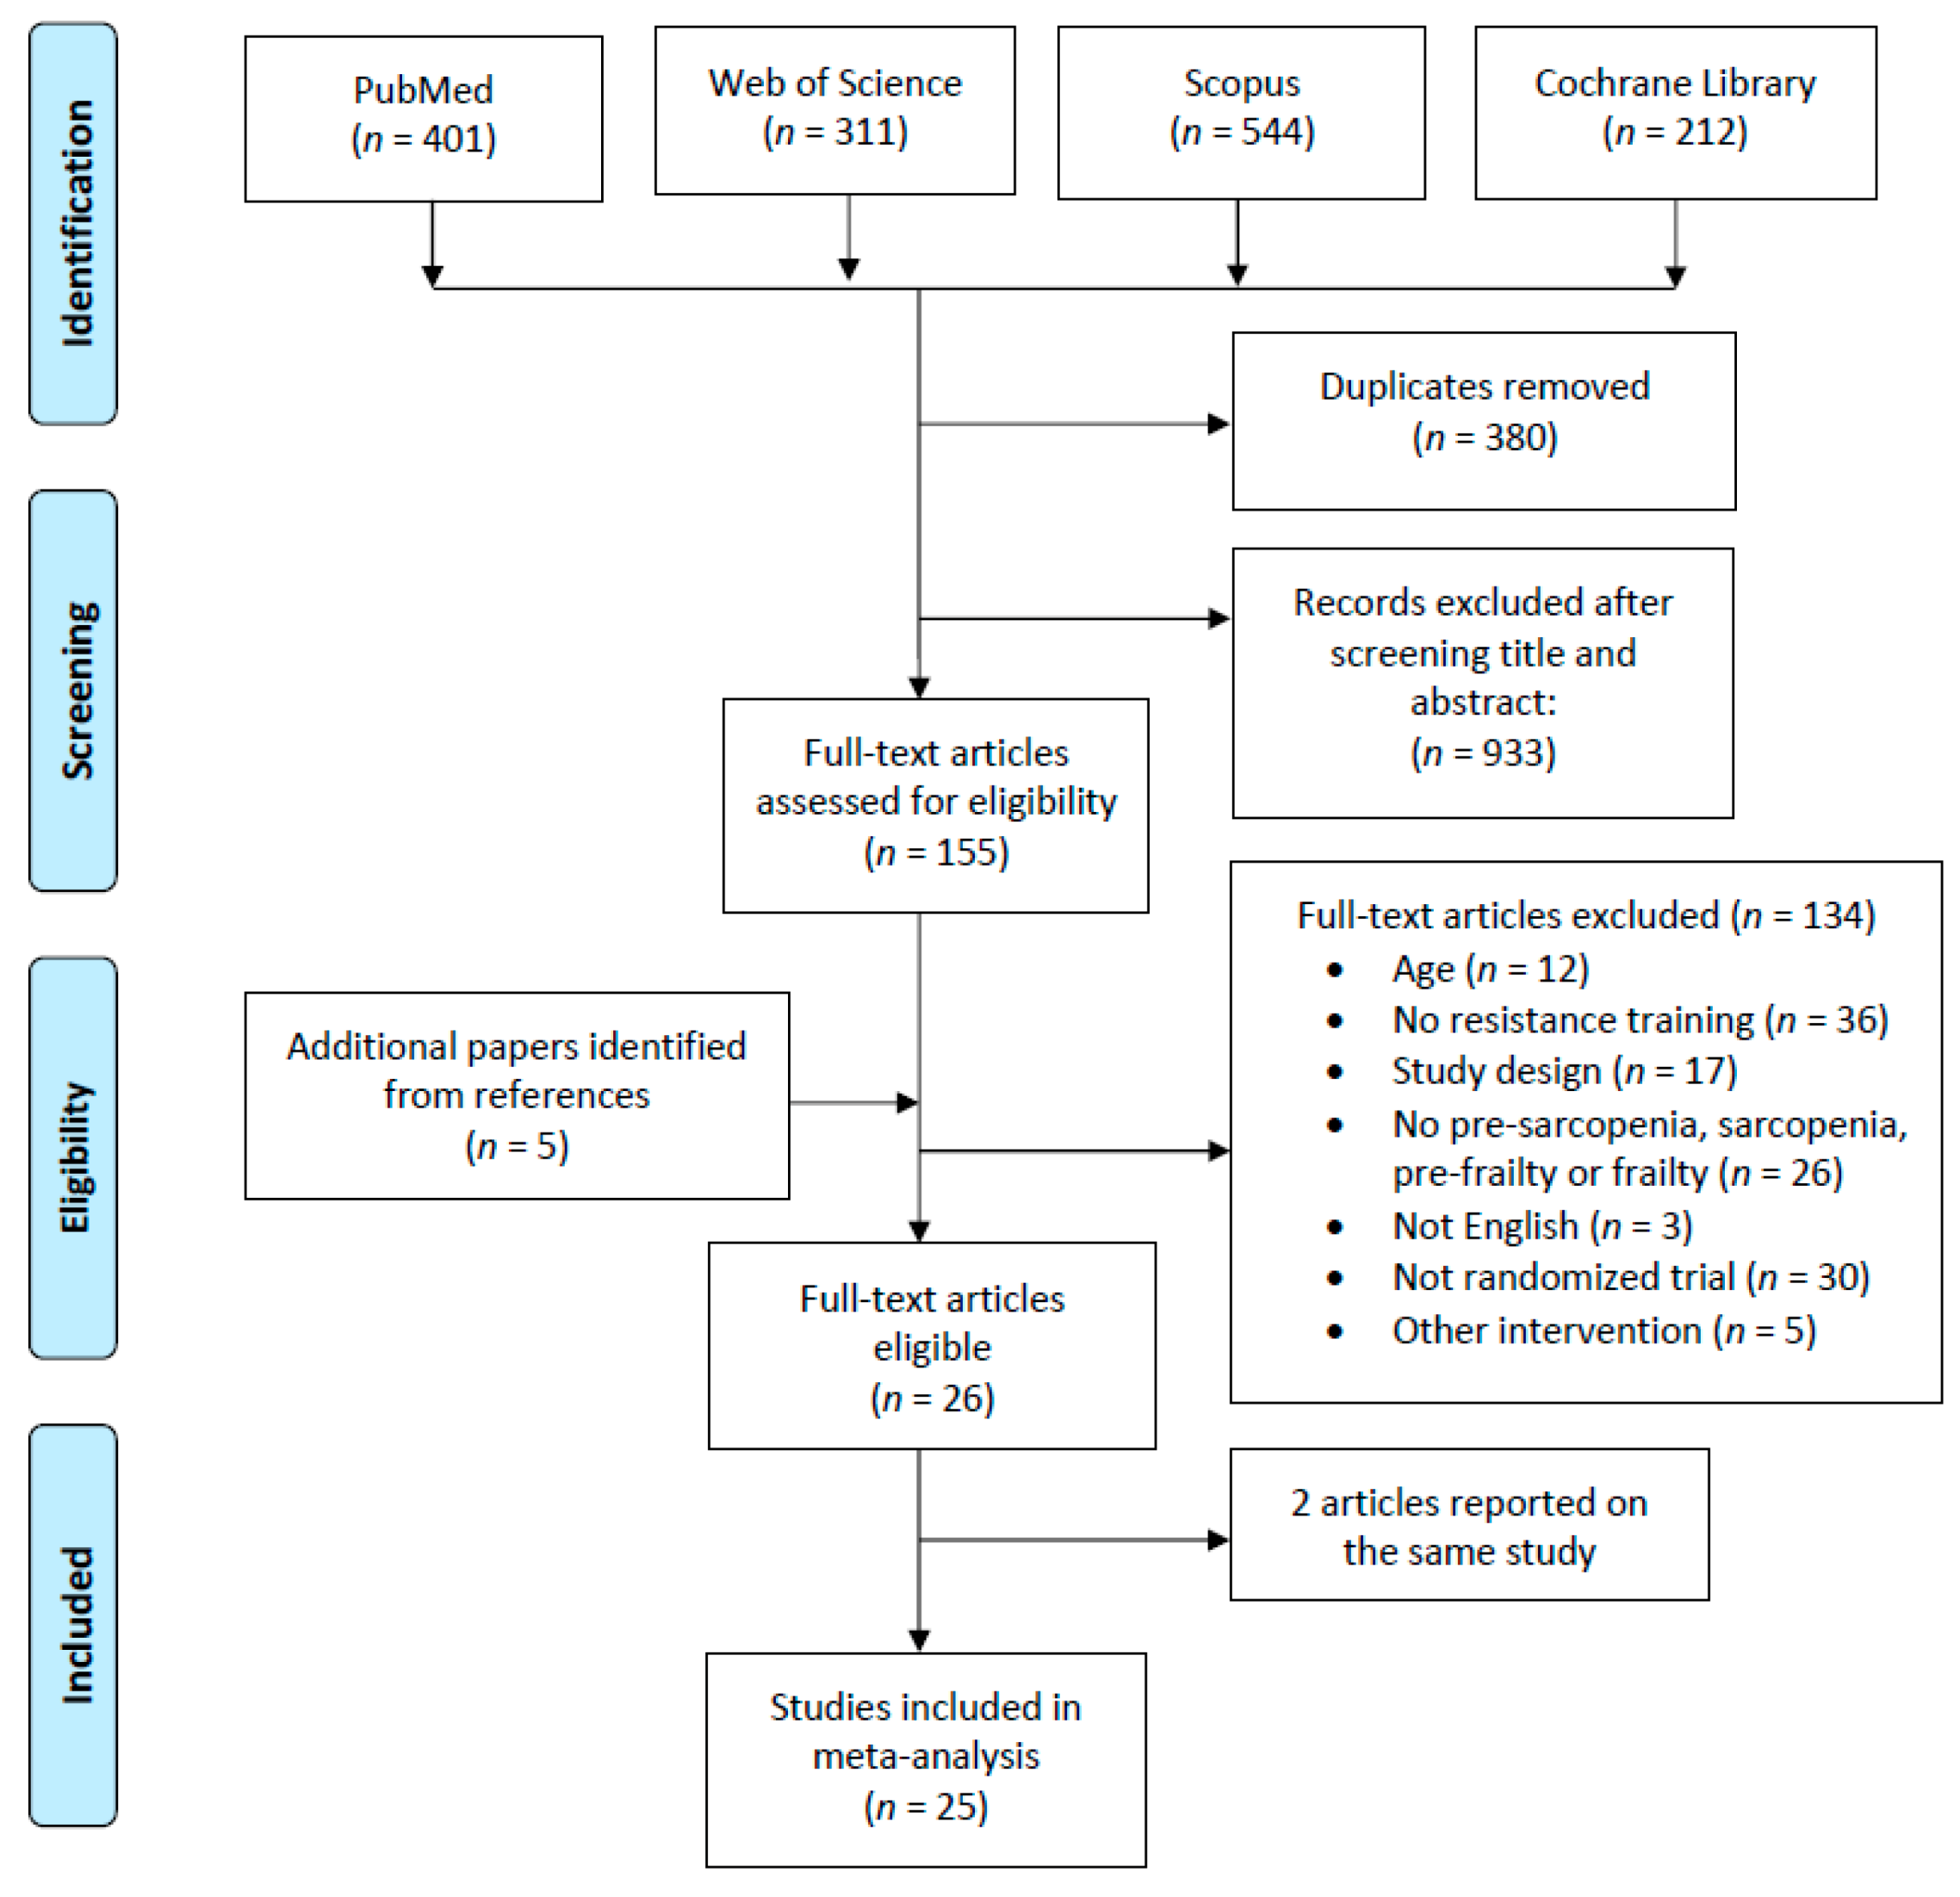
3.1. Study Selection
3.2. Methodological Quality
3.3. Study Characteristics
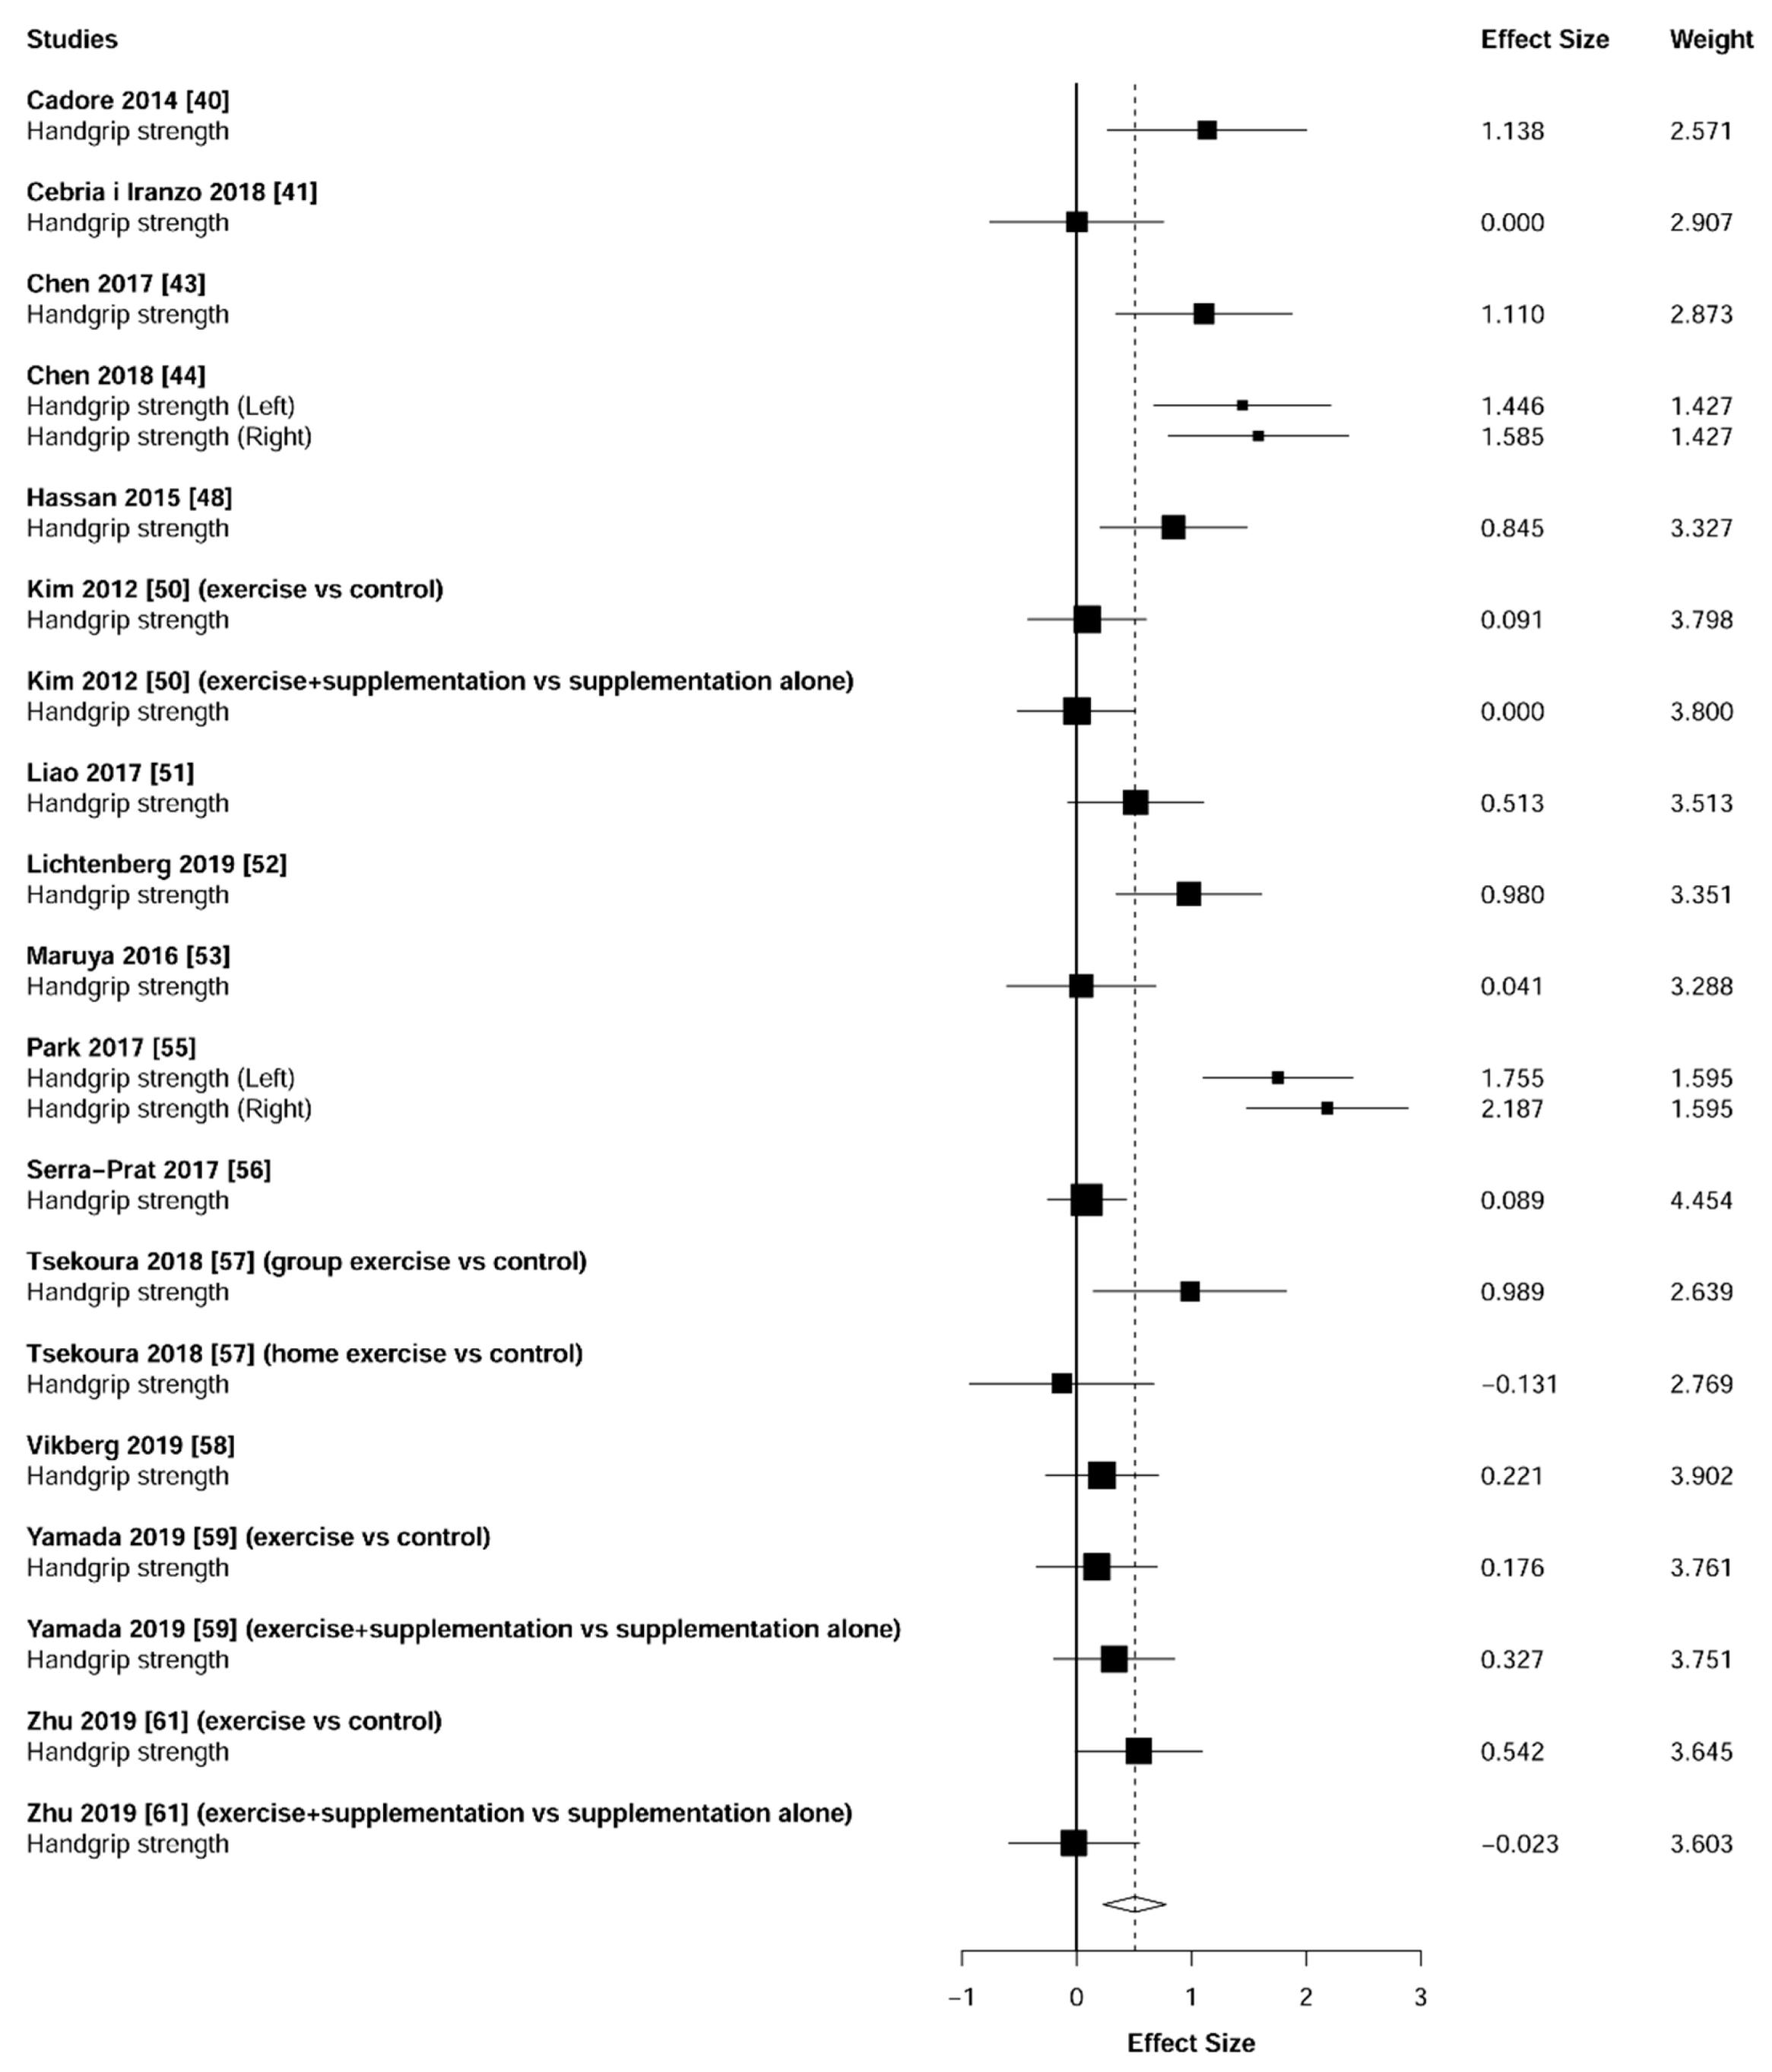
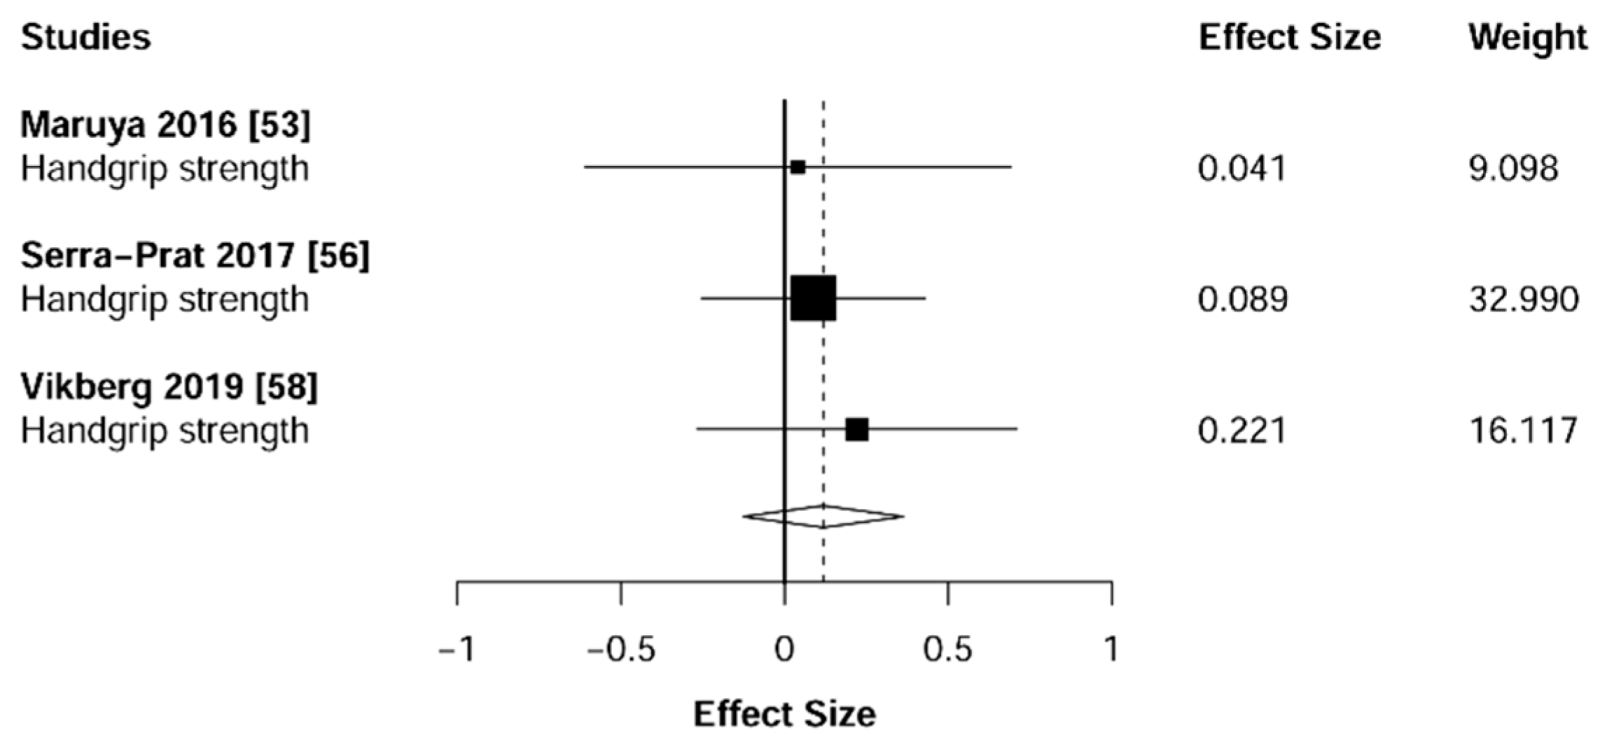
3.4. Muscular Strength
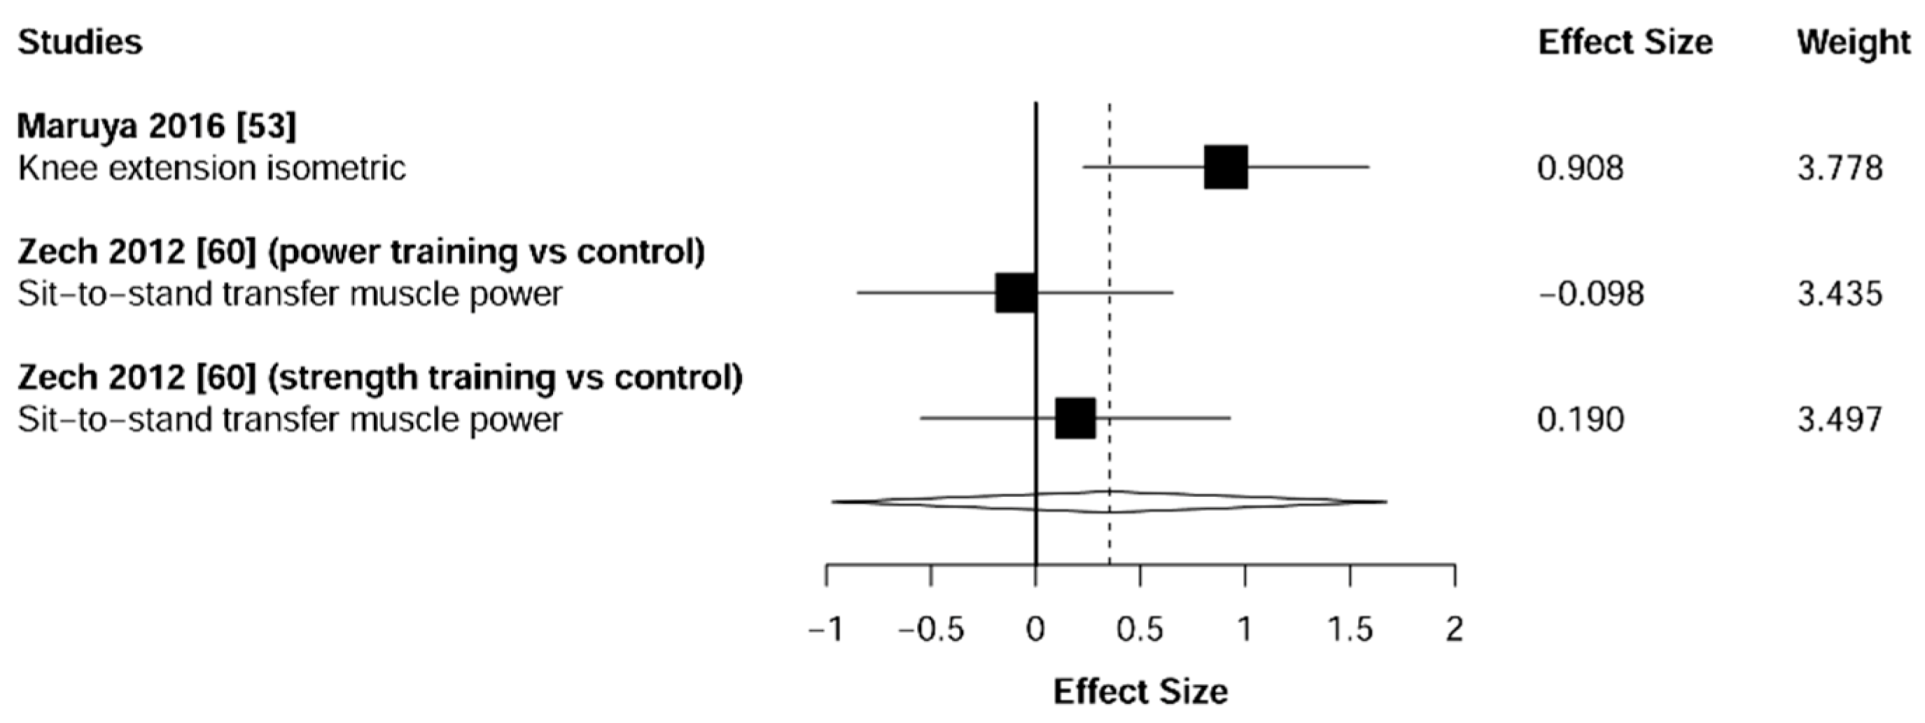
3.5. Physical Function
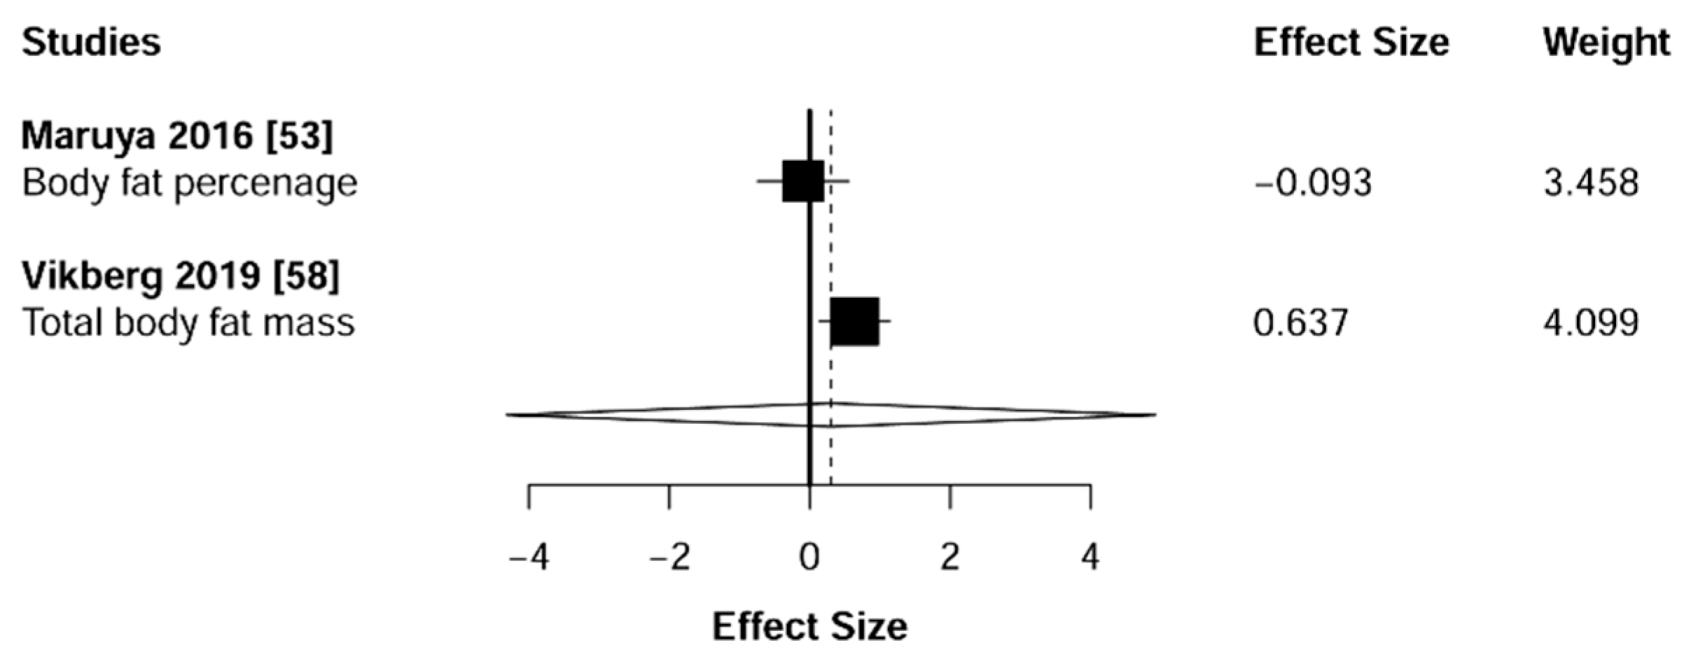
3.6. Body Composition
4. Discussion
4.1. Muscular Strength
4.2. Physical Function
4.3. Body Composition
5. Limitations
6. Conclusions
Author Contributions
Funding
Institutional Review Board Statement
Informed Consent Statement
Data Availability Statement
Conflicts of Interest
Appendix A
| Variable | Terms |
|---|---|
| Outcome term | (“sarcopenia” OR “presarcopenia” OR “*sarcopenia” OR “pre-sarcopenia” OR “presarcopenic” OR “pre-sarcopenic” OR “sarcopenic” AND “frailty” OR “*frailty” OR “prefrailty” OR “pre-frailty” OR “frail” OR “frail*” OR “prefrail” OR “pre-frail”) |
| Measurement parameters | (“muscle strength” OR “muscular strength” OR “muscle mass” OR “fat mass” OR “FFM” OR “body composition” OR “gait speed” OR “gait” OR “walking speed” OR “balance” OR “appendicular skeletal muscle mass” OR “body fat mass” OR “balance test” OR “HGS” OR “hand strength” OR “grip strength” OR “lower limb strength” OR “chair stand time” OR “knee extension 1-RM” OR “TUG” OR “agility” OR “SPPB” OR “physical function” OR “one leg stand time” OR “body fat percentage” OR “total body fat mass” OR “upper limb fat mass” OR “lower limb fat mass” OR “walking speed” OR “knee flexion” OR “knee extension isokinetic” OR “knee extension isometric” OR “leg lean mass” OR “thigh muscle area” OR “muscle mass” OR “fat mass” OR “fat-free mass” OR “calf circumference” OR “arm lean mass” OR “total lean mass” OR “appendicular lean mass” OR “upper limb muscle mass” OR “lower limb muscle mass”) |
| Exercise intervention | (“resistance training” OR “resistance exercise” OR “resistance exercises” OR “resistance” OR “strength training” OR “strength exercise” OR “strength exercises” OR “physical strength” OR “physical activity” OR “strength” OR “physical strength” OR “weight training” OR “weight” OR “exercises” OR “exercise” OR “training” OR “physical activity” OR “physical activities” OR “physical training” OR “physical fitness” OR “weight exercises” OR “weight exercise” OR “weight-bearing training” OR “weight-bearing exercises” OR “weight bearing exercise” OR “weight bearing training”) |
| Study design | (“randomized controlled trial*” OR “controlled” OR “RCT” OR “clinical trial” OR “controlled clinical trial” OR “randomized controlled trials” OR “random allocation” OR “double blind method” OR “single blind method” OR “clinical trials” OR “single” OR “double” OR “triple” OR “placebos” OR “research design” OR “follow-up stud*” OR “placebo” OR “random” OR “comparative study” OR “evaluation studies” OR “prospective stud*” OR “control” OR “prospective*” OR “volunteer” OR “research design” OR “control”) |
| Population | (“old” OR “age” OR “old age” OR “older adult*” OR “older people” OR “elderly” OR “elder*” OR “people” OR “aging adults” OR “ageing adults” OR “geriatric*” OR “senile people” OR “senile person” OR “older person*” OR “old-age” OR “older” OR “person*” OR “adult*” OR “elderly person*” OR “senior*” OR “aging” OR “ageing” OR “aged” OR “old man” OR “old men” OR “old woman” OR “old women” OR “older woman” OR “older women”) |
| Study | Nr of Participants | Gender (M*/F*) | Age, year | Study Area | Duration (w) | Diagnostic Criteria | % of Participants with Sarcopenia/Frailty |
|---|---|---|---|---|---|---|---|
| Aas et al. 2019 [36] | 22 | 7/15 | 79+ | Norway | 10 | SPPB for functional capacity-score of 10 or less out of 12 (timed standing valance, GS, TUG) | 100% of older adults with frailty |
| Bellomo et al. 2013 [37] | 40 | 10/0 | 64–80 | Italy | 12 | Criteria of the CDCP-sarcopenia defined as a muscle mass index (muscle mass [kg]/height m2) less than two SD below the mean of a young reference population | 100% of older adults with sarcopenia |
| Binder et al. 2002/2005 [38,39] | 91 (2002) 115 (2005) | 41/50 (2002) 48/67 (2005) | 78+ | USA | 36 | Measures with established predictive validity for disability and mortality in older adults-at least two out of three frailty criteria: 1. Score between 18 and 31 on the modified PPT, 2. Report of difficulty or need for assistance with up to two IADLs or one IADL, 3. Achievement of a VO2 peak between 10 to 18 mL · kg−1 · min−1 (Binder 2002) 2 of three of the criteria: 1. modified PPT score between 18 and 32 (maximum score 36), 2. Report on difficulty and/or assistance with up to two IADLs and/or one IADL, 3. Peak aerobic power (VO2peak) between 10- and 18 mL kg−1 · min−1 (Binder 2005) | 100% of older adults with mild to moderate frailty |
| Cadore et al. 2014 [40] | 24 | 7/17 | 85+ | Spain | 12 | Fried’s criteria for frailty-presence of three or more of the following components: slowness, weakness, weight loss, exhaustion, low physical activity | 100% of older adults with frailty |
| Cebrià i Iranzo et al. 2018 [41] | 26 | 9/17 | 81+ | Spain | 12 | Compliance of the sarcopenia diagnostic criteria proposed by Tyrovolas et al. 2015 which include: 1. Skeletal Muscle Mass Index (SMI = Appendicular Skeletal Muscle Mass/Body Mass Index) with cut-off points for Spanish population (≤0.93 for male and ≤0.57 for female), 2. Gait speed with cut-off points according to sex, height and age (between 0.95–0.66 m/s for male and 0.80–0.48 m/s for female) | 100% of older adults with sarcopenia |
| Chan et al. 2012 [42] | 117 | 48/69 | 65–79 | Taiwan | 48 | CCSHA_CFS_TV with satisfactory inter-rater reliability and criterion validity was used for the first stage screening. Eligible participants scored 3–6 on the CCSHA_CFS_TV (scores 1,2-too healthy or 7-too ill) | 100% of older adults with frailty |
| Chen et al. 2017 [43] | 90 | 10/80 | 65–75 | Taiwan | 12 | Sarcopenia defined as ASM [kg]/weight [kg] × 100% | 100% of older adults with sarcopenia |
| Chen et al. 2018 [44] | 33 | 0/33 | 65–75 | Taiwan | 12 | Asian Working Group for Sarcopenia criteria-the sarcopenic cut-off value for muscle mass measurement is <5.7 kg/m2 for women, with ASM serving as a sarcopenia index (defined as ASM/height [kg/m2] analysed using bioelectrical impedance analysis. Muscle strength-cut-off value for HGS was set as <18 kg for women when HGS was used as a sarcopenia index | 100% of older adults with sarcopenia |
| Clegg et al. 2014 [45] | 84 | 24/60 | 79 | UK | 12 | To account for the spectrum of frailty, the HOPE programme was graded into three levels: 1. TUG as a basic mobility test with good accuracy for identifying frailty (≥30 s level 1), 2. TUG in 20–29 s, intermediate level, 3. TUG in <20 s, independently mobile older adults | 100% of older adults with frailty |
| Fiatarone et al. 1994 [46] | 100 | 37/63 | 72–98 | USA | 10 | Boston FICSIT | 100% of older adults with frailty |
| Gené Huguet et al. 2018 [47] | 173 | 62/112 | 80+ | Spain | 24 | Fried’s criteria for pre-frailty (slowness, weakness, weight loss, exhaustion, low physical activity), Comprehensive Geriatric Assessment (VGI)-VGI-Frail, inter-RAI frailty scale, the Clinical Frailty Scale for frailty | 86.5% of older adults with pre-frailty (13.5% did not finish the training program) |
| Hassan et al. 2015 [48] | 42 | no data | 78–86 | Australia | 24 | EWGSOP criteria-low muscle mass and low muscle function (muscle strength or physical performance) | 100% of older adults with sarcopenia |
| Kim et al. 2011 [49] | 155 | 0/155 | 75+ | Japan | 12 | ASM/height 2 less than 6.42 kg/m2, knee extension strength less than 1.01 Nm/kg, BMI less than 22.0 kg/m | 100% of older adults with sarcopenia |
| Kim et al. 2012 [50] | 128 | 0/128 | 75+ | Japan | 12 | ASM/height 2 less than 6.42 kg/m2, knee extension strength less than 1.01 Nm/kg, BMI less than 22.0 kg/m | 100% of older adults with sarcopenia |
| Liao et al. 2017 [51] | 46 | 0/46 | 60–80 | Taiwan | 12 | EWGSOP criteria: low muscle mass-pre-sarcopenia, low muscle mass and/or low physical performance-sarcopenia | 100% of older adults with sarcopenia |
| Lichtenberg et al. 2019 [52] | 43 | 43/0 | 72+ | Germany | 28 | FrOST (SMI <7.50 kg/m2) | 100% of older adults with sarcopenia |
| Maruya et al. 2016 [53] | 52 | 23/29 | 62–75 | Japan | 24 | AWGS criteria, pre-sarcopenia: SMI <7.0 kg/m2 for men and <5.7 kg/m2 for women, sarcopenia: HGS <26 kg for men and < 8 kg for women | 85% of older adults with pre-sarcopenia 15% of older adults with sarcopenia |
| Ng et al. 2015 [54] | 246 | 95/151 | 65+ | Singapore | 24 | 5 CHS criteria for frailty: unintentional weight loss (<18.5 kg/m2 or self-reported unintentional weight loss ≥4.5 kg), slowness, weakness, exhaustion and low activity (1 if present and 0 if absent) | 72% of older adults with pre-frailty 28% of older adults with frailty |
| Park et al. 2017 [55] | 50 | 0/50 | 65+ | South Korea | 24 | BMI ≥25.0 kg/m2, ASM/weight <25.1% | 100% of older adults with sarcopenia |
| Serra-Prat et al. 2017 [56] | 172 | 75/97 | 70+ | Spain | 48 | Fried’s criteria for frailty-presence of three or more of the following components: slowness, weakness, weight loss, exhaustion, low physical activity | 100% of older adults with pre-frailty |
| Tsekoura et al. 2018 [57] | 54 | 7/47 | 65+ | Greece | 24 | SarQol_GR (22 questions, rated on a 4-point Likert scale of frequency and intensity): physical and mental health, locomotion, body composition, functionality, ADL, leisure activities and fears (0-worst imaginable health, 100-best imaginable health), EWGSOP | 100% of older adults with sarcopenia |
| Vikberg et al. 2019 [58] | 70 | 32/38 | 70+ | Sweden | 10 | EWGSOP criteria: ALMI (arm lean mass + leg lean mass divided by height squared) ≤7.29 (range 5.69–7.29) in men and ≤5.93 (range 4.50–5.93) in women | 100% of older adults with pre-sarcopenia |
| Yamada et al. 2019 [59] | 112 | 39/73 | 65+ | Japan | 12 | AWGS criteria, low muscle function (low physical performance or low muscle strength) and low muscle mass | 30% of older adults with sarcopenia (70% of older adults with dynapenia, not included in our meta-analysis) |
| Zech et al. 2012 [60] | 69 | no data | 65–94 | Germany | 36 | Fried’s criteria for frailty-presence of three or more of the following components: slowness, weakness, weight loss, exhaustion, low physical activity (Minnesota Leisure Time Physical Activity Questionnaire) | 100% of older adults with pre-frailty |
| Zhu et al. 2019 [61] | 113 | 26/87 | 65+ | China | 24 | AWGS criteria: ASM/height 2(ASM/Ht2) measured using DXA of less than 7.0 kg/m2 for men and 5.4 kg/m2 for women; low HGS (less than 26 kg for men and 18 kg for women) and/or low usual GS (less than or equal to 0.8 m/s) | 100% of older adults with sarcopenia |
References
- Beard, J.R.; Officer, A.; de Carvalho, I.A.; Sadana, R.; Pot, A.M.; Michel, J.-P.; Lloyd-Sherlock, P.; Epping-Jordan, J.E.; Peeters, G.M.E.E.G.; Mahanani, W.R.; et al. The World report on ageing and health: A policy framework for healthy ageing. Lancet 2016, 387, 2145–2154. [Google Scholar] [CrossRef]
- Bevan, S. Economic impact of musculoskeletal disorders (MSDs) on work in Europe. Best Pract. Res. Clin. Rheumatol. 2015, 29, 356–373. [Google Scholar] [CrossRef] [PubMed]
- Ethgen, O.; Beaudart, C.; Buckinx, F.; Bruyère, O.; Reginster, J.Y. The Future Prevalence of Sarcopenia in Europe: A Claim for Public Health Action. Calcif. Tissue Int. 2017, 100, 229–234. [Google Scholar] [CrossRef] [PubMed]
- Rolland, Y.; Czerwinski, S.; Van Kan, G.A.; Morley, J.E.; Cesari, M.; Onder, G.; Woo, J.; Baumgartner, R.; Pillard, F.; Boirie, Y.; et al. Sarcopenia: Its assessment, etiology, pathogenesis, consequences and future perspectives. J. Nutr. Heal. Aging 2008, 12, 430–450. [Google Scholar] [CrossRef]
- Svensson, R.B.; Heinemeier, K.M.; Couppé, C.; Kjaer, M.; Magnusson, S.P. Effect of aging and exercise on the tendon. J. Appl. Physiol. 2016, 121, 1237–1246. [Google Scholar] [CrossRef]
- Thompson, B.J.; Ryan, E.D.; Herda, T.J.; Costa, P.B.; Herda, A.A.; Cramer, J.T. Age-related changes in the rate of muscle activation and rapid force characteristics. Age 2014, 36, 839–849. [Google Scholar] [CrossRef]
- Xue, Q.L. The Frailty Syndrome: Definition and Natural History. Clin. Geriatr. Med. 2011, 27, 1–15. [Google Scholar] [CrossRef]
- Bock, J.O.; König, H.H.; Brenner, H.; Haefeli, W.E.; Quinzler, R.; Matschinger, H.; Saum, K.U.; Schöttker, B.; Heider, D. Associations of frailty with health care costs—Results of the ESTHER cohort study. BMC Health Serv. Res. 2016, 16. [Google Scholar] [CrossRef]
- Woolford, S.J.; Sohan, O.; Dennison, E.M.; Cooper, C.; Patel, H.P. Approaches to the diagnosis and prevention of frailty. Aging Clin. Exp. Res. 2020, 32, 1629–1637. [Google Scholar] [CrossRef]
- De Mello, R.G.B.; Dalla Corte, R.R.; Gioscia, J.; Moriguchi, E.H. Effects of Physical Exercise Programs on Sarcopenia Management, Dynapenia, and Physical Performance in the Elderly: A Systematic Review of Randomized Clinical Trials. J. Aging Res. 2019. [Google Scholar] [CrossRef]
- Cadore, E.L.; Rodríguez-Mañas, L.; Sinclair, A.; Izquierdo, M. Effects of Different Exercise Interventions on Risk of Falls, Gait Ability, and Balance in Physically Frail Older Adults: A Systematic Review. Rejuvenation Res. 2013, 16, 105–114. [Google Scholar] [CrossRef] [PubMed]
- Courel-Ibáñez, J.; Pallarés, J.G.; García-Conesa, S.; Buendía-Romero, Á.; Martínez-Cava, A.; Izquierdo, M. Supervised Exercise (Vivifrail) Protects Institutionalized Older Adults Against Severe Functional Decline After 14 Weeks of COVID Confinement. J. Am. Med. Dir. Assoc. 2021, 22, 217–219.e2. [Google Scholar] [CrossRef]
- British Geriatrics Society (BGS) Frailty: What’s It All About? British Geriatrics Society. Available online: https://www.bgs.org.uk/resources/frailty-what’s-it-all-about (accessed on 25 March 2021).
- Marzetti, E.; Calvani, R.; Tosato, M.; Cesari, M.; Di Bari, M.; Cherubini, A.; Broccatelli, M.; Savera, G.; D’Elia, M.; Pahor, M.; et al. Physical activity and exercise as countermeasures to physical frailty and sarcopenia. Aging Clin. Exp. Res. 2017, 29, 35–42. [Google Scholar] [CrossRef]
- Yoo, S.Z.; No, M.H.; Heo, J.W.; Park, D.H.; Kang, J.H.; Kim, S.H.; Kwak, H.B. Role of exercise in age-related sarcopenia. J. Exerc. Rehabil. 2018, 14, 551. [Google Scholar] [CrossRef] [PubMed]
- McLeod, J.C.; Stokes, T.; Phillips, S.M. Resistance exercise training as a primary countermeasure to age-related chronic disease. Front. Physiol. 2019, 10, 645. [Google Scholar] [CrossRef]
- Papa, E.V.; Dong, X.; Hassan, M. Resistance training for activity limitations in older adults with skeletal muscle function deficits: A systematic review. Clin. Interv. Aging 2017, 12, 955–961. [Google Scholar] [CrossRef]
- Lai, C.C.; Tu, Y.K.; Wang, T.G.; Huang, Y.T.; Chien, K.L. Effects of resistance training, endurance training and whole-body vibration on lean body mass, muscle strength and physical performance in older people: A systematic review and network meta-analysis. Age Ageing 2018, 47, 367–373. [Google Scholar] [CrossRef]
- Pollock, M.L.; Franklin, B.A.; Balady, G.J.; Chaitman, B.L.; Fleg, J.L.; Fletcher, B.; Limacher, M.; Pina, I.L.; Stein, R.A.; Williams, M.; et al. Resistance exercise in individuals with and without cardiovascular disease: Benefits, rationale, safety, and prescription: An advisory from the Committee on Exercise, Rehabilitation, and Prevention, Council on Clinical Cardiology, American Heart Association. Circulation 2000, 101, 828–833. [Google Scholar]
- Shaw, I.; Shaw, B.S. Effect of resistance training on cardiorespiratory endurance and coronary artery disease risk. Cardiovasc. J. S. Afr. 2005, 16, 256–259. [Google Scholar]
- Fragala, M.S.; Cadore, E.L.; Dorgo, S.; Izquierdo, M.; Kraemer, W.J.; Peterson, M.D.; Ryan, E.D. Resistance Training for Older Adults. Position Statement from the National Strength and Conditioning Association. J. Strength Cond. Res. 2019, 33, 2019–2052. [Google Scholar] [CrossRef]
- Bao, W.; Sun, Y.; Zhang, T.; Zou, L.; Wu, X.; Wang, D.; Chen, Z. Exercise programs for muscle mass, muscle strength and physical performance in older adults with sarcopenia: A systematic review and meta-analysis. Aging Dis. 2020, 11, 863–873. [Google Scholar] [CrossRef] [PubMed]
- Oliveira, J.S.; Pinheiro, M.B.; Fairhall, N.; Walsh, S.; Franks, T.C.; Kwok, W.; Bauman, A.; Sherrington, C. Evidence on Physical Activity and the Prevention of Frailty and Sarcopenia among Older People: A Systematic Review to Inform the World Health Organization Physical Activity Guidelines. J. Phys. Act. Health 2020, 17, 1247–1258. [Google Scholar] [CrossRef] [PubMed]
- Lopez, P.; Pinto, R.S.; Radaelli, R.; Rech, A.; Grazioli, R.; Izquierdo, M.; Cadore, E.L. Benefits of resistance training in physically frail elderly: A systematic review. Aging Clin. Exp. Res. 2018, 30, 889–899. [Google Scholar] [CrossRef] [PubMed]
- Law, T.D.; Clark, L.A.; Clark, B.C. Resistance Exercise to Prevent and Manage Sarcopenia and Dynapenia. Annu. Rev. Gerontol. Geriatr. 2016, 36, 205–228. [Google Scholar] [CrossRef]
- Moher, D.; Liberati, A.; Tetzlaff, J.; Altman, D.G.; Group, T.P. Preferred Reporting Items for Systematic Reviews and Meta-Analyses: The PRISMA Statement. PLoS Med. 2009, 6, e1000097. [Google Scholar] [CrossRef]
- Mayer, F.; Scharhag-Rosenberger, F.; Carlsohn, A.; Cassel, M.; Müller, S.; Scharhag, J. The intensity and effects of strength training in the elderly. Dtsch. Arztebl. 2011, 108, 359–364. [Google Scholar] [CrossRef]
- Petrella, R.J.; Chudyk, A. Exercise prescription in the older athlete as it applies to muscle, tendon, and arthroplasty. Clin. J. Sport Med. 2008, 18, 522–530. [Google Scholar] [CrossRef]
- Oxman, A.D. Grading quality of evidence and strength of recommendations. Br. Med. J. 2004, 328, 1490–1494. [Google Scholar]
- De Morton, N.A. The PEDro scale is a valid measure of the methodological quality of clinical trials: A demographic study. Aust. J. Physiother. 2009, 55, 129–133. [Google Scholar] [CrossRef]
- Herbert, R.; Moseley, A.; Sherrington, C. PEDro: A database of randomised controlled trials in physiotherapy. Health Inf. Manag. 1998, 28, 186–188. [Google Scholar] [CrossRef]
- Maher, C.G.; Sherrington, C.; Herbert, R.D.; Moseley, A.M.; Elkins, M. Reliability of the PEDro Scale for Rating Quality of Randomized Controlled Trials. Phys. Ther. 2003, 83, 713–721. [Google Scholar] [CrossRef]
- Hedges, L.V.; Tipton, E.; Johnson, M.C. Robust variance estimation in meta-regression with dependent effect size estimates. Res. Synth. Methods 2010, 1, 39–65. [Google Scholar] [CrossRef]
- Tipton, E. Small sample adjustments for robust variance estimation with meta-regression. Psychol. Methods 2015, 20, 375–393. [Google Scholar] [CrossRef]
- Melsen, W.G.; Bootsma, M.C.J.; Rovers, M.M.; Bonten, M.J.M. The effects of clinical and statistical heterogeneity on the predictive values of results from meta-analyses. Clin. Microbiol. Infect. 2014, 20, 123–129. [Google Scholar] [CrossRef]
- Aas, S.N.; Seynnes, O.; Benestad, H.B.; Raastad, T. Strength training and protein supplementation improve muscle mass, strength, and function in mobility-limited older adults: A randomized controlled trial. Aging Clin. Exp. Res. 2020. [Google Scholar] [CrossRef]
- Bellomo, R.G.; Iodice, P.; Maffulli, N.; Maghradze, T.; Coco, V.; Saggini, R. Muscle strength and balance training in sarcopenic elderly: A pilot study with randomized controlled trial. Eur. J. Inflamm. 2013, 193–201. [Google Scholar] [CrossRef]
- Binder, E.F.; Schechtman, K.B.; Ehsani, A.A.; Steger-May, K.; Brown, M.; Sinacore, D.R.; Yarasheski, K.E.; Holloszy, J.O. Effects of exercise training on frailty in community-dwelling older adults: Results of a randomized, controlled trial. J. Am. Geriatr. Soc. 2002, 1921–1928. [Google Scholar] [CrossRef]
- Binder, E.F.; Yarasheski, K.E.; Steger-May, K.; Sinacore, D.R.; Brown, M.; Schechtman, K.B.; Holloszy, J.O. Effects of progressive resistance training on body composition in frail older adults: Results of a randomized, controlled trial. J. Gerontol. Ser. A Biol. Sci. Med. Sci. 2005, 1425–1431. [Google Scholar] [CrossRef]
- Cadore, E.L.; Casas-Herrero, A.; Zambom-Ferraresi, F.; Idoate, F.; Millor, N.; Gómez, M.; Rodriguez-Mañas, L.; Izquierdo, M. Multicomponent exercises including muscle power training enhance muscle mass, power output, and functional outcomes in institutionalized frail nonagenarians. Age 2014, 36, 773–785. [Google Scholar] [CrossRef]
- Cebrià, I.; Iranzo, M.; Balasch-Bernat, M.; Tortosa-Chuliá, M.; Balasch-Parisi, S. Effects of resistance training of peripheral muscles versus respiratory muscles in older adults with sarcopenia who are institutionalized: A randomized controlled trial. J. Aging Phys. Act. 2018, 26, 637–646. [Google Scholar] [CrossRef]
- Chan, D.C.D.; Tsou, H.H.; Yang, R.S.; Tsauo, J.Y.; Chen, C.Y.; Hsiung, C.A.; Kuo, K.N. A pilot randomized controlled trial to improve geriatric frailty. BMC Geriatr. 2012. [Google Scholar] [CrossRef]
- Chen, H.T.; Chung, Y.C.; Chen, Y.J.; Ho, S.Y.; Wu, H.J. Effects of Different Types of Exercise on Body Composition, Muscle Strength, and IGF-1 in the Elderly with Sarcopenic Obesity. J. Am. Geriatr. Soc. 2017, 827–832. [Google Scholar] [CrossRef]
- Chen, H.T.; Wu, H.J.; Chen, Y.J.; Ho, S.Y.; Chung, Y.C. Effects of 8-week kettlebell training on body composition, muscle strength, pulmonary function, and chronic low-grade inflammation in elderly women with sarcopenia. Exp. Gerontol. 2018, 112, 112–118. [Google Scholar] [CrossRef]
- Clegg, A.; Barber, S.; Young, J.; Iliffe, S.; Forster, A. The Home-based Older People’s Exercise (HOPE) trial: A pilot randomised controlled trial of a home-based exercise intervention for older people with frailty. Age Ageing 2014, 43, 687–695. [Google Scholar] [CrossRef]
- Fiatarone, M.A.; O’Neill, E.F.; Ryan, N.D.; Clements, K.M.; Solares, G.R.; Nelson, M.E.; Roberts, S.B.; Kehayias, J.J.; Lipsitz, L.A.; Evans, W.J. Exercise Training and Nutritional Supplementation for Physical Frailty in Very Elderly People. N. Engl. J. Med. 1994, 330, 1769–1775. [Google Scholar] [CrossRef]
- Gené Huguet, L.; Navarro González, M.; Kostov, B.; Ortega Carmona, M.; Colungo Francia, C.; Carpallo Nieto, M.; Hervás Docón, A.; Vilarrasa Sauquet, R.; García Prado, R.; Sisó-Almirall, A. Pre Frail 80: Multifactorial Intervention to Prevent Progression of Pre-Frailty to Frailty in the Elderly. J. Nutr. Health Aging 2018, 22, 1266–1274. [Google Scholar] [CrossRef]
- Hassan, B.H.; Hewitt, J.; Keogh, J.W.L.; Bermeo, S.; Duque, G.; Henwood, T.R. Impact of resistance training on sarcopenia in nursing care facilities: A pilot study. Geriatr. Nurs. 2016, 37, 116–121. [Google Scholar] [CrossRef]
- Kim, H.K.; Suzuki, T.; Saito, K.; Yoshida, H.; Kobayashi, H.; Kato, H.; Katayama, M. Effects of exercise and amino acid supplementation on body composition and physical function in community-dwelling elderly Japanese sarcopenic women: A randomized controlled trial. J. Am. Geriatr. Soc. 2011, 16–23. [Google Scholar] [CrossRef]
- Kim, H.; Suzuki, T.; Saito, K.; Yoshida, H.; Kojima, N.; Kim, M.; Sudo, M.; Yamashiro, Y.; Tokimitsu, I. Effects of exercise and tea catechins on muscle mass, strength and walking ability in community-dwelling elderly Japanese sarcopenic women: A randomized controlled trial. Geriatr. Gerontol. Int. 2012, 13, 458–465. [Google Scholar] [CrossRef]
- Liao, C.-D.; Tsauo, J.-Y.; Lin, L.-F.; Huang, S.-W.; Ku, J.-W.; Chou, L.-C.; Liou, T.-H. Effects of elastic resistance exercise on body composition and physical capacity in older women with sarcopenic obesity: A CONSORT-compliant prospective randomized controlled trial. Medicine 2017, 96, e7115. [Google Scholar] [CrossRef]
- Lichtenberg, T.; Von Stengel, S.; Sieber, C.; Kemmler, W. The favorable effects of a high-intensity resistance training on sarcopenia in older community-dwelling men with osteosarcopenia: The randomized controlled frost study. Clin. Interv. Aging 2019, 14, 2173–2186. [Google Scholar] [CrossRef]
- Maruya, K.; Asakawa, Y.; Ishibashi, H.; Fujita, H.; Arai, T.; Yamaguchi, H. Effect of a simple and adherent home exercise program on the physical function of community dwelling adults sixty years of age and older with pre-sarcopenia or sarcopenia. J. Phys. Ther. Sci. 2016, 28, 3138–3188. [Google Scholar] [CrossRef]
- Ng, T.P.; Feng, L.; Nyunt, M.S.Z.; Feng, L.; Niti, M.; Tan, B.Y.; Chan, G.; Khoo, S.A.; Chan, S.M.; Yap, P.; et al. Nutritional, Physical, Cognitive, and Combination Interventions and Frailty Reversal among Older Adults: A Randomized Controlled Trial. Am. J. Med. 2015, 128, 1225–1236.e1. [Google Scholar] [CrossRef] [PubMed]
- Park, J.; Kwon, Y.; Park, H. Effects of 24-Week Aerobic and Resistance Training on Carotid Artery Intima-Media Thickness and Flow Velocity in Elderly Women with Sarcopenic Obesity. J. Atheroscler. Thromb. 2017, 24, 1117–1124. [Google Scholar] [CrossRef] [PubMed]
- Serra-Prat, M.; Sist, X.; Domenich, R.; Jurado, L.; Saiz, A.; Roces, A.; Palomera, E.; Tarradelles, M.; Papiol, M. Effectiveness of an intervention to prevent frailty in pre-frail community-dwelling older people consulting in primary care: A randomised controlled trial. Age Ageing 2017, 46, 401–407. [Google Scholar] [CrossRef] [PubMed]
- Tsekoura, M.; Billis, E.; Tsepis, E.; Dimitriadis, Z.; Matzaroglou, C.; Tyllianakis, M.; Panagiotopoulos, E.; Gliatis, J. The Effects of Group and Home-Based Exercise Programs in Elderly with Sarcopenia: A Randomized Controlled Trial. J. Clin. Med. 2018, 7, 480. [Google Scholar] [CrossRef]
- Vikberg, S.; Sörlén, N.; Brandén, L.; Johansson, J.; Nordström, A.; Hult, A.; Nordström, P. Effects of Resistance Training on Functional Strength and Muscle Mass in 70-Year-Old Individuals with Pre-sarcopenia: A Randomized Controlled Trial. J. Am. Med. Dir. Assoc. 2019, 20, 28–34. [Google Scholar] [CrossRef]
- Yamada, M.; Kimura, Y.; Ishiyama, D.; Nishio, N.; Otobe, Y.; Tanaka, T.; Ohji, S.; Koyama, S.; Sato, A.; Suzuki, M.; et al. Synergistic effect of bodyweight resistance exercise and protein supplementation on skeletal muscle in sarcopenic or dynapenic older adults. Geriatr. Gerontol. Int. 2019. [Google Scholar] [CrossRef]
- Zech, A.; Drey, M.; Freiberger, E.; Hentschke, C.; Bauer, J.M.; Sieber, C.C.; Pfeifer, K. Residual effects of muscle strength and muscle power training and detraining on physical function in community-dwelling prefrail older adults: A randomized controlled trial. BMC Geriatr. 2012, 12, 68. [Google Scholar] [CrossRef]
- Zhu, L.Y.; Chan, R.; Kwok, T.; Cheng, K.C.C.; Ha, A.; Woo, J. Effects of exercise and nutrition supplementation in community-dwelling older Chinese people with sarcopenia: A randomized controlled trial. Age Ageing 2019, 220–228. [Google Scholar] [CrossRef]
- Cruz-Jentoft, A.J.; Bahat, G.; Bauer, J.; Boirie, Y.; Bruyère, O.; Cederholm, T.; Cooper, C.; Landi, F.; Rolland, Y.; Sayer, A.A.; et al. Sarcopenia: Revised European consensus on definition and diagnosis. Age Ageing 2019, 48, 16–31. [Google Scholar] [CrossRef]
- Lee, S.H.; Gong, H.S. Measurement and interpretation of handgrip strength for research on sarcopenia and osteoporosis. J. Bone Metab. 2020, 27, 85–96. [Google Scholar] [CrossRef]
- Mathiowetz, V.; Weber, K.; Volland, G.; Kashman, N. Reliability and validity of grip and pinch strength evaluations. J. Hand Surg. Am. 1984, 9, 222–226. [Google Scholar] [CrossRef]
- Tieland, M.; Verdijk, L.B.; De Groot, L.C.P.G.M.; Van Loon, L.J.C. Handgrip strength does not represent an appropriate measure to evaluate changes in muscle strength during an exercise intervention program in frail older people. Int. J. Sport Nutr. Exerc. Metab. 2015, 25, 27–36. [Google Scholar] [CrossRef]
- Yeung, S.S.Y.; Reijnierse, E.M.; Trappenburg, M.C.; Hogrel, J.Y.; McPhee, J.S.; Piasecki, M.; Sipila, S.; Salpakoski, A.; Butler-Browne, G.; Pääsuke, M.; et al. Handgrip Strength Cannot Be Assumed a Proxy for Overall Muscle Strength. J. Am. Med. Dir. Assoc. 2018, 19, 703–709. [Google Scholar] [CrossRef]
- Rodacki, A.L.F.; Moreira, N.B.; Pitta, A.; Wolf, R.; Filho, J.M.; de Rodacki, C.L.N.; Pereira, G. Is handgrip strength a useful measure to evaluate lower limb strength and functional performance in older women? Clin. Interv. Aging 2020, 1045–1056. [Google Scholar] [CrossRef]
- Simonsen, E.B. Contributions to the understanding of gait control. Dan. Med. J. 2014, 15, 1045–1056. [Google Scholar] [CrossRef]
- Besier, T.F.; Fredericson, M.; Gold, G.E.; Beaupré, G.S.; Delp, S.L. Knee muscle forces during walking and running in patellofemoral pain patients and pain-free controls. J. Biomech. 2009, 42, 898–905. [Google Scholar] [CrossRef]
- Wretenberg, P.; Arborelius, U.P. Power and work produced in different leg muscle groups when rising from a chair. Eur. J. Appl. Physiol. Occup. Physiol. 1994, 68, 413–417. [Google Scholar] [CrossRef]
- Fusco, O.; Ferrini, A.; Santoro, M.; Lo Monaco, M.R.; Gambassi, G.; Cesari, M. Physical function and perceived quality of life in older persons. Aging Clin. Exp. Res. 2012, 24, 68–73. [Google Scholar] [CrossRef]
- Hazra, N.C.; Rudisill, C.; Gulliford, M.C. Determinants of health care costs in the senior elderly: Age, comorbidity, impairment, or proximity to death? Eur. J. Health Econ. 2018, 19, 831–842. [Google Scholar] [CrossRef] [PubMed]
- Guralnik, J.M.; Alecxih, L.; Branch, L.G.; Wiener, J.M. Medical and long-term care costs when older persons become more dependent. Am. J. Public Health 2002, 92, 1244–1245. [Google Scholar] [CrossRef] [PubMed]
- Semmler, J.G.; Enoka, R.M. Neural Contributions to Changes in Muscle Strength. In Biomechanics in Sport: Performance Enhancement and Injury Prevention; Wiley: Hoboken, NJ, USA, 2008. [Google Scholar] [CrossRef]
- Manini, T.M. Energy expenditure and aging. Ageing Res. Rev. 2010, 9, 1–11. [Google Scholar] [CrossRef]
- Geisler, C.; Braun, W.; Pourhassan, M.; Schweitzer, L.; Glüer, C.C.; Bosy-Westphal, A.; Müller, M.J. Age-dependent changes in resting energy expenditure (REE): Insights from detailed body composition analysis in normal and overweight healthy caucasians. Nutrients 2016, 8, 322. [Google Scholar] [CrossRef]
- Denys, K.; Cankurtaran, M.; Janssens, W.; Petrovic, M. Metabolic syndrome in the elderly: An overview of the evidence. Acta Clin. Belg. 2009, 64, 23–34. [Google Scholar] [CrossRef]
- Sinclair, A.; Viljoen, A. The metabolic syndrome in older persons. Clin. Geriatr. Med. 2010, 26, 261–274. [Google Scholar] [CrossRef]
- Saad, M.A.N.; Cardoso, G.P.; de Martins, W.A.; Velarde, L.G.C.; Cruz Filho, R.A. Prevalence of Metabolic Syndrome in Elderly and Agreement among Four Diagnostic Criteria. Arq. Bras. Cardiol. 2014, 102, 263–269. [Google Scholar] [CrossRef]
- Izquierdo, M. Vivifrail: Multicomponent Program of Physical Exercise. Available online: Vivifrail.com (accessed on 8 July 2020).
- Hajek, A.; Bock, J.O.; Saum, K.U.; Matschinger, H.; Brenner, H.; Holleczek, B.; Haefeli, W.E.; Heider, D.; König, H.H. Frailty and healthcare costs-longitudinal results of a prospective cohort study. Age Ageing 2018, 47, 233–241. [Google Scholar] [CrossRef]
- García-Nogueras, I.; Aranda-Reneo, I.; Peña-Longobardo, L.M.; Oliva-Moreno, J.; Abizanda, P. Use of health resources and healthcare costs associated with frailty: The FRADEA study. J. Nutr. Health Aging 2017, 21, 207–214. [Google Scholar] [CrossRef]
- Peña-Longobardo, L.M.; Oliva-Moreno, J.; Zozaya, N.; Aranda-Reneo, I.; Trapero-Bertran, M.; Laosa, O.; Sinclair, A.; Rodríguez-Mañas, L. Economic evaluation of a multimodal intervention in pre-frail and frail older people with diabetes mellitus: The MID-FRAIL project. Expert Rev. Pharm. Outcomes Res. 2021, 21, 111–118. [Google Scholar] [CrossRef]
- Jin, H.Y.; Liu, X.; Xue, Q.L.; Chen, S.; Wu, C. The Association between Frailty and Healthcare Expenditure among Chinese Older Adults. J. Am. Med. Dir. Assoc. 2020, 21, 780–785. [Google Scholar] [CrossRef] [PubMed]
- Antunes, A.C.; Araújo, D.A.; Veríssimo, M.T.; Amaral, T.F. Sarcopenia and hospitalisation costs in older adults: A cross-sectional study. Nutr. Diet. 2017, 74, 46–50. [Google Scholar] [CrossRef] [PubMed]


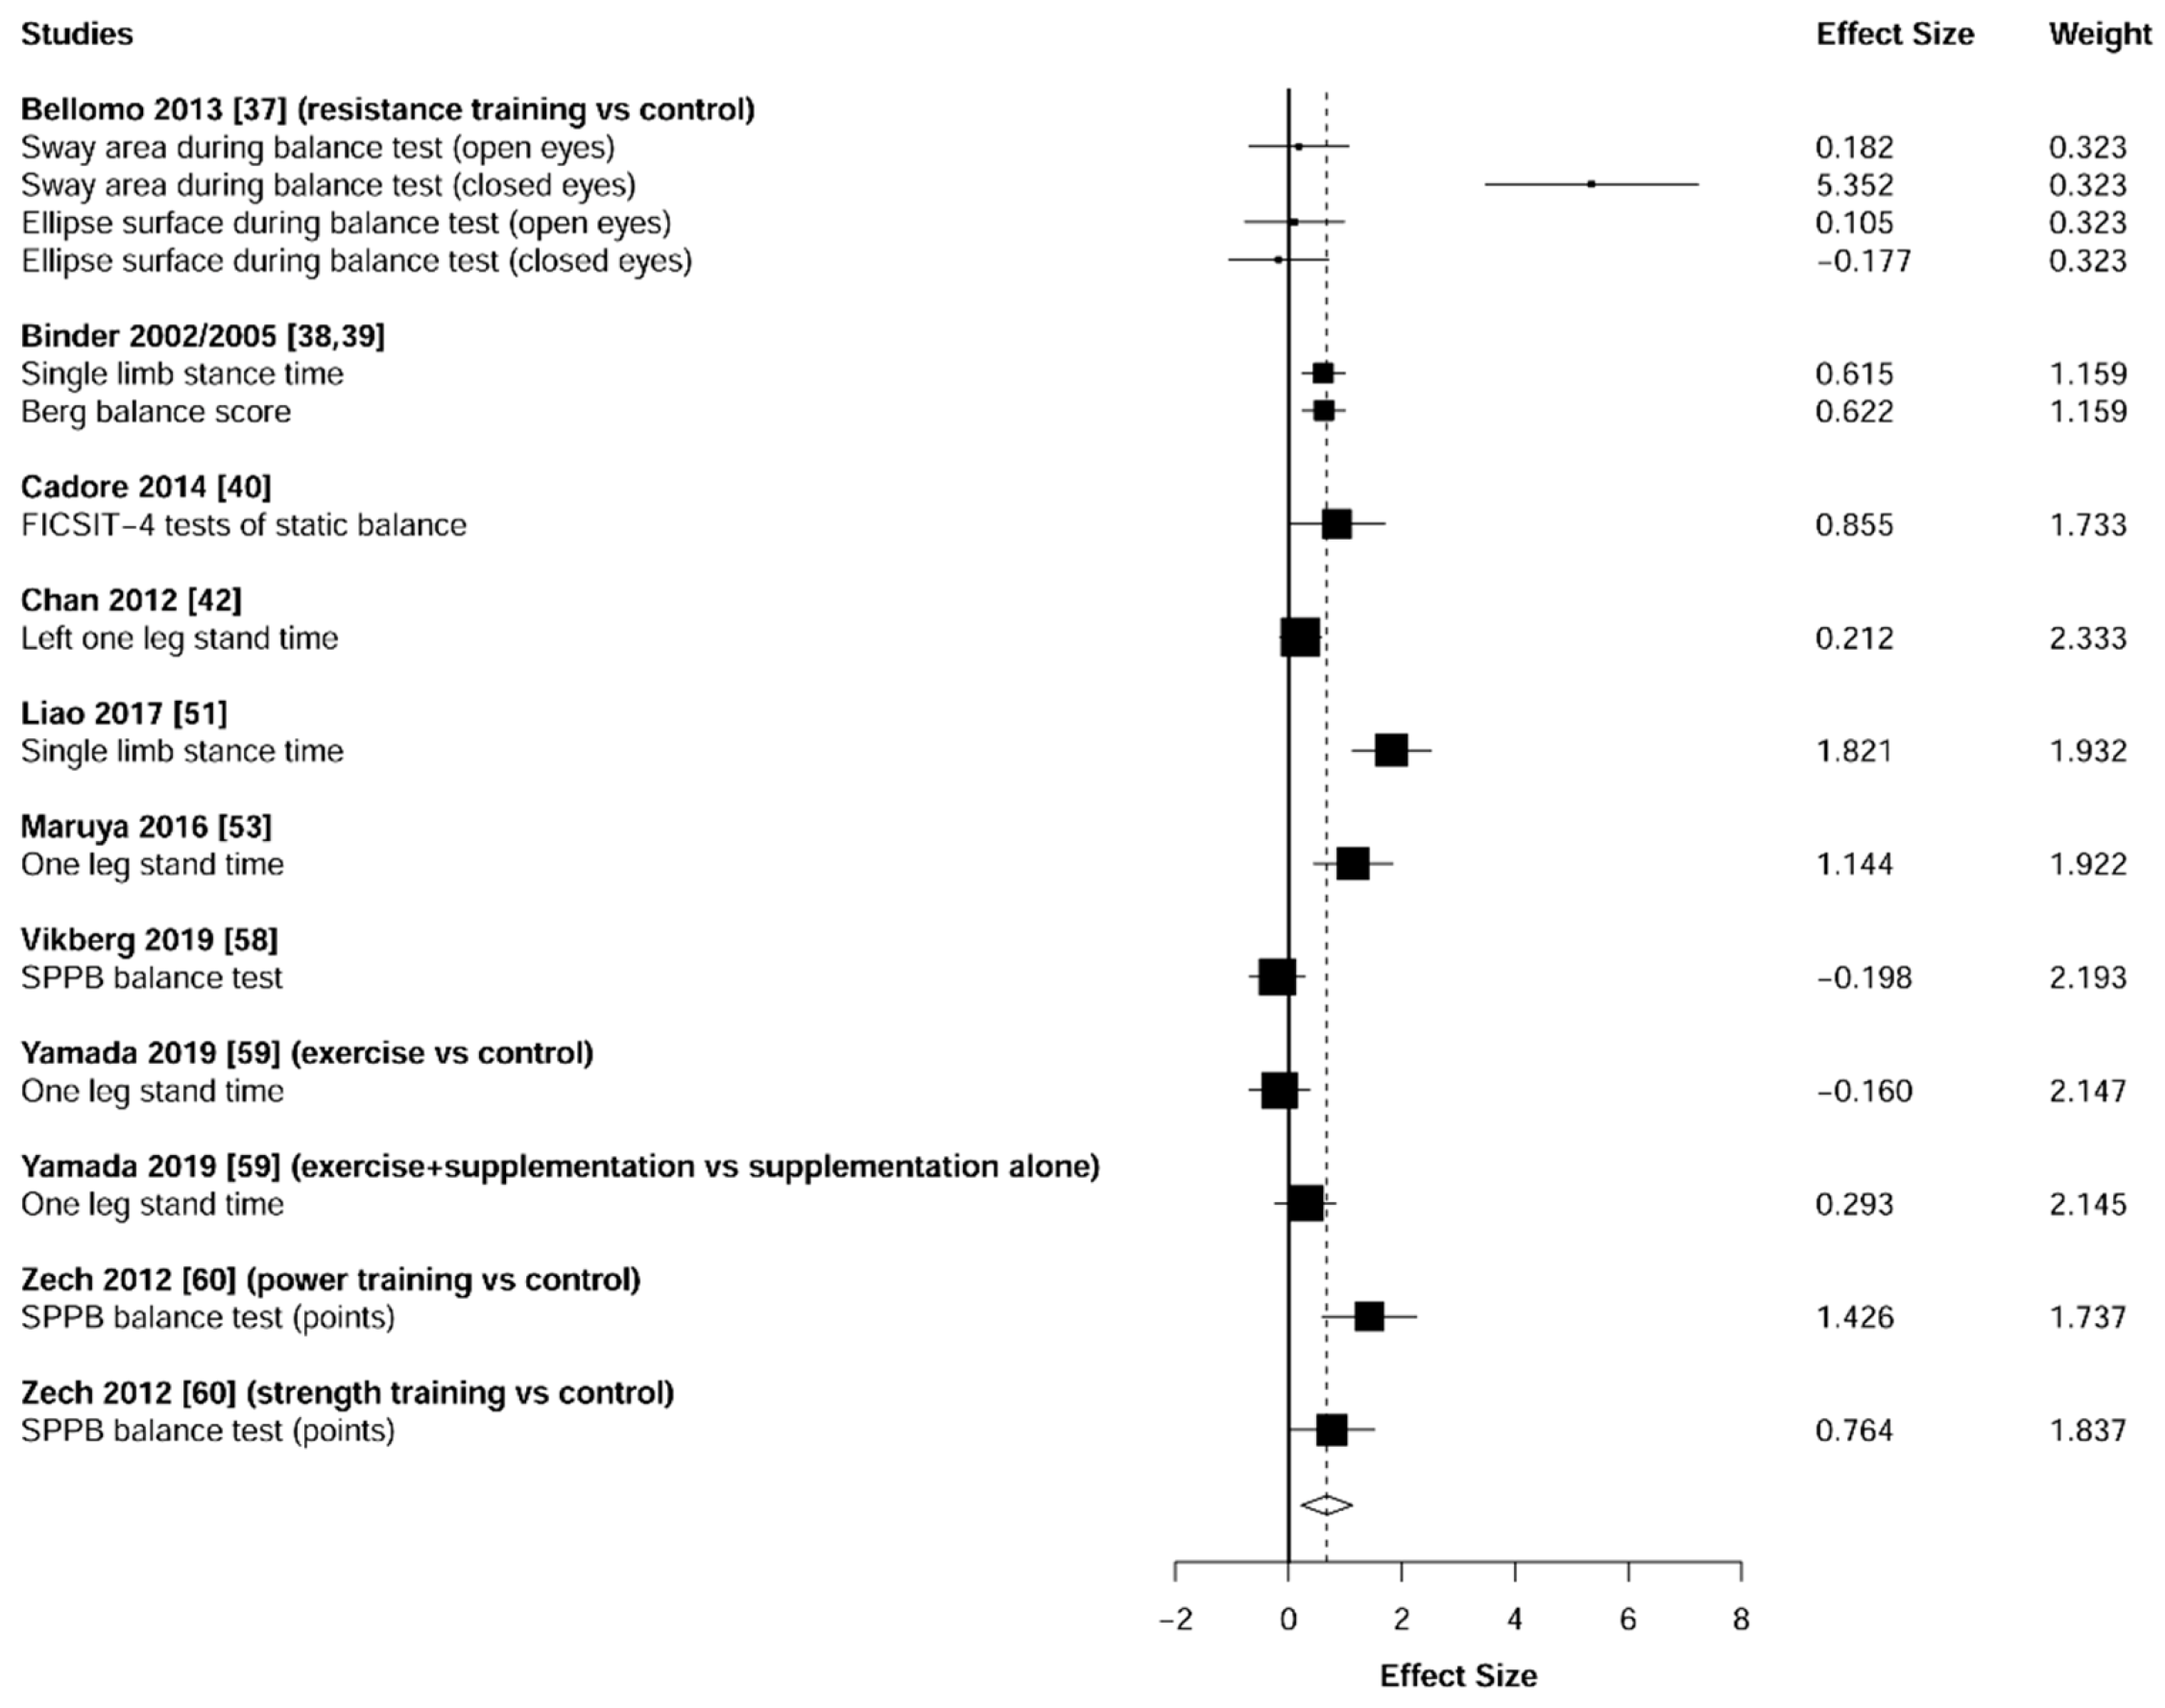
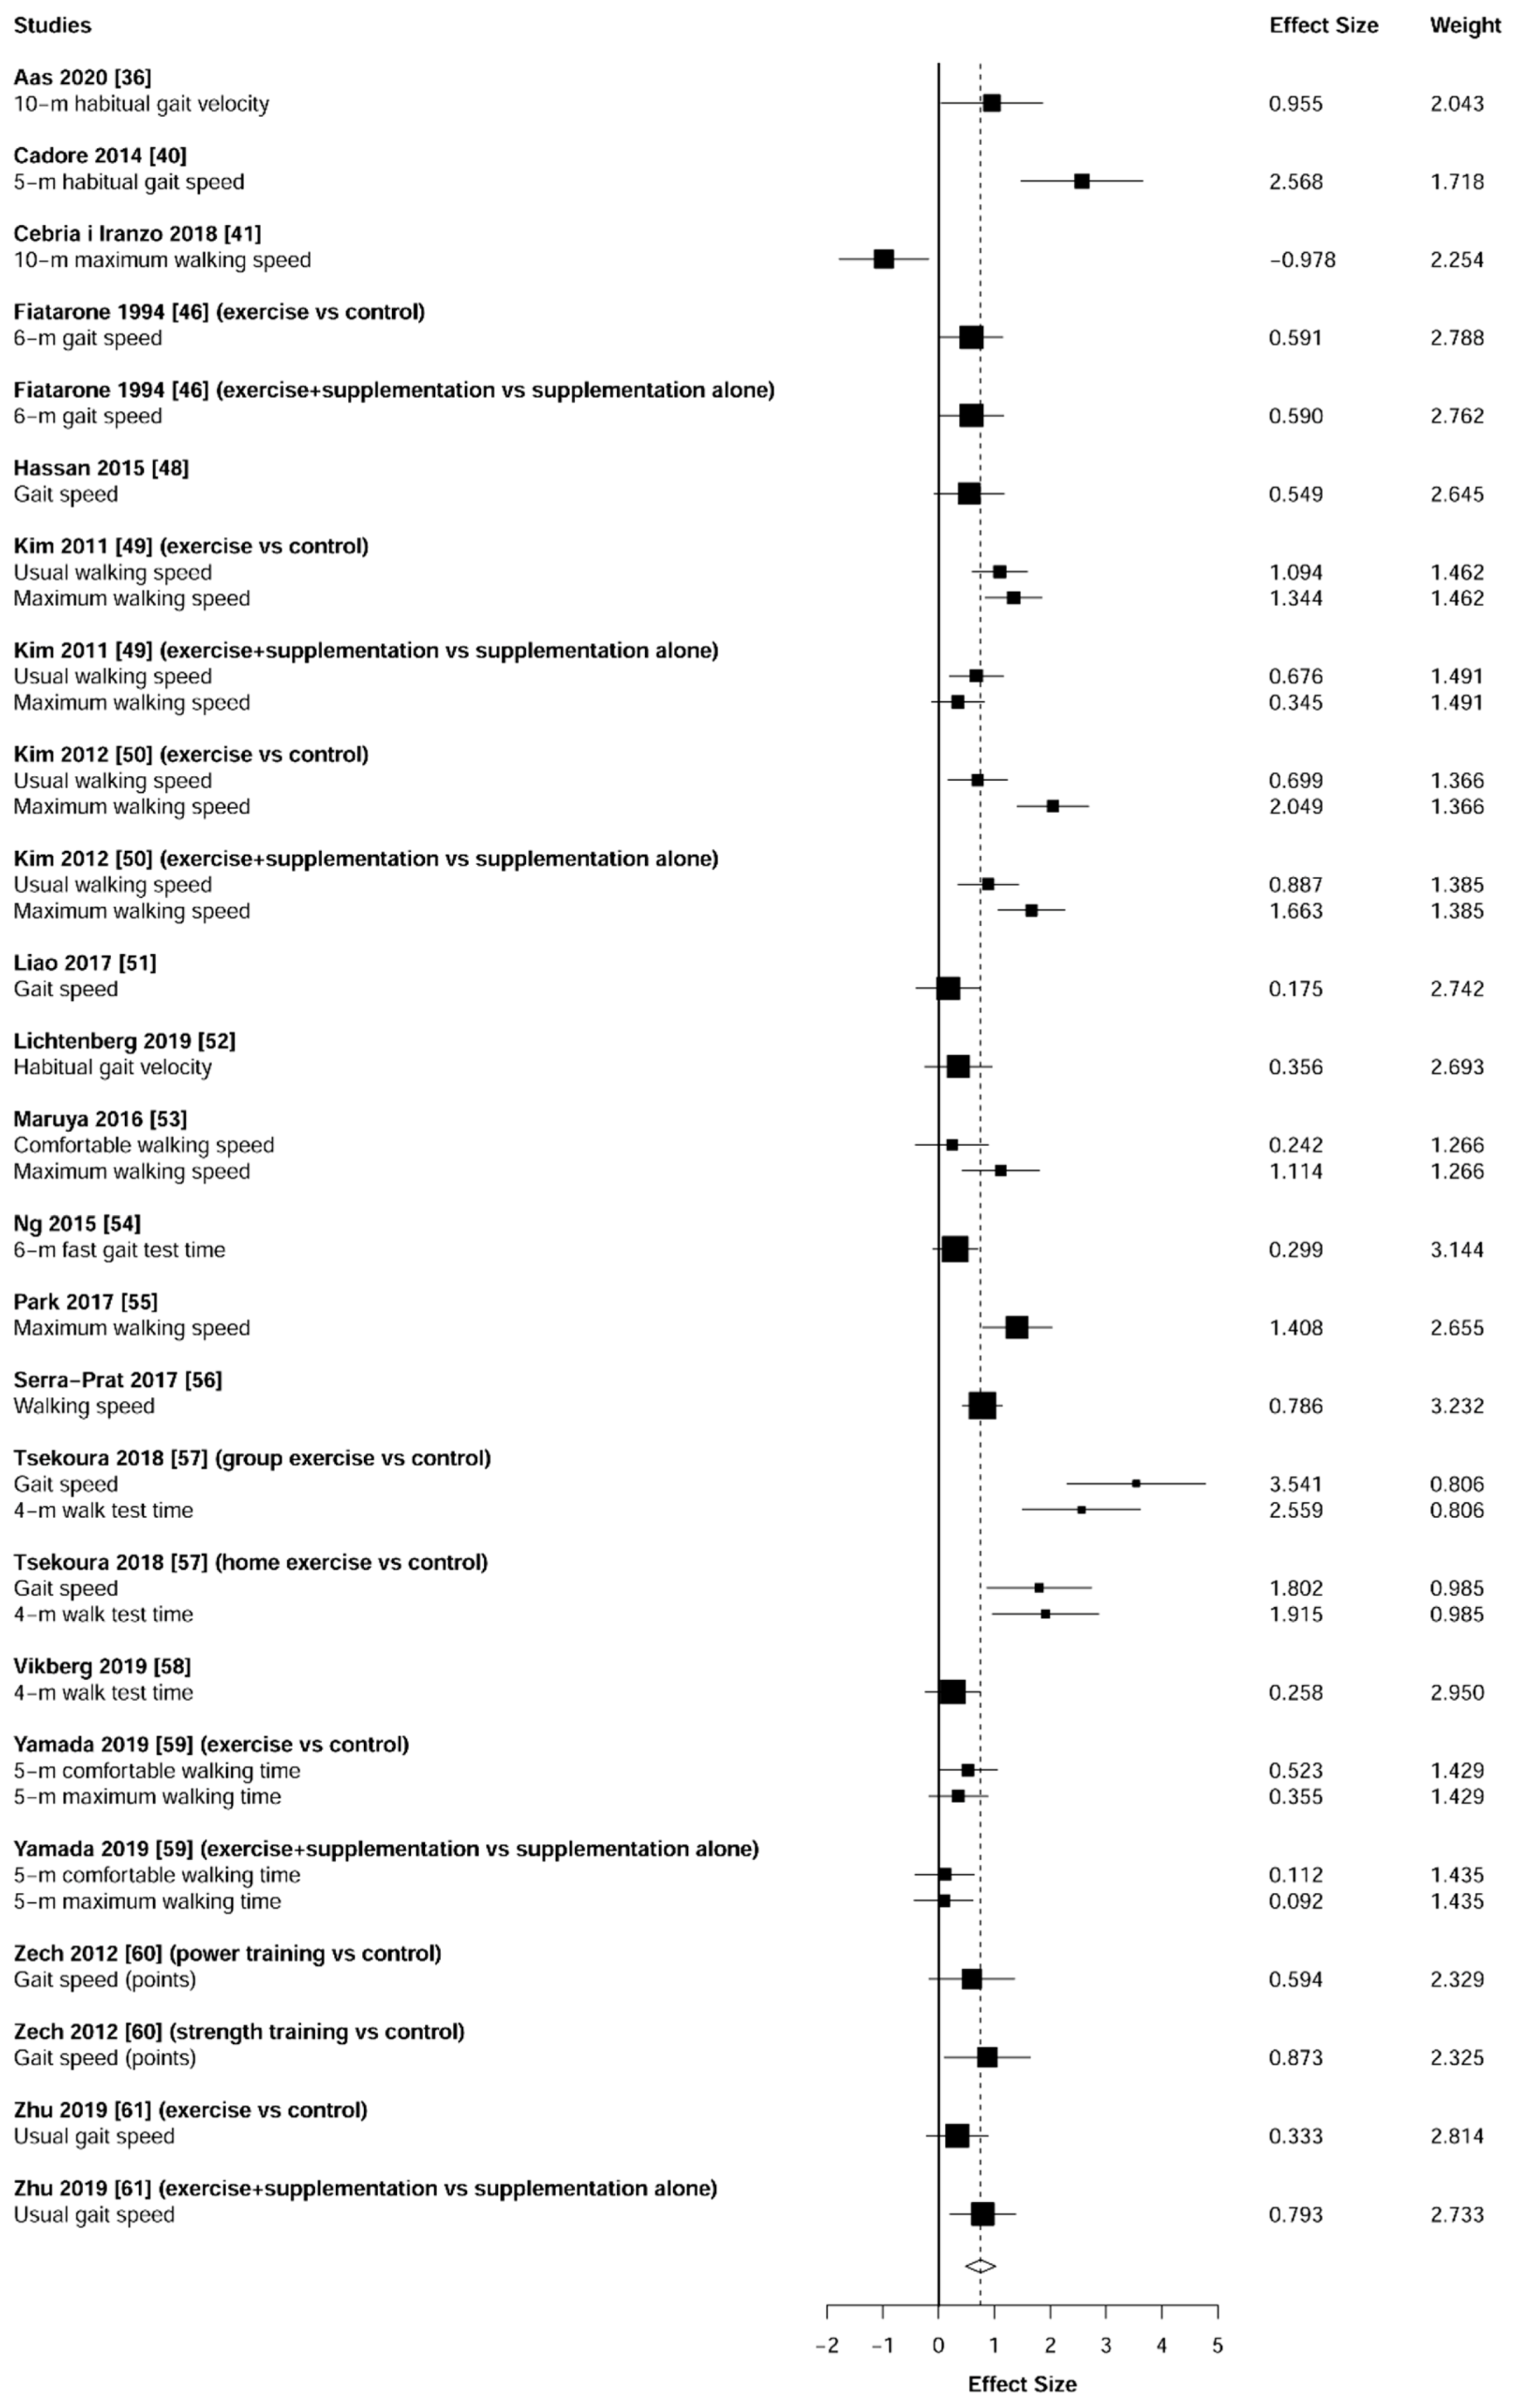
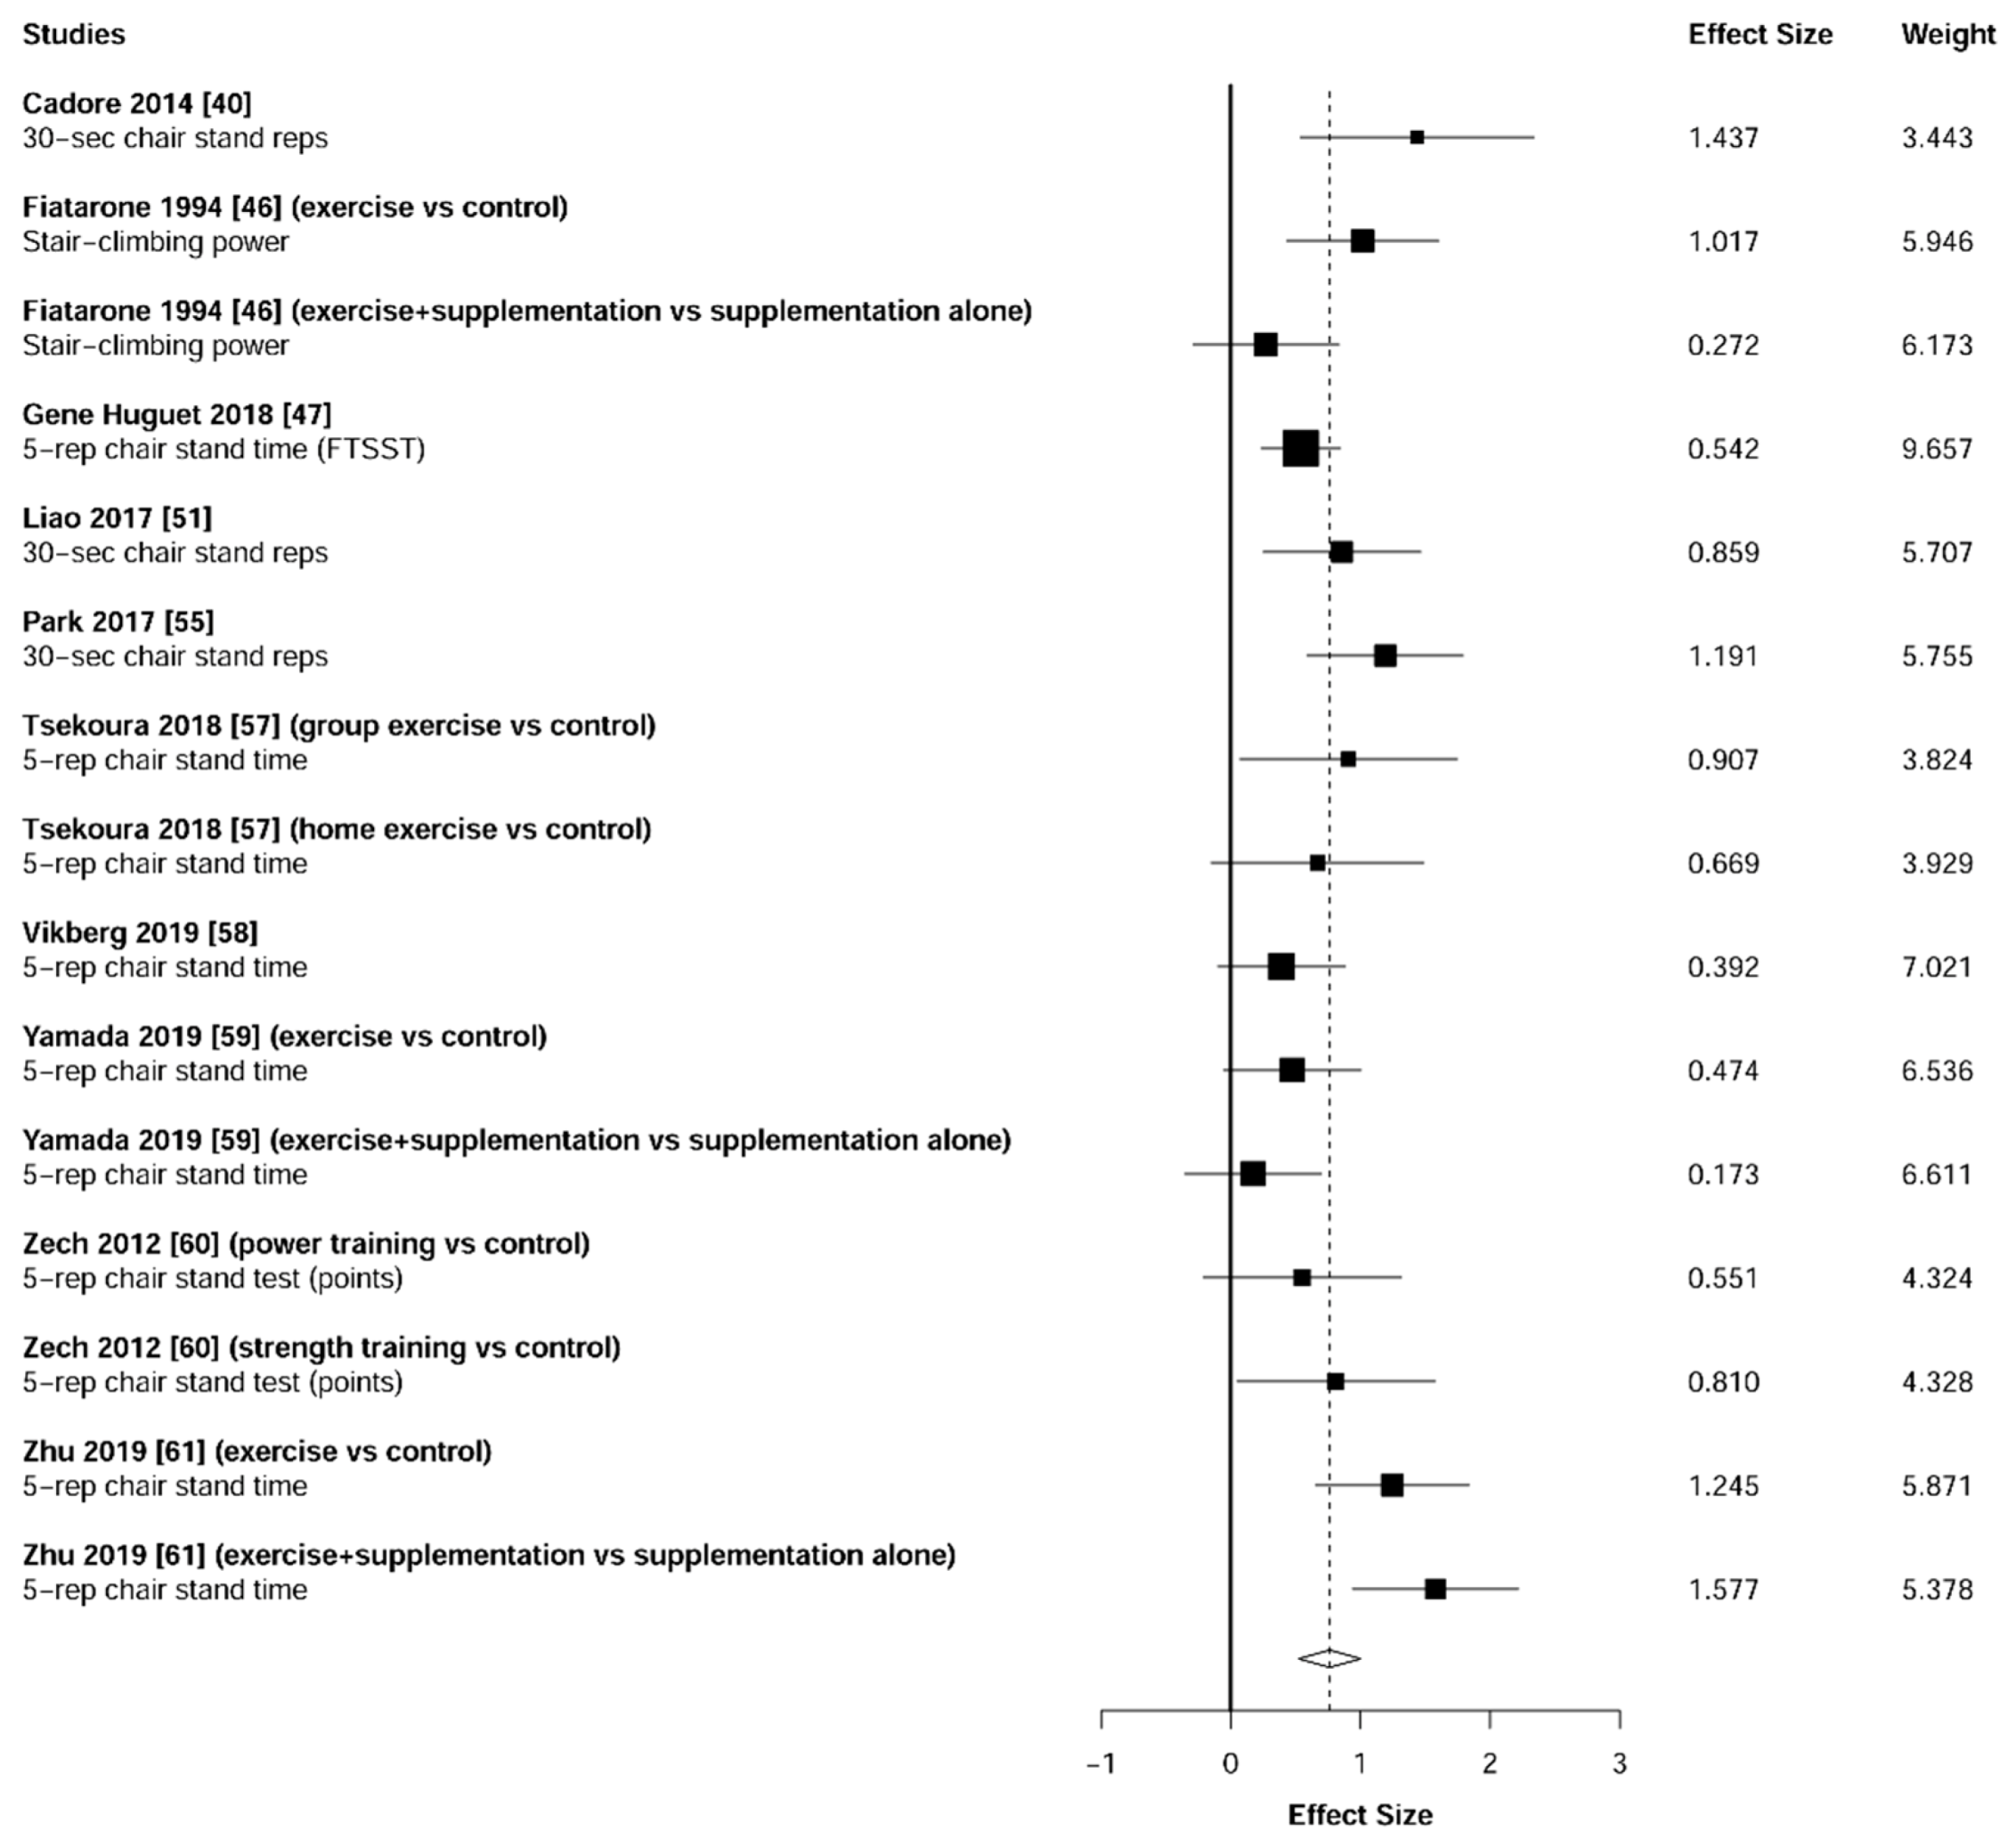
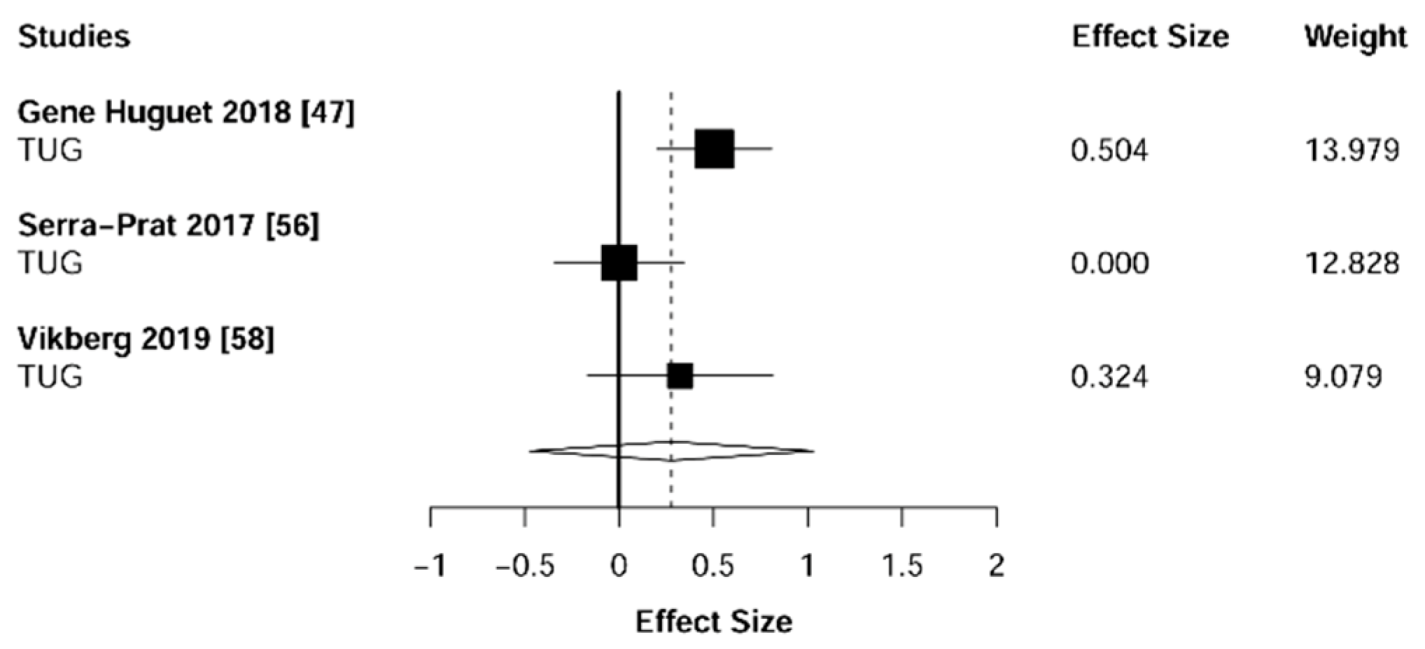
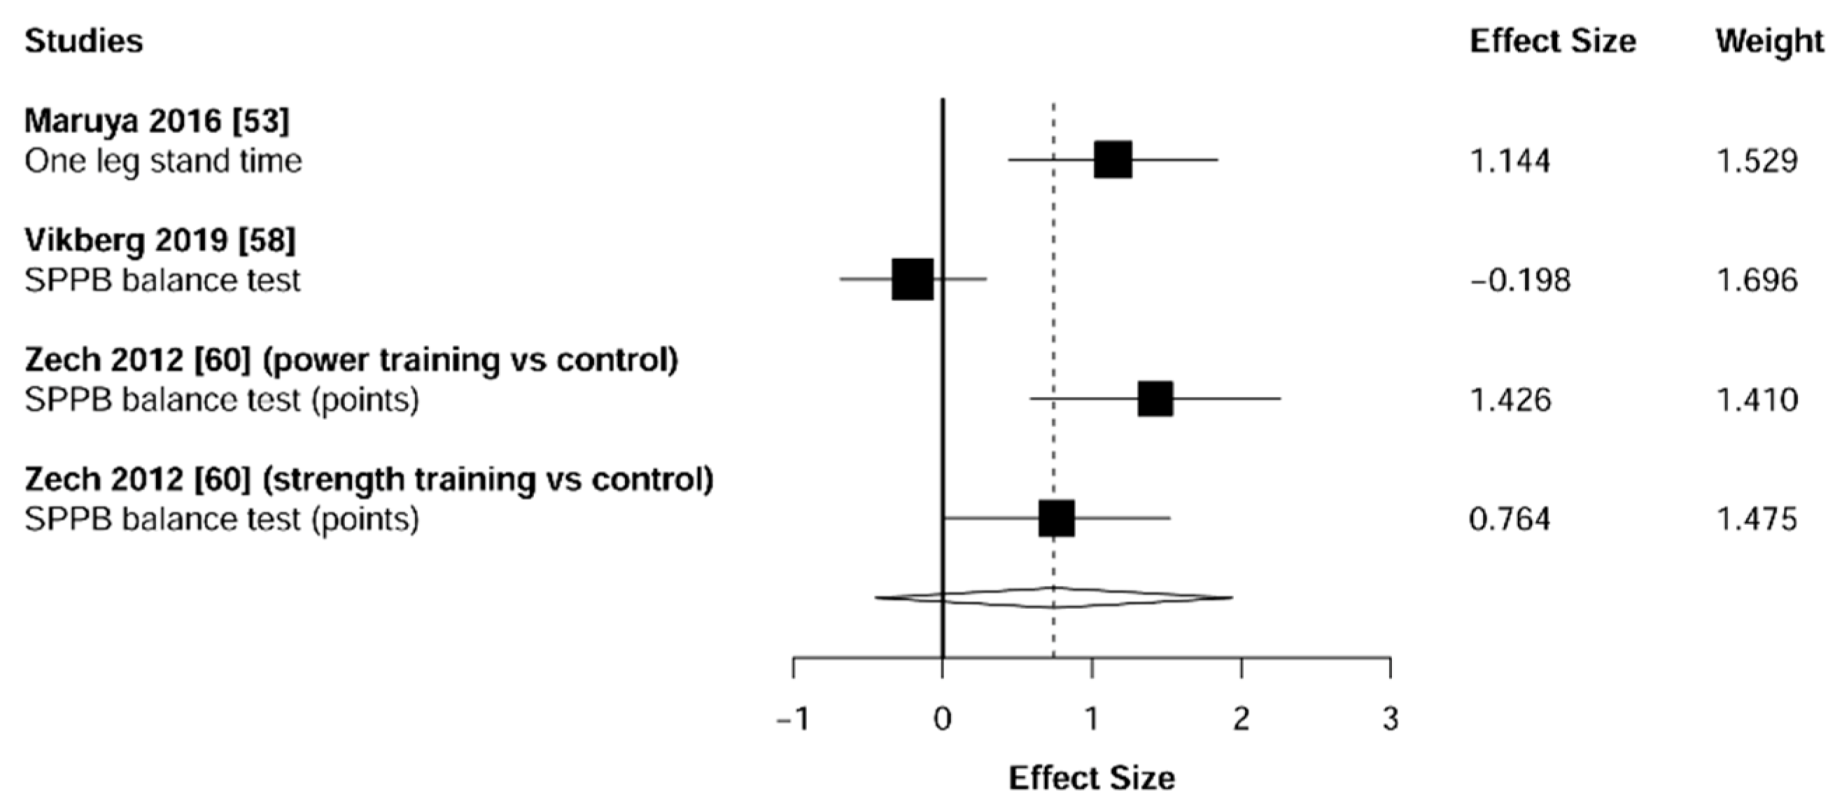
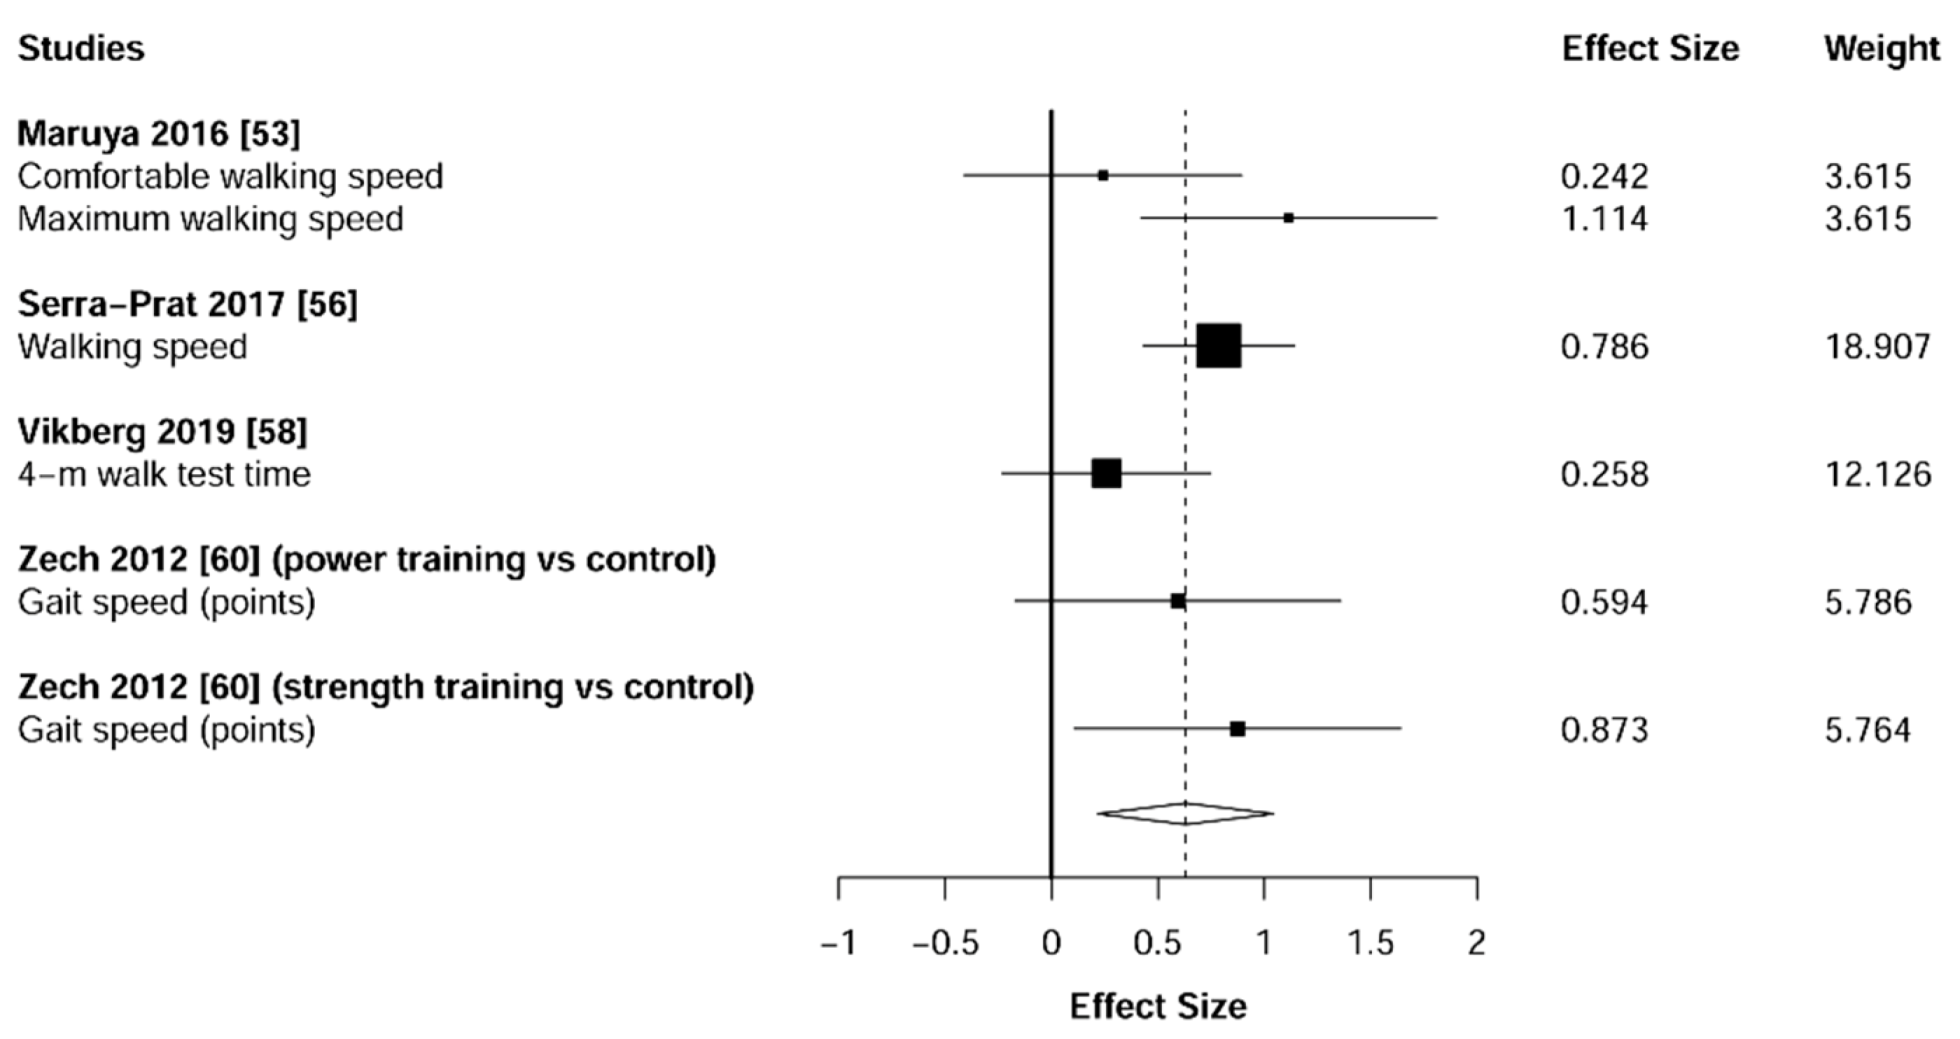

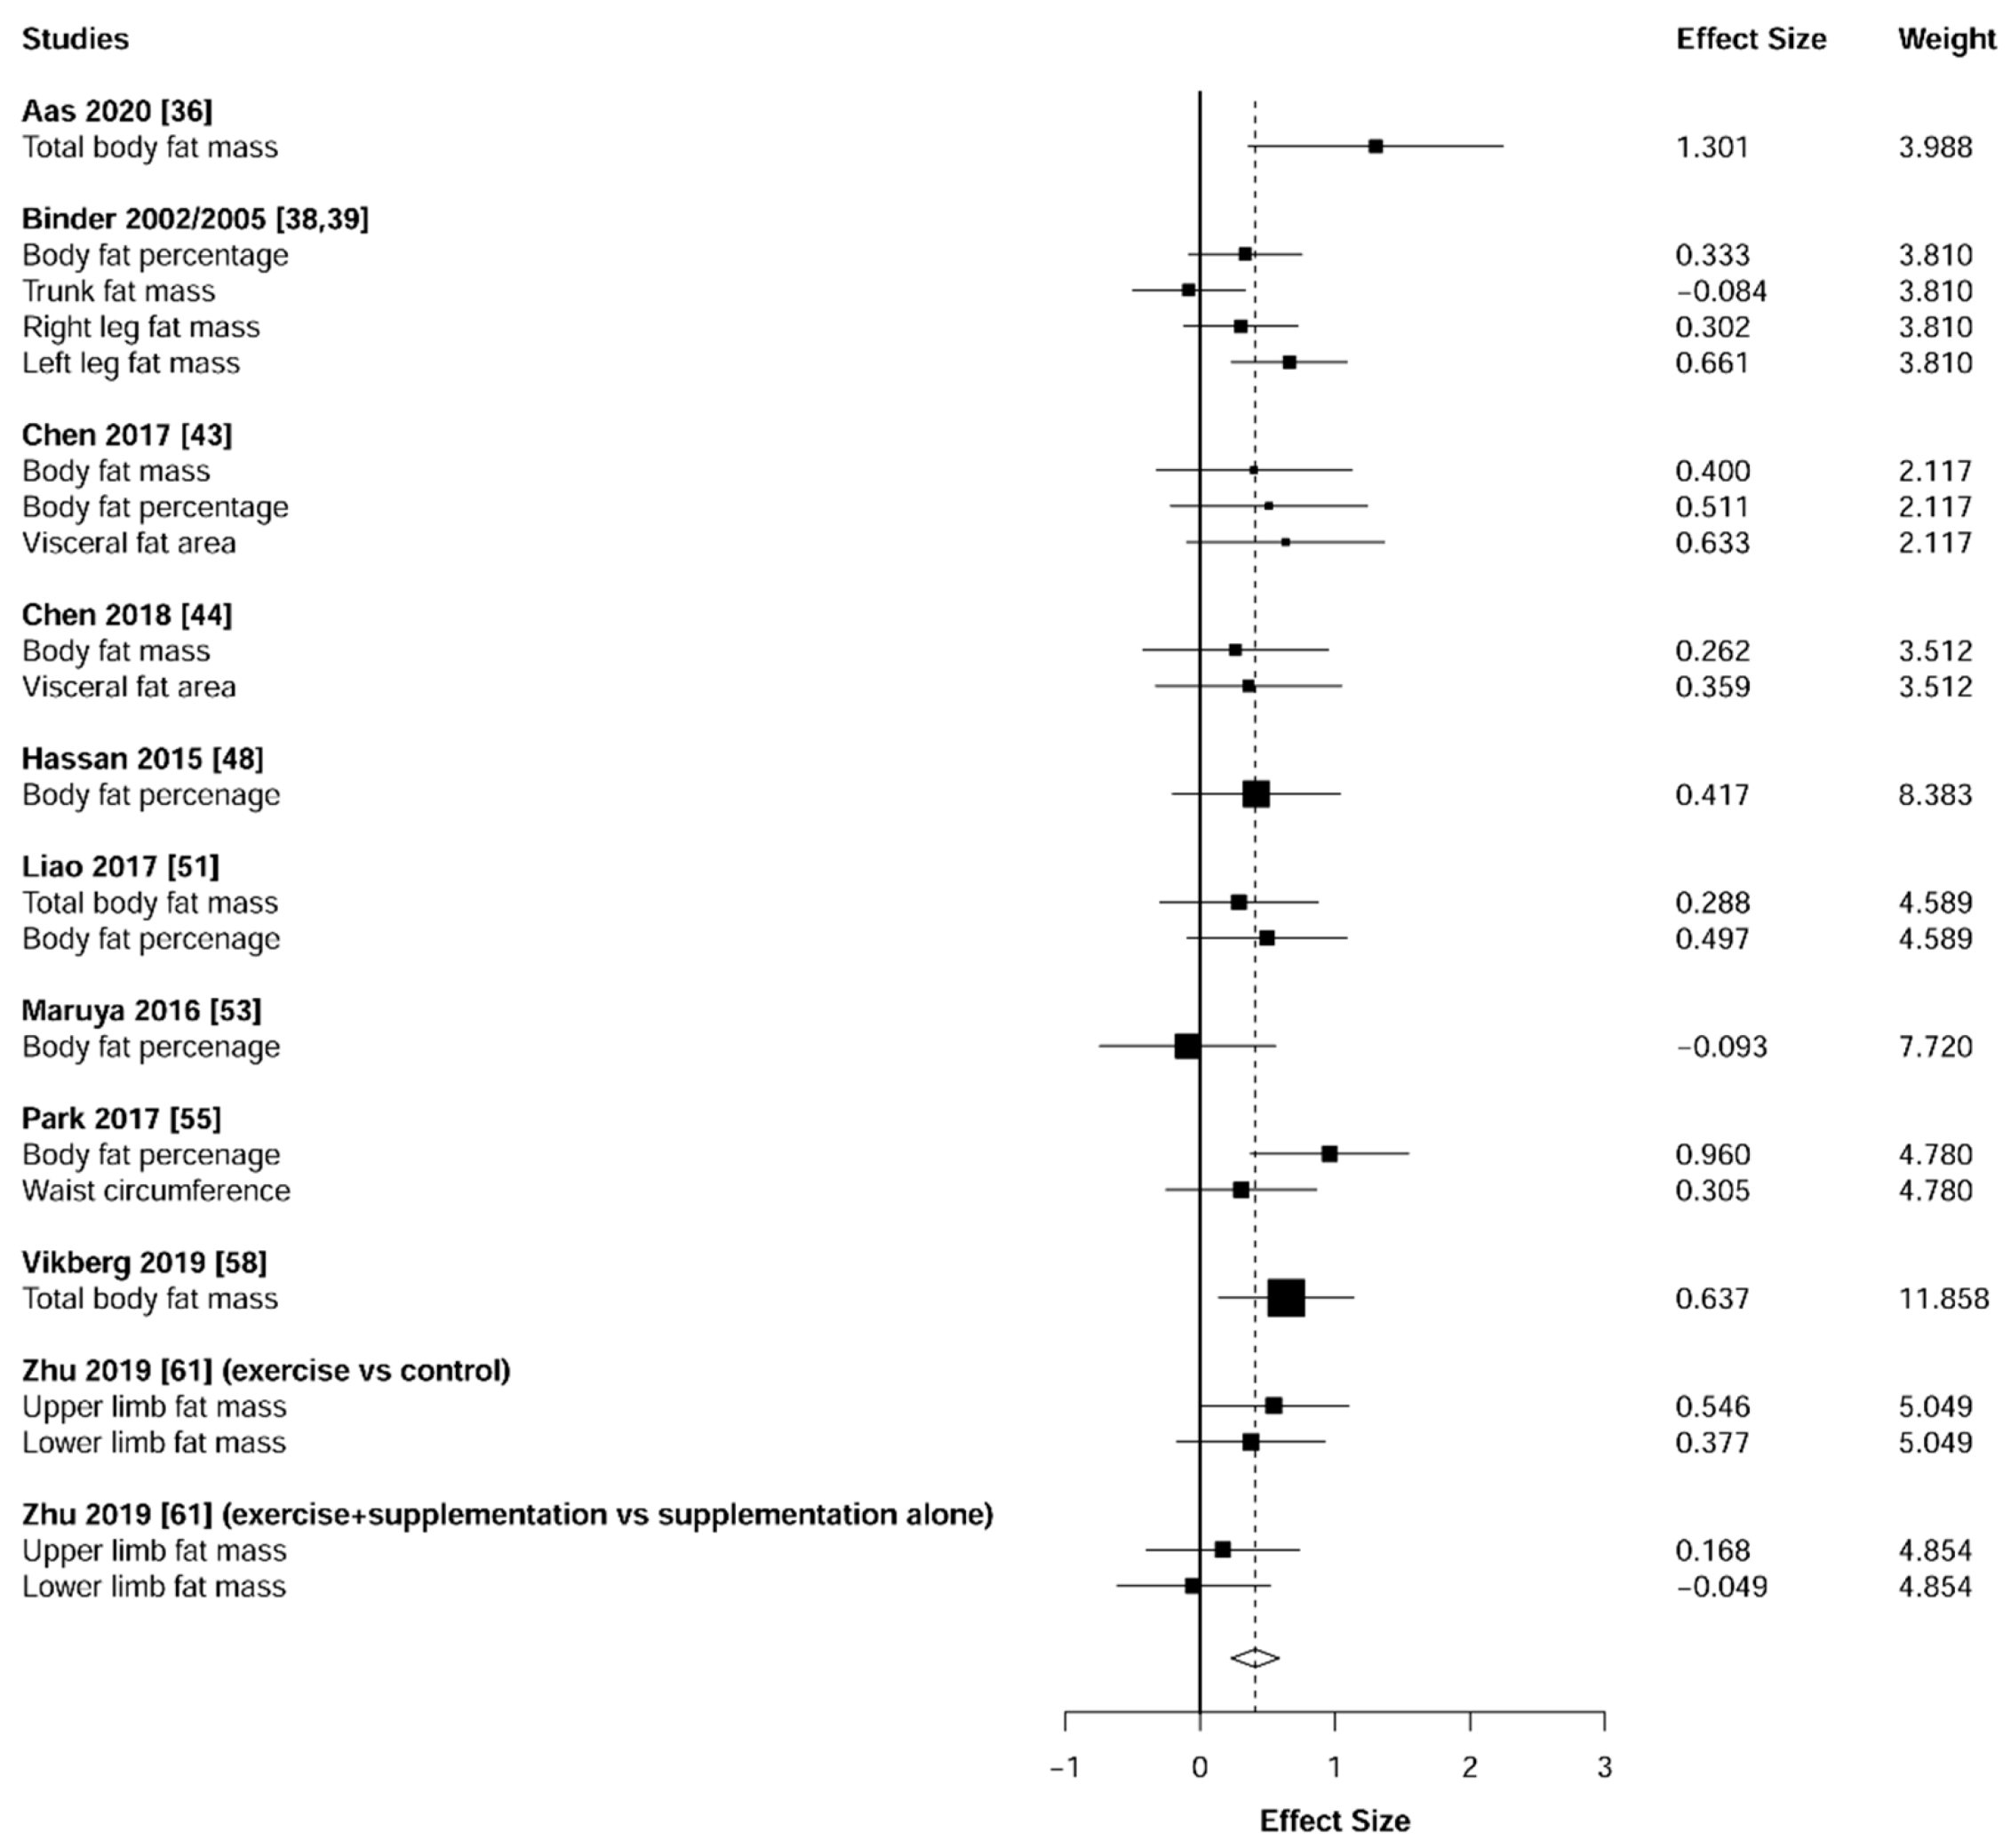
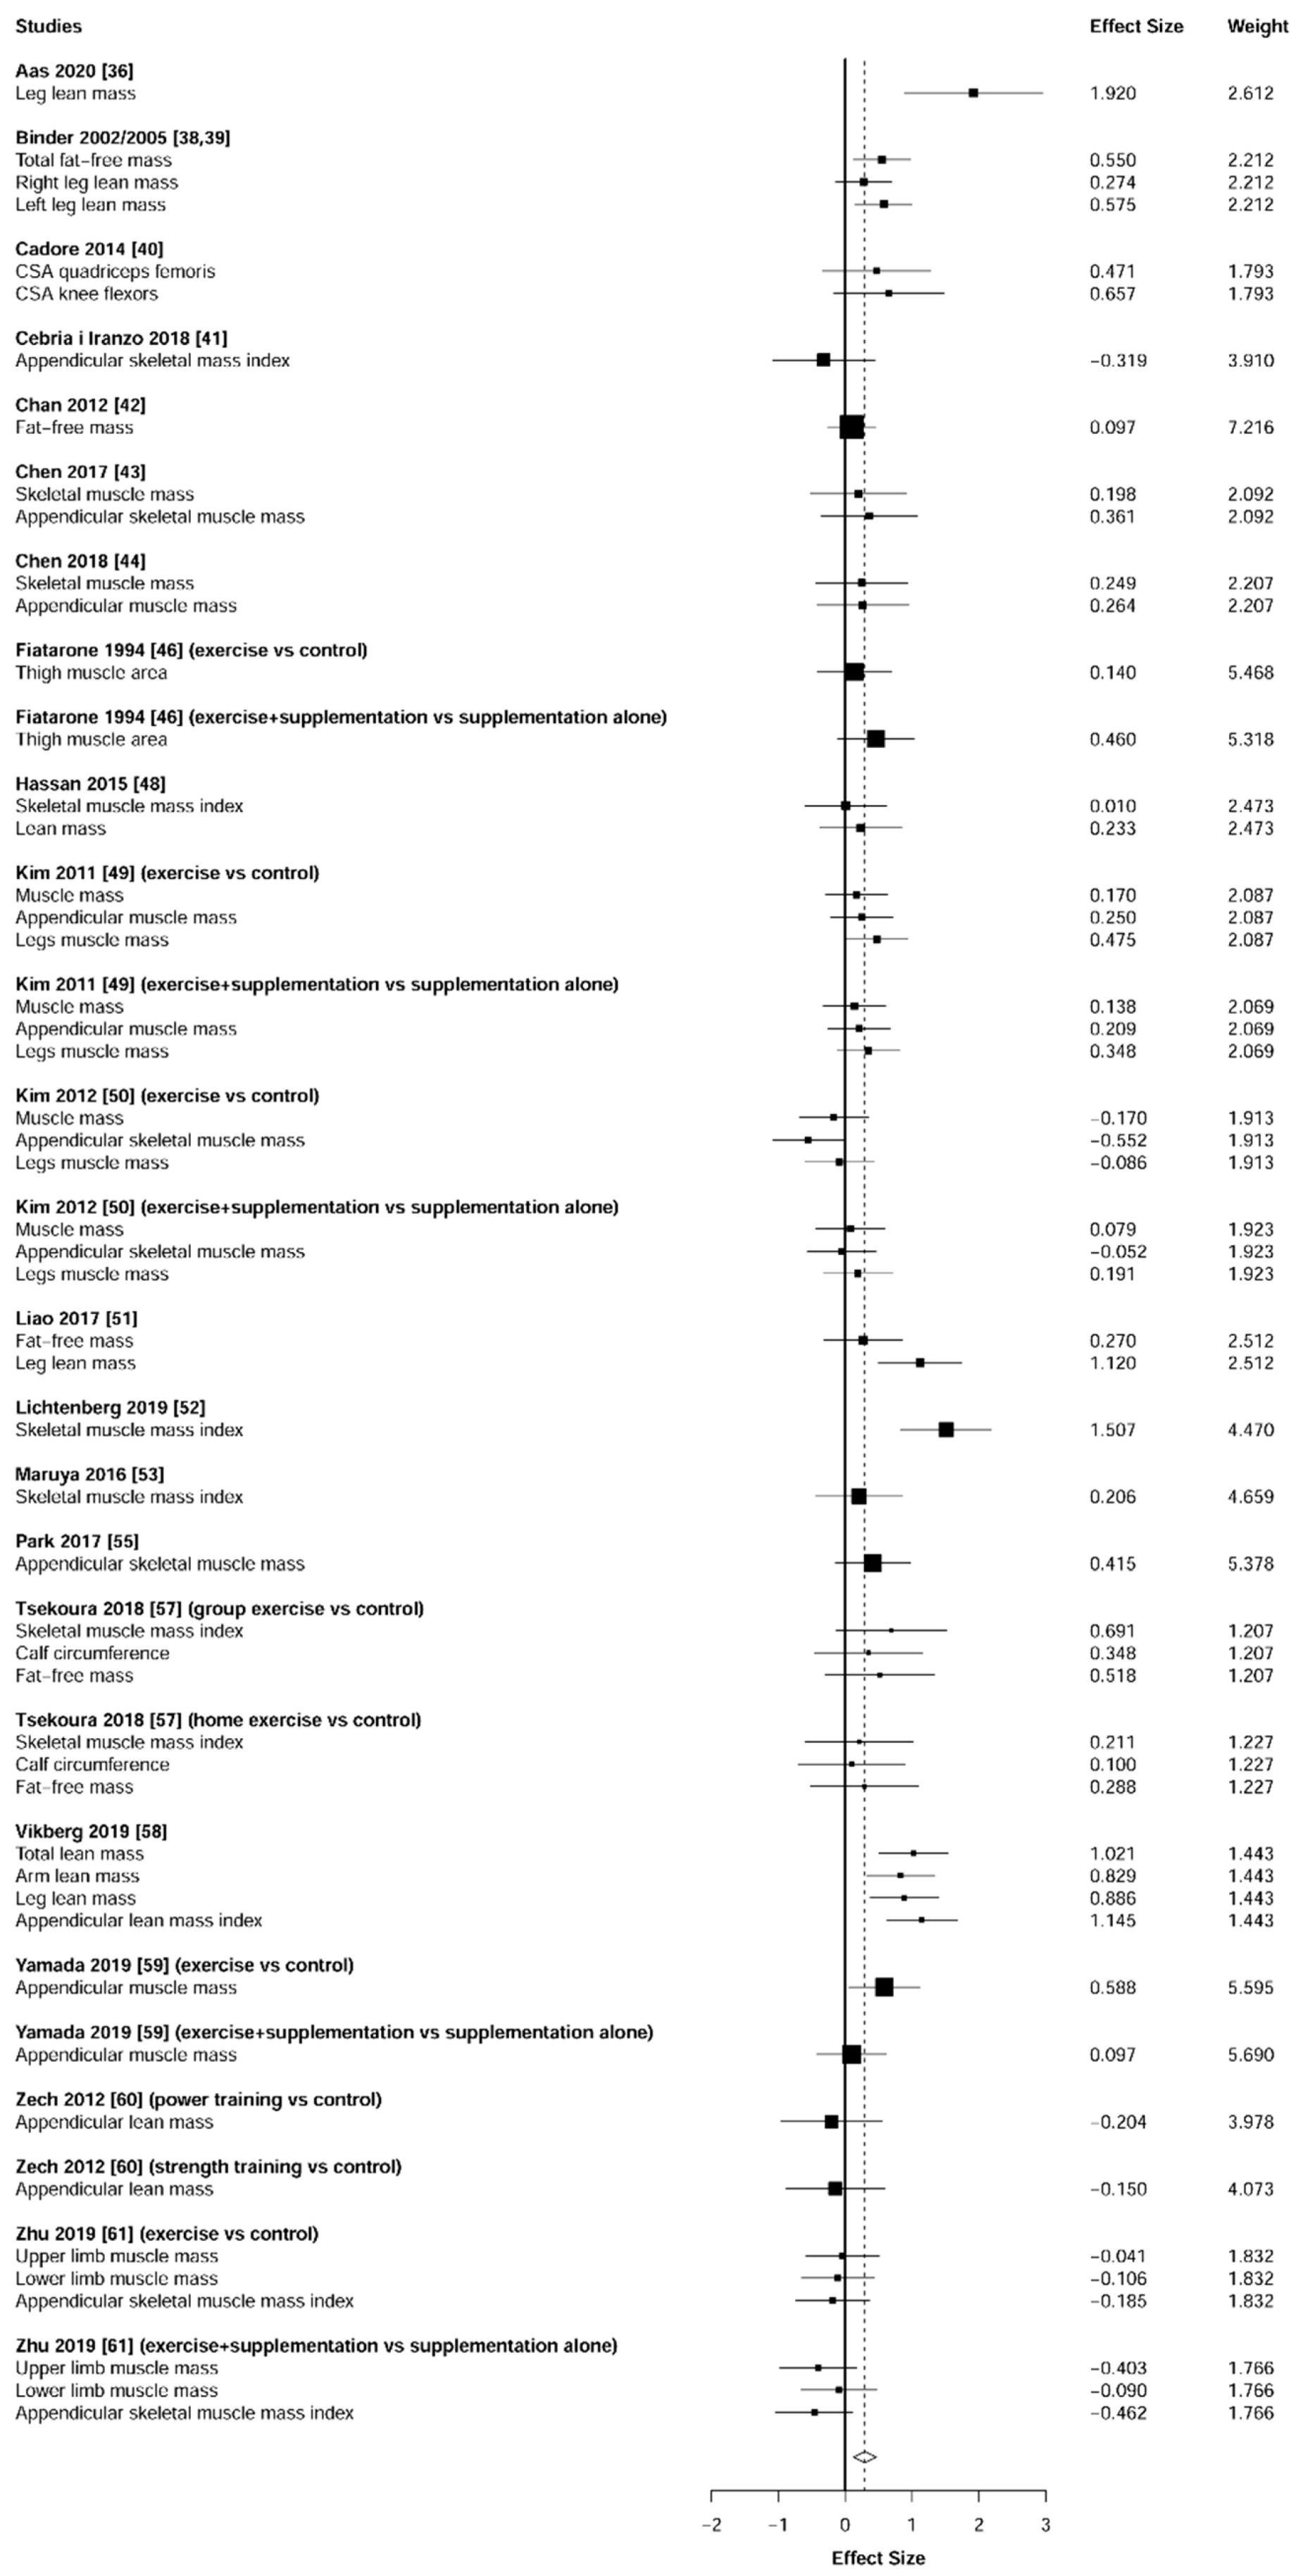

| Study | 1 | 2 | 3 | 4 | 5 | 6 | 7 | 8 | 9 | 10 | 11 | Total |
|---|---|---|---|---|---|---|---|---|---|---|---|---|
| Aas et al. 2019 [36] | 1 | 1 | 1 | 1 | 0 | 0 | 0 | 1 | 1 | 1 | 1 | 8 |
| Bellomo et al. 2013 [37] | 1 | 1 | 1 | 1 | 0 | 0 | 1 | 1 | 1 | 1 | 1 | 9 |
| Binder et al. 2002/2005 [38,39] | 1 | 1 | 1 | 1 | 0 | 1 | 1 | 1 | 1 | 1 | 1 | 10 |
| Cadore et al. 2014 [40] | 1 | 1 | 1 | 1 | 0 | 1 | 1 | 1 | 1 | 1 | 1 | 10 |
| Cebria i Iranzo et al. 2018 [41] | 1 | 1 | 1 | 1 | 0 | 1 | 1 | 1 | 1 | 1 | 1 | 10 |
| Chan et al. 2012 [42] | 1 | 1 | 1 | 1 | 0 | 0 | 1 | 1 | 1 | 1 | 1 | 9 |
| Chen et al. 2017 [43] | 1 | 1 | 1 | 1 | 0 | 1 | 0 | 0 | 1 | 1 | 1 | 8 |
| Chen et al. 2018 [44] | 1 | 1 | 0 | 1 | 0 | 0 | 0 | 1 | 1 | 1 | 1 | 7 |
| Clegg et al. 2014 [45] | 1 | 1 | 1 | 1 | 0 | 0 | 1 | 0 | 1 | 1 | 1 | 9 |
| Fiatarone et al. 1994 [46] | 1 | 1 | 0 | 1 | 0 | 0 | 0 | 1 | 1 | 1 | 1 | 7 |
| Gene Huguet et al. 2018 [47] | 1 | 1 | 0 | 1 | 0 | 0 | 0 | 1 | 1 | 1 | 1 | 7 |
| Hassan et al. 2015 [48] | 1 | 1 | 1 | 1 | 1 | 0 | 0 | 1 | 1 | 1 | 1 | 9 |
| Kim et al. 2011 [49] | 1 | 1 | 1 | 1 | 0 | 1 | 1 | 1 | 1 | 1 | 1 | 10 |
| Kim et al. 2012 [50] | 1 | 1 | 1 | 1 | 0 | 1 | 1 | 1 | 1 | 1 | 1 | 10 |
| Liao et al. 2017 [51] | 1 | 1 | 1 | 1 | 0 | 1 | 0 | 1 | 1 | 1 | 1 | 9 |
| Lichtenberg et al. 2019 [52] | 1 | 1 | 1 | 1 | 0 | 1 | 1 | 1 | 1 | 1 | 1 | 10 |
| Maruya et al. 2016 [53] | 1 | 1 | 0 | 1 | 0 | 0 | 0 | 0 | 1 | 1 | 1 | 6 |
| Ng et al. 2015 [54] | 1 | 1 | 1 | 1 | 0 | 0 | 1 | 1 | 1 | 1 | 1 | 9 |
| Park et al. 2017 [55] | 1 | 1 | 0 | 1 | 1 | 0 | 0 | 1 | 1 | 1 | 1 | 8 |
| Serra-Prat et al. 2017 [56] | 1 | 1 | 1 | 1 | 0 | 0 | 0 | 0 | 1 | 1 | 1 | 7 |
| Tsekoura et al. 2018 [57] | 1 | 1 | 1 | 1 | 0 | 0 | 0 | 1 | 1 | 1 | 1 | 8 |
| Vikberg et al. 2019 [58] | 1 | 1 | 1 | 1 | 0 | 1 | 1 | 1 | 1 | 1 | 1 | 10 |
| Yamada et al. 2019 [59] | 1 | 1 | 1 | 1 | 0 | 0 | 1 | 1 | 1 | 1 | 1 | 9 |
| Zech et al. 2012 [60] | 1 | 1 | 1 | 1 | 0 | 0 | 1 | 1 | 1 | 1 | 1 | 9 |
| Zhu et al. 2019 [61] | 1 | 1 | 1 | 1 | 1 | 1 | 1 | 1 | 1 | 1 | 1 | 11 |
| Study | Sample (n) | Gender (M/F) | Age (year) | Study Area | Duration (weeks) | Intervention | CG |
|---|---|---|---|---|---|---|---|
| Aas et al. 2019 [36] | 22 | 7/15 | 79+ | Norway | 10 | 30 min of heavy-load RT training, leg lean mass assessed by DXA, muscle thickness assessed by ultrasound, isometric and dynamic strength, state of torque development and functional capacity, 3 times a week. | Normal daily activities and dietary habits. |
| Bellomo et al. 2013 [37] | 40 | 10/0 | 64–80 | Italy | 12 | RT with the intensity 60–80% of maximum force on muscle strength and balance confidence, 10–12 repetitions for 3 sets, twice per week. | Habitual activity level concerning diet, social relations and physical activity. The control group received a minimal intervention consisting of information bulletins with general information about the protocol study and test. |
| Binder et al. 2002/2005 [38,39] | 91 (2002) 115 (2005) | 41/50 (2002) 48/67 (2005) | 78+ | USA | 36 | (2002): PRT to increase muscle strength and FFM, 1RM, 2–3 times a week. (2005): 22 exercises that focused on flexibility, balance, coordination, speed of reaction, strength, 65% of 1RM, 1 to 2 sets of 6 to 8 repetitions of knee extension, knee flexion, seated bench press, seated row, leg press, biceps curl, after 4 weeks 3 sets of 8 to 12 repetitions performed at 85% to 100% of 1RM, endurance training using treadmills, stationary bicycles, aerodyne bicycles or rowing machines at 65–70% of VO2peak, 3 times per week. | 9-month-low-intensity home exercise program, 2–3 times per week. The control intervention consisted of flexibility exercises. Participants in the CG attended a 1-hour training session in exercise facility. To enhance adherence, CG attended a monthly exercise class at exercise facility. They performed the exercises for a 3 three-month interval. |
| Cadore et al. 2014 [40] | 24 | 7/17 | 85+ | Spain | 12 | Multicomponent exercise program composed of upper and lower body RT with progressively increased loads (8–10 repetitions, 40–60% of 1RM) with balance and gait retraining, twice per week. | Mobility exercises 30min per day, 4 times per week, small active and passive movements in a form of stretches. |
| Cebrià i Iranzo et al. 2018 [41] | 26 | 9/17 | 81+ | Spain | 12 | RT, appendicular skeletal muscle mass (ASM/height2, ASM/weight, and ASM/BMI), isometric knee extension, arm flexion and handgrip strength, maximal inspiratory and expiratory pressures, and GV pre- and. postintervention, 3 times a week. | Usual care and daily life activities at the nursing home (lying down, sitting and walking short distances between rooms). |
| Chan et al. 2012 [42] | 117 | 48/69 | 65–79 | Taiwan | 48 | RT, dominant leg extension power, 3 times per week. | The educational booklet on frailty, healthy diets, exercise protocols and self-coping strategies-CG was contacted monthly to check on how much they had read it. |
| Chen et al. 2017 [43] | 90 | 10/80 | 65–75 | Taiwan | 12 | RT, 60–70% of 1RM, shoulder presses, biceps curls, triceps curls, bench presses, deadlifts, leg swings, squats, standing rows, unilateral rows split front squats, PRT was used every two weeks, 3 sets of 8–12 repetitions with a 2–3 min rest between sets, twice a week. | Day-to-day lifestyle and dietary habits, prohibited from engaging in any exercises. |
| Chen et al. 2018 [44] | 33 | 0/33 | 65–75 | Taiwan | 12 | PRT, 8–12 repetitions, upper and lower limb training, kettlebell weight training: kettlebell swing, kettlebell deadlift, kettlebell goblet squat, squat lunge, kettlebell row, single arm kettlebell row, biceps curl, triceps extension, two-arm kettlebell military press, Turkish get up and dynamic workout, 60–70% of 1RM, 60 min, twice a week. | Daily lifestyle without participating in any exercise training. |
| Clegg et al. 2014 [45] | 84 | 24/60 | 79 | UK | 12 | RT, TUG to improve mobility and function, 5 days per week. | Usual care from the primary healthcare team. |
| Fiatarone et al. 1994 [46] | 100 | 37/63 | 72–98 | USA | 10 | PRT of the hip and knee extensors, 80% of 1-RM, 3 days per week. | Habitual physical activity. |
| Gené Huguet et al. 2018 [47] | 173 | 62/112 | 80+ | Spain | 24 | RT program of exercises to gain strength, resistance, balance and coordination, 10 repetitions rising to 15 at two months, 3 times per week. | Standard primary healthcare treatment. |
| Hassan et al. 2015 [48] | 42 | no data | 78–86 | Australia | 24 | PRT and balance training, lower and upper-body, and the trunk exercises: elbow and shoulder extension (dip), leg press, knee extension and flexion, hip abduction and adduction, abdominal curl and back extension, 2–3 sets per exercise, 10–15 times, increasing the load and repetitions, twice a week. | Usual care, no exercises. |
| Kim et al. 2011 [49] | 155 | 0/155 | 75+ | Japan | 12 | 60 min of comprehensive physical fitness and muscle mass enhancement training program with PRT, twice per week. | Health education group (once a month for 3 months, a total of three months. The classes focused on cognitive function, osteoporosis and oral hygiene. Regular lifestyle habits and no specific instructions on diet or PA. |
| Kim et al. 2012 [50] | 128 | 0/128 | 75+ | Japan | 12 | 60 min of strengthening exercises with PRT, stretching, balance and gait training of moderate intensity, twice per week. | Health education group (once a month for 3 months, a total of three months. The classes focused on cognitive function, osteoporosis and oral hygiene. Regular lifestyle habits and no specific instructions on diet or PA. |
| Liao et al. 2017 [51] | 46 | 0/46 | 60–80 | Taiwan | 12 | Elastic PRT using Theraband products, 35–40 min, 3 sets and 10 repetitions for each exercise, 3 times per week. | No exercise. |
| Lichtenberg et al. 2019 [52] | 43 | 43/0 | 72+ | Germany | 28 | A consistently supervised single-set training on resistance exercise machines using intensifying strategies, underlying physiological parameters, skeletal muscle mass index (SMI), handgrip-strength and gait velocity, twice per week. | Protein supplementation, no exercise. |
| Maruya et al. 2016 [53] | 52 | 23/29 | 62–75 | Japan | 24 | Home exercise programs, walking with lower limb RT, body composition, muscle strength and physical performance, 20–30 min per day. | Usual daily activities and exercise for 6 months. |
| Ng et al. 2015 [54] | 246 | 95/151 | 65+ | Singapore | 24 | Moderate, gradually increasing intensity, 90 min of duration, included RT integrated with functional tasks and balance training involving functional strength and sensory input, twice a week. | Participants had access to one standard care from health and aged care services that were normally available to older people, including primary and secondary level care from government or private clinics and hospitals, and community-based social, recreational, and day-care rehabilitation services. |
| Park et al. 2017 [55] | 50 | 0/50 | 65+ | South Korea | 24 | RT combined with aerobic exercises, 50–80 min, elastic band exercises (elbow flexion, wrist flexion, shoulder flexion, lateral raise, chest press, revere flies, side band, dead lift, squad, leg press, ankle plantar flexion), with progressive repetitions, 5 times per week. | Usual physical activities during 24 weeks, health and family education conducted twice during the intervention period. |
| Serra-Prat et al. 2017 [56] | 172 | 75/97 | 70+ | Spain | 48 | 30–45 min of aerobic exercises and 20–25 min of RT, strengthening exercises with balance and coordination, 4 times per week. | The usual care and recommendations, no exercise. |
| Tsekoura et al. 2018 [57] | 54 | 7/47 | 65+ | Greece | 24 | 60 min comprehensive progressive group exercise (RT in a progressive sequence, 20 min of balance and gait training exercises, balance exercises), 2 times per week, walk 30–35 min, 3 times per week. | Educational leaflet about sarcopenia with advice on diet, lifestyle and activity. No exercise. |
| Vikberg et al. 2019 [58] | 70 | 32/38 | 70+ | Sweden | 10 | RT programs to increase muscle function and muscle mass using participants’ body weight and suspension bands, 3 times per week. | Usual daily activities, no exercises |
| Yamada et al. 2019 [59] | 112 | 39/73 | 65+ | Japan | 12 | 30 min of bodyweight RT with slow movement speeds, trunk flexion, hip flexion, hip extension, hip abduction, hip adduction, knee extension and ankle plantar flexion, twice per week. | No exercise. |
| Zech et al. 2012 [60] | 69 | no data | 65–94 | Germany | 36 | 20 min of balance exercises and 25 min of muscle strength and muscle power exercises using RT machines, twice a week. | No exercise. |
| Zhu et al. 2019 [61] | 113 | 26/87 | 65+ | China | 24 | 90 min group chair-based RT using Thera-bands, and 20 min aerobic exercises, one-home session weekly, gait speed, twice per week. | Usual physical activities and dietary habits during 6-month study period and were subsequently provided with the same exercise program as the IG. |
| Study | Outcome | Measure | Overall Effect |
|---|---|---|---|
| Aas et al. 2019 [36] | Physical performance, Muscle mass, Muscle strength | SPPB, Leg lean mass, Vastus lateralis thickness, Rectus femoris thickness, Vastus intermedius thickness, KE, 1-RM, Habitual GV, five times chair rise, Stair climbing | ↑ Leg lean mass (kg); ↓ Fat mass (kg); ↑ Vastus lateralis thickness (% change from baseline); ↑ Knee extension 1-RM; ↑ Rectus femoris thickness (% change from baseline); ↑ Vastus intermedius thickness (% change from baseline); ↑ Five times chair rise (% change from baseline); ↑ Stair climbing (% change from baseline); No significant reduction in habitual GS (% change from baseline). |
| Bellomo et al. 2013 [37] | Physical performance, Muscle strength | Leg Extension 90º Isometric Test, Sway area, Ellipse Surface, Length of the half-step, Width of the step, Contact Time | ↑ Right limb Leg Extension 90º Isometric Test in RT group; ↑ Bilateral limb Leg Extension 90º Isometric Test in RT group; ↓ Open eyes Sway area in RT group; ↓ Closed eyes Sway area in RT group; ↓ Open eyes Ellipse Surface in RT group; Non-significant changes in Closed eyes Ellipse Surface in RT group; ↑ Length of the half-step in RT group; ↑ Width of the step in RT group; ↓ Contact Time in RT group. |
| Binder et al. 2002/2005 [38,39] | Muscle strength, Body composition | 1-RM, Physical Performance Test score, VO2peak, Functional Status Questionnaire score (2002).1-RM, VO2peak, ADL, ET, FSQ, total FFM, PBF, trunk fat, right leg lean mass, right leg fat mass, left leg lean mass, left leg fat mass (2005). | ↑ Maximal voluntary force production for knee extension; ↑ Total body FFM in the IG; ↑ Physical Performance Test score in IG and home exercise group; ↑ VO2peak (mL/kg/min) in IG; ↑ Functional Status Questionnaire in IG; ↑ Cybex knee extension 60° (ft/lb) in IG and home exercise group; ↑ Cybex knee flexion 60° (ft/lb) in IG and home exercise group; ↑ Single limb stance time (s) in IG and home exercise group; ↑ Berg Balance Score in IG and home exercise group; Total, trunk, intra-abdominal, and subcutaneous fat mass did not change (2002). ↑ 1.08 ± 11 of change in knee extension 60°/s (ft/lb) in CG; ↑ 5.31 ± 13 of change in knee extension 60°/s (ft/lb) in IG; ↑ 2.11 ± 7 of change in knee extension 60°/s (ft/lb) in CG; ↑ 3.21 ± 8 of change in knee flexion 60°/s (ft/lb) in IG; ↑ 12 ± 10 of change in leg flexion (lb) in IG; ↑ 24 ± 32 of change in leg extension (lb) in IG; ↑23 ± 20 of change in leg press (lb) in IG; ↑ 17 ± 18 of change in seated row in IG; ↑ 95% confidence bounds on the magnitude of improvement in the ET; ↑ 1.0 to 5.2 points for the modified PPT score; ↑ 0.9 to 3.6 mL/kg/min for VO2peak; ↑ 1.6 to 4.9 points for the FSQ score; ↑ 0.0 ± 1.5 of change in total FFM; ↑ −0.4 ± 1.9 of change in PBF (%); ↑ −0.4 ± 1.0 of change in trunk fat (kg); ↑ 0.0 ± 0.3 of change in right leg lean mass (kg); ↑ 0.04 ± 0.2 of change in right leg fat mass (kg); ↓ −0.1 ± 0.4 of change in left leg lean mass (kg); ↑ 0.1 ± 0.3 of change in left leg lean mass (kg) (2005). |
| Cadore et al. 2014 [40] | Muscle strength, Balance, Physical performance | GS, TUG, raise from a chair, Balance, Falls incidence, HGS, Hip flexion strength, KES, Upper-body 1-RM, Lower-body 1-RM, Maximal power at 30% 1-RM, Maximal power at 60% 1-RM | ↓ GS; ↑ TUG (s); ↓ Raise from a chair; ↑ Balance; ↓ Falls incidence; ↑ HGS (N); ↑ Hip flexion strength (N); ↑ KES (N); ↑ Upper-body 1-RM (kg); ↑ Lower-body 1-RM (kg); ↑ Maximal power at 30% 1-RM (W); ↑ Maximal power at 60% 1-RM (W). |
| Cebrià i Iranzo et al. 2018 [41] | Muscle strength, Muscle mass, Body composition | ASM, Quadriceps femoris strength, Biceps brachii strength, HGS, MIP, MEP, MVV, GS | No change in ASM (kg/m2); No change in ASM/BMI (m2); ↑ Quadriceps femoris strength (kg) in RMTG and PMTG; ↑ Biceps brachii strength in PMTG; ↓ Biceps brachii strength in RMTG; ↑ HGS D in RMTG and PMTG; ↑ MIP D in RMTG and PMTG; ↑ MEP in RMTG and PMTG; ↑ MVV in RMTG and PMTG; ↑ GS in RMTG; No change in Gate speed in PMTG. |
| Chan et al. 2012 [42] | Muscle strength, Body composition | Dominant leg extension power, left OLS, FFM, BMI, one leg stand time | ↑ Dominant leg extension power; ↑ Vitamin D level (4.9 ± 7.7); ↓ Osteopenia (74%); ↑ −0.31 ± 1.19 of change in BMI (kg/m2) in IG; ↑ −0.46 ± 1.36 of change in FFM (kg) in IG; ↑ 3.69 ± 9.15 of change in left one leg stand time (s) in IG; ↓ −6.44 ± 10.08 of change in dominant leg extension power (kg) in IG. |
| Chen et al. 2017 [43] | Body composition, Muscle strength, Muscle mass | Weight, SMM, ASM/weight, BFM, BMI, PBF, VFA, HGS, back extensor, KES | ↑ Weight (kg) in CG; ↓ Weight (kg) in IG; ↑ SMM (kg) in IG; ↓ SMM (kg) in CG; ↓ ASM/weight (%) in CG; ↑ ASM/weight (%) in IG; ↓ BFM (kg) in IG; ↑ BFM (kg) in CG; ↓ BMI (kg/m2) in IG; ↑ BMI (kg/m2) in CG; ↓ PBF (%) in IG; ↑ PBF (%) in CG; ↓ VFA (cm2) in IG; ↑ VFA (cm2) in CG; ↑ HGS (kg) in IG; ↓ HGS (kg) in CG; ↑ Back extensor (kg) in IG; ↓ Back extensor (kg) in CG; ↑ KES (kg) in IG; ↓ KES (kg) in CG. |
| Chen et al. 2018 [44] | Body composition, Muscle mass, Muscle strength | Weight, SMM, BFM, VFA, ASM, left HGS, right HGS, BS | ↓ Weight (kg) in IG; ↑ Weight (kg) in CG; ↑ SMM (kg) in IG; ↓ SMM (kg) in CG; ↓ BFM (kg) in IG; ↑ BFM (kg) in CG; ↓ VFA (cm2) in IG; ↑ VFA (cm2) in CG; ↑ ASM (kg) in IG; ↓ ASM (kg) in CG; ↑ left HGS (kg) in IG; ↑ left HGS (kg) in CG; ↑ right HGS (kg) in IG; ↓ right HGS (kg) in CG; ↑ BS in IG; ↓ BS in CG. |
| Clegg et al. 2014 [45] | Muscle strength, Physical performance | TUG | ↑ −10.4 ± 64.0 of change in TUG (s) in IG; ↑ −39.1 ± 90.6 of change in TUG (s) in CG. |
| Fiatarone et al. 1994 [46] | Muscle strength, Body composition | GV, SCPT, CSA, weight, thigh-muscle area (cm2) | ↑ GV (11.8 ± 3.8%); ↑ Right knee strength (kg) (4.9 ± 0.6%) in IG; ↑ Left knee strength (kg) (5.2 ± 0.6%) in IG; ↑ Right hip (kg) (8.8 ± 1.2%) in IG; ↑ Left hip (kg) (8.1 ± 1.0%) in IG; ↑ Right leg press (kg) (8.3 ± 2.9%) in IG; ↑ Left leg press (kg) (9.3 ± 2.1%) in IG; ↑ Weight (kg) (0.2 ± 0.4%) in IG; ↑Thigh-muscle area (cm2) (0.9 ± 1.7%) in IG; ↑ SCPT (28.4 ± 6.6%); ↑ CSA (2.7 ± 1.8%) in IG; ↓ CSA (1.8 ± 2.0%) in CG. |
| Gené Huguet et al. 2018 [47] | Muscle strength, Physical performance | TUG, FTSST | ↓ Frailty (95%CI); ↑ Reversion to robustness (14.1%); ↑ Quality of life; ↑ Functional mobility (FTSST) in CG and IG; ↑ TUG in IG. |
| Hassan et al. 2015 [48] | Body composition, Muscle strength, Muscle mass, Physical performance | Weight, BF, BMI, SMMI, Lean mass, HGS, GS | ↓ Weight (kg) in IG; ↓ Weight (kg) in CG; ↓ BF (%) in IG; ↑ BF (%) in CG; ↓ BMI (kg/m2) in IG; ↓ BMI (kg/m2) in CG; No significant difference in SMMI (kg/m2) in IG; ↓ SMMI (kg/m2) in CG; ↑ Lean mass (kg) in IG; ↓ Lean mass (kg) in CG; ↑ HGS (kg) in IG; ↓ HGS (kg) in CG; ↑ GS (m/s) in IG; ↓ GS (m/s) in CG. |
| Kim et al. 2011 [49] | Muscle strength, Physical performance, Muscle mass | Leg muscle mass, Usual WS, KES | ↑ Legs muscle mass (kg) in exercise group, home exercise group and exercise + amino acid supplementation group; ↑ Usual WS (m/s) in exercise group, home exercise group, exercise + amino acid supplementation group and amino acid supplementation group; ↑ KES (Nm/kg) in exercise group and exercise + amino acid supplementation group; ↓ Maximal walking speed (m/s) in exercise group, home exercise group, exercise + amino acid supplementation group and amino acid supplementation group; ↑ Appendicular muscle mass (kg) in exercise group, exercise + amino acid supplementation group and amino acid supplementation group; ↑ Muscle mass (kg) in exercise group, home exercise group, exercise + amino acid supplementation group and amino acid supplementation group. |
| Kim et al. 2012 [50] | Muscle strength, Physical performance, Muscle mass | Muscle mass, Legs muscle mass, ASM, HGS, Usual walking speed, Maximum walking speed, TUG, KES | ↓ Muscle mass (kg) in home exercise group; ↑ Legs muscle mass (kg) in exercise group, home exercise group and exercise + tea catechin supplementation group; ↓ ASM (kg) in home exercise group; ↑ Grip strength (kg) in exercise group, exercise + tea catechin supplementation group and tea catechin supplementation group; ↑ Usual walking speed (m/s) in exercise group and exercise + tea catechin supplementation group; ↑ Maximum walking speed (m/s) in exercise group and exercise + tea catechin supplementation group;↑ TUG (s) in exercise group, exercise + tea catechin supplementation group and tea catechin supplementation group; ↓ KES(Nm) in exercise group, home exercise group, exercise + tea catechin supplementation group and tea catechin supplementation group. |
| Liao et al. 2017 [51] | Body composition, Muscle strength, Physical performance, Muscle masss, Muscle quality | FFM, LLM, TFM, PBF, SLS, GS, TUG, TCR, HGS, LE, UE, LE | ↑ FFM (kg) in IG; ↓ FFM (kg) in CG; ↑ LLM (kg) in IG; ↓ LLM (kg) in CG; ↓ TFM (kg) in IG; ↑ TFM (kg) in CG; ↓ PBF (%) in IG; ↑ PBF (%) in CG; ↑ SLS (s) in IG; ↓ SLS (s) in CG; ↑ GS (m/s) in IG; ↓ GS (m/s) in CG; ↑ TUG (s) in IG;↓ TUG (s) in CG; ↑ TCR (rep) in IG; ↑ TCR (rep) in CG; ↑ HGS (kg) in IG; ↑ HGS (kg) in CG; ↑ LE (N) in IG; ↓ LE (N) in CG; ↑ UE (kg/kg) in IG; ↓ UE (kg/kg) in CG; ↑ LE (N/kg) in IG; ↓ LE (N/kg) in CG. |
| Lichtenberg et al. 2019 [52] | Muscle mass, Muscle strength, Physical performance | Muscle mass, Habitual GV, HGS | ↑ Skeletal muscle mass index (SMI) (kg/m2) in HI-RT; Skeletal muscle mass index (SMI) (kg/m2) in CG; ↑ Habitual GV (m/s) in HI-RT; ↓ Habitual GV (m/s) in CG); ↑ HGS (kg) in HI-RT; ↓ HGS (kg) in CG). |
| Maruya et al. 2016 [53] | Body composition, Muscle strength Physical performance | SMMI, HGS, WS, KES, SLS,%BF | ↑ SMI (kg/m2) in IG; ↑ HGS (kg) in IG; ↓%BF (%) in IG; ↓ WS (comfortable) (m/s) in IG; ↑ WS (maximum) (m/s) in IG; ↑ KES (Nm/kg) in IG;↑ SLS (s) in IG. |
| Ng et al. 2015 [54] | Body composition, Muscle strength, Physical performance | BMI, KES, GS, Physical activity, Energy, IADL-ADL dependency | ↓ BMI (mean change −0.01 in IG); ↑ KES (kg) (mean change 1.83 in IG); ↑ KES (kg) (mean change 1.13 in CG); ↑ GS (s) (mean change −1.29 in IG and −0.56 in CG); ↑ Physical activity (mean change 23.2 in IG and 8.02 in CG); ↑ Energy (mean change 0.96 in IG and 0.59 in CG); ↑ IADL-ADL dependency (%). |
| Park et al. 2017 [55] | Body composition, Muscle strength, Muscle mass, Physical performance | PBF, waist circumference, ASM, left HGS, right HGS, Chair stand test, sit and reach, MWS, two-minute step | ↓ PBF (%) in IG; ↑ PBF (%) in CG; ↓ Waist circumference (cm) in IG; ↑ Waist circumference (cm) in CG; ↑ ASM (kg) in IG; ↓ ASM (kg) in CG; ↑ Left HGS (kg) in IG; ↓ Left HGS (kg) in CG; ↑ Right HGS (kg) in IG; ↓ Right HGS (kg) in CG; ↑ Chair stand test (rep/30s) in IG; ↓ Char stand test (rep/30s) in CG; ↑ Sit and reach (cm) in IG; ↓ Sit and reach (cm) in CG; ↑ MSW (m/s) in IG; ↓ MSW (m/s) in CG; ↑ Two-minute step (rep) in IG; ↓ Two-minute step (rep) in CG. |
| Serra-Prat et al. 2017 [56] | Body composition, Muscle strength, Physical performance | BMI, GS, TUG, HGS, WS | ↑ BMI in women 0,05 (−0,66 to 0,75); ↓ BMI in men −0,46 (−1,20 to 0,27); ↑ Outdoor walking (h/day) (1.0 ± 0.6) in IG; ↑ WS (m/s) (1.0 ± 0.2) in IG; ↑ GS (m/s) −0,35 (-0,77 to 0,08); ↑ TUG (s) −0,04 (−0,64 to 0,57);↑ HGS (kg) in men 1,17 (−0,95 to 3,29); ↓ HGS (kg) in women −0,58 (−2,41 to 1,26). |
| Tsekoura et al. 2018 [57] | Body composition, Muscle mass, Muscle strength, Physical performance | BMI, SMMI, TUG, 4 m test, GS, Chair stand test, HGS, FFM, Calf circumference, Isokinetic measurements | ↓ BMI (kg/m2) in IG; ↑ BMI (kg/m2) in HE; ↑ FFM in IG; ↓ FFM in HE; ↑ SMI (kg/m2) in IG; ↑ SMI (kg/m2) in HE; ↑ Calf circumference (cm) in IG; ↑ Calf circumference (cm) in IG; ↑ TUG (s) in IG; ↑ TUG (s) in HE; ↑ 4 m test (s) in IG; ↑ 4 m test (s) in HE; ↑ GS (m/s2) in IG; ↑ GS (m/s2) in HE; ↓ Chair stand test (s) in IG; ↓ Chair stand test (s) in HE; ↑ HGS (kg) in IG; ↑ HGS (kg) in HE; ↑ Right knee extension 90 (Nm/kg) in IG; ↑ Right knee extension 90 (Nm/kg) in HE; ↑ Right knee extension 180 (Nm/kg) in IG; ↓ Right knee extension 180 (Nm/kg) in HE; ↑ Right knee flexion 90 (Nm/kg) in IG; ↑ Right knee flexion 90 (Nm/kg) in HE; ↑ Right knee flexion 180 (Nm/kg) in IG; ↑ Right knee flexion 180 (Nm/kg) in HE; ↑ Left knee extension 90 (Nm/kg) in IG; ↑ Left knee extension 90 (Nm/kg) in HE; ↑ Left knee extension 180 (Nm/kg) in IG; ↑ Left knee extension 180 (Nm/kg) in HE; ↑ Left knee flexion 90 (Nm/kg) in IG; ↑ Left knee flexion 90 (Nm/kg) in HE; ↑ Left knee flexion 180 (Nm/kg) in IG; ↑ Left knee flexion 180 (Nm/kg) in HE. |
| Vikberg et al. 2019 [58] | Muscle strength, Muscle mass, Body composition, Physical performance | SPBB, TUG, HGS, DXA measurement | ↑ Walk; ↑ Sit to stand; No change in balance; ↑ TUG; ↑ Handgrip strength; ↓ Total fat mass (kg); ↑ Total lean mass (kg); ↑ Arm lean mass (kg); ↑ Leg lean mass (kg); ↑ ALMI. |
| Yamada et al. 2019 [59] | Muscle mass, Physical performance | Knee extension, ASM, Echo intensity for rectus femoris, Echo intensity for vastus intermedius, Comfortable walking time, Maximum walking time, OLS, Five chair stands time, HGS | ↑ Knee extension (Nm) (6.76 ± 11.04) in exercise + nutrition group and (0.85 ± 8.98) in exercise group; ↑ ASM (0.07 ± 1.11) in exercise group; Non-significant change in ASM (0.00 ± 1.29) in exercise + nutrition group; ↑ Echo intensity for rectus femoris (−8.47 ± 13.20) in exercise + nutrition group and (5.29 ± 14.12) in exercise group; ↑ Echo intensity for vastus intermedius (1.37 ± 14.13) in exercise + nutrition group and (5.86 ± 13.34) in exercise group; ↓ Comfortable walking time (s) (−0.82 ± 1.52) in exercise + nutrition group and (−0.90 ± 2.31) in exercise group; ↓ Maximum walking time (s) (−0.72 ± 1.12) in exercise + nutrition group and (−0.30 ± 1.76) in exercise group; ↑ OLS (s) (1.43 ± 4.64) in exercise + nutrition group and (0.60 ± 10.10) in exercise group; ↓ Five chair stands time (s) (−1.63 ± 3.69) in exercise + nutrition group, (−0.87 ± 3.95) in exercise group; ↓ HGS (kg) in exercise group (–0.05 ± 2.27); ↑ HGS (kg) in exercise + nutrition group (0.77 ± 1.80). |
| Zech et al. 2012 [60] | Body composition, Muscle strength, Physical performance | BMI, Mass, SPPB, Balance, GS, Chair rise, ALM, SF-LLFDI, Power | ↓ BMI (kg/m2) 28.7 ± 4.1 in IG; ↑ BMI (kg/m2) 28.5 ± 4.0 in CG; ↓ Mass (kg) 78.0 ± 10.0 in IG and 75.8 ± 13.5 in CG; ↑ SPPB (pt) 9.7 ± 2.2 in IG; ↓ SPPB (pt) 9.7 ± 2.1 in CG; ↑ Balance (pt) 2.8 ± 1.3 in IG; ↓ Balance (pt) 2.8 ± 1.1 in CG; ↑ GS (pt) 3.7 ± 0.6 in IG; ↑ GS (pt) 3.7 ± 0.6 in CG; ↑ Chair rise (pt) 3.3 ± 1.0 in IG; ↑ Chair rise (pt) 3.1 ± 1.2 in CG; ↑ aLM (kg) 18.0 ± 3.3 in IG and 17.5 ± 2.6 in CG; ↑ SF-LLFDI (pt) in IG; ↓ SF-LLFDI (pt) in CG; ↓ Power (W) in IG and CG. |
| Zhu et al. 2019 [61] | Body composition, Muscle strength, Physical performance | GS, Upper limb fat mass, Lower limb fat mass, Upper limb muscle mass, Lower limb muscle mass, ASM, MGS, Leg extension, Medicine ball, Five-chair stand, 6MWD | ↑ GS (m/s) in exercise group; ↑ Upper limb fat mass (kg) in exercise group; ↓ Lower limb fat mass (kg) in exercise group; ↑ Upper limb muscle mass (kg) in exercise group; ↑ Lower limb muscle mass (kg) in exercise group; ↑ ASM (kg/m2) in exercise group; ↑ MGS (kg) in exercise group; ↑ Leg extension (kg) in exercise group; ↑ Medicine ball (m) in exercise group; ↓ Five-chair stand (s) in exercise group; ↑ 6MWD (m) in exercise group. |
Publisher’s Note: MDPI stays neutral with regard to jurisdictional claims in published maps and institutional affiliations. |
© 2021 by the authors. Licensee MDPI, Basel, Switzerland. This article is an open access article distributed under the terms and conditions of the Creative Commons Attribution (CC BY) license (https://creativecommons.org/licenses/by/4.0/).
Share and Cite
Talar, K.; Hernández-Belmonte, A.; Vetrovsky, T.; Steffl, M.; Kałamacka, E.; Courel-Ibáñez, J. Benefits of Resistance Training in Early and Late Stages of Frailty and Sarcopenia: A Systematic Review and Meta-Analysis of Randomized Controlled Studies. J. Clin. Med. 2021, 10, 1630. https://doi.org/10.3390/jcm10081630
Talar K, Hernández-Belmonte A, Vetrovsky T, Steffl M, Kałamacka E, Courel-Ibáñez J. Benefits of Resistance Training in Early and Late Stages of Frailty and Sarcopenia: A Systematic Review and Meta-Analysis of Randomized Controlled Studies. Journal of Clinical Medicine. 2021; 10(8):1630. https://doi.org/10.3390/jcm10081630
Chicago/Turabian StyleTalar, Karolina, Alejandro Hernández-Belmonte, Tomas Vetrovsky, Michal Steffl, Ewa Kałamacka, and Javier Courel-Ibáñez. 2021. "Benefits of Resistance Training in Early and Late Stages of Frailty and Sarcopenia: A Systematic Review and Meta-Analysis of Randomized Controlled Studies" Journal of Clinical Medicine 10, no. 8: 1630. https://doi.org/10.3390/jcm10081630
APA StyleTalar, K., Hernández-Belmonte, A., Vetrovsky, T., Steffl, M., Kałamacka, E., & Courel-Ibáñez, J. (2021). Benefits of Resistance Training in Early and Late Stages of Frailty and Sarcopenia: A Systematic Review and Meta-Analysis of Randomized Controlled Studies. Journal of Clinical Medicine, 10(8), 1630. https://doi.org/10.3390/jcm10081630


