Abstract
Six different solvents were used as extraction medium (water, methanol, ethanol, acidified methanol, benzene and acetone) to check their phenolics extraction efficacy from flour of two rye cultivars. Rye extracts with different solvents were further analyzed for the estimation of phytochemicals and antioxidant properties. Different tests (TPC, TAC, DPPH, FRAP, ABTS, RPA and CTC) were performed to check the antioxidant properties and tannin contents in extracts. A bioactive profile of a rye cultivar indicated the presence of total phenolic compounds (0.08–2.62 mg GAE/g), total antioxidant capacity (0.9–6.8 mg AAE/g) and condensed tannin content (4.24–9.28 mg CE/100 g). HPLC was done to check phenolics in rye extract with the best solvent (water), which indicated the presence of Catechol (91.1–120.4 mg/100 g), resorcinol (52–70.3 mg/100 g), vanillin (1.3–5.5 mg/100 g), ferulic acid (1.4–1.5 mg/100 g), quercetin (4.6–4.67 mg/100 g) and benzoic acid (5.3 mg/100 g) in rye extracts. The presence of DNA damage protection potential in rye extracts indicates its medicinal importance. Rye flour could be utilized in the preparation of antioxidant-rich health-benefiting food products.
1. Introduction
Frequent use of unhealthy food products (junk foods), less physical activity, a busy working schedule and deficiency of health-benefiting nutrients in a daily diet may heighten susceptibility to chronic diseases [1,2]. The addition of whole grains and grain-based healthy food products are favorably supported in diet charts, as they provide significant amounts of protein, fibers, carbohydrates, minerals and bioactive compounds. Rye (Secale cereale) is considered an important traditional cereal crop, and is cultivated worldwide. Rye stands in second place as a cereal grain after wheat, whose flour is utilized for the preparation of bakery products, especially bread and biscuits [3]. Rye (Secale cereale) belongs to the Poaceae family and its genus is Secale. Rye crops are believed to have originated in southwestern Asia and are widely cultivated in Europe, North America and Asia [4]. Rye crops are well known for their adaptability toward harsher environmental conditions. The crops can germinate well at 1.11–3.33 °C. Rye grains are oval/wedge shaped and light to dark brownish in color. Rye grains are genetically related to wheat and barley grains [5]. However, the major difference lies in the size of grains, their nutritional composition and the organoleptic properties they possess. For the proper growth of rye grains, the preferred soil types are light loam/sandy, and well drained/fairly dry soil with a pH ranging from 4.5–8.2. Rye can grow in sandy soils with less nutrients than other soil types. Rye grains are capable of tolerating saline conditions, a low pH and a high concentration of aluminum. Being a long-day plant, rye crops require 40–60 days to shift in their reproductive stage. The vegetation period for rye grains may vary from 120–150 days.
Rye is considered a stress-tolerant and disease-resistant cereal crop [6]. Rye grains have been scrutinized as a good source of fiber, and contain proteins, minerals and bioactive phenolic compounds that have been well documented for their health-benefiting effects [7,8,9,10,11]. Hundreds of bioactive phytochemicals from the extracts of natural resources have been identified and being studied for their health-benefiting antioxidant properties [10,12,13,14]. Liu et al. [15] demonstrated that health-benefiting properties of food products are mainly due to the syringic and additive effects of bioactive compounds. Cereal grains and their milling fractions may possess mixtures of bioactive compounds. The bioactive profile of rye grains and milling fractions indicates the presence of ferulic acid, sinapic acid, p-Coumaric acid, syringic acid and vanillic acid, followed by p-hydroxybenzoic acid [16,17,18,19]. The unique characteristic feature of these specific phytochemicals is their solvent specificity, as some of them are soluble in an aqueous phase whereas other are either soluble in organic solvents or a combination of aqueous and organic phases [20,21,22,23,24,25,26,27,28,29]. Scantiness of scientific information regarding the effect of different solvent types on rye phenolics incited us to design the present work. The objective of the present research work is to analyze the effect of different solvents on rye phenolics, screening for specific bioactive compounds and their quantifications using HPLC analysis.
2. Materials and Methods
Rye cultivars (black and white) were collected (IARI, 28.08° N; 77.12° E; 228.61 m) from PUSA, New Delhi. Grains were washed well with tap water, oven dried (Rescholar, India) at 45 °C for 48 h and stored in cross-zip airtight pouches/plastic containers for further experimental work.
2.1. Chemicals and Glassware’s
Solvents (ethanol, acetone, benzene, methanol and HCl, etc.) and chemicals (DPPH (C18H12N5O6); potassium persulphate (K2S2O8), Folin-Ciocalteu (C10H5NaO5S) reagent (FCR); disodium hydrogen orthophosphate, trichloroacetic acid (C2HCl3O2), ferric chloride (FeCl3), potassium ferricyanide (C6N6FeK3), sodium carbonate (Na2CO3), ammonium molybdate, 2,2′-azino-bis[3-ethylbenzothiazoline-6-sulfonate] (ABTS), etc.) were of either HPLC or analytic grade (Sigma Aldrich, HiMedia, India). Standards (HPLC grade) used during different antioxidant assays were procured from Sigma Aldrich. HPLC grade standards (Resorcinol, catechol, vanillin, ferulic acid, quercetin, benzoic acid, ascorbic acid, catechin, gallic acid and p-Coumaric acid) were procured from HiMedia and Sigma-Aldrich, respectively.
2.2. Sample Preparation
Rye grains from different cultivars were milled to fine flour (Bajaj, India) and passed through a sieve (60BSS) to obtain a uniform size of flour particles (250 micron). Defattation of different rye flour samples (black and white) was carried out with Hexane (1:4 w/v; 10 min; thrice). Defatted samples were dried in a hot air oven (40 °C for 15–24 h, Rescholar, India) and stored (deep freezer, −20 °C, Vestfrost, India). Thereafter, defatted samples were processed using absolute benzene, ethanol, acetone, methanol, acidified methanol (HCl-Methanol; 1:99 v/v) and water in ratio of 1:10 w/v at 50 °C for 40 min in a water bath (Rescholar, India). The flour–solvent mixture was filtered (Whatman No. 1 filter paper 100125R, HiMedia) and extracts were stored in sample-storing vials at 4 °C in a refrigerator (Samsung, India). Rye flour extracts prepared in different solvents were named water rye extract (WRE), ethanol rye extract (ERE), methanol rye extract (MRE), acetone rye extract (ARE), acidified methanol rye extract (AMRE) and benzene rye extract (BRE), respectively. The entire process is represented in Figure 1.
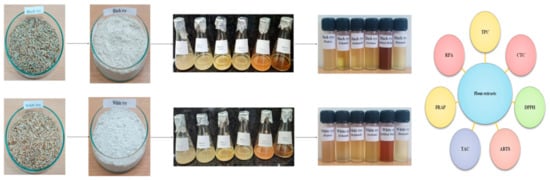
Figure 1.
Sample preparation and type of analysis performed.
2.3. Phytochemical Analysis
Rye extracts (WRE, ERE, MRE, ARE, AMRE and BRE) were screened for the presence of various phytochemicals [30].
2.4. Total Phenolic Content (TPC) and HPLC Analysis
TPC in rye extracts (WRE, ERE, MRE, ARE, AMRE and BRE) were analyzed using the FCR (Folin-Ciocalteu reagent) method [31]. FCR (500 µL) was added in an aliquot (100 µL) of each rye extract (WRE, ERE, MRE, ARE, AMRE and BRE) followed by an aqueous sodium carbonate solution addition (1500 µL, 20%). The resulting reaction mixture (extracts and reagents) was kept undisturbed (20 min) in the dark at ambient temperature. After 20 min, distilled water was added to prepare the final volume up to a mark (10 mL). Absorbance of blue colored extract–reagent mixture was recorded (765 nm; Shimadzu, India). Gallic acid (mg/mL stock, HiMedia) was used (standard). Results were expressed as mg GAE (gallic acid equivalent) g−1 dry weight basis (dwb).
Water extracts (BR and WR) were screened through qualitative and quantitative HPLC analysis ((Shimadzu 10 AVP HPLC system) for specific bioactive compounds. HPLC grade standards (Resorcinol, catechol, vanillin, ferulic acid, quercetin, benzoic acid, ascorbic acid, catechin, gallic acid and p-Coumaric acid) were used. Four different phases were used: phase-A (methanol, HPLC grade), phase-B (glacial acetic acid, 0.1%), phase-C (ortho-phosphoric acid, 0.1%) and phase-D (Acetonitrile, HPLC grade). The ratio of optimized gradient phase during the analysis was 30:30:25:15 with a flow rate of 1.2 mL/min and a temperature of 30 °C.
2.5. DPPH (C18H12N5O6) Assay
Percent (%) inhibition of DPPH reagent by rye extracts (WRE, ERE, MRE, ARE, AMRE and BRE) was measured [32]. An aliquot (100 μL) of rye extracts (WRE, ERE, MRE, ARE, AMRE and BRE) was added in to the testing vial (5 mL) followed by a DPPH reagent addition (3 mL). The resulting DPPH–extract mixture was then kept undisturbed (30 min). The changes in absorbance (517 nm) were noted.
Percent (%) DPPH inhibition: A (Extractt=0) − A (Extractt=30)/A (Extractt=0) × 100
2.6. ABTS Assay
Percent (%) inhibition of ABTS reagent by rye extract (WRE, ERE, MRE, ARE, AMRE and BRE) was measured [33]. An aliquot (100 μL) of rye extracts (WRE, ERE, MRE, ARE; AMRE and BRE) was added into a testing vial (5 mL) followed by an ABTS reagent addition (3 mL). The resulting ABTS–extract mixture was then kept undisturbed (10 min). The changes in absorbance (732 nm) were noted.
Percent (%) ABTS inhibition: A (Extractt=0) − A (Extractt=10)/A (Extractt=0) × 100
2.7. Total Antioxidant Capacity (TAC)
The TAC of rye extracts (WRE, ERE, MRE, ARE, AMRE and BRE) was determined [34]. The standard used during the TAC assay was ascorbic acid. A reagent was prepared to evaluate the antioxidant properties in rye extracts using ammonium molybdate (4 mM), conc. H2SO4 (0.6 M) and sodium hydrogen orthophosphate (28 mM). Rye extracts (100 μL) were allowed to react with the TAC reagent (3 mL). The resulting TAC reagent–extract mixture was warmed (95 °C/90 min). Ascorbic acid (mg/mL) was used as the standard. The TAC value of rye extracts was calculated from the equation generated, and results were expressed as mg AAE/g. Absorbance of the rye extract–reagent mixture and standard solution was recorded (695 nm).
2.8. Reducing Power Activity (RPA)
The RPA of rye extracts (WRE, ERE, MRE, ARE, AMRE and BRE) was determined [35]. Rye extracts (100 μL) were allowed to react with an aqueous potassium ferricyanide (K3[Fe(CN)6]) solution (1%, 100 μL) followed by incubation in a water bath (50 °C/30 min). The reaction mixture was cooled at room temperature followed by addition of trichloroacetic acid (1% 100 μL) and aqueous ferric chloride solutions (0.1%, 100 μL). The colored mixture was incubated (15 min), which was diluted with distilled water after incubation to prepare the final volume (10 mL). Absorbance of green colored complex was noted (700 nm). The standard used during the RPA assay was Quercetin. The RPA was calculated from the equation generated and results were expressed as mg QE/g. Absorbance of the extract–reagent mixture and standard solution was recorded (700 nm).
2.9. Ferric Reducing Antioxidant Power (FRAP)
The FRAP of rye extracts (WRE, ERE, MRE, ARE, AMRE and BRE) was determined [36]. A stock solution for FRAP reagent was prepared (TPTZ (2,4,6-tripyridyl-s-triazine) (10 mM) solution in HCl (40 mM), acetate buffer (300 mM) and FeCl3·6H2O (20 mM)). The fresh solution was prepared by mixing the TPTZ solution, acetate buffer and FeCl3·6H2O solution at a ratio of 1:10:1, then heating in a water bath at 45 °C before performing the assay. Rye extracts (100 µL) were taken in sample vials to react with the FRAP reagent (3 mL, 10 min under darkness). Reading of the rye extract–reagent mixture (blue colored ferrous tripyridyltriazine complex) was noted (595 nm).
2.10. Condensed Tannin Content (CTC)
The CTC of rye extracts (WRE, ERE, MRE, ARE, AMRE and BRE) was assessed using the Vanillin (C8H8O3)–HCl method [37]. Rye extracts (100 μL) were allowed to react with Vanillin–HCl (1:0.5 v/v). The reaction mixture was kept undisturbed at room temperature (15 min). Absorbance of the extract–reagent mixture against a blank was recorded (500 nm). For the preparation of the standard curve, catechin was used as the standard. CTC in rye extracts was expressed as mg CE (catechin equivalent)/100 g.
2.11. DNA Damage Protection Potential (DDPPA) Assay
WRE (black and white rye) was used during DDPPA, and the assay was performed as per previously reported conditions [38]. Different reagents were used (1:1:1 v/v) to prepare Fenton’s reagent (ascorbic acid (500 μM), Ferric chloride (800 μM) and Hydrogen peroxide (30 mM)). The mixture used to initiate the reaction mechanism was DNA (2.5 μL), nuclease free double distilled water (2.5 μL), extract (5.0 μL) and Fenton’s reagent (10 μL). Reaction mixture was then incubated in water bath (37 °C/45 min). After incubation, loading buffer (2.5 μL; 0.25% Bromophenol blue and glycerol 50%) was added to the reaction mixture. The results were noted on Agarose gel electrophoresis (1.0%) stained with ethidium bromide (4 μL). The DNA protection potential of rye extracts were evaluated using the retention percentage of the normalized super-coiled DNA, as given below.
2.12. Statistical Analysis
Experiments were performed in triplicate to generate results. Afterwards, mean value and standard deviation were calculated. Tukey’s test was used to test significant differences among experiments. Differences among means were considered statistically significant at a 5% level. The score plot, loading plot and correlation for determining the relationship was generated using Minitab software 18.
3. Results and Discussion
3.1. Bioactive Compounds
Rye extracts (BR and WR) were subjected to prelim phytochemical assessment, with the results reported in Table 1. The WRE showed the presence of coumarins, tannins, sugar, saponins and protein, whereas the ERE and ARE showed only saponins. Further, BRE showed the presence of flavonoids, protein and saponins, followed by the MRE, which showed only two compounds (i.e., coumarins and saponins). The AMRE indicated the presence of coumarins, flavonoids, sugars, tannins and saponins.

Table 1.
Phytochemicals, sugar, protein and alkaloids in different rye extracts.
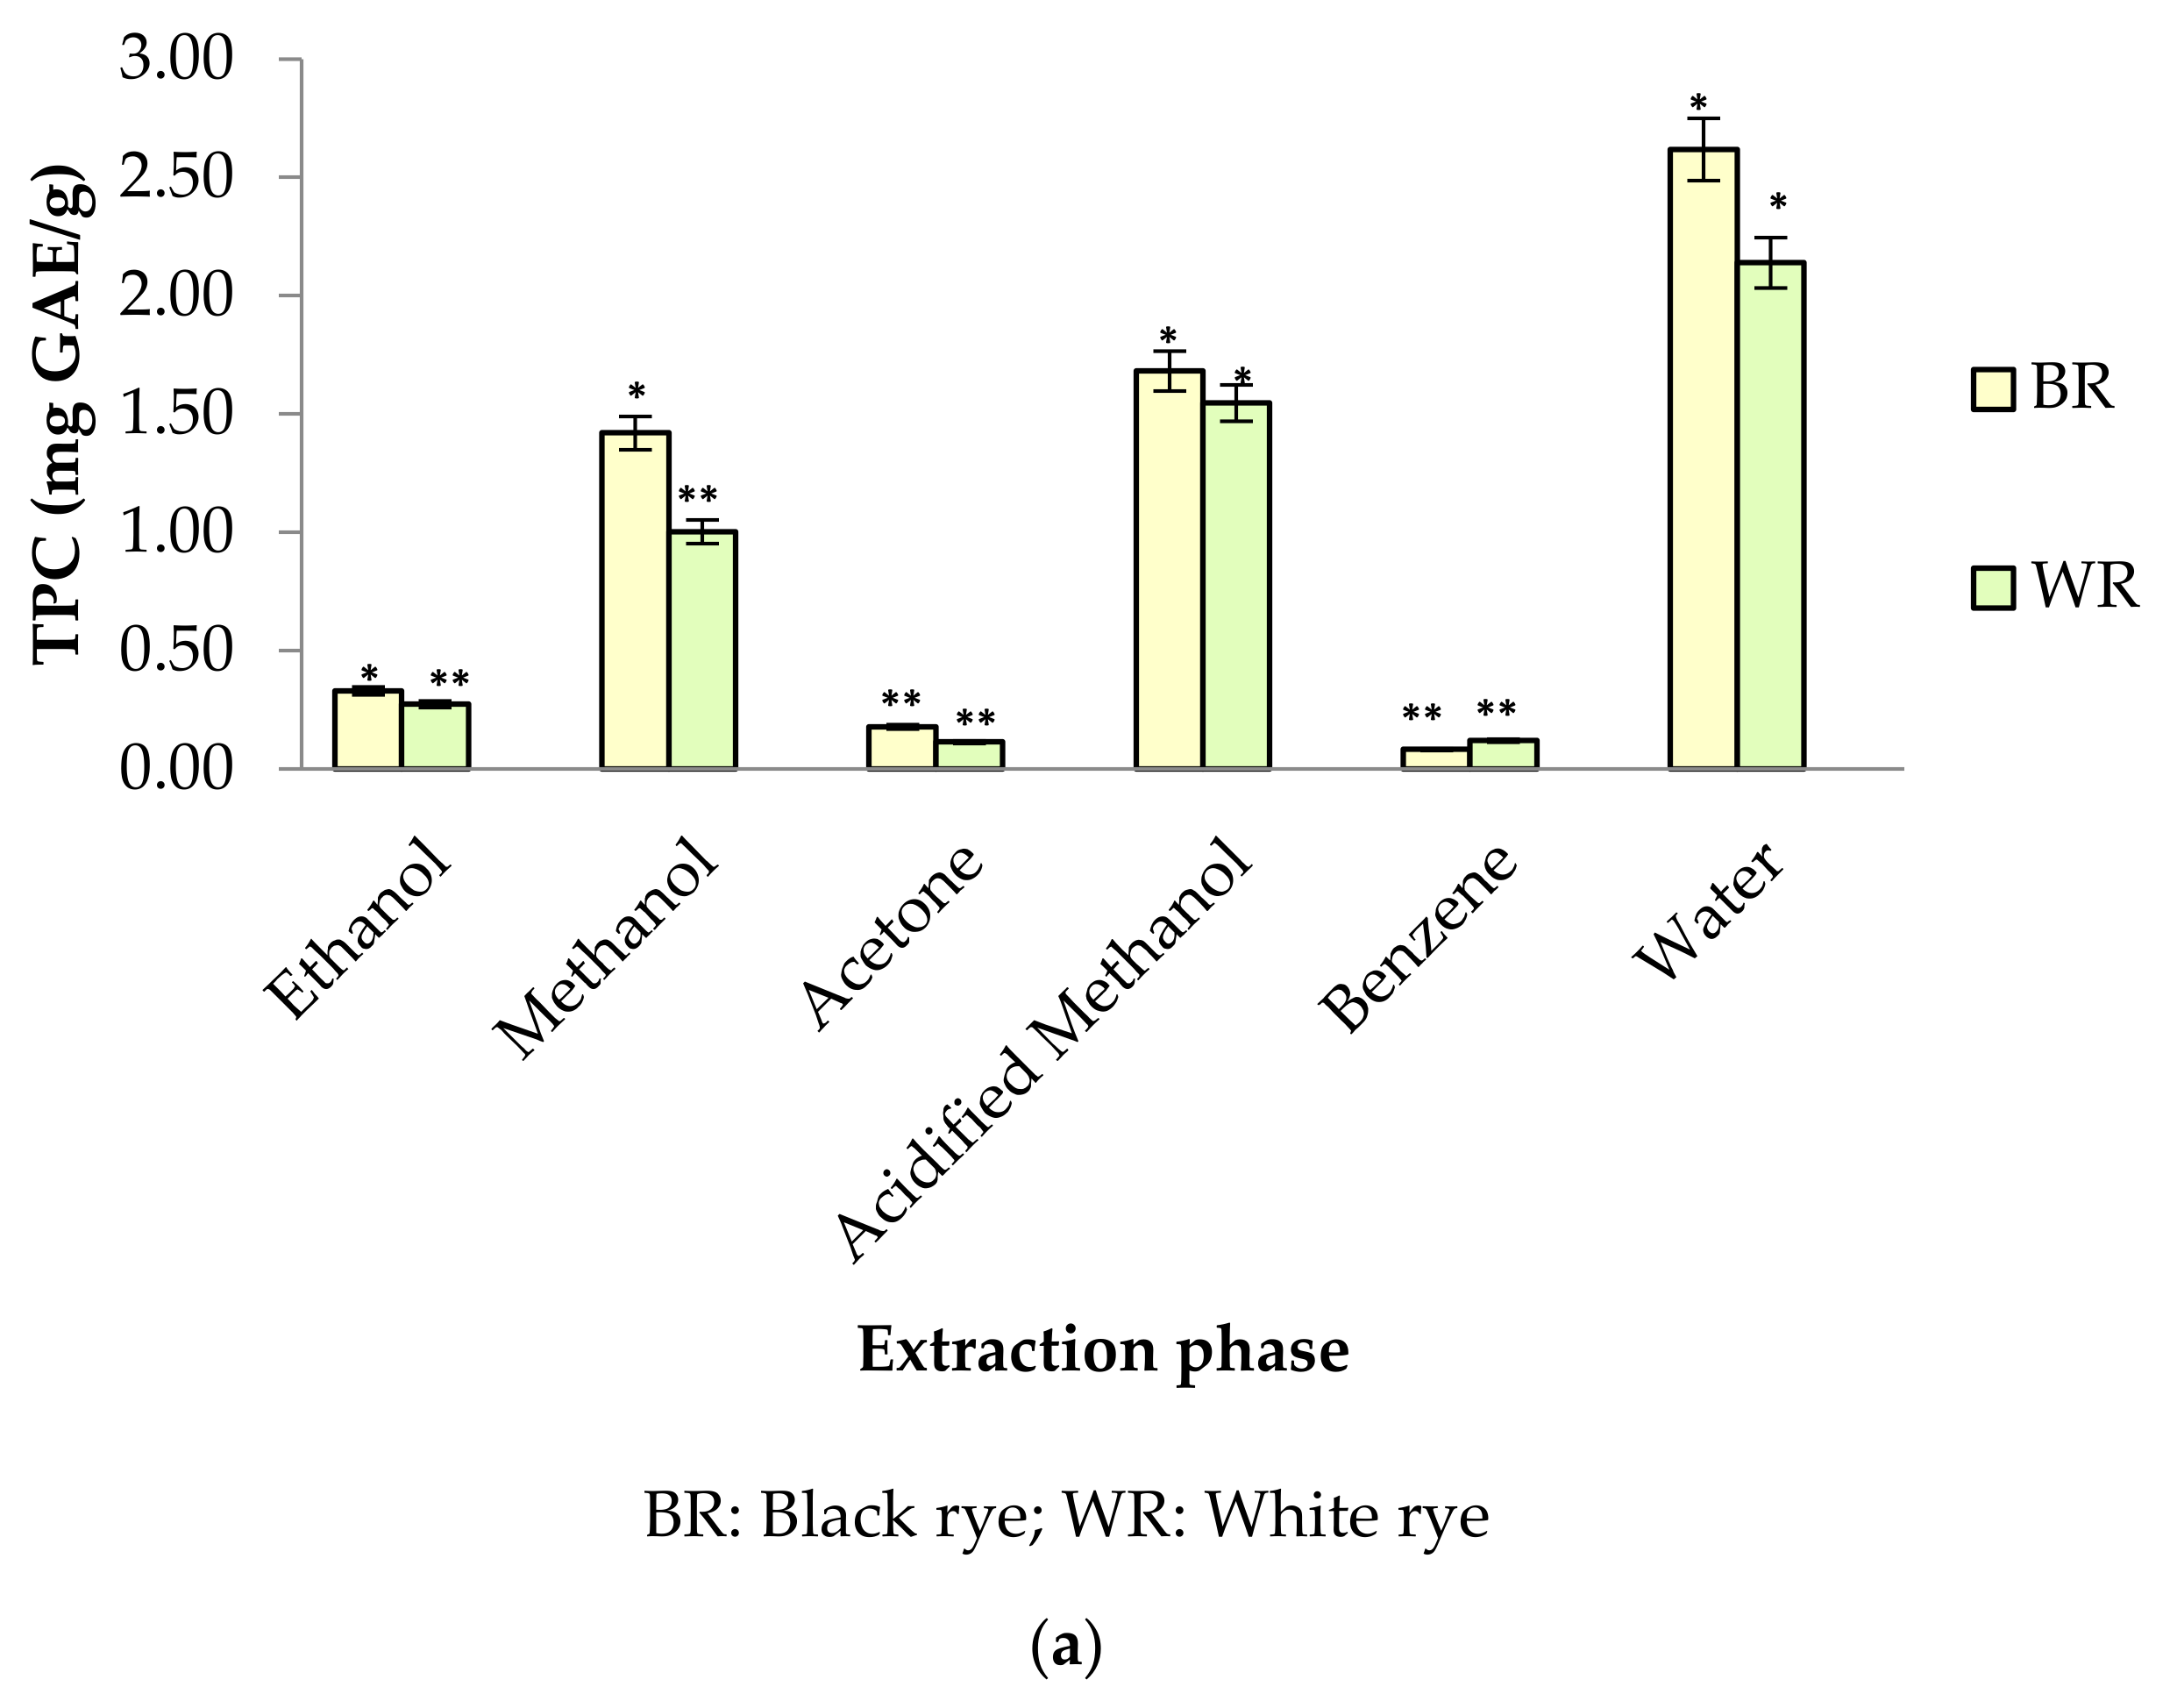
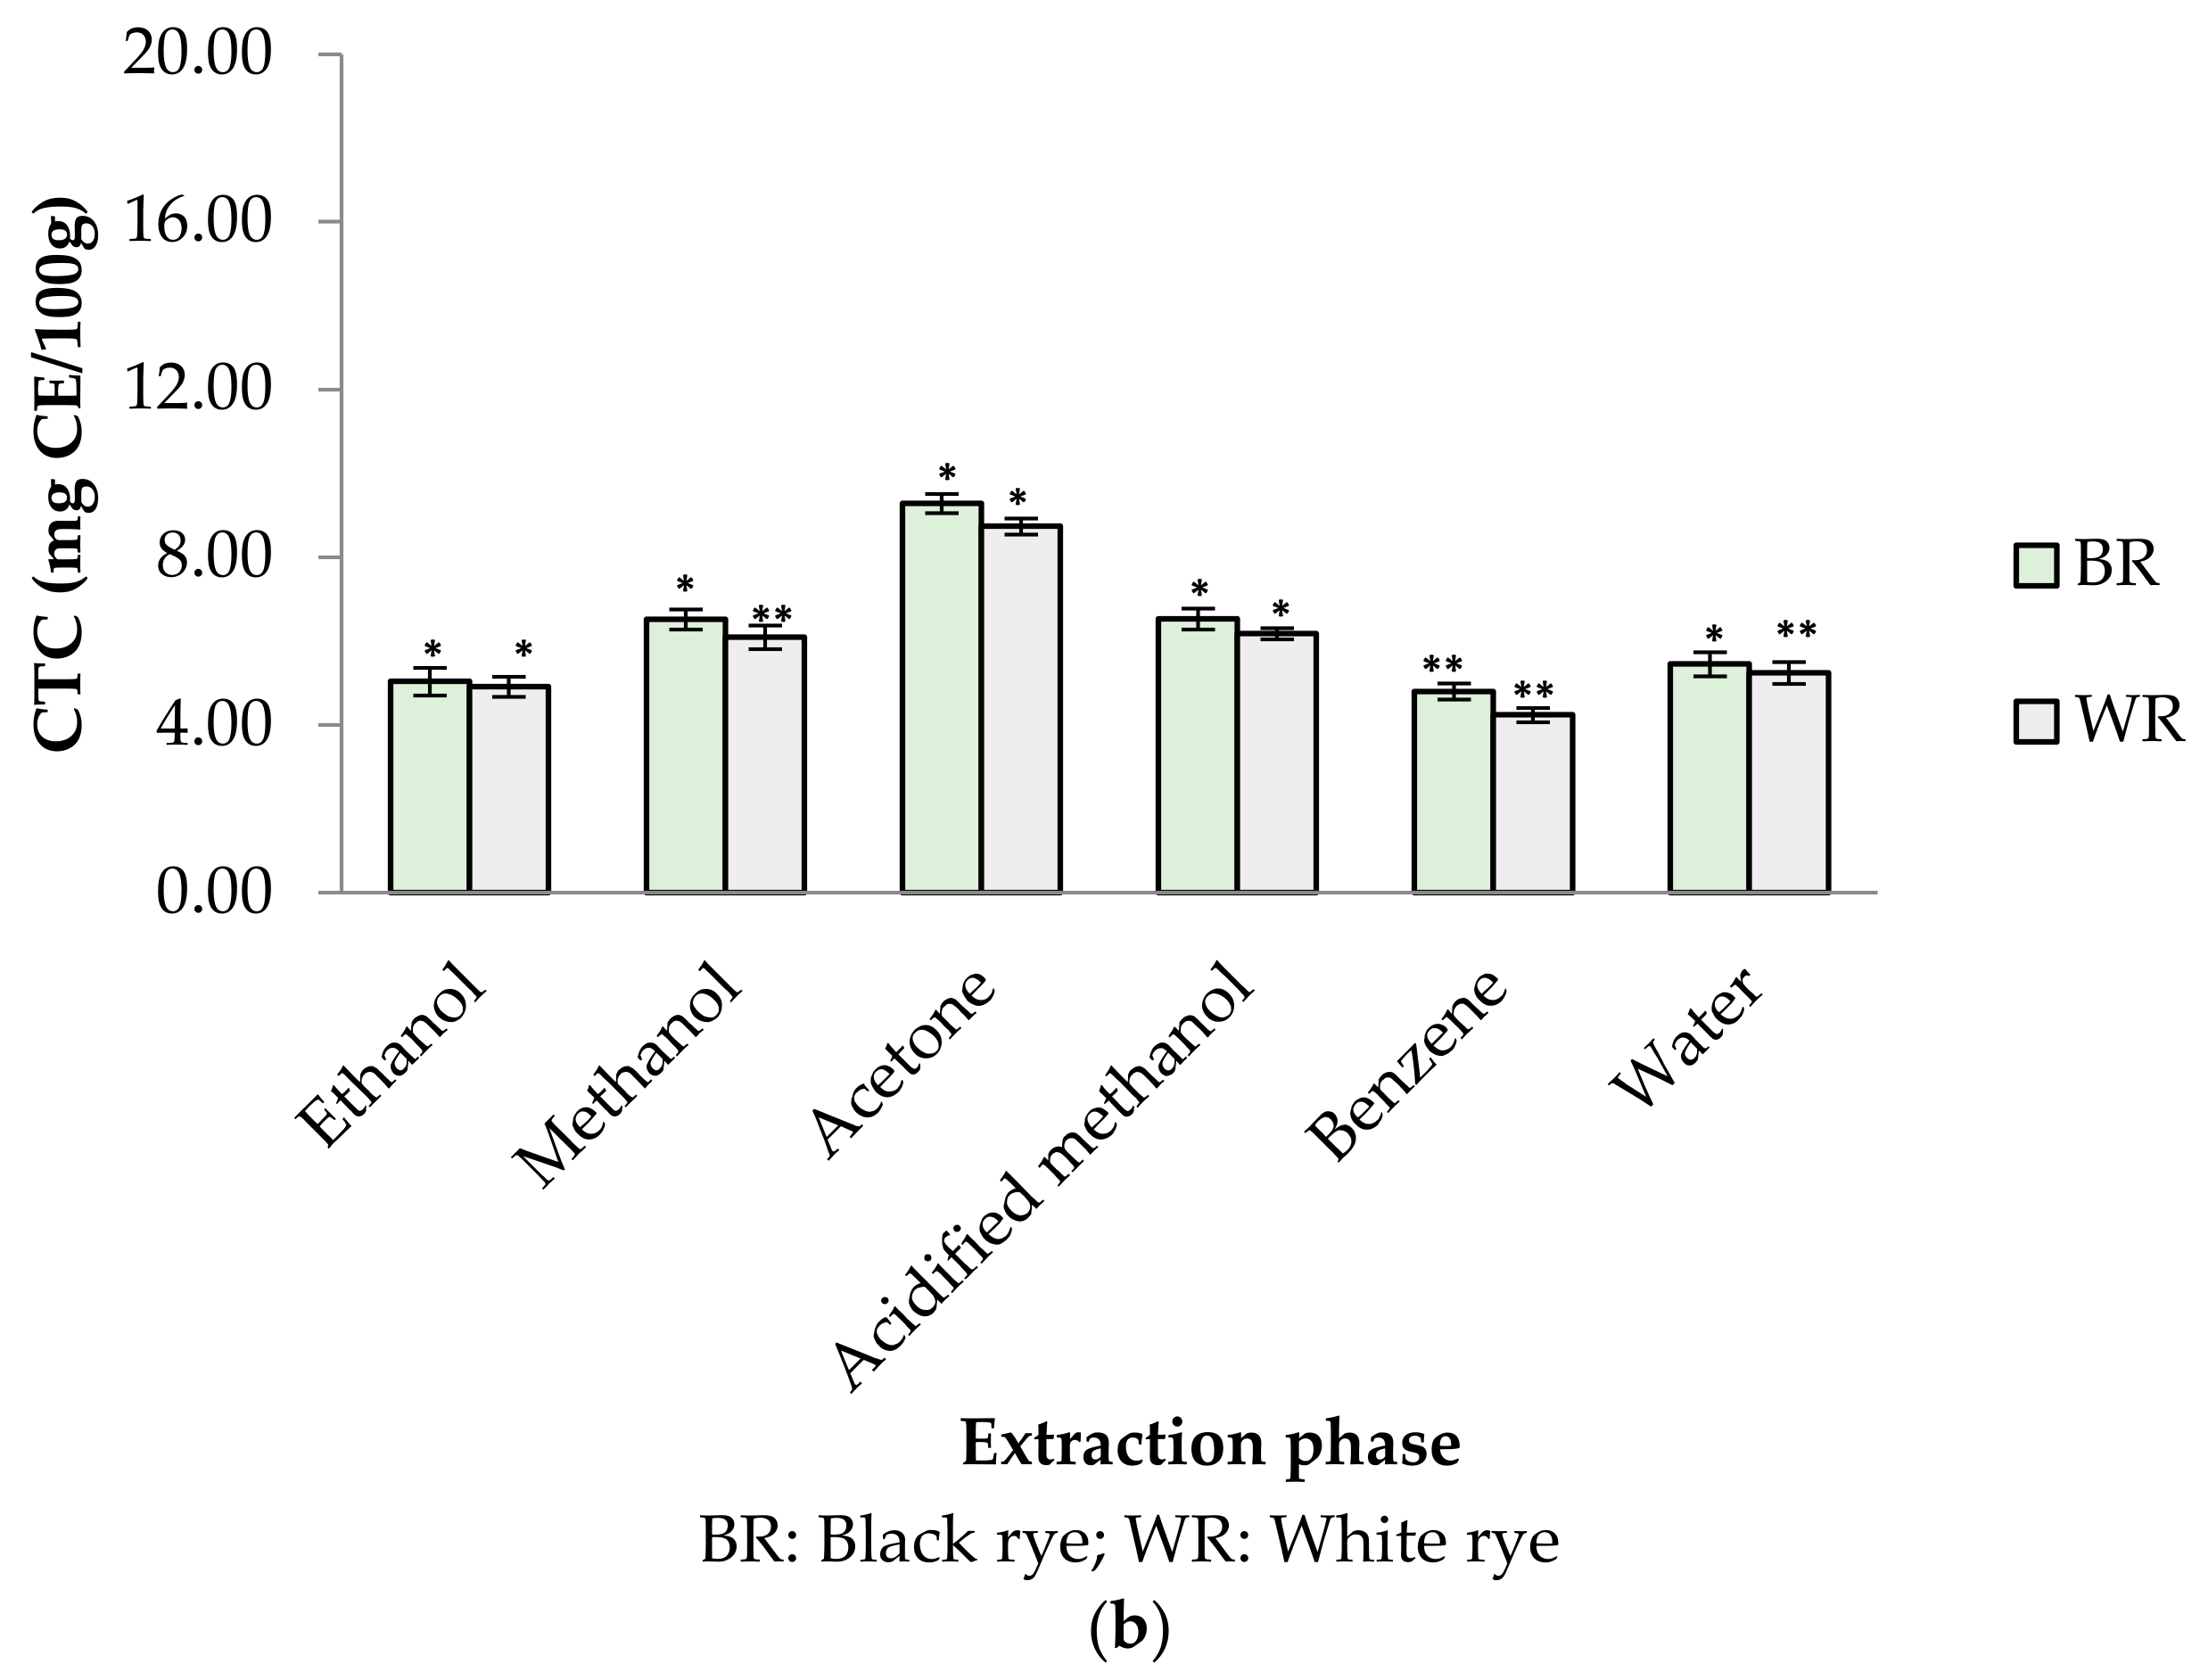
Phenolic profiles of substrates like fruits/vegetables and cereal grains are gaining more attention among researchers, industries and consumers because of their significance to human health. In the present study, six different extraction mediums (ethanol, acetone, methanol, acidified methanol, water and benzene) were used to extract out phenolic compounds from rye cultivars (BR and WR). Among the selected rye cultivars, black rye (BR) possessed a higher amount of phenolic compounds in the different extraction mediums than the white rye (WR). Extraction mediums used during the experimental work of the present study played an important role when extracting phenolics. Water proved to be the better solvent for extracting total phenolics (TPC) from rye flour as compared to acidified methanol, methanol, ethanol, acetone and benzene. The highest TPC was observed in water extracts (BR (2.62 mg GAE/g); WR (2.14 mg GAE/g)), followed by acidified methanol extracts (BR (1.68 mg GAE/g); WR (1.55 mg GAE/g)), methanol (BR (1.42 mg GAE/g); WR (1.00 mg GAE/g)) and ethanol (BR (0.33 mg GAE/g); WR (0.27 mg GAE/g)). As compared to water, neither acidified methanol, methanol, ethanol, acetone nor benzene were efficient enough to extract out a significant amount of phenolics from rye flour (Figure 2a). TPC in water rye extracts (WRE) of BR (2.62 mg GAE/g) and WR (2.14 mg GAE/g) was in consistent with the results of Mishra et al. [39], who reported a maximum TPC of 2.19 mg/g in water extracts of rye. The TPC (1–1.42 mg GAE/g) in the MREs (BR, WR) agreed with the finding of Zielinski et al. [40], who reported 1.35–1.47 mg/g TPC in 80% methanolic extracts. Total phenolic content in methanolic (80%) extracts of rye varied from 0.98–3.36 mg GAE/g in reports by Kulichova et al. [12] and Ragaee et al. [41]. Michalska et al. [17] reported the effect of phosphate buffered saline (PBS) and methanol (80%) on recovery of phenolics from rye grains. The amount of phenolics was 2.31 mg/g for rye extracts prepared in PBS and 1.43 mg/g for methanolic extract. The CTC in BR and WR extracts was observed to be 4.24–9.28 mg CE/100 g (Figure 2b). The highest CTC was noted in acetone extracts of BR (9.28 mg CE/100 g) and WR (8.74 mg CE/100 g), whereas the lowest amount was noted in benzene extracts of BR (4.80 mg CE/100 g) and WR (4.24 mg CE/100 g).
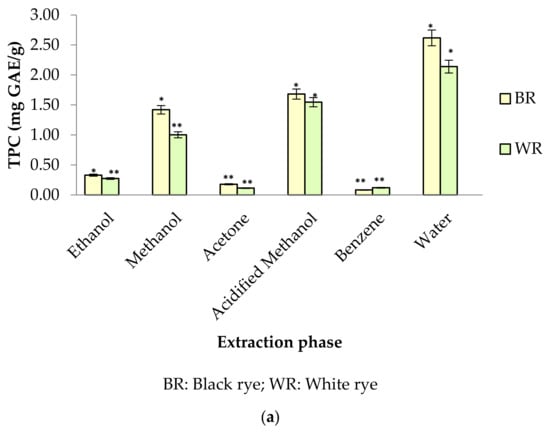
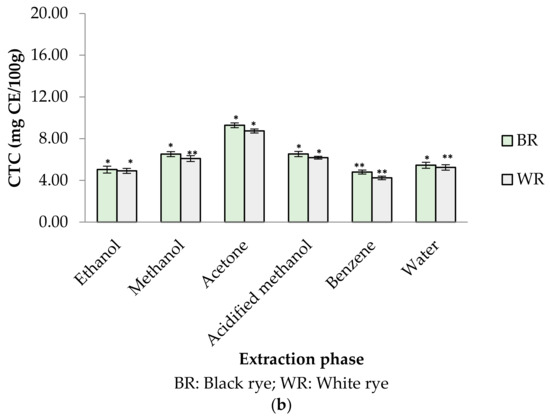
Figure 2.
(a) TPC in different rye extracts; (b) CTC in different rye extracts. * significantly different at p < 0.05, ** significantly different at p < 0.01.
3.2. Phenolics in Rye Extracts
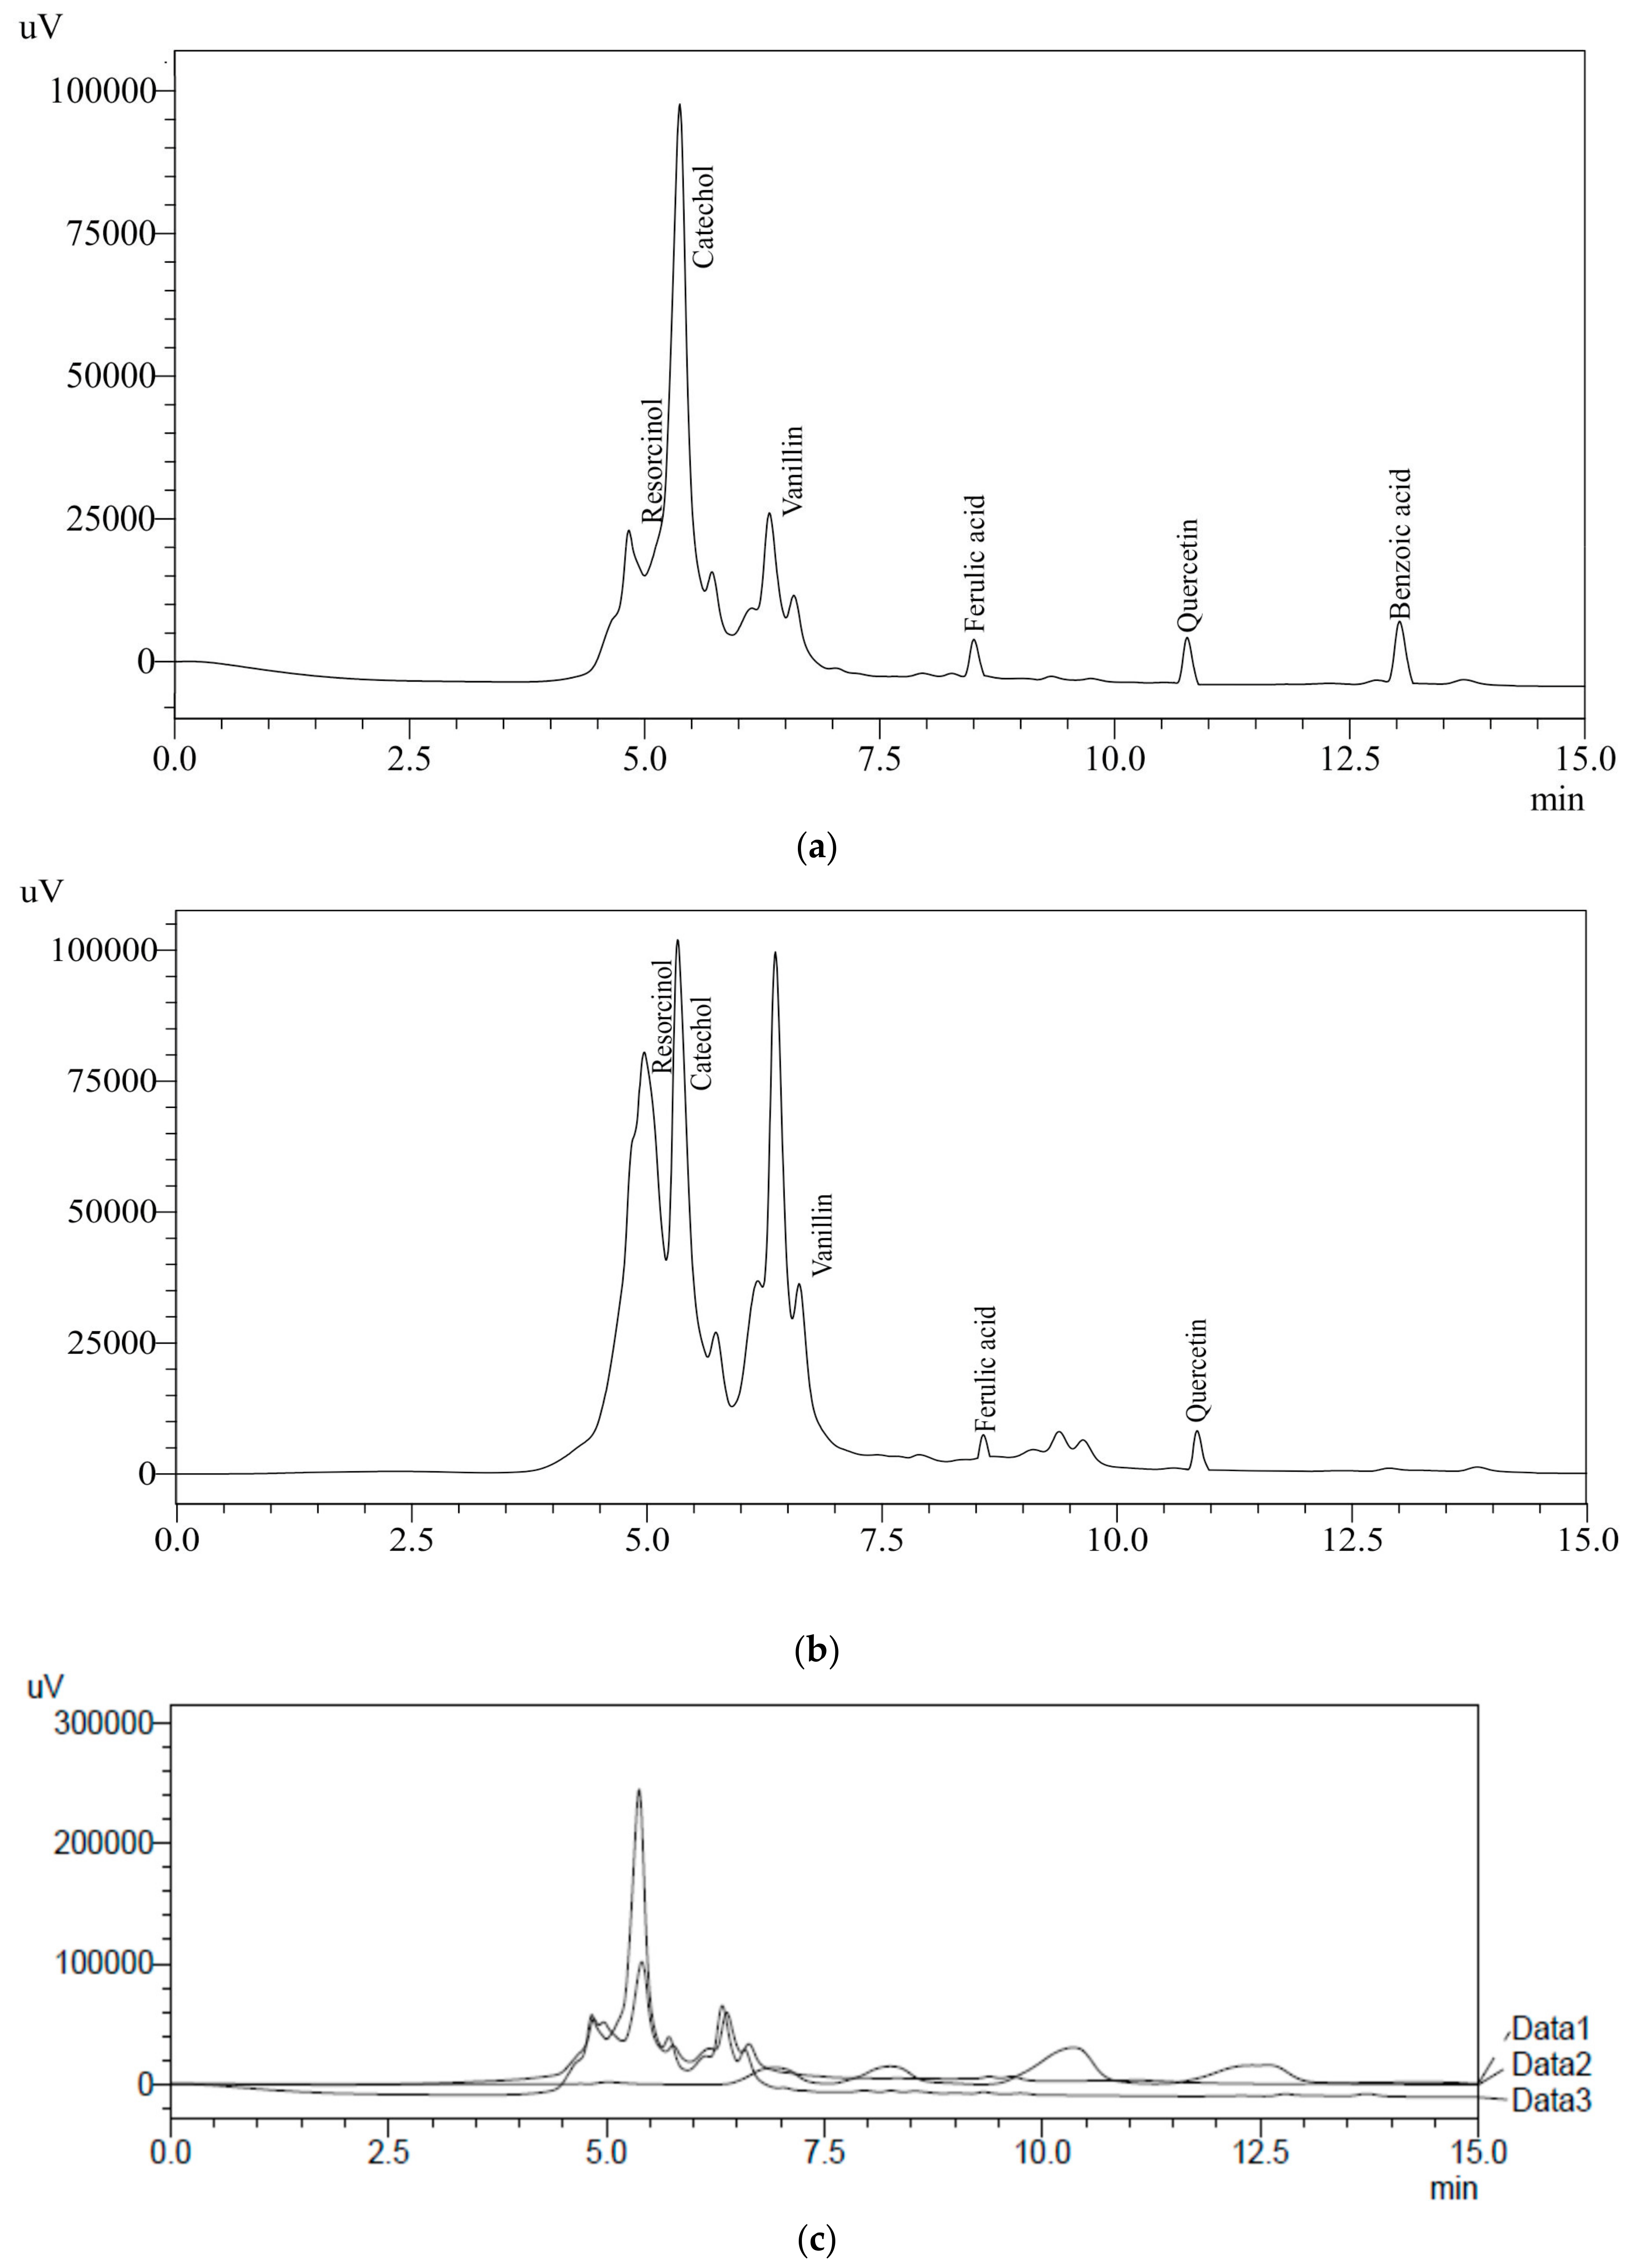
Water extract (WRE) of BR and WR possessing higher amounts of TPC were analyzed using HPLC to identify and quantify the specific phenolic compounds. Ten different HPLC grade standards (Resorcinol, catechol, catechin, cinnamic acid, ascorbic acid, benzoic acid, ferulic acid, gallic acid, vanillin and quercetin) were used for the screening of specific compounds in rye extracts. WRE of black cultivar (BR) showed the presence of resorcinol (70.4 mg/100 g), catechol (120.4 mg/100 g), vanillin (5.5 mg/100 g), ferulic acid (1.52 mg/100 g), quercetin (4.68 mg/100 g) and benzoic acid (5.3 mg/100 g) (Figure 3a and Table 2). HPLC analysis of white cultivar (WR) WRE indicated resorcinol (52 mg/100 g), catechol (91.1 mg/100 g), vanillin (1.4 mg/100 g), ferulic acid (1.46 mg/100 g) and quercetin (4.6 mg/100 g) (Figure 3b and Table 2). An overlay of standards along with chromatograms of the rye extracts is presented in Figure 3c. Earlier published reports have also indicated the presence of ferulic acid, benzoic acid and vanillin in rye grains [12,39,42]. Ferulic acid content in BR and WR was comparable with the results (0.61–65.74 mg/100 g) reported by Pihlava et al. [42]; however, it was significantly higher than the results (0.438–0.855 mg/100 g) reported by Mishra et al. [39] in water extracts. Vanillin and ferulic acid content observed by Kulichova et al. [12] was lower (0.075–0.3188 and 0.1903–0.6227 mg/100 g, respectively) as compared to the results of current study. Benzoic acid content BR cultivar was higher in the present study that that (0.077–0.508 mg/100 g) reported by Mishra et al. [39]. Seasonal variation, soil conditions, cultivar type, agricultural practice and storage conditions have significant effects on the bioactive profiles of natural resources [43,44,45,46]. These factors play a vital role in analyzing the concentrations of bioactive compounds in different studies. Previous reports on rye grains have indicated the presence of ferulic acid (86–117 mg/100 g), caffeic acid (0.42–1 mg/100 g), p-Coumaric acid (0.35–6.5 mg/100 g), sinapic acid (0.23–130 mg/100 g), vanillic acid (0.25–3 mg/100 g) and p-hydroxybenzoic acid (0.68–0.97 mg/100 g) [10,16,42,47,48,49,50]. Further, the presence of specific bioactive metabolites in rye extracts makes rye a healthier food choice. The health-benefiting nature of bioactive compounds present in rye extracts are reported in Table 3.
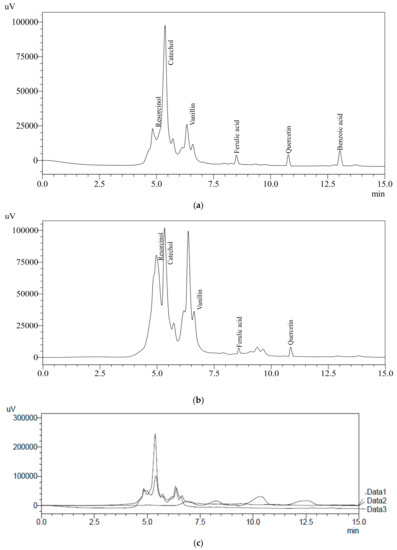
Figure 3.
(a) HPLC chromatograph of BRE; (b) HPLC chromatograph of WRE; (c) overlay of HPLC standards with BRE and WRE.
Table 2.
Amount of specific compounds in aqueous extracts of different rye cultivars.
Table 3.
Specific compounds in rye extracts and their health-benefiting features.
3.3. Antioxidant Properties
Different extracts of rye (WRE, ERE, MRE, ARE, AMRE and BRE) were assessed using TAC, DPPH, RPA, ABTS and FRAP assays. These antioxidant assays are either specific color-forming or decolorizing tests that have been widely adopted for screening antioxidant properties in natural extracts via free radical scavenging [2,20,51]. Antioxidant properties of rye extracts are reported in Table 4. DPPH activity is expressed as percent inhibition, indicated by the ability of an extract to decolorize and convert a purple-colored DPPH reagent to mustard yellow (stabilized form) [58,59,60]. Among extracts (WRE, ERE, MRE, ARE, AMRE and BRE) of selected rye cultivars (BR and WR), WRE showed maximum activity against DPPH at 84% for the BR and 80.3% for the WR. Percent inhibition activity against DPPH radical was observed to be 64.8–74.3% for the AMRE, followed by 38.7–43.5% for the MRE, 21.3–31.4% for the ERE, 14.8–26% for the ARE and 10.7–14.1% for the BRE. Further, another antioxidant assay ABTS was performed to check the percent inhibition activity in rye extracts. Percent (%) inhibition against ABTS was also observed to be higher in water extracts of both rye cultivars: 89.7% for black and 87.6% for white. Rye extracts (AMRE, MRE, ERE, ARE and BRE) other than water also possessed antioxidant potential, as indicated by activity in the black and white rye extracts. Extracts prepared from black rye showed activity/percent inhibition as: AMRE (75.3%), MRE (66.8%), ERE (61.4%), ARE (49.2%) and BRE (22.8%). Extracts prepared from white rye showed activity/percent inhibition as: AMRE (69.2%), MRE (61.2%), ERE (54%), ARE (42.7%) and BRE (18.1%). Overall, water proved the most efficient solvent, followed by acidified methanol and methanol. Mishra et al. [39] studied cold water extracts prepared from rye cultivars, reporting 47.98% inhibition in extracts during a DPPH assay and 97.54% inhibition during an ABTS assay. The difference in percent inhibition may have been due to climatic conditions and geographical distributions. The TAC value indicates the potential of extracts to reduce from a Mo (VI) form to a Mo (V) form. The TAC of BR and WR was observed to be 0.9–6.8 mg AAE/g. The TAC for black rye extracts was observed as: WRE (6.8 mg AAE/g), ERE (1.8 mg AAE/g), MRE (3.9 mg AAE/g), ARE (1.7 mg AAE/g), AMRE (4.9 mg AAE/g) and BRE (0.9 mg AAE/g). Similarly, the TAC in white rye extracts was observed as: WRE (6.1 mg AAE/g), ERE (1.6 mg AAE/g), MRE (3.9 mg AAE/g), ARE (1.6 mg AAE/g), AMRE (4.5 mg AAE/g) and BRE (0.9 mg AAE/g). The FRAP of BR and WR extracts (WRE, ERE, MRE, ARE, AMRE and BRE) ranged from 1.1–8.2 mg FeSO4·7H2O equivalent/g. The lowest value was observed in white rye flour extracted with benzene (1.1 mg FeSO4·7H2O equivalent/g), whereas a higher FRAP was observed in black rye flour extracted with water (8.2 mg FeSO4·7H2O equivalent/g). The FRAP value of an extract represents its capability to reduce Fe3+ to Fe2+. Kulichova et al. [12] studied FRAP values of rye extracts that ranged from 2.27–5.36 mg Trolox equivalent/g. The RPA values of different rye extracts ranged from 0.7 to 8.7 mg QE/g. Kulichova et al. [12] reported a reducing power value of rye extracts in the range of 0.87–20.1 mg Trolox equivalent/g.
Table 4.
Antioxidant properties shown by rye extracts during different assays.
3.4. Relationship between Bioactive Compounds and Antioxidant Properties
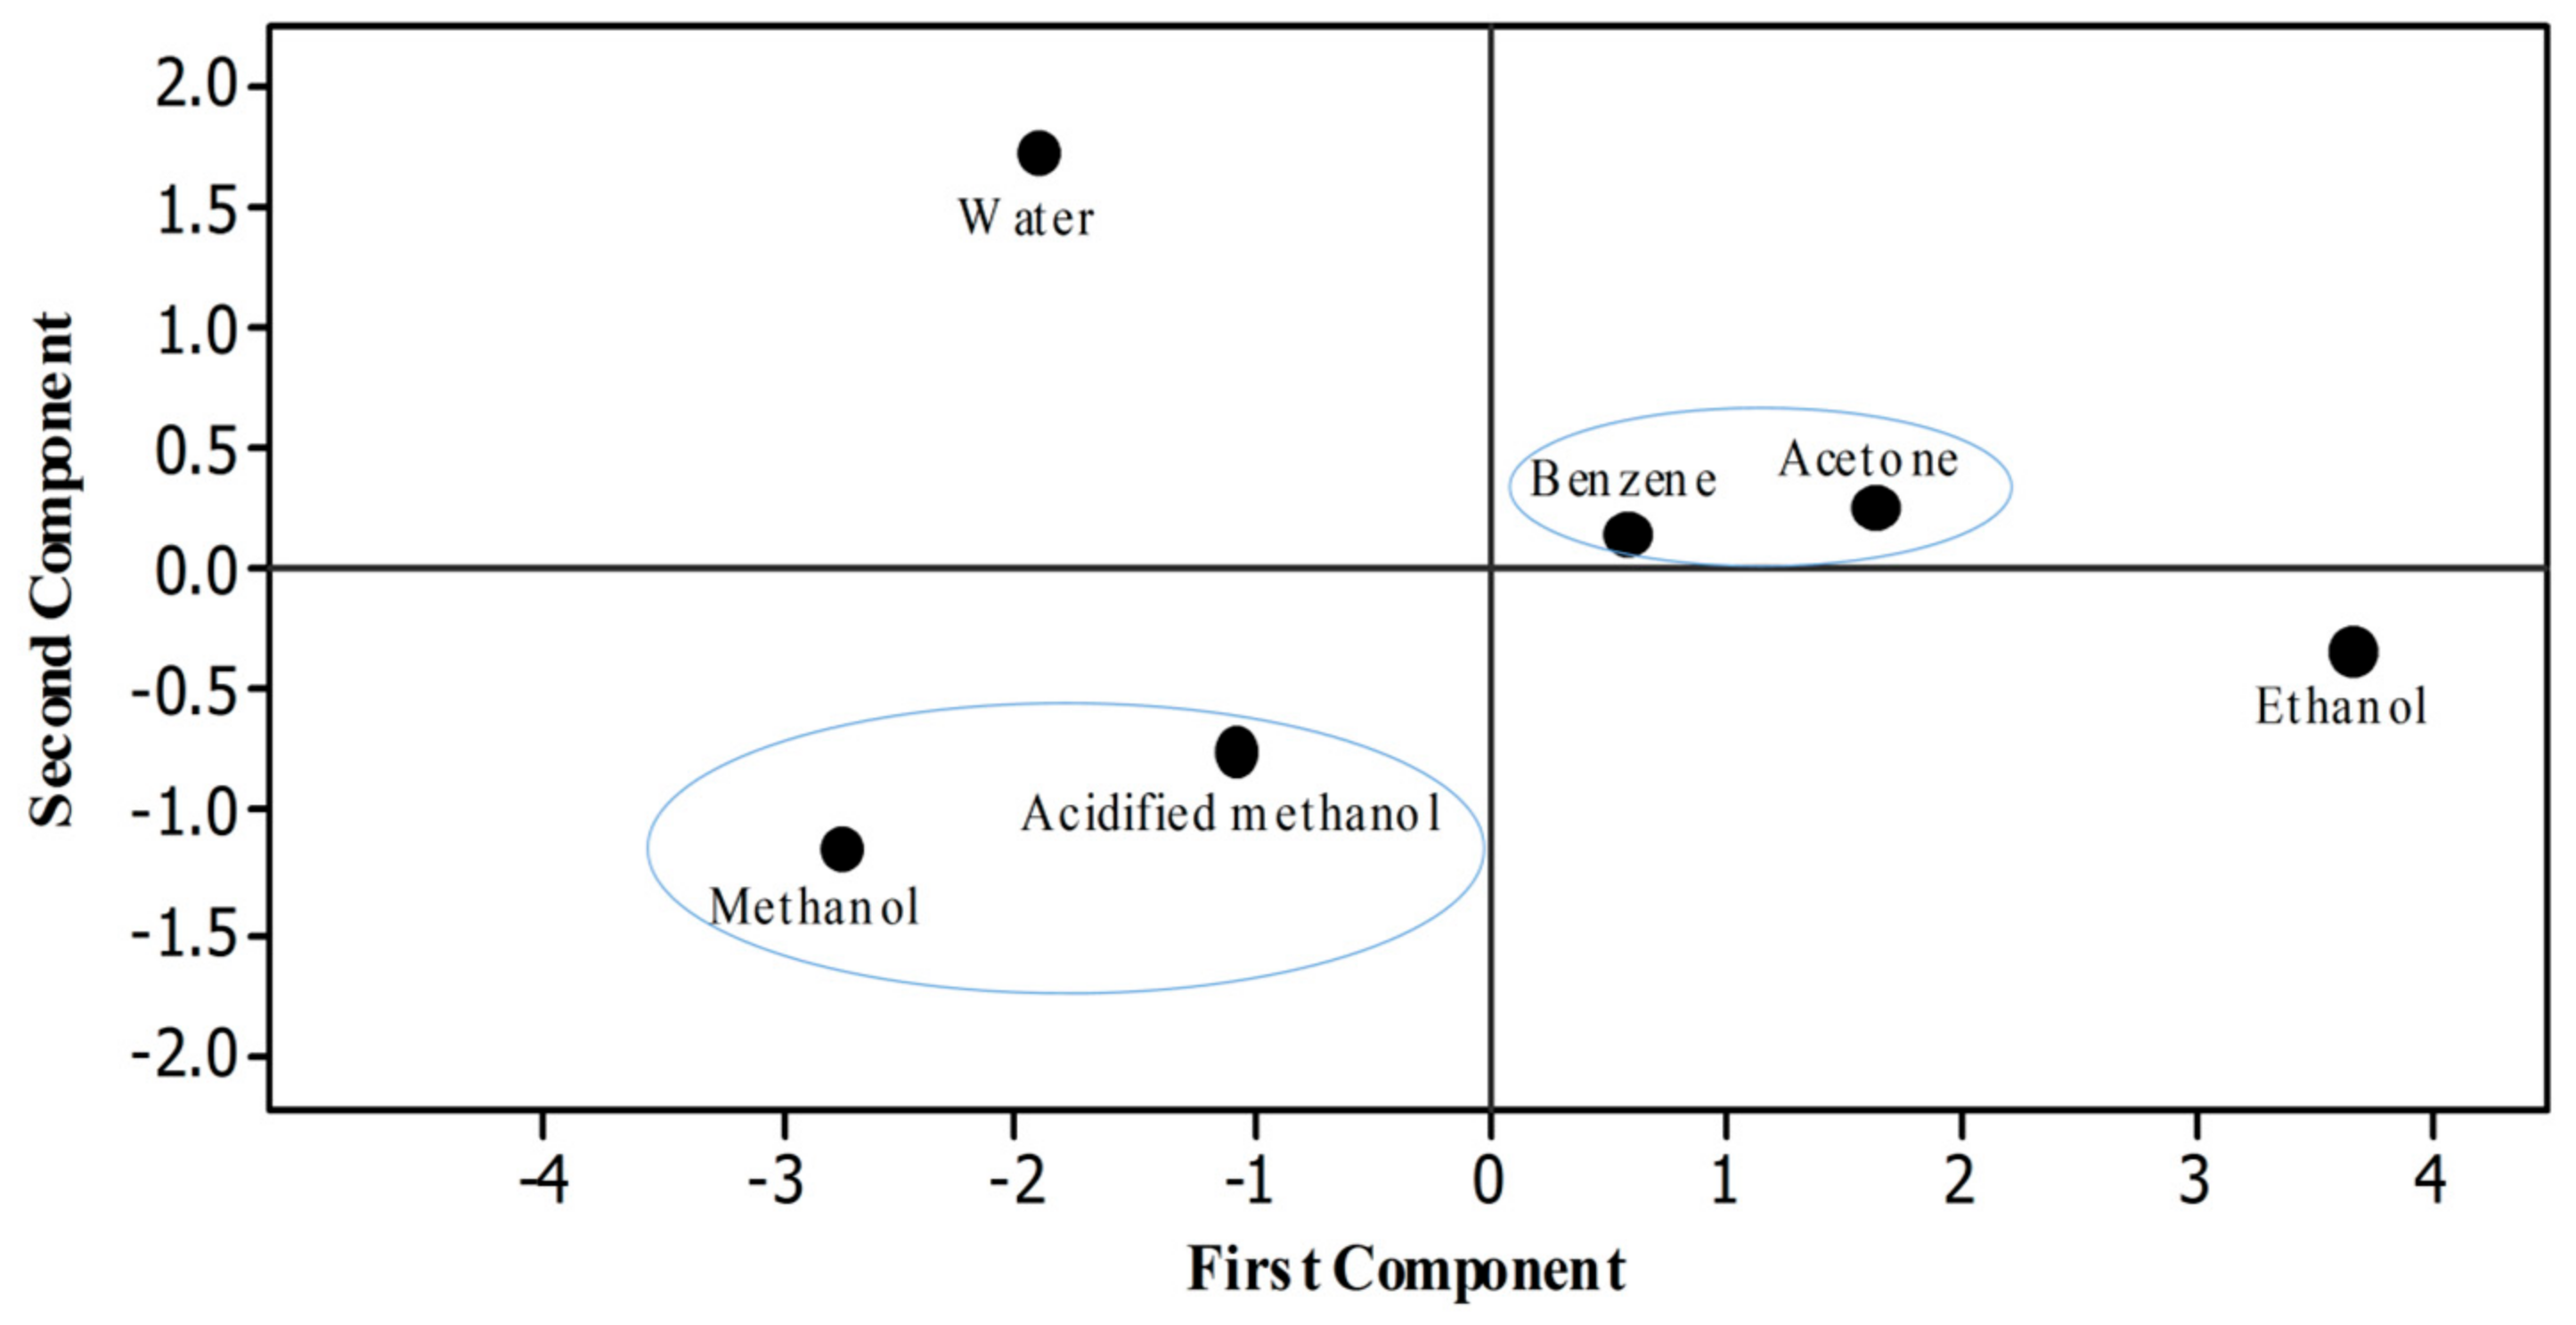
Statistical software Minitab was used to draw a score plot. Six different dots were recorded that indicated the efficacy of different solvents used to extract rye phenolics in the present study (Figure 4). To ease understanding, two different circles were drawn in which the properties or solvents that have positive relationships to each other are shown inside each circle. Pearson analysis was done to evaluate the correlation among different properties of rye extracts. Significant correlation was observed between the TPC and antioxidant assays (FRAP, r = 0.992 p < 0.01; TAC, r = 0.990; RPA, r = 0.969 p < 0.01; DPPH, r = 0.968 p < 0.01; ABTS, r = 0.882 p < 0.01) (Table 5).
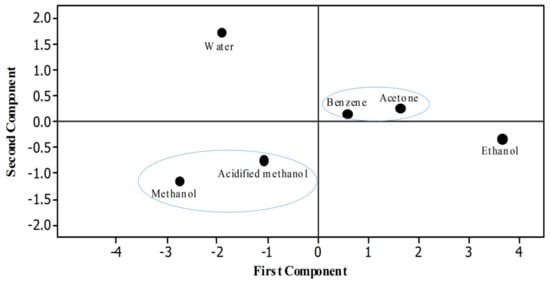
Figure 4.
Score plot.
Table 5.
Correlation between different properties of rye extracts.
3.5. DNA Damage Protection Potential (DDPP)
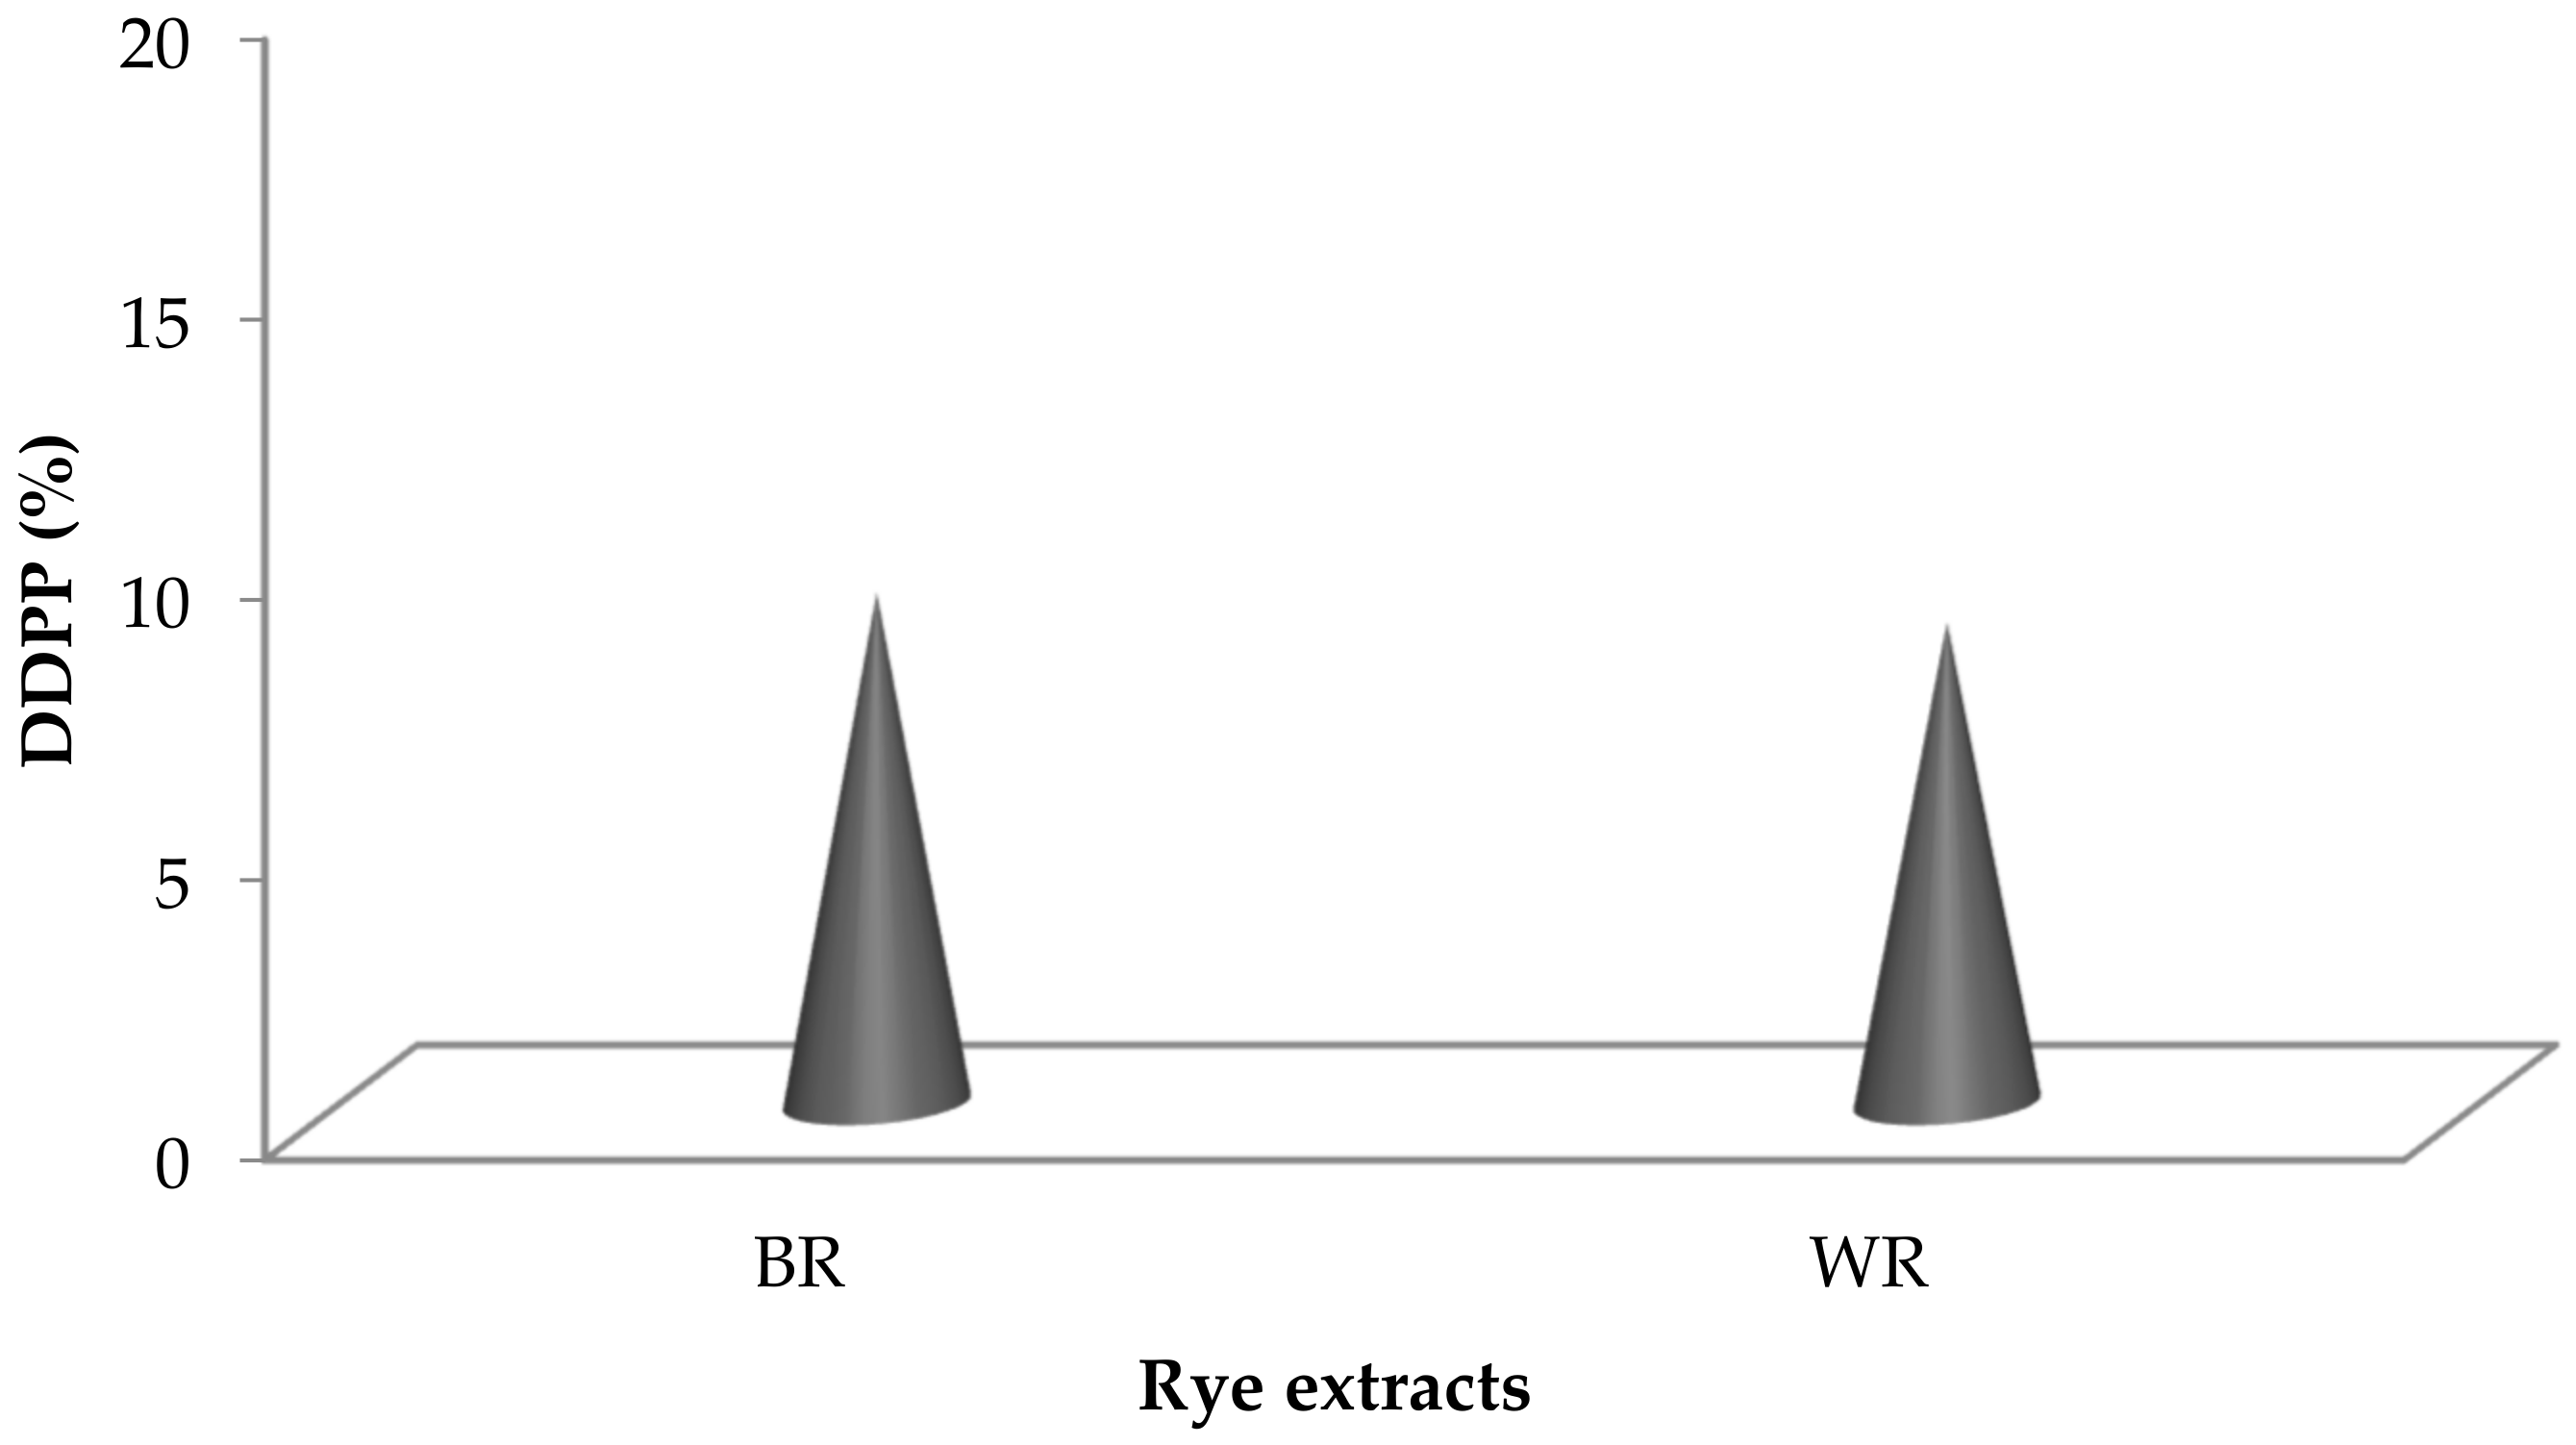
Fenton’s reagent is extensively used as a DNA degrading agent [45,61] during DDPPA. Rye extracts prepared using water were subjected to DNA protection against the damaging activity of Fenton’s reagent on pBR322 (model DNA). Non-availability of bands during gel electrophoresis confirmed the damaging activity, whereas their appearance showed the presence of DDPP. The DDPP of rye extracts during electrophoresis is represented in Figure 5, shown by the appearance of bands in Lane 4 and Lane 5. Figure 6 represents the DDPP (%) of aqueous rye extracts. Published literature has also confirmed the presence of DDPP in extracts prepared from various botanical resources [45,62]. However, no report on DDPP in rye extracts has previously been published.
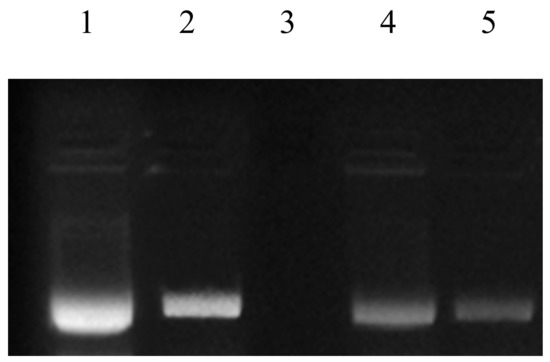
Figure 5.
DNA damage protection activities in rye extracts against Fenton’s reagent. Lane 1: native pBR 322 plasmid DNA; Lane 2: DNA + Fenton’s reagent + Quercetin (mg/mL positive control); Lane 3: DNA + Fenton’s reagent; Lane 4: DNA + Fenton’s reagent + WRE (Black); Lane 5: DNA + Fenton’s reagent + WRE (White).

Figure 6.
DDPP (%) in rye extracts.
4. Conclusions
Comparison of different solvents (water, ethanol, methanol, acetone, acidified methanol and benzene) indicates water to be an efficient solvent for the liberation of phenolic compounds from selected rye cultivars. Maximum antioxidant properties were also observed in water extracts. The presence of specific phytochemicals in rye flour makes it a health-benefiting substrate that can be used in the preparation of various products for human use. For processing flour, the major solvent used at the domestic as well as the commercial scale is water. Efficacy of water for phenolic extraction from rye flour could prove important from an industrial point of view, as it is easily available and cost effective.
Author Contributions
P.K.: Conceptualization, methodology, investigation, resources and writing—Original draft preparation; K.S.S.: Formal analysis, Supervision, Visualization and Conceptualization, S.P.B.: Formal analysis, data curation, software. S.S.P.: Methodology, Writing—review and editing and visualization; M.K.: Formal analysis; R.A.I.: Writing—review & editing, Funding acquisition; M.R.M.A.: Writing—review & editing, Funding acquisition; M.R.R.: Writing—review & editing, Funding acquisition. All authors have read and agreed to the published version of the manuscript.
Funding
This research received no external funding.
Institutional Review Board Statement
Not applicable.
Informed Consent Statement
Not applicable.
Data Availability Statement
Data is contained within the article.
Acknowledgments
This research was supported by Universiti Kebangsaan Malaysia, PP/LESTARI/2021 and XX-2018-008.
Conflicts of Interest
The authors declare that they have no conflict of interest.
Abbreviations
WRE: Water rye extract; ERE: Ethanol rye extract; MRE: Methanol rye extract; ARE: Acetone rye extract; AMRE: Acidified methanol rye extract; BRE: Benzene rye extract; GAE: Gallic acid equivalent; AAE: Ascorbic acid equivalent; QE: Quercetin equivalent; BR: Black rye; WR: White rye; FSE: Ferrous sulfate equivalent.
References
- Kaur, P.; Purewal, S.S.; Sandhu, K.S.; Kaur, M.; Salar, R.K. Millets: A cereal grain with potent antioxidants and health benefits. J. Food Meas. Charact. 2019, 13, 793–806. [Google Scholar] [CrossRef]
- Salar, R.K.; Purewal, S.S.; Sandhu, K.S. Fermented pearl millet (Pennisetum glaucum) with in vitro DNA damage protection activity, bioactive compounds and antioxidant potential. Food Res. Int. 2017, 100, 204–210. [Google Scholar] [CrossRef] [PubMed]
- Senser, H.A.; Hawkes, J.G. On the origin of cultivated rye. Biol. J. Linn. Soc. 1980, 13, 299–313. [Google Scholar] [CrossRef]
- Wrigley, C.W.; Bushuk, W. Rye and triticale: Characteristics and quality requirements. In Cereal Grains: Assessing and Managing Quality; Wrigley, C.W., Batey, I.L., Eds.; Woodhead: Washington, DC, USA, 2010; p. 532. [Google Scholar]
- Bushuk, W. Rye production and uses worldwide. Cereal Food World 2001, 46, 70–73. [Google Scholar]
- Crespo-Herrera, L.A.; Garkava-Gustavsson, L.; Ahman, I. A systematic review of rye (Secale cereale L.) as a source of resistance to pathogens and pests in wheat (Triticum aestivum L.). Hereditas 2017, 154, 14. [Google Scholar] [CrossRef]
- Torrinha, A.; Oliveira, M.; Marinho, S.; Paiga, P.; Delerue-Matos, C.; Morais, S. Mineral Content of Various Portuguese Breads: Characterization, Dietary Intake, and Discriminant Analysis. Molecules 2019, 24, 2787. [Google Scholar] [CrossRef] [PubMed] [Green Version]
- Rodehutscord, M.; Ruckert, C.; Maurer, H.P.; Schenkel, H.; Schipprack, W.; Bach Knudsen, K.E.; Schollenberger, M.; Laux, M.; Eklund, M.; Siegert, W.; et al. Variation in chemical composition and physical characteristics of cereal grains from different genotypes. Arch. Anim. Nutr. 2016, 70, 87–107. [Google Scholar] [CrossRef] [PubMed]
- Zuber, T.; Miedaner, T.; Rosenfelder, P.; Rodehutscord, M. Amino acid digestibility of different rye genotypes in caecectomised laying hens. Arch. Anim. Nutr. 2016, 70, 470–487. [Google Scholar] [CrossRef]
- Bondia-Pons, I.; Aura, A.M.; Vuorela, S.; Kolehmainen, M.; Mykkanen, H.; Poutanen, K. Rye phenolics in nutrition and health. J. Cereal Sci. 2009, 49, 323–336. [Google Scholar] [CrossRef]
- Nystrom, L.; Lampi, A.M.; Andersson, A.A.; Kamal-Eldin, A.; Gebruers, K.; Courtin, C.M.; Delcour, J.A.; Li, L.; Ward, J.L.; Fras, A.; et al. Phytochemicals and dietary fiber components in rye varieties in the HELTHGRAIN Diversity Screen. J. Agric. Food Chem. 2008, 56, 9758–9766. [Google Scholar] [CrossRef]
- Kulichova, K.; Sokol, J.; Nemecek, P.; Maliarova, M.; Maliar, T.; Havrlentova, M.; Kraic, J. Phenolic compounds and biological activities of rye (Secale cereale L.) grains. Open Chem. 2019, 17, 988–999. [Google Scholar] [CrossRef]
- Ross, A.B.; Kamal-Eldin, A.; Aman, P. Diet alkylresorcinols: Absorption, bioactivities, and possible use as biomarkers of whole-grain wheat and rye-rich foods. Nutr. Rev. 2004, 62, 81–95. [Google Scholar] [CrossRef]
- Andreasen, M.F.; Landbo, A.K.; Christensen, L.P.; Hansen, A.; Meyer, A.S. Antioxidant effects of phenolic rye (Secale cereale L.) extracts, monomeric hydroxycinnamates, and ferulic acid dehydrodimers on human low-density lipoproteins. J. Agric. Food Chem. 2001, 49, 4090–4096. [Google Scholar] [CrossRef]
- Liu, X.; Dong, M.; Chen, X.; Jiang, M.; Lv, X.; Yan, G. Antioxidant activity and phenolics of an endophytic Xylaria sp. from Ginkgo biloba. Food Chem. 2007, 105, 548–554. [Google Scholar] [CrossRef]
- Mattila, P.; Pihlava, J.M.; Hellstrom, J. Contents of phenolic acids, alkyl- and alkenylresorcinols, and avenanthramides in commercial grain products. J. Agric. Food Chem. 2005, 53, 8290–8295. [Google Scholar] [CrossRef]
- Michalska, A.; Ceglinska, A.; Zielinski, H. Bioactive compounds in rye flours with different extraction rates. Eur. Food Res. Technol. 2007, 225, 545–551. [Google Scholar] [CrossRef]
- Heinio, R.L.; Liukkonen, K.H.; Myllymaki, O.; Pihlava, J.M.; Adlercreutz, H.; Heinonen, S.M.; Poutanen, K. Quantities of phenolic compounds and their impacts on the perceived flavour attributes of rye grain. J. Cereal Sci. 2008, 47, 566–575. [Google Scholar] [CrossRef]
- Manach, C.; Scalbert, A.; Morand, C.; Remesy, C.; Jimenez, L. Polyphenols: Food sources and bioavailability. Am. J. Clin. Nutr. 2004, 79, 727–747. [Google Scholar] [CrossRef] [PubMed] [Green Version]
- Purewal, S.S.; Salar, R.K.; Bhatti, M.S.; Sandhu, K.S.; Singh, S.K.; Kaur, P. Solid-state fermentation of pearl millet with Aspergillus oryzae and Rhizopus azygosporus: Effects on bioactive profile and DNA damage protection activity. J. Food Meas. Charact. 2020, 14, 150–162. [Google Scholar] [CrossRef]
- Pinto, D.; Vieira, E.; Peixoto, A.F.; Freire, C.; Freitas, V.; Costa, P.; Delerue-Matos, C.; Rodrigues, F. Optimizing the extraction of phenolic antioxidants from chestnut shells by subcritical water extraction using response surface methodology. Food Chem. 2020, 334, 127521. [Google Scholar] [CrossRef]
- Sanchez-Reinoso, Z.; Mora-Adames, W.I.; Fuenmayor, C.A.; Darghan-Contreras, A.E.; Gardana, C.; Gutierrez, L.F. Microwave-assisted extraction of phenolic compounds from Sacha Inchi shell: Optimization, physicochemical properties and evaluation of their antioxidant activity. Chem. Eng. Process 2020, 153, 107922. [Google Scholar] [CrossRef]
- Wu, L.; Li, L.; Chen, S.; Wang, L.; Lin, X. Deep eutectic solvent-based ultrasonic-assisted extraction of phenolic compounds from Moringa oleifera L. leaves: Optimization, comparison and antioxidant activity. Sep. Purif. Technol. 2020, 247, 117014. [Google Scholar] [CrossRef]
- Chakraborty, S.; Uppaluri, R.; Das, C. Optimization of Ultrasound-assisted Extraction (UAE) Process for the Recovery of Bioactive Compounds from Bitter Gourd using Response Surface Methodology (RSM). Food Bioprod. Process. 2020, 120, 114–122. [Google Scholar] [CrossRef]
- Ahmad Jelani, N.A.; Azlan, A.; Khoo, H.E.; Razman, M.R. Fatty acid profile and antioxidant properties of oils extracted from dabai pulp using supercritical carbon dioxide extraction. Int. Food Res. J. 2019, 26, 1587–1598. [Google Scholar]
- Azman, N.F.I.N.; Azlan, A.; Khoo, H.E.; Razman, M.R. Antioxidant properties of fresh and frozen peels of citrus species. Curr. Res. Nutr. Food Sci. 2019, 7, 331–339. [Google Scholar] [CrossRef] [Green Version]
- Aziz, N.S.; Sofian-Seng, N.S.; Wan Mustapha, W.A. Functional properties of oleoresin extracted from white pepper (Piper nigrum L.) retting waste water. Sains Malays. 2018, 47, 2009–2015. [Google Scholar] [CrossRef]
- Chemah, T.C.; Aminah, A.; Noreham, A.; Wan Aida, W.M. Antioxidant activity and color of red pitaya puree muffin (Hilosereus polirhizus). Sains Malays. 2011, 40, 431–436. [Google Scholar]
- Abdul Rehman, H.; Saari, N.; Abas, F.; Ismail, A.; Mamtaz, M.W.; Abdul Hamid, A. Anti-obesity and antioxidant activities of selected medicinal plant and phytochemical profiling of bioactive compounds. Int. J. Food Prop. 2017, 20, 2616–2629. [Google Scholar] [CrossRef]
- Trease, G.E.; Evans, E.C. Pharmacognosy, 13th ed.; Bailliere Tindall: London, UK, 1996; pp. 282–396. [Google Scholar]
- Yu, L.; Haley, S.; Perret, J.; Harris, M. Comparison of wheat flours grown at different locations for their antioxidant properties. Food Chem. 2004, 86, 11–16. [Google Scholar] [CrossRef]
- Yen, G.C.; Chen, H.Y. Antioxidant activity of various tea extracts in relation to their antimutagenicity. J. Agric. Food Chem. 1995, 43, 27–32. [Google Scholar] [CrossRef]
- Re, R.; Pellegrini, N.; Proteggente, A.; Pannala, A.; Yang, M.; Rice-Evans, C. Antioxidant activity applying an improved ABTS radical cation decolorization assay. Free Radic. Biol. Med. 1999, 26, 1231–1237. [Google Scholar] [CrossRef]
- Prieto, P.; Pineda, M.; Aguilar, M. Spectrophotometric Quantitation of Antioxidant Capacity through the Formation of a Phosphomolybdenum Complex: Specific Application to the Determination of Vitamin E. Anal. Biochem. 1999, 269, 337–341. [Google Scholar] [CrossRef]
- Oyaizu, M. Studies on products of browning reaction: Antioxidative activity of products of browning reaction. Jpn. J. Nutr. Diet. 1986, 44, 307–315. [Google Scholar] [CrossRef] [Green Version]
- Benzie, I.F.F.; Strain, J.J. The ferric reducing activity of plasma (FRAP) as a measure of antioxidant power: The FRAP assay. Anal. Biochem. 1996, 239, 70–76. [Google Scholar] [CrossRef] [Green Version]
- Julkunen-Tiitto, R. Phenolic constituents in the leaves of northern willows: Methods for the analysis of certain phenolics. J. Agric. Food Chem. 1985, 33, 213–217. [Google Scholar] [CrossRef]
- Kumar, V.; Lemos, M.; Sharma, M.; Shriram, V. Antioxidant and DNA damage protection activities of Eulophia nuda Lindl. Free Radic. Antioxid. 2013, 3, 55–60. [Google Scholar] [CrossRef] [Green Version]
- Mishra, L.K.; Sarkar, D.; Zwinger, S.; Shetty, K. Phenolic antioxidant-linked anti-hyperglycemic properties of rye cultivars grown under conventional and organic production systems. J. Cereal Sci. 2017, 76, 108–115. [Google Scholar] [CrossRef]
- Zieliński, H.; Ceglińska, A.; Michalska, A. Antioxidant contents and properties as quality indices of rye cultivars. Food Chem. 2007, 104, 980–988. [Google Scholar] [CrossRef]
- Ragaee, S.; Abdelaal, E.; Noaman, M. Antioxidant activity and nutrient composition of selected cereals for food use. Food Chem. 2006, 98, 32–38. [Google Scholar] [CrossRef]
- Pihlava, J.M.; Nordlund, E.; Heiniö, R.L.; Hietaniemi, V.; Lehtinen, P.; Poutanen, K. Phenolic compounds in wholegrain rye and its fractions. J. Food Compos. Anal. 2015, 38, 89–97. [Google Scholar] [CrossRef]
- Aoussar, N.; Rhallabi, N.; AitMhand, R.; Manzali, R.; Bouksaim, M.; Douira, A.; Mellouki, F. Seasonal variation of antioxidant activity and phenolic content of Pseudeverniafurfuracea, Evernia prunastri and Ramalinafarinacea from Morocco. J. Saudi Soc. Agric. Sci. 2020, 19, 1–6. [Google Scholar]
- Shi, B.; Zhang, W.; Li, X.; Pan, X. Seasonal variations of phenolic profiles and antioxidant activity of walnut (Juglans sigillata Dode) green husks. Int. J. Food Prop. 2018, 20, 2635–2646. [Google Scholar] [CrossRef] [Green Version]
- Salar, R.K.; Purewal, S.S. Phenolic content, antioxidant potential and DNA damage protection of pearl millet (Pennisetum glaucum) cultivars of North Indian region. J. Food Meas. Charact. 2017, 11, 126–133. [Google Scholar] [CrossRef]
- Teixeira, E.W.; Message, D.; Negri, G.; Salatino, A.; Stringheta, P.C. Seasonal variation, chemical composition and antioxidant activity of Brazilian Propolis samples. Evid.-Based Complement. Altern. Med. 2010, 7, 307–315. [Google Scholar] [CrossRef]
- Andreasen, M.F.; Christensen, L.P.; Meyer, A.S.; Hansen, A. Content of phenolic acids and ferulic acid dehydrodimers in 17 rye (Secale cereale L.) varieties. J. Agric. Food Chem. 2000, 48, 2837–2842. [Google Scholar] [CrossRef] [PubMed]
- Andreasen, M.F.; Christensen, J.; Meyer, A.S.; Hansen, A. Ferulic acid dehydrodimers in rye (Secale cereale L.). J. Cereal Sci. 2000, 31, 303–307. [Google Scholar] [CrossRef]
- Glitso, L.V.; Bach Knudsen, K.E. Milling of whole grain rye to obtain fractions with different dietary fibre characteristics. J. Cereal Sci. 1999, 29, 89–97. [Google Scholar] [CrossRef]
- Aura, A.M. Phenolic Acids in Rye. In Rye and Health; Woodhead Publishing: Sawston, UK, 2014; pp. 109–119. [Google Scholar]
- Sandhu, K.S.; Kaur, P.; Siroha, A.K.; Purewal, S.S. Phytochemicals and antioxidant properties in pearl millet: A cereal grain with potential applications. In Pearl Millet: Properties, Functionality and its Applications, 1st ed.; CRC Press: Boca Raton, FL, USA, 2020; pp. 33–50. [Google Scholar]
- Lim, D.Y.; Shin, S.H.; Lee, M.H.; Malakhova, M.; Kurinov, I.; Wu, Q.; Xu, J.; Jiang, Y.; Dong, Z.; Liu, K.; et al. A natural small molecule, catechol, induces c-Myc degradation by directly targeting ERK2 in lung cancer. Oncotarget 2016, 7, 35001–35014. [Google Scholar] [CrossRef] [PubMed]
- Shoeb, A.; Chowta, M.; Pallempati, G.; Rai, A.; Singh, A. Evaluation of antidepressant activity of vanillin in mice. Indian J. Pharmacol. 2013, 45, 141–144. [Google Scholar]
- Zdunska, K.; Dana, A.; Kolodziejczak, A.; Rotsztejn, H. Antioxidant properties of ferulic acid and its possible application. Skin Pharmacol. Physiol. 2018, 31, 332–336. [Google Scholar] [CrossRef]
- Li, Y.; Yao, J.; Han, C.; Yang, J.; Chaudhry, M.T.; Wang, S.; Liu, H.; Yin, Y. Quercetin, inflammation and immunity. Nutrients 2016, 8, 167. [Google Scholar] [CrossRef] [PubMed]
- David, A.V.A.; Arulmoli, R.; Parasuraman, S. Overviews of biological importance of quercetin: A Bioactive Flavonoid. Pharmacogn. Rev. 2016, 10, 84–89. [Google Scholar]
- Mao, X.; Yang, Q.; Chen, D.; Yu, B.; He, J. Benzoic acid used as food and feed additives can regulate gut functions. BioMed Res. Int. 2019, 2019, 5721585. [Google Scholar] [CrossRef] [Green Version]
- Tao, X.; Sun, Y.; Men, X.; Xu, Z. A compound plant extract and its antibacterial and antioxidant properties in vitro and in vivo. 3 Biotech 2020, 10, 532. [Google Scholar] [CrossRef] [PubMed]
- Das, S.; Ray, A.; Nasim, N.; Nayak, S.; Mohanty, S. Effect of different extraction techniques on total phenolic and flavonoid contents, and antioxidant activity of betelvine and quantification of its phenolic constituents by validated HPTLC method. 3 Biotech 2019, 9, 37. [Google Scholar] [CrossRef]
- Alfatemi, S.M.H.; Rad, J.S.; Rad, M.S.; Mohsenzadeh, S.; Da Silva, J.A.T. Chemical composition, antioxidant activity and in vitro antibacterial activity of Achillea wilhelmsii C. Koch essential oil on methicillin-susceptible and methicillin-resistant Staphylococcus aureus spp. 3 Biotech 2014, 5, 39–44. [Google Scholar] [CrossRef] [Green Version]
- Singh, S.; Kaur, M.; Sogi, D.S.; Purewal, S.S. A comparative study of phytochemicals, antioxidant potential and in-vitro DNA damage protection activity of different oat (Avena sativa) cultivars from India. J. Food Meas. Charact. 2018, 13, 347–356. [Google Scholar] [CrossRef]
- Chandrasekara, A.; Shahidi, F. Antiproliferative potential and DNA scission inhibitory activity of phenolics from whole millet grains. J. Funct. Foods 2011, 3, 159–170. [Google Scholar] [CrossRef]


Publisher’s Note: MDPI stays neutral with regard to jurisdictional claims in published maps and institutional affiliations. |
© 2021 by the authors. Licensee MDPI, Basel, Switzerland. This article is an open access article distributed under the terms and conditions of the Creative Commons Attribution (CC BY) license (https://creativecommons.org/licenses/by/4.0/).