


Abstract
Identifying real-world saturation points and grid-hosting capacity in mixed-use urban Renewable Energy Communities (RECs) requires dynamic spatial evaluation. To address this, this paper introduces a novel simulation framework that integrates GIS spatial analysis with an iterative heuristic selection algorithm. The proposed method evaluates the energetic interaction between a primary generation node and surrounding consumers, utilizing a dynamic function to calculate the collective Self-Consumption Rate (SCR). Applied to the Flaminio Stadium in Rome, the model incrementally aggregates users to determine the optimal cluster size for economic feasibility. The results demonstrate that the heuristic selection algorithm successfully refined the community from an initial pool of 854 buildings to an optimal cluster of 734. This targeted selection eliminated energy surplus and achieved a near-perfect collective SCR of 99.8%. Furthermore, by strategically reducing the required installed PV capacity by 52.6%, the initial capital investment dropped from € 89.9 million to € 42.6 million, significantly de-risking the project while maintaining a competitive payback period of approximately 13 years. Ultimately, this study presents a scalable spatial optimization tool that empowers decision makers to transform large-scale urban infrastructure into the energetic and economic engines of district wide decarbonization
1. Introduction
The global energy sector is currently undergoing a structural and irreversible metamorphosis, transitioning from the 20th-century model of centralized, fossil fuel-dependent generation toward a polycentric, decentralized framework powered by a Renewable Energy System (RES) [1,2]. This transition is not a technical adjustment but a fundamental socio-technical realignment, codified by the European Union through the Renewable Energy Directive (RED II, 2018/2001/EU) and reinforced by the REPowerEU Plan (2022) [3]. These regulatory frameworks have institutionalized the Renewable Energy Community (REC) as a pivotal vehicle for achieving climate neutrality by 2050 [4]. As analyzed by Ahmed et al. [5], RECs fundamentally redefine the role of the end user, facilitating the transition from passive consumers to active “prosumers” who democratize energy production and localize economic value. In the European context, the urgency of this transition has been amplified by geopolitical instabilities that have exposed the vulnerabilities of overreliance on external energy supplies [6,7]. However, the rapid transposition of these directives into national legislation has exposed a significant friction between regulatory idealism and the technical realities of dense urban fabrics [8,9]. Wierling et al. [10] emphasize that while the social appetite for energy cooperatives is burgeoning, the technical implementation in high-density metropolitan areas remains suboptimal. In this context, solar photovoltaics (PV) have emerged as the most widespread and strategically viable renewable energy technology for urban integration [11]. The dominance of PV within RECs is driven by its exceptional modularity, falling capital costs, and minimal maintenance requirements compared to other micro-generation technologies such as urban wind or biomass [12]. Unlike centralized power plants, PV systems can be seamlessly integrated into the existing built environment, utilizing rooftops, facades, and underutilized infrastructures, without requiring additional land consumption [13,14]. However, the intermittent nature of solar radiation necessitates advanced spatial planning to synchronize peak generation with the complex demand patterns of the city [15].
1.1. The Planning Paradox: The Knowledge Gap in Cluster Configuration
In the context of this study, the ‘Planning Paradox of RECs’ is not merely a rhetorical concept but is formally defined as a measurable, falsifiable condition: it occurs when the uncoordinated maximization of individual photovoltaic capacity at the building level leads to a direct degradation of the collective Self-Consumption Rate (SCR) and triggers physical congestion at the district’s primary substation [16,17,18]. As the community grows without a strategic matching of profiles, the shared energy surplus often flows back into the national grid during peak production hours, failing to provide the promised local benefits [19].
The primary methodological novelty of this research lies in the transition from descriptive mapping to prescriptive algorithmic optimization. While recent advances in GIS-based energy modeling by Caiaffa et al. [20] and Anselmo et al. [21] have significantly improved the precision of solar potential assessments, these tools remain largely diagnostic. As recently highlighted in the broader context of integrated energy systems, transitioning towards advanced algorithmic models is becoming increasingly essential to manage the inherent uncertainties and dynamic interactions within modern microgrids [22].
This study leverages QGIS as a multi-dimensional Decision Support System (DSS). QGIS serves as the optimal environment for integrating diverse spatial datasets, ranging from land-use and building footprints to high-resolution energy demand estimates derived from urban typologies [23]. By integrating Python 3.9.5 based iterative loops directly into the QGIS environment, this research executes a spatially explicit iterative heuristic selection algorithm.
1.2. The “Energy Core” Model: Infrastructure as a Catalyst
Central to this research is the introduction of the “Energy Core” model. In recent literature, the integration of a large-scale generation asset within a community is frequently conceptualized through ‘hub and spoke’ topologies or ‘anchor tenant’ models. While highly effective for optimizing physical microgrid sizing, these conventional models often assume high spatial availability and unconstrained grid-hosting capacities, making them difficult to directly transpose into dense, historically protected urban environments. In dense urban centers, individual residential rooftops are often insufficient to meet the aggregate demand of high-occupancy buildings due to the density to surface mismatch [24]. Therefore, the strategic utilization of underutilized large-scale public complex is paramount [25]. While recent work by Katsaprakakis et al. [26] has explored the transformation of sports facilities into zero-energy buildings, the role of such infrastructure as a strategic energy driver for neighborhood RECs remains under investigation. These facilities represent a significant untapped resource: they possess the spatial capacity for massive energy generation but often exhibit intermittent load profiles that do not coincide with peak solar hours, creating a massive potential for energy donation [27,28]. The research proposes a hierarchical model where a primary production node stabilizes the surrounding residential cluster.
1.3. Case Study: The Stadio Flaminio and Its Neighborhood
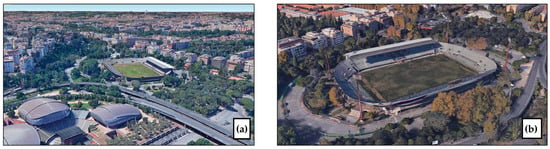
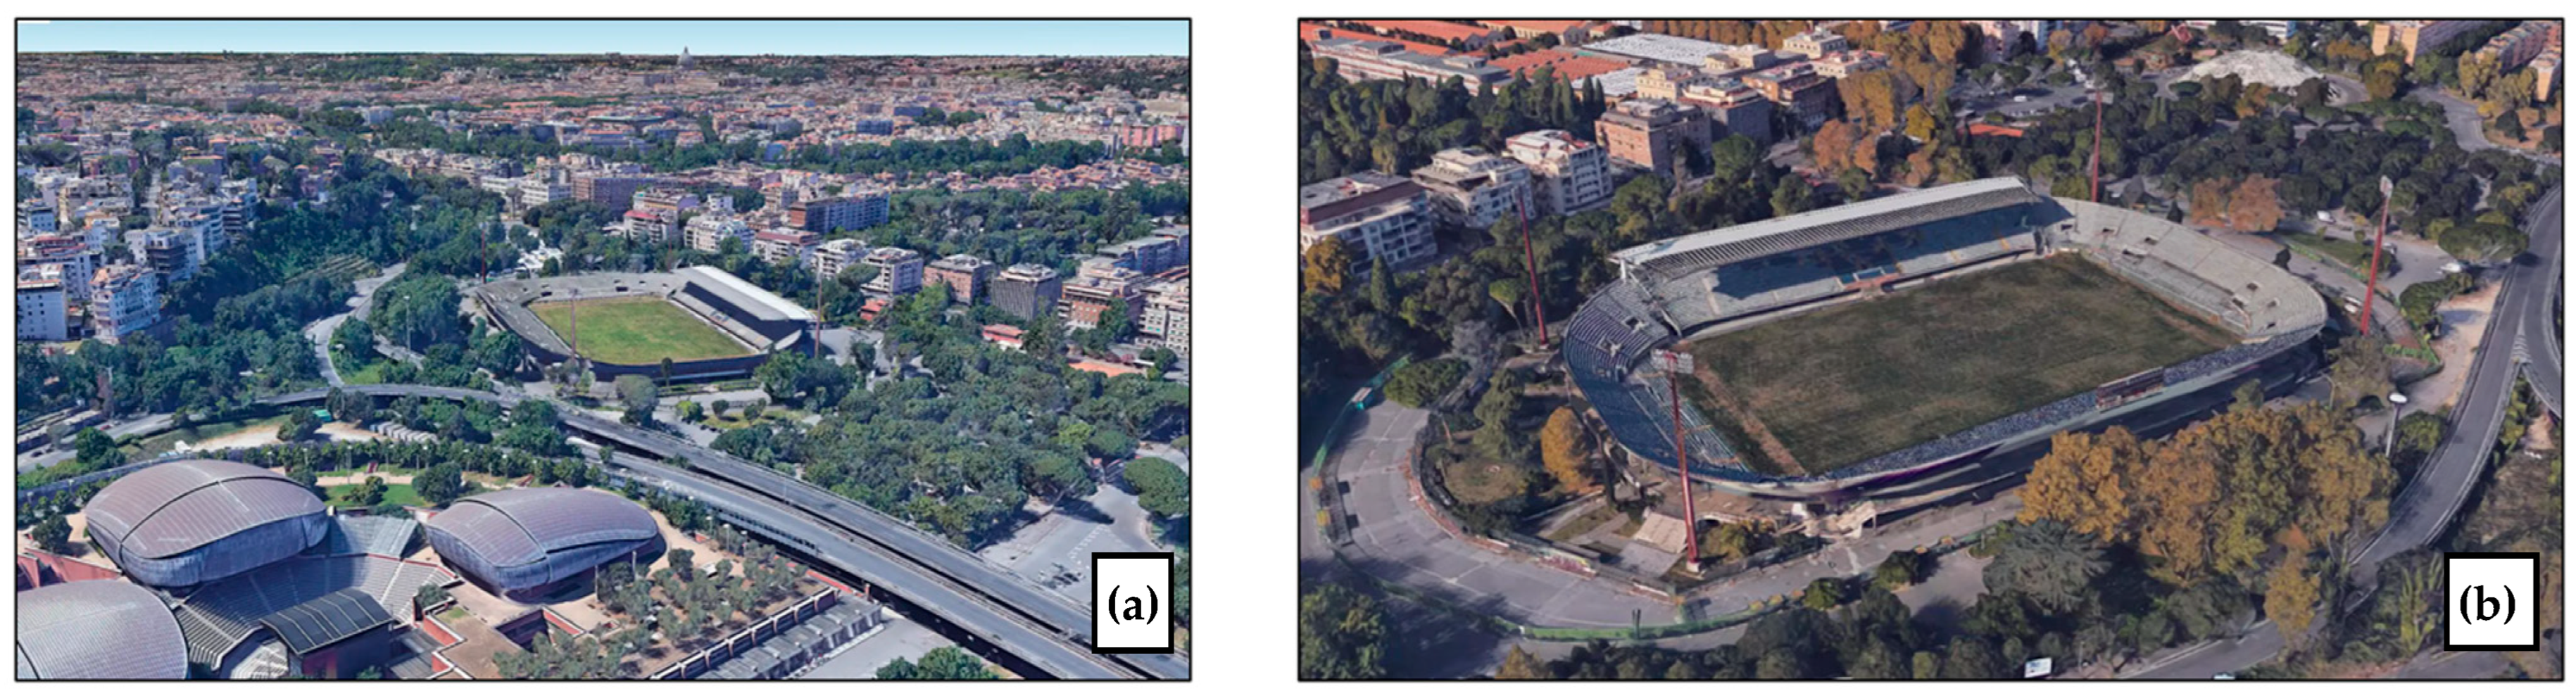
The operationalization of this methodology finds its ideal laboratory in the Flaminio Stadium in Rome (Figure 1). Designed by the master of structural engineering Pier Luigi Nervi and his son Antonio for the 1960 Olympics, the stadium is a testament to the mid-century Italian architectural renaissance. Its iconic reinforced concrete structure, though a masterpiece of rationalist design, has suffered from decades of abandonment, becoming a symbol of urban decay in one of Rome’s most culturally significant districts [29]. However, this state of dormancy is currently being challenged by a renewed political and entrepreneurial interest. Specifically, the football club S.S. Lazio has formally submitted a redevelopment proposal aimed at restoring the facility’s competitive status while strictly adhering to the heritage constraints imposed on Nervi’s work.
Figure 1.
Aerial views of the Flaminio Stadium: (a) the wider urban context showing the stadium’s integration within the Flaminio district; (b) a detailed view highlighting the current structural condition of the facility.
This potential acquisition introduces a critical variable to the district’s energy future. The modernization plan envisages the construction of a new coverage system for the stands to meet modern UEFA standards [30]. From an energy perspective, this architectural addition would represent an expansion of the available photovoltaic surface area while simultaneously introducing significant evening load peaks.
The Flaminio neighborhood itself is characterized by a high-density residential fabric with limited rooftop space and high energy intensity. Its expansive footprint offers a continuous surface for photovoltaic installation that far exceeds its current internal energy needs [31]. By positioning the stadium as the “Energy Core” of the REC, the proposed algorithm demonstrates how this single landmark can act as a Primary Energy Hub. The methodology developed in this study reconciles heritage preservation with energy engineering, providing a replicable roadmap for planners [32]. The stadium thus evolves into a power plant, fueling the decarbonization of the Flaminio district and providing a model for similar interventions across the European urban landscape.
1.4. Research Objectives and Paper Structure
This paper aims to contribute to the field of urban energy planning by presenting a novel, GIS-based heuristic selection workflow that addresses the current inefficiencies in REC design. The specific objectives are:
- To develop a QGIS Python iterative algorithm capable of selecting buildings based on load complementarity.
- To introduce and validate the Building Energy Ratio (BER) as a metric for urban cluster optimization.
- To quantify the impact of an Energy Core infrastructure (Flaminio Stadium) on the collective Self-Consumption Rate (SCR) of an urban district.
The remainder of this article is organized as follows: Section 2 details the Materials and Methods, including the data sources for Rome’s urban fabric and the technical logic of the optimization script. Section 3 presents the results and discussions of the Flaminio case study. Finally, Section 4 summarizes the conclusions and suggests future research directions.
2. Materials and Methods
2.1. Methodology
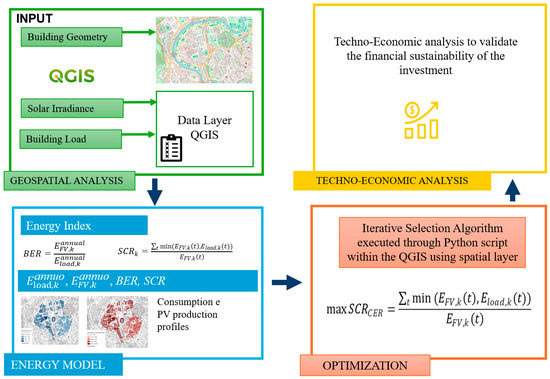
The proposed methodology is designed as a prescriptive geospatial optimization framework, aimed at creating decision making models for RECs. The operational workflow is structured into a logical sequence of four main phases:
- Geospatial analysis for the 3D reconstruction of the urban database.
- Energy modeling to define hourly loads based on ARERA usage profiles and solar potential via the static BER Index.
- Heuristic selection using iterative Python algorithms for dynamic matching.
- Techno-Economic analysis to validate the financial sustainability of the investment.
2.1.1. Geospatial Analysis and Database Construction
The first phase involves building a 3D GIS infrastructure capable of integrating geometric, topographic, and functional data. Starting from OpenStreetMap building footprints, the 3D urban morphology was reconstructed using a high-resolution Digital Surface Model (DSM) derived from open-source LiDAR. The DSM features a spatial resolution of 1 × 1 m and a vertical accuracy of approximately ±0.15 m. The primary processing step involved masking and clipping the raster DSM precisely to the vector building footprints to isolate the roof geometries and calculate heights, slopes, and aspect angles. Regarding uncertainty propagation, it must be acknowledged that while the high-resolution DSM accurately models macro shading from topography and adjacent buildings, a marginal degree of uncertainty remains regarding micro shading elements (such as thin antennas or HVAC units installed post-acquisition). The DSM is essential for estimating surface exposure, potential shading, and sky view factors.
For each building node k, morphological parameters such as orientation, slope, and effective installable area are calculated. In cases where functional data are missing, an automated classification is performed based on volumetric and morphological criteria to distinguish between residential, tertiary, and commercial uses.
2.1.2. Energy Modeling (BER and ARERA Data)
In this phase, hourly electrical production and consumption curves are generated for every building to verify the temporal compatibility between supply and demand. Using the r.sun algorithm within GRASS GIS, the model calculates direct, diffuse, and reflected solar radiation. The algorithm accounts for mutual shading between buildings and solar positioning at each time interval, resulting in a spatially explicit hourly generation vector for the entire year. The r.sun clear sky and overcast models have been extensively validated in the literature against empirical ground-station measurements, ensuring high reliability for the simulated irradiance vectors.
During the energy modeling phase, the system reconstructs the energy metabolism of each architectural volume. In this stage, each building is assigned a specific intended use (residential, office, commercial…), corresponding to differentiated consumption coefficients and load profiles derived from ARERA (Italian Regulatory Authority for Energy, Networks and the Environment) datasets [33,34]. This differentiation is crucial, as each usage category exhibits a specific demand curve (e.g., daytime peaks for offices and evening peaks for residential units). The building volume serves as a scaling parameter for these hourly load curves .
To evaluate the role of each building within a REC, two key performance indicators (KPIs) are introduced:
- The Building Energy Ratio (BER): static index based on annual values that relates the potential annual solar energy production to the specific annual energy demand of the building’s usage category:
This index allows for a preliminary classification of nodes into “net producers” (BER > 1) and “net consumers” (BER < 1) defining the initial energy vocation of each node within the district.
- 2.
- Self-Consumption Rate (SCR): dynamic index that measures the degree of simultaneity between production and demand at any time t:
2.1.3. Heuristic Selection Algorithm
The primary objective function of the algorithm is to maximize the collective Self-Consumption Rate over an entire year (8760 h), formulated as:
To avoid any methodological ambiguity, it is imperative to specify that the collective Self-Consumption Rate is computed strictly on an aggregated time-series basis, operating at an hourly resolution. At each hourly time step t, the algorithm aggregates the total photovoltaic generation of the entire community and instantaneously matches it against the community’s total aggregated load. This aggregated approach accurately simulates the physical energy sharing mechanism of the REC, allowing for synchronized compensation between nodes with localized surpluses and nodes with concurrent energy deficits.
Given the combinatorial explosion of evaluating all possible sub-clusters of nodes over 8760 h, a deterministic greedy heuristic was developed, which bypasses the high computational complexity while providing a near-optimal, bankable configuration in a fraction of the time.
The algorithm operates under strict formal constraints:
- Spatial/Regulatory constraint: all selected nodes must belong to the same Primary Substation.
- Grid constraint: instantaneous REC power injections must not exceed the local feeder capacity.
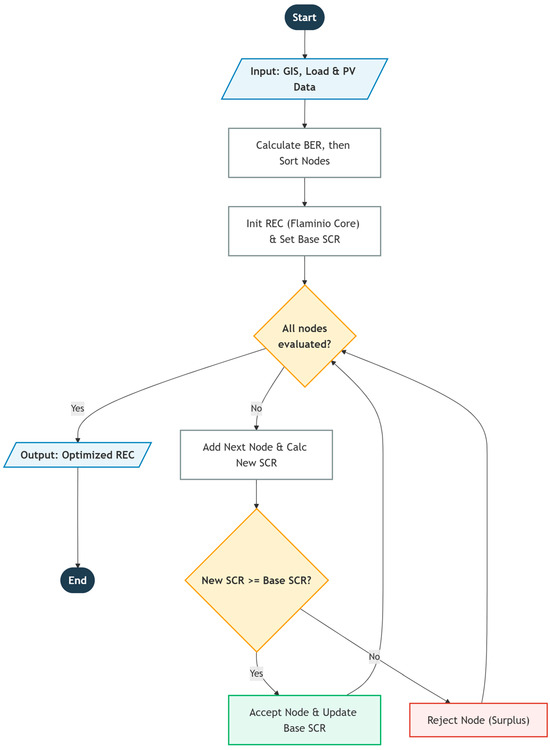
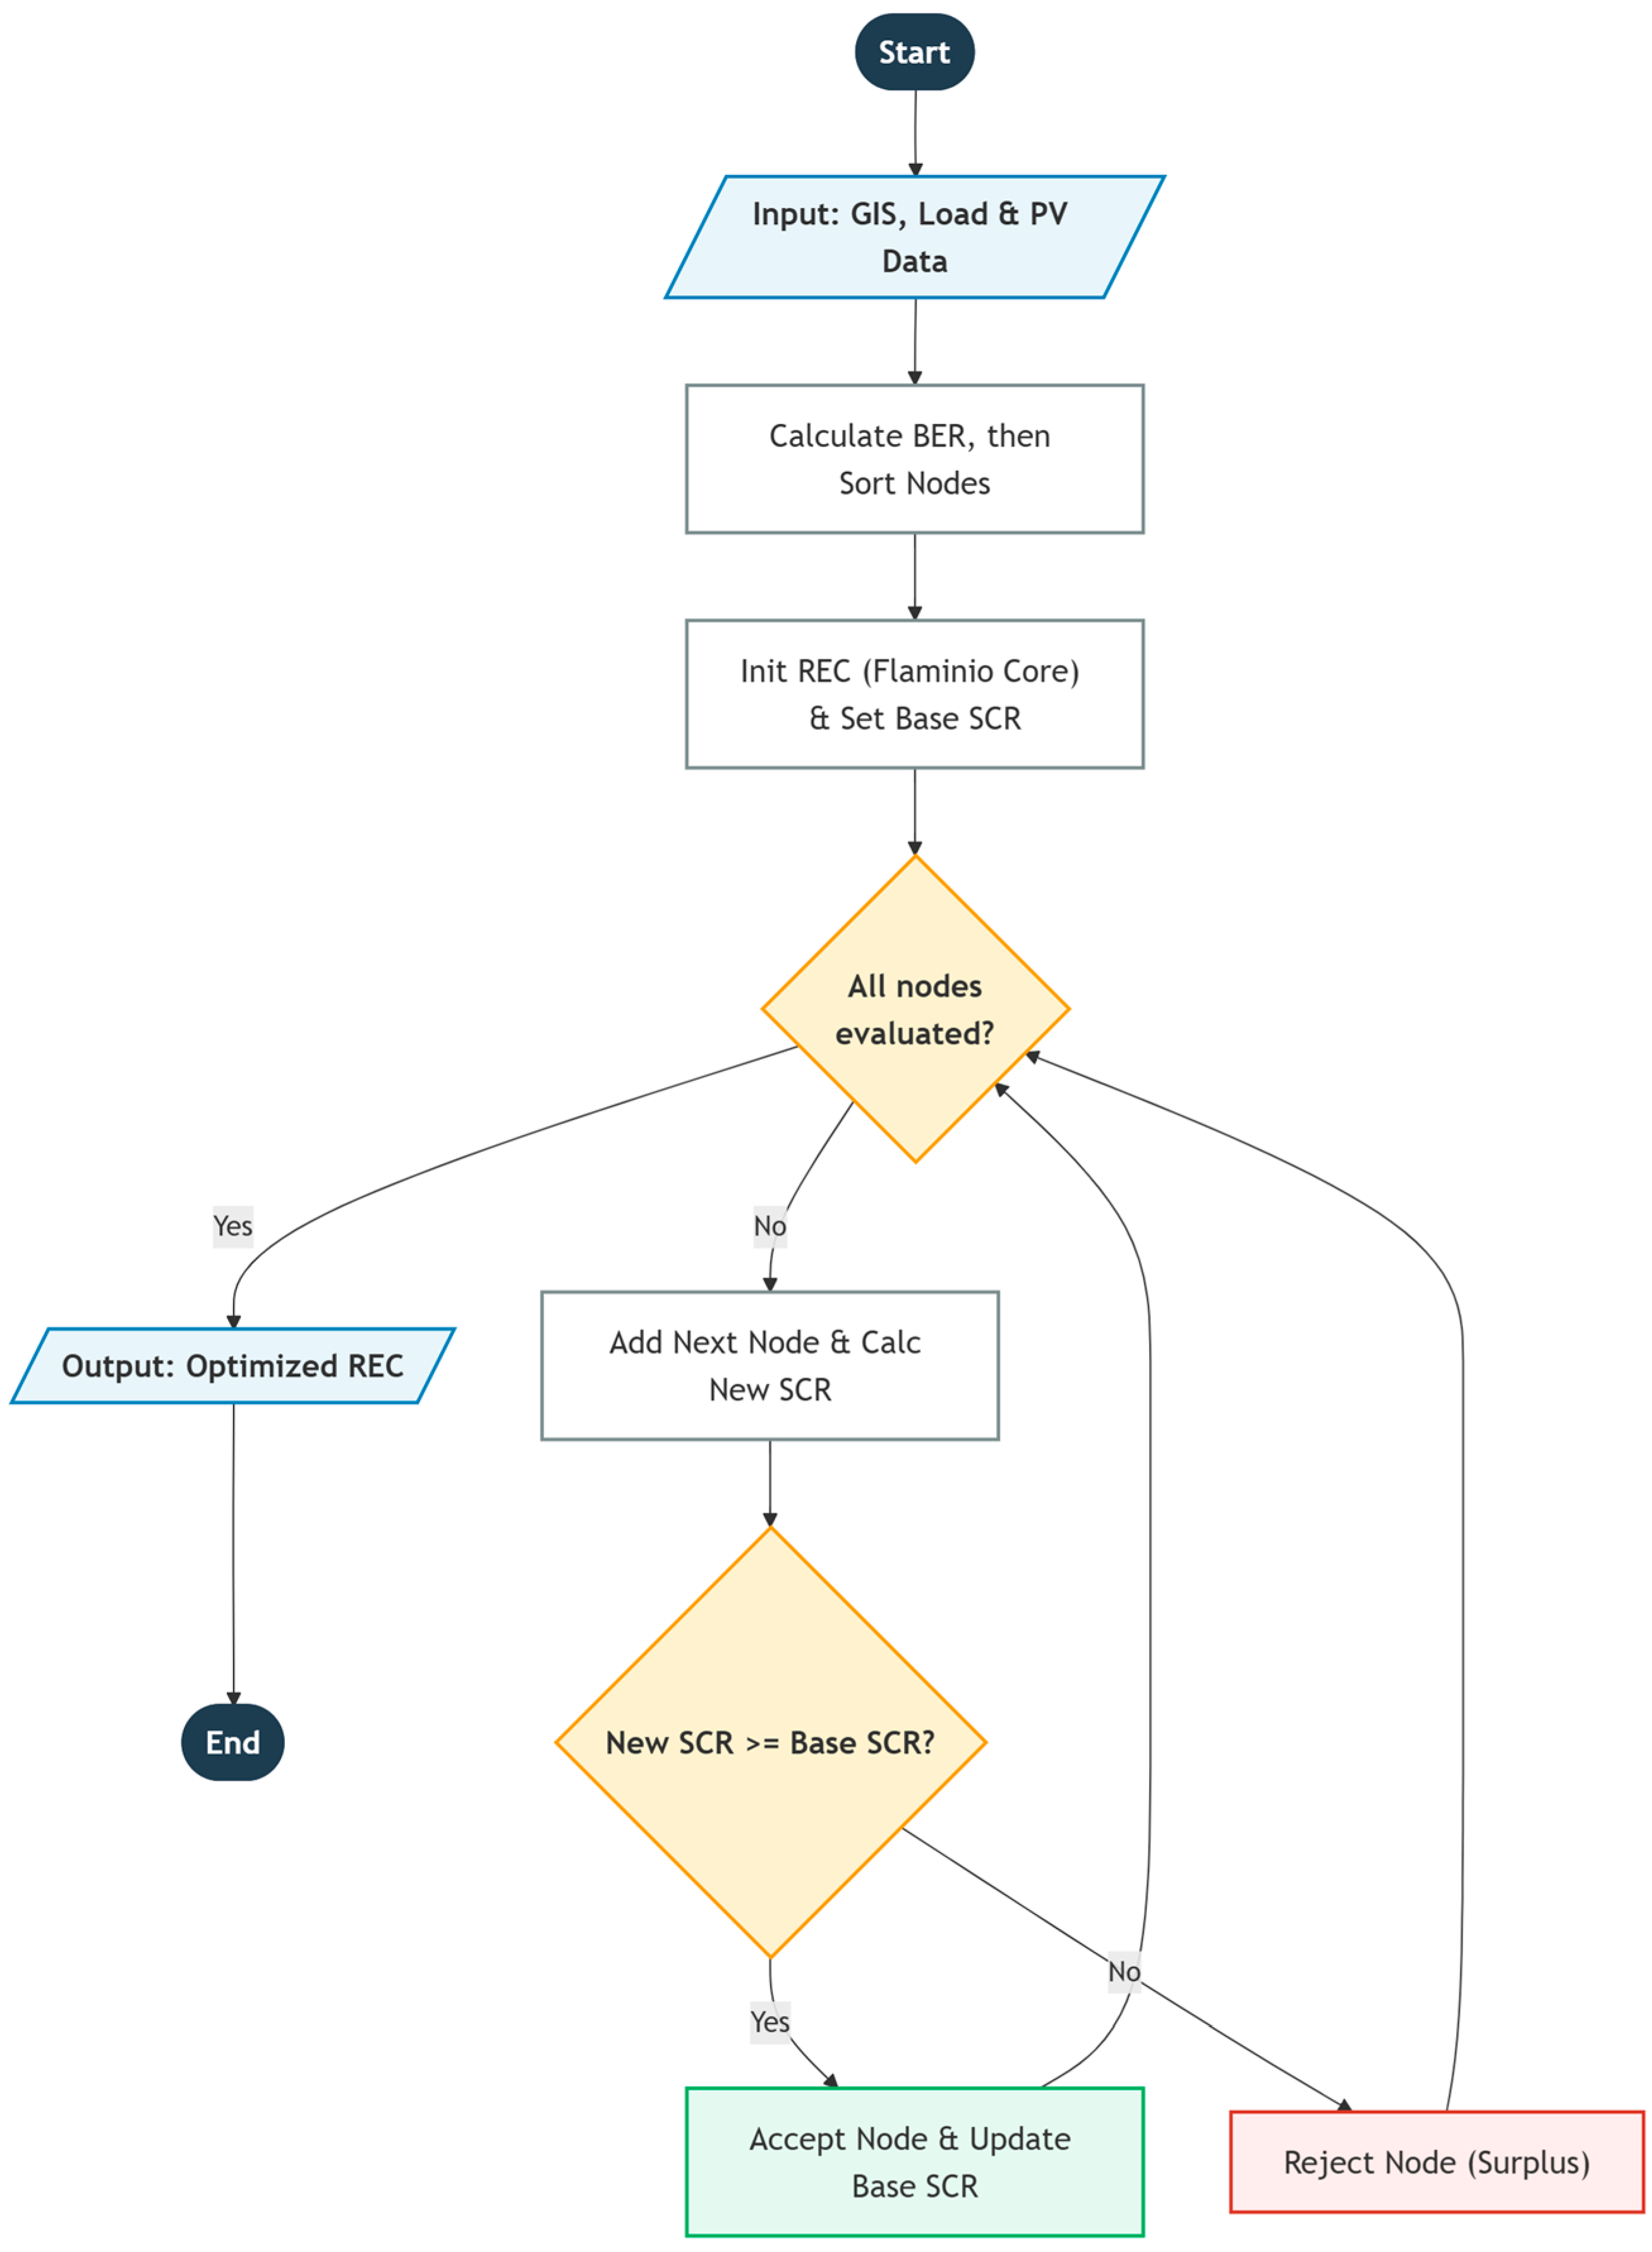
Before the iterative loop begins, buildings are sorted by alternating high-production donors (BER > 1) with high-demand consumers (BER < 1). By forcing the algorithm to evaluate strongly complementary profiles from the very first iterations, the system avoids early demand/supply saturation, effectively bypassing poor local minima and ensuring a robust, near-optimal cluster configuration. Through iterative cycles, the algorithm selects and aggregates nodes whose consumption profiles best overlap with the production curve of the donor nodes, optimizing energy exchange within the constraints of the Primary Substation. As shown in Figure 2, the iterative selection loop is governed by two strict stopping criteria:
Figure 2.
Flowchart of the iterative selection algorithm. The diagram illustrates the step-by-step logic used to dynamically aggregate buildings into the Renewable Energy Community.
- Exhaustion of Candidate Pool: The loop terminates naturally when all building nodes N within the georeferenced database have been evaluated.
- Efficiency Degradation: If the consecutive addition of n available nodes strictly decreases the collective SCR below a predefined acceptable threshold (indicating system saturation), the algorithm halts to preserve the financial quality of the cluster.
It is important to clarify that the proposed algorithm operates as a deterministic greedy heuristic. By using the BER as guiding pre-sorting parameters, the heuristic successfully bypasses poor local minima, delivering a near-optimal and highly efficient cluster configuration. It is important to acknowledge that the BER is an annual scalar and, by definition, does not capture the granular hourly complementarity between generation and demand. A node might exhibit a high annual BER but possess a mismatched temporal profile. Therefore, within the proposed optimization framework, the BER is not used as the final determinant of hourly matching, but rather as a critical computational macro-heuristic. This heuristic pre-sorting dramatically reduces the computational search space and prevents the subsequent dynamic algorithm from becoming trapped in local minimum which would occur if it blindly aggregated consecutive consumer nodes before finding a producer.
2.1.4. Techno-Economic Analysis
The final phase of the workflow consists of a techno-economic feasibility study to evaluate the financial sustainability of the REC over a 20-year horizon [35]. The optimal configuration identified by the algorithm is analyzed using standard financial indicators such as NPV (Net Present Value) and PBT (Payback Period).
The initial investment costs derived from IRENA market analyses, specifically 724.5 EUR/kW for rooftop PV, alongside annual operation and maintenance expenses of 9.2 EUR/kWh [36]. Cash inflows are determined by a combination of direct savings from avoided grid purchases, revenues from exported energy, and specific incentives for collective sharing as updated quarterly by ARERA. The revenue model is based on three components explicitly defined by the Italian regulatory framework: a Premium Tariff of 110 €/MWh and a Grid Fee Refund of 9 €/MWh, both applicable exclusively to shared energy, and a market price of 50 €/MWh for surplus grid injection. A limitation of the current techno-economic evaluation is the reliance on deterministic point values. Current economic projections assume constant tariffs over the 20-year horizon; future work could incorporate price volatility scenarios and probabilistic NPV ranges to better reflect modern energy market fluctuations
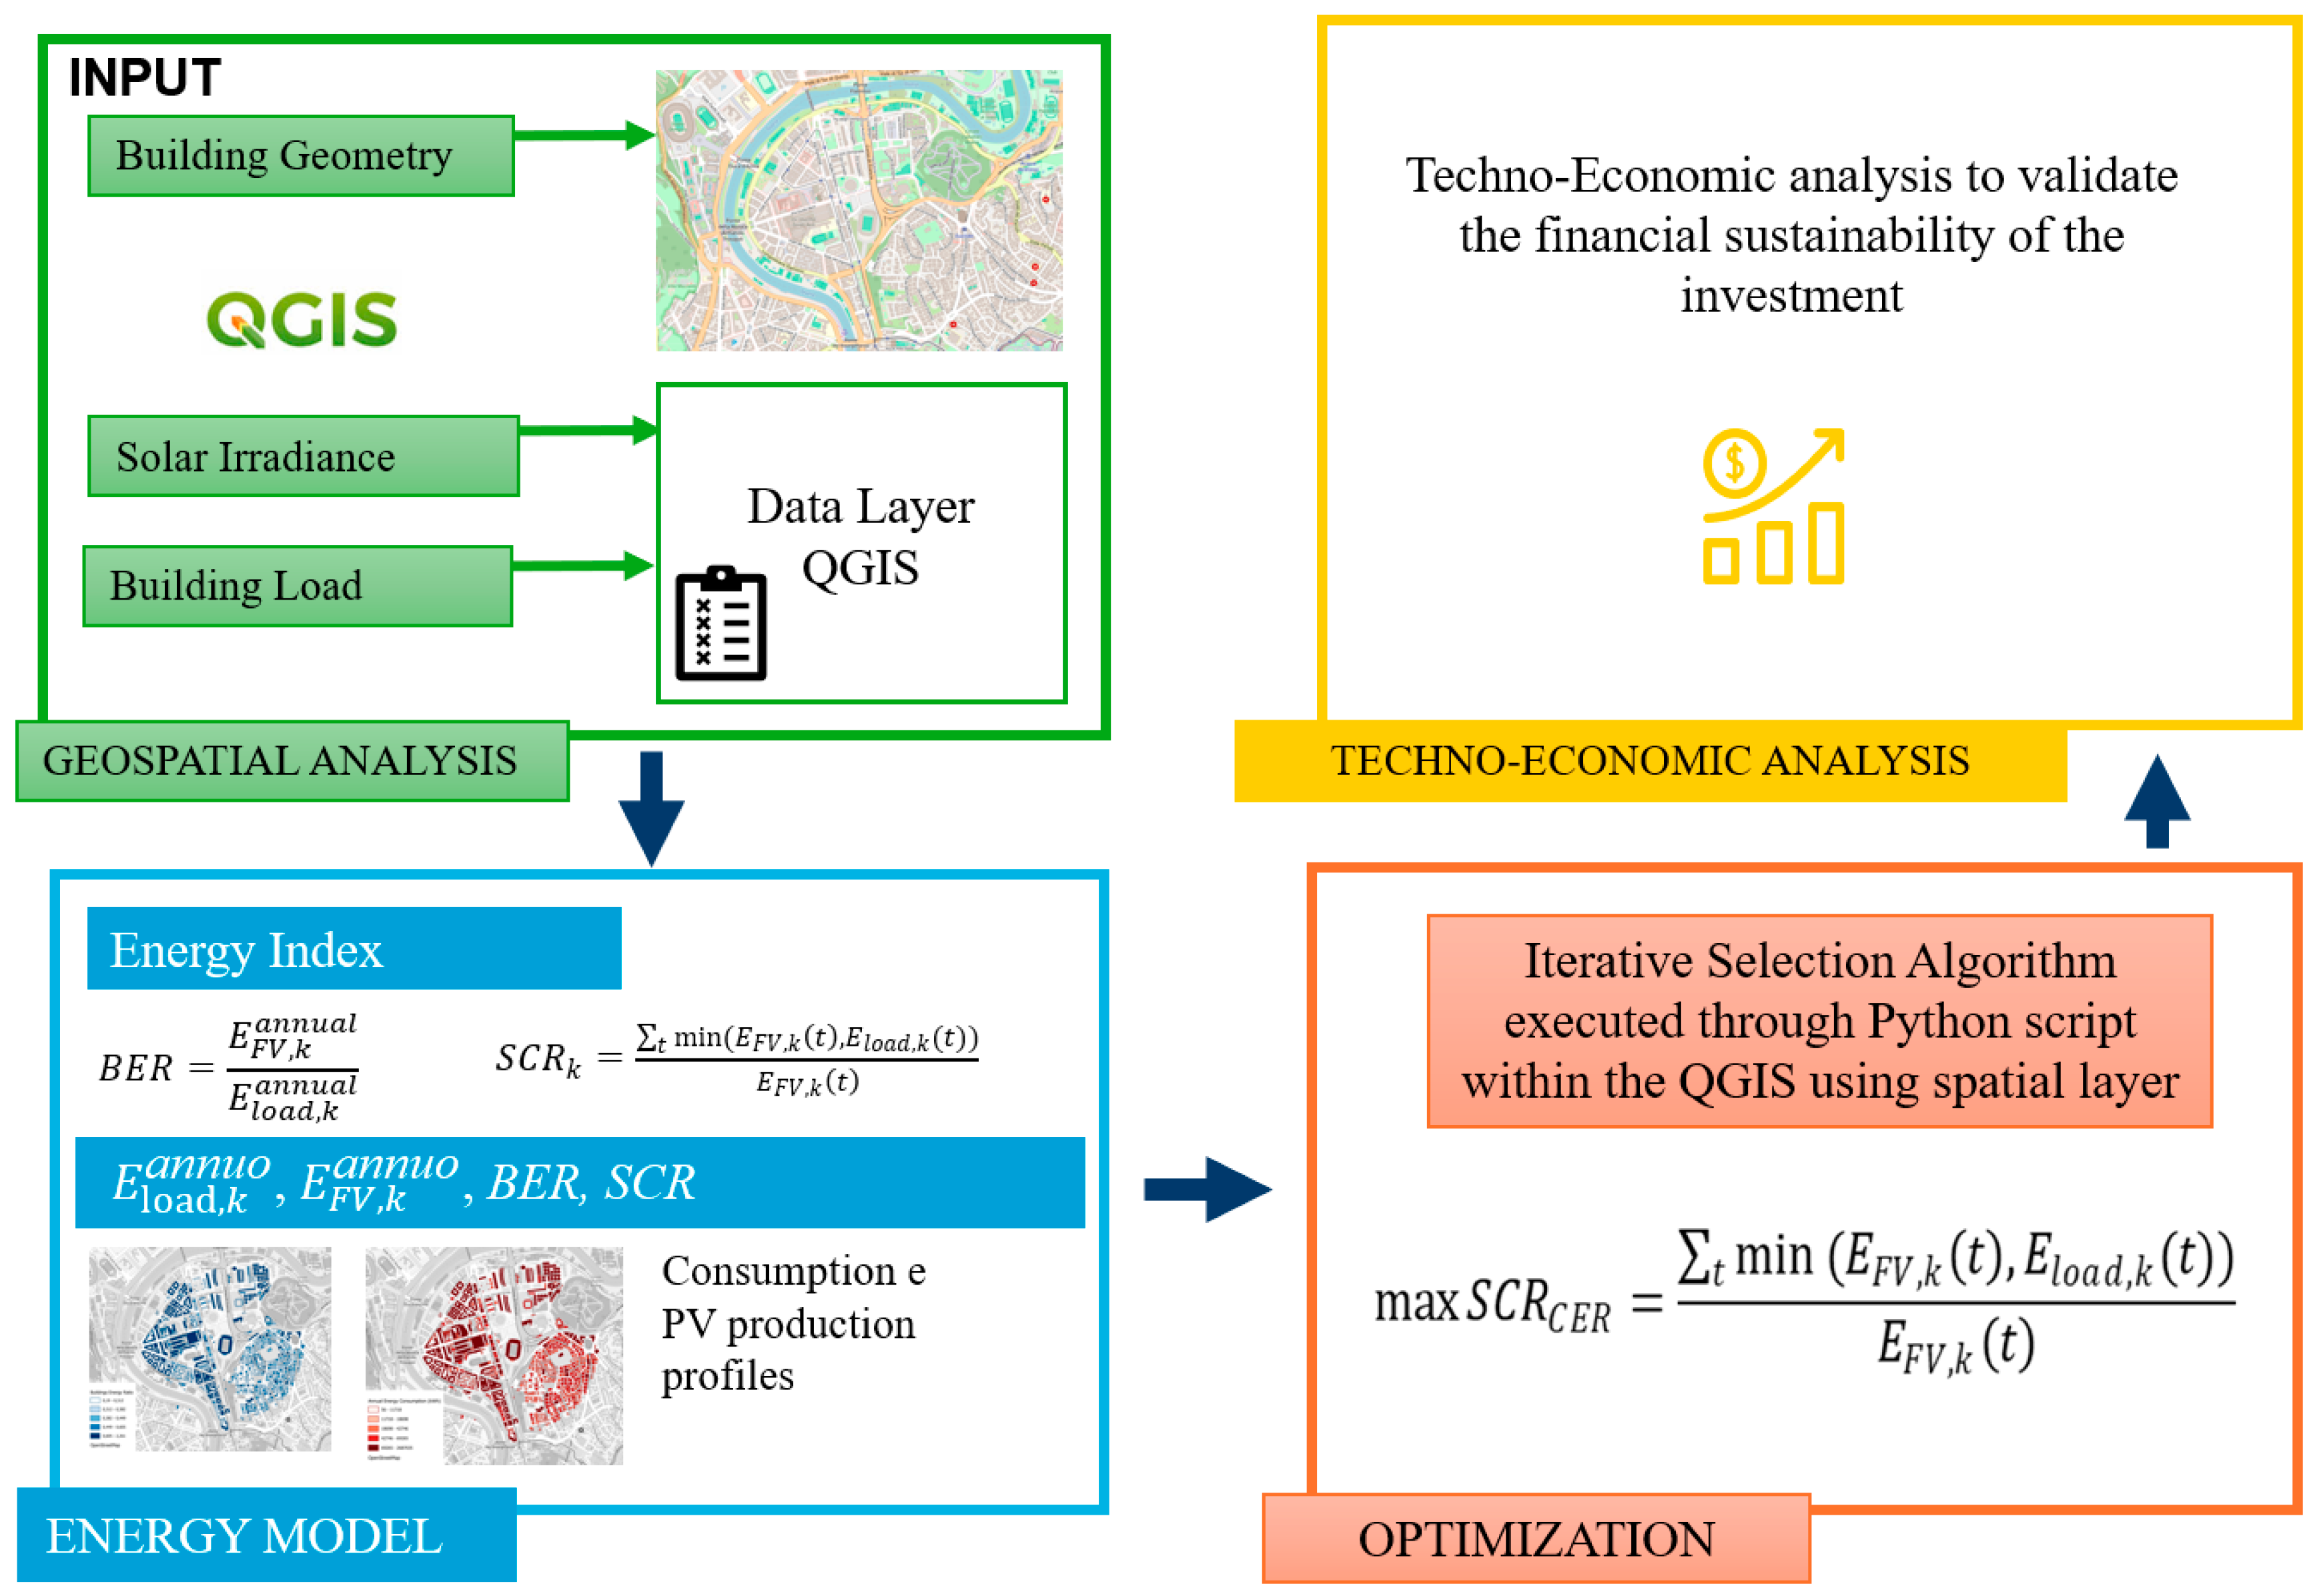
The overall methodology of this study is summarized in Figure 3, which illustrates the sequential steps of the spatial analysis and the iterative heuristic selection algorithm.
Figure 3.
The framework of the methodology employed in this research.
2.2. Case Study: The Flaminio District and the “Energy Hub” Stadium
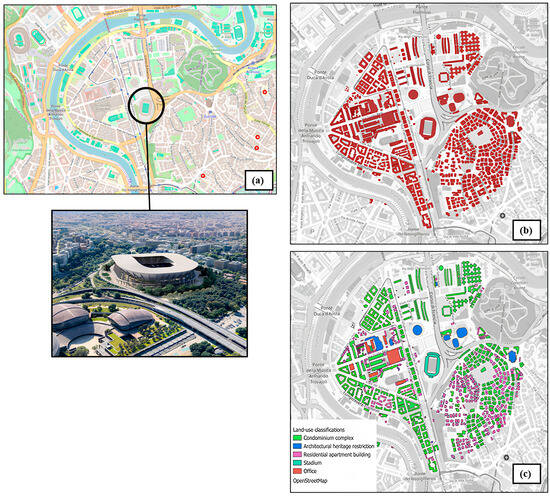
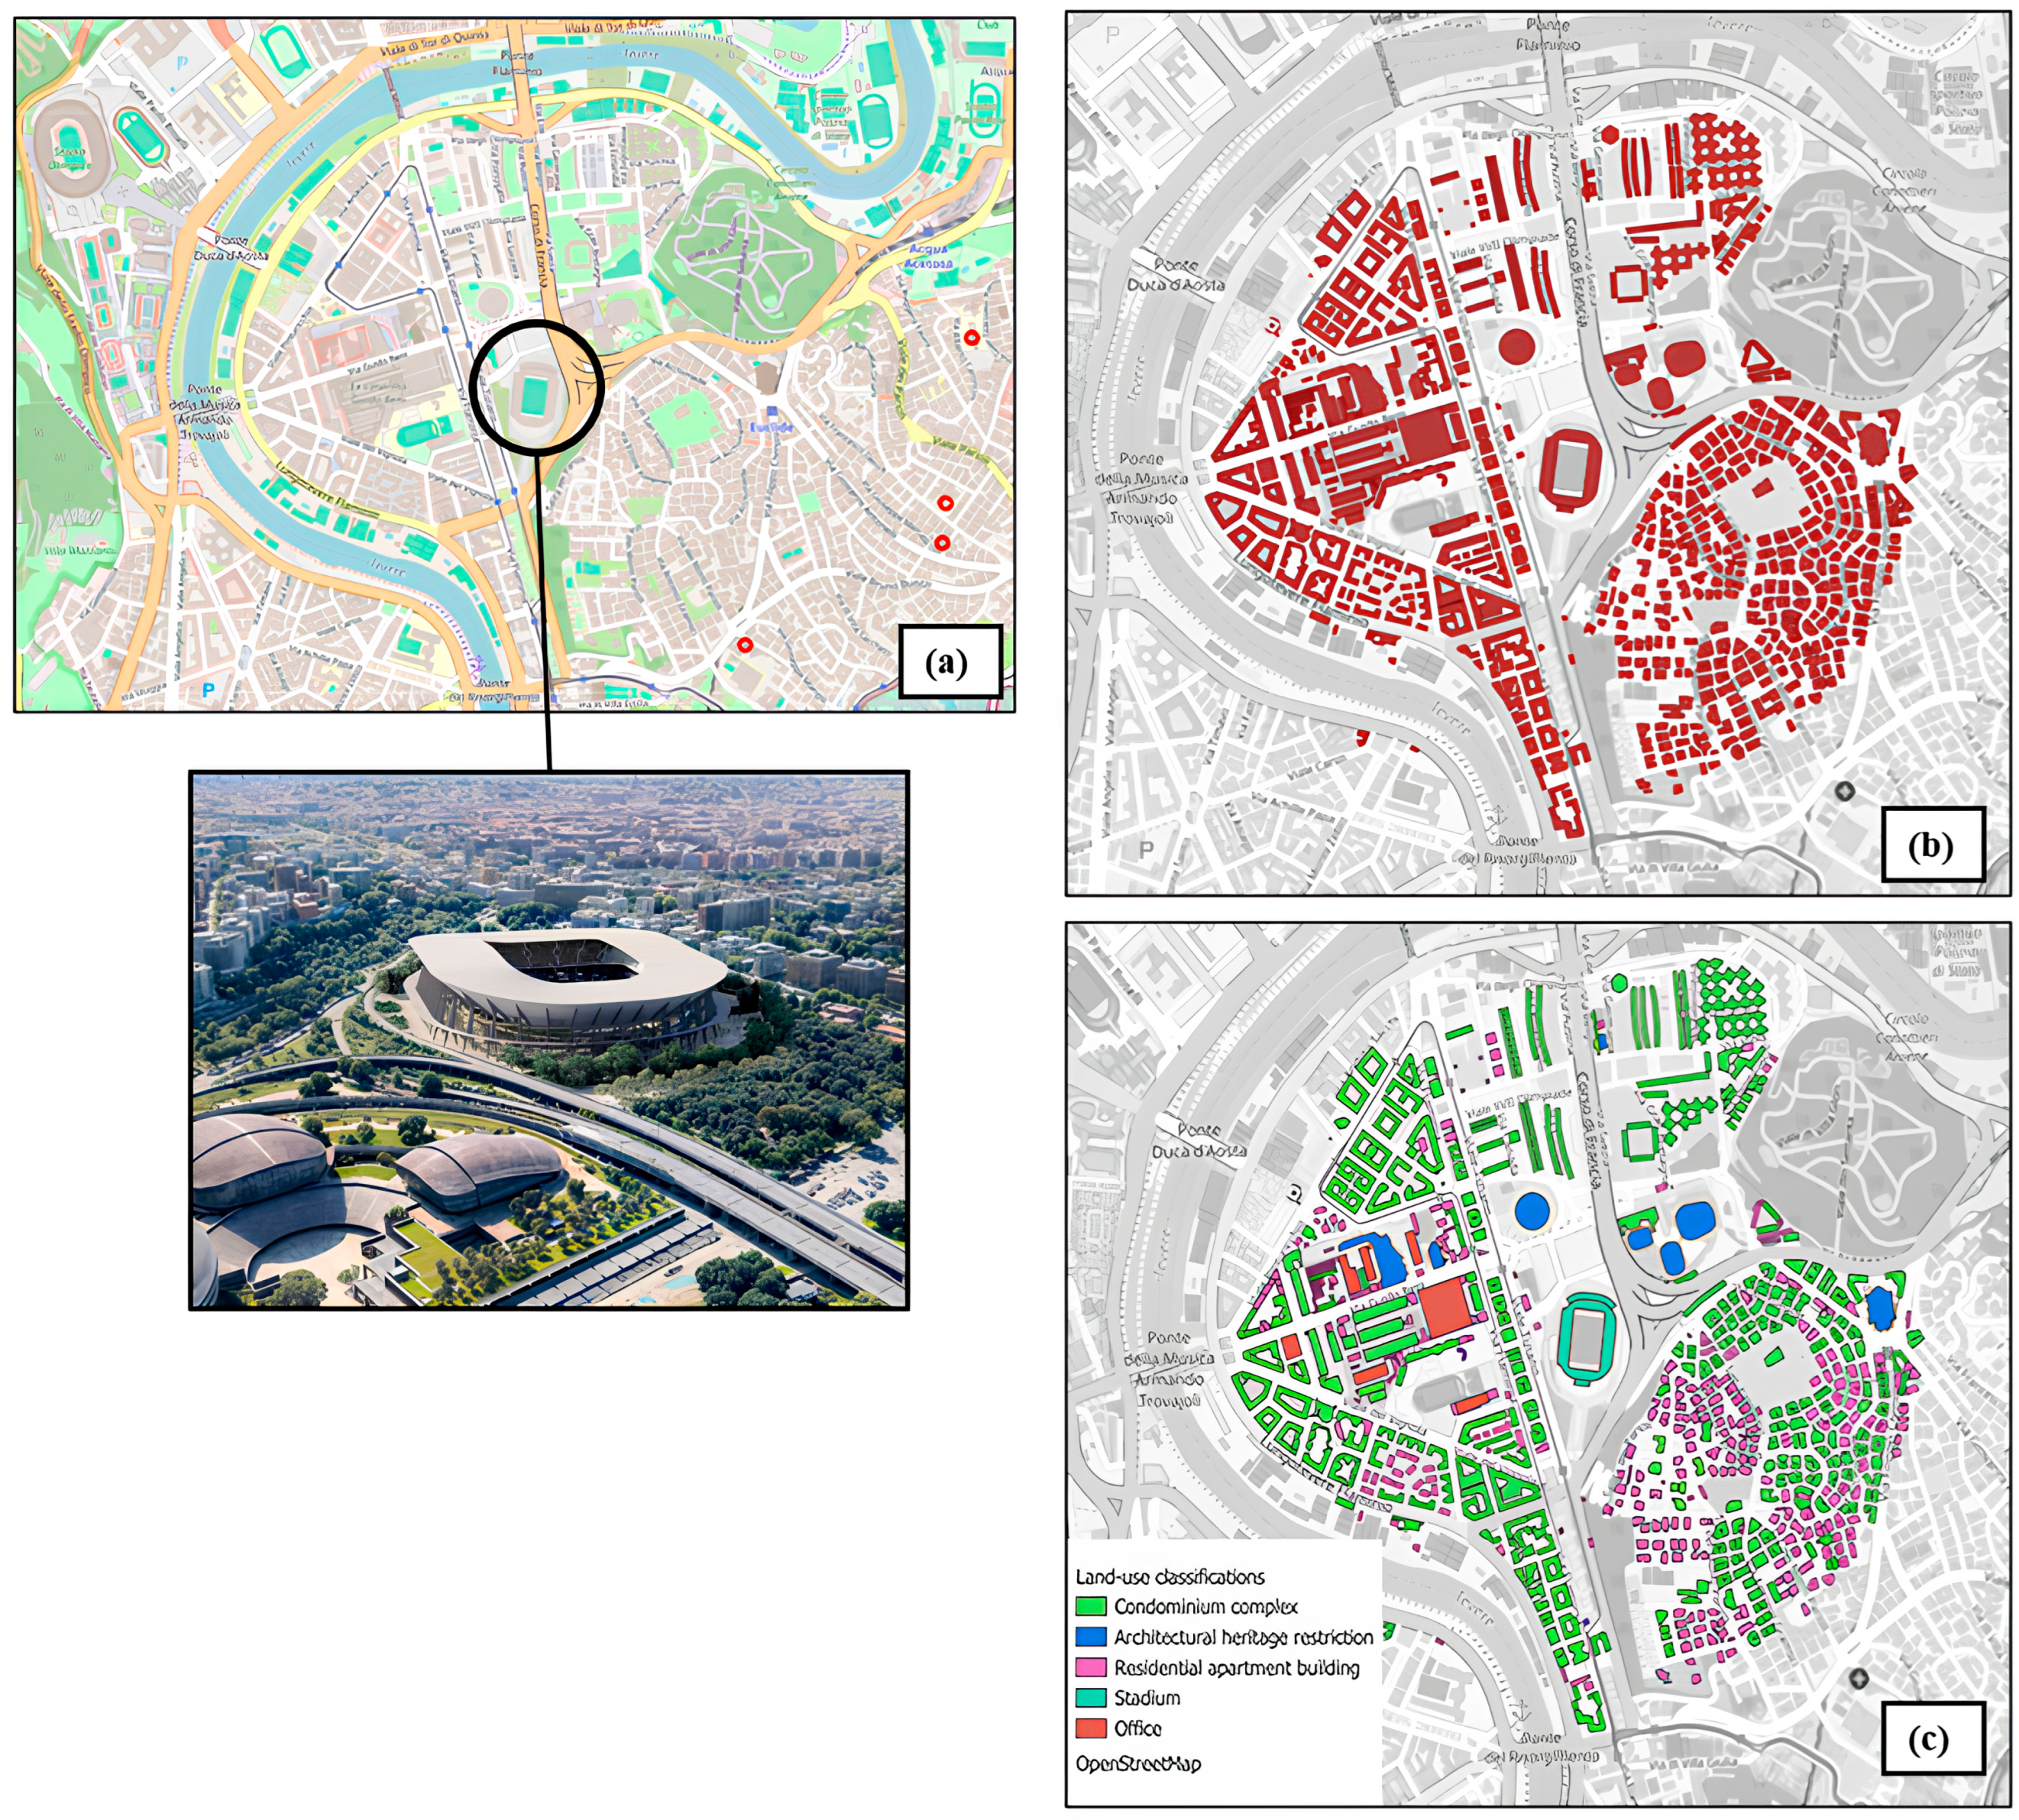
The developed methodology was applied to a strategic urban sector in Rome, specifically the area surrounding the Flaminio Stadium. The study area encompasses a total of 854 buildings, hosting a diverse mix of end-users: residential blocks, sports infrastructures, school complexes, offices, and public administrative offices. All buildings are connected to the same Primary Substations (AC002E00059 and AC002E00034) [37], fulfilling the regulatory requirement for participation in a Renewable Energy Community under current Italian legislation. Within the area, there are buildings that remain outside this study because they are unable to install PV systems due to specific constraints, such as churches and listed historical buildings. Figure 4 shows the selected area, the buildings chosen for the analysis, and their respective land-use classifications.
Figure 4.
Selected area featuring the Flaminio Stadium redevelopment proposal (a), the buildings chosen for the analysis (b), and their respective land-use classifications (c).
For each building, a theoretical PV configuration was defined. Modules were either tilted according to the existing roof pitch or, for flat surfaces, arranged at an optimal 35° inclination with a 0° South orientation. The simulation assumes high-efficiency monocrystalline modules with the following technical specifications:
- Module Area (): 1.64 .
- Nominal Power (): 315 W (Efficiency = 19%).
- System Losses: 14.08% total, with a DC/AC ratio of 1.1.
- Annual Degradation Rate: 0.5%.
While residential rooftops are often constrained by volumetric shadows, the Flaminio Stadium offers a massive, unshaded surface. The analysis identifies an allocable area of approximately 6681 m2 on the outermost ring of the roof (tilted at 12°), allowing for a potential capacity exceeding 1.1 MWp. This makes the stadium the central node of the area, with a production capacity far superior to the sum of the surrounding residential rooftops.
2.3. Stochastic-Synthetic Demand Modeling and Load Profiling
To mitigate the epistemic uncertainty inherent in large-scale urban energy modeling where high-resolution smart-metering data is typically unavailable, a stochastic-synthetic approach was implemented. The annual electrical energy demand for each of the 628 nodes was quantified by correlating high-resolution urban morphological data with functional energy intensities. The Gross Floor Area (GFA) for each building k was computationally derived within the QGIS environment, serving as the primary deterministic scaling factor for the estimated annual demand ():
The specific consumption intensity was calibrated using high-precision benchmark values specifically validated for the Roman urban context. Data concerning household and non-domestic utilities in Rome were extracted from the study by [38], which reports electrical consumption across the 155 urban planning zones of Rome, regardless of the energy supplier. This localized calibration acts as an indirect validation layer, grounding the synthetic curves in real-world urban metabolic data. Based on this localized dataset, the intensities were set at 35.4 kWh/m2·year for the residential stock and 102.8 kWh/m2·year for the tertiary and light commercial sectors. These calibrated coefficients ensure a significantly higher degree of accuracy in the district’s baseline metabolism assessment compared to generalized literature ranges. To enable a high-fidelity simulation of the collective self-consumption within the Renewable Energy Community, hourly load profiles were reconstructed by applying ARERA (Italian Regulatory Authority for Energy, Networks and the Environment) standard curves [39]. The simulation operates at a strict hourly time resolution, resulting in 8760 data points per year for each building. The ARERA datasets intrinsically account for seasonal segmentation, reflecting variations such as increased lighting demand in winter and peak cooling loads in summer. These standardized profiles were deterministically overlaid onto the urban fabric based on the functional classification of each building: bimodal domestic profiles (with morning and evening peaks) were assigned to residential polygons, while non-domestic low-voltage profiles (concentrated during working hours) were mapped to office and commercial units. For each node k, the estimated annual energy demand () was volumetrically distributed across the 8760 h according to these normalized percentage curves
A specialized deterministic model was developed for the Flaminio Stadium. Given the highly intermittent nature of its energy metabolism, the load curve was reconstructed by isolating event days. Based on empirical data from comparable international facilities and technical reports on sustainable stadium management an energy intensity of 22,000 kWh per event was assigned to 102 annual events [40,41]. This high-resolution temporal modeling reveals that while the stadium is a massive energy consumer during peak events, its prolonged periods of low demand, coupled with its continuous 1.1 MWp solar potential, mathematically define its role as the primary donor node. It must be acknowledged that because the Flaminio Stadium has suffered from prolonged abandonment, empirical validation of its future load profile is currently impossible. The parameter of 102 annual events at 22,000 kWh acts as a deterministic, high-usage design scenario based on comparable UEFA-standard facilities [30].
3. Results and Discussion
3.1. Optimization Strategy and Cluster Selection
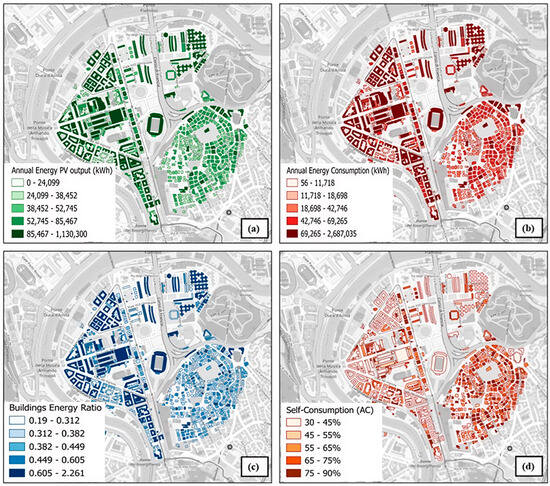
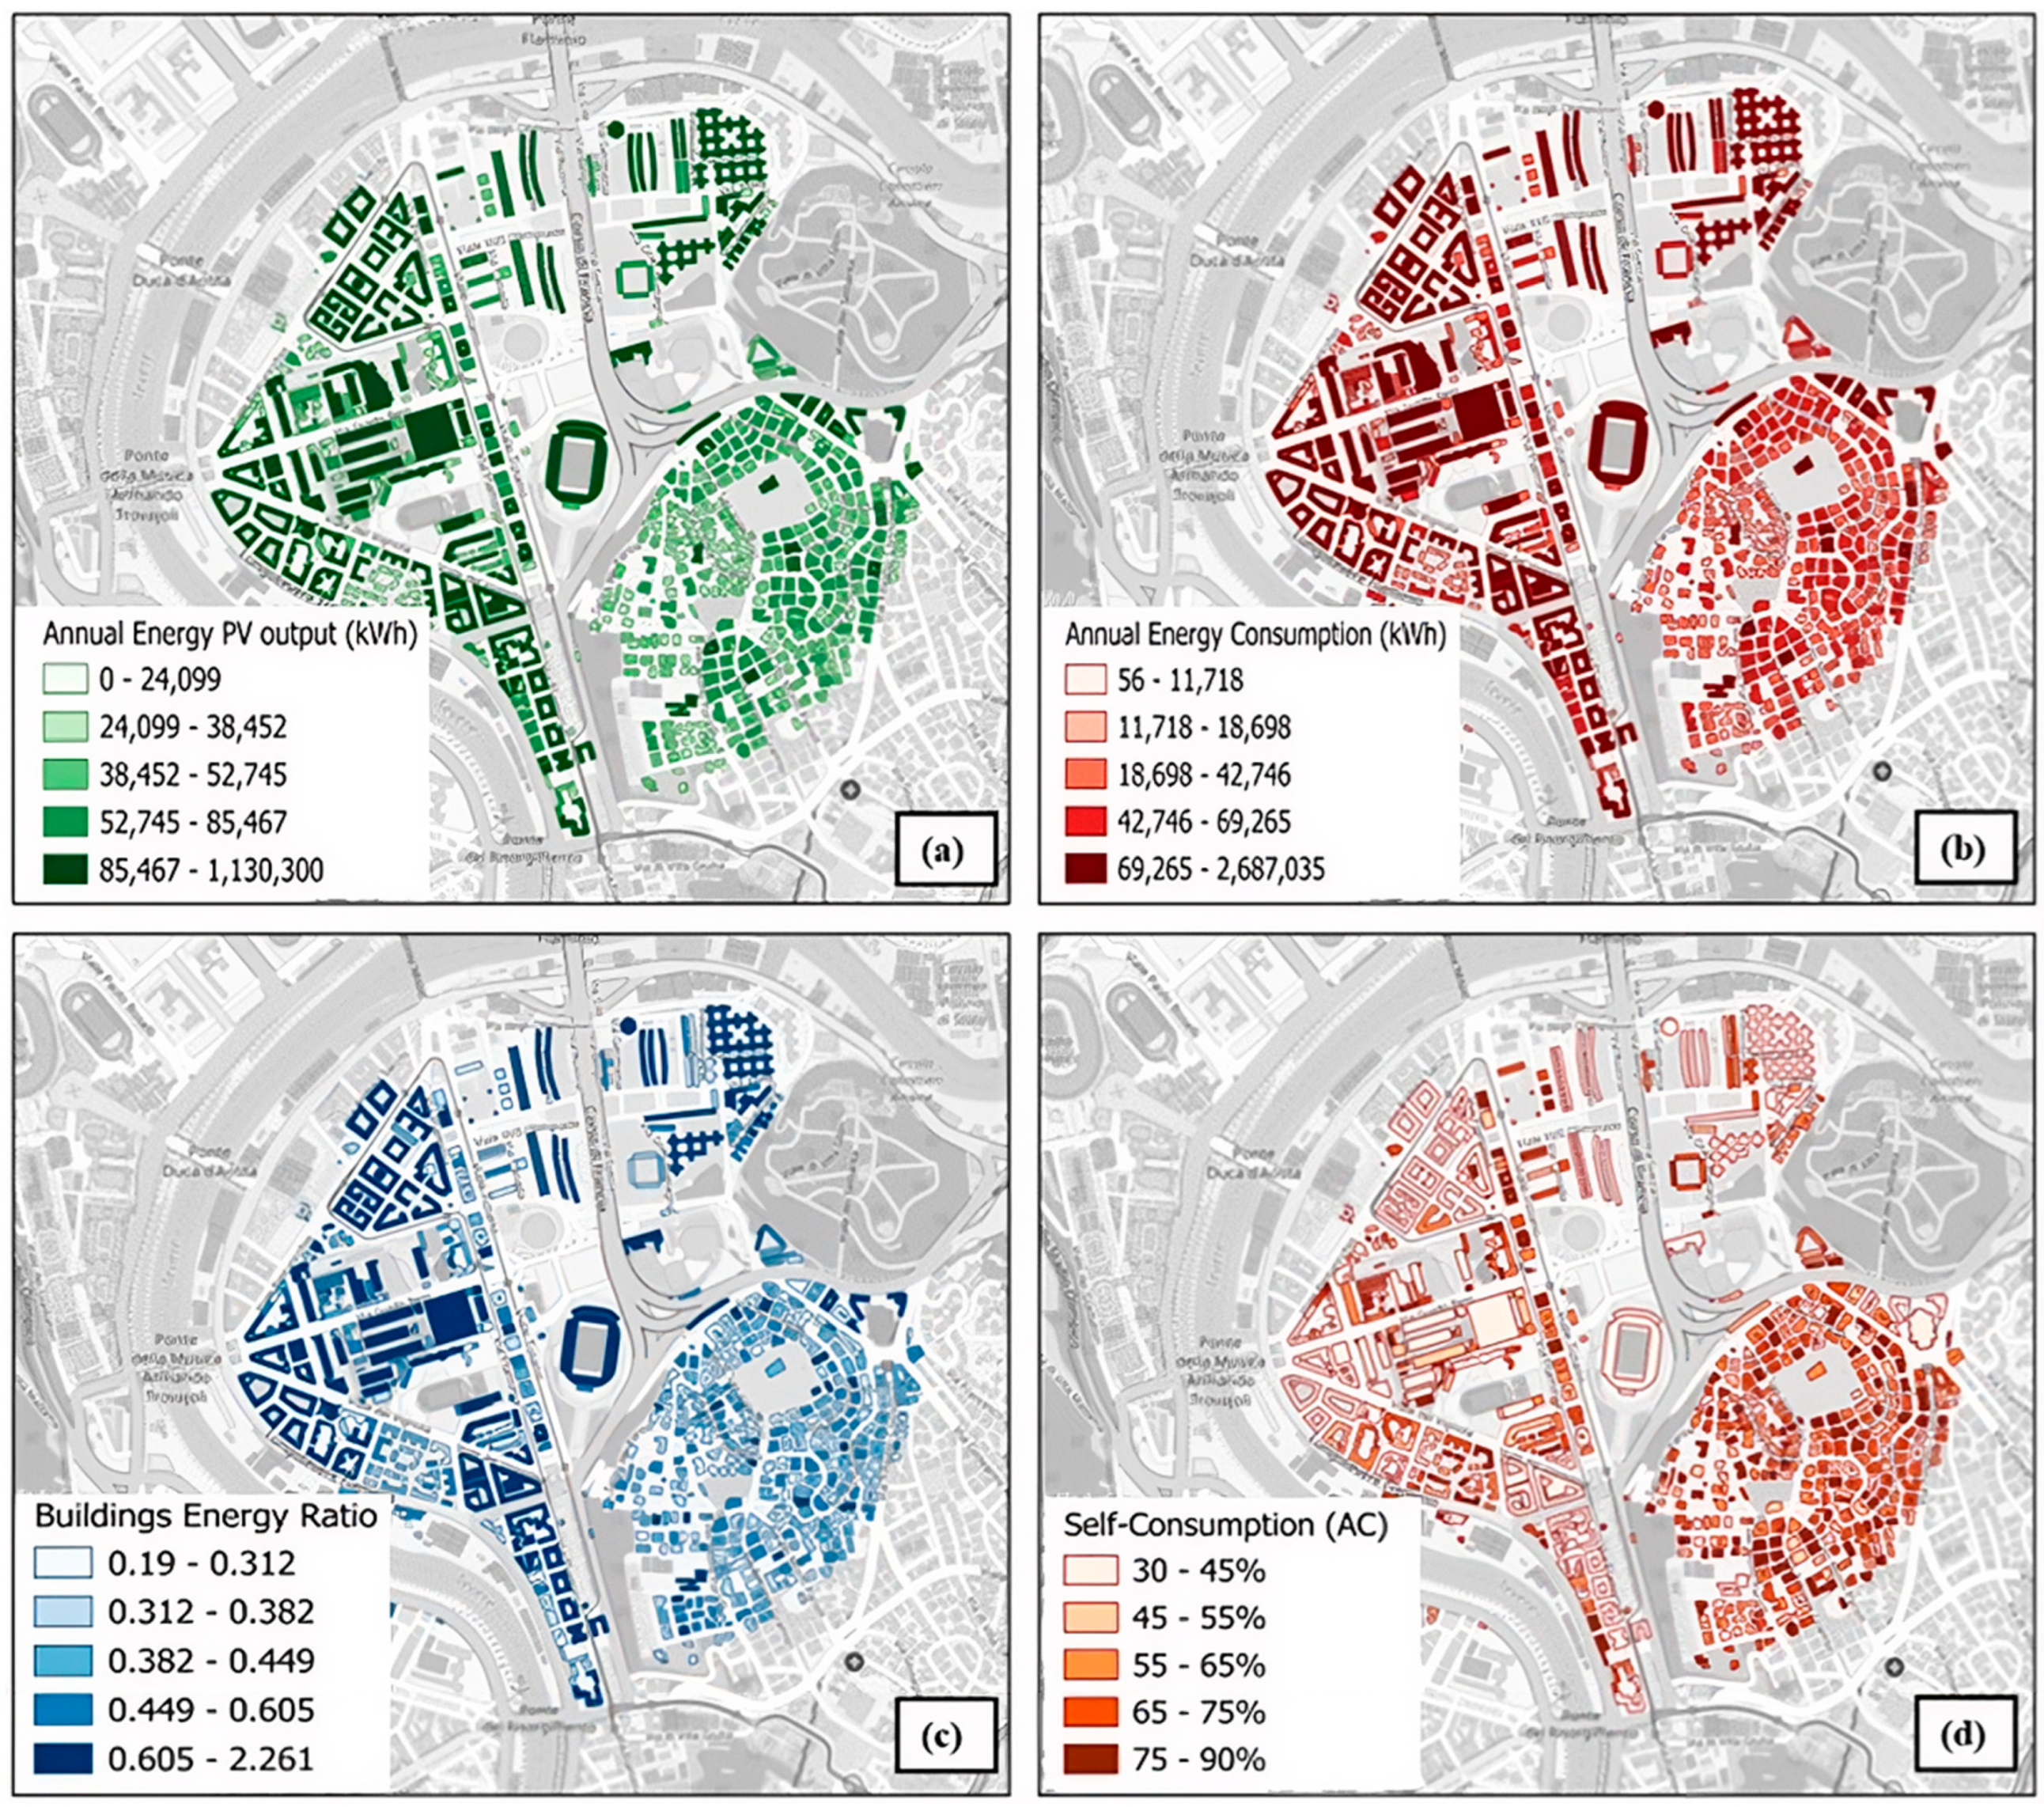
The integration of the 854 buildings into the Renewable Energy Community framework, centered around the Flaminio Stadium hub, yielded significant results in terms of energy SCR. The following sections detail the energetic, spatial, and economic outcomes of the optimized configuration. Figure 5a,b illustrate the spatial distribution of photovoltaic electricity production and energy consumption within the urban area. The estimation of photovoltaic potential highlighted the presence of extensive roof surfaces capable of hosting a cumulative capacity exceeding 5 MWp. Simultaneously, the reconstruction of electricity consumption revealed highly diverse load profiles: residential buildings with evening peaks, offices with consumption concentrated during daylight hours, and mixed-use structures with demand distributed throughout the day.
Figure 5.
GIS Energy Mapping of the Flaminio District: annual Photovoltaic Potential (a), annual electric load (b), BER Index (c), and individual Self-Consumption Rate (d).
This heterogeneity formed the basis for introducing the BER and SCR indicators, which allowed for the classification of buildings according to their capacity to actively contribute to the energy community (Figure 5c,d).
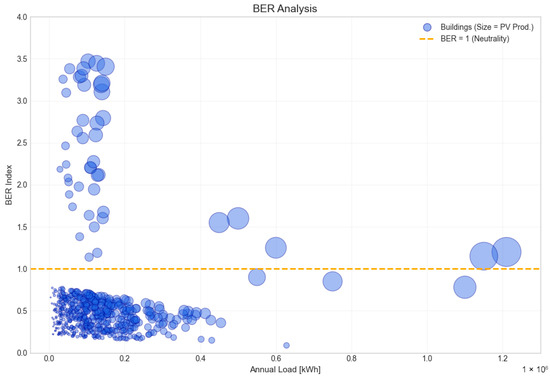
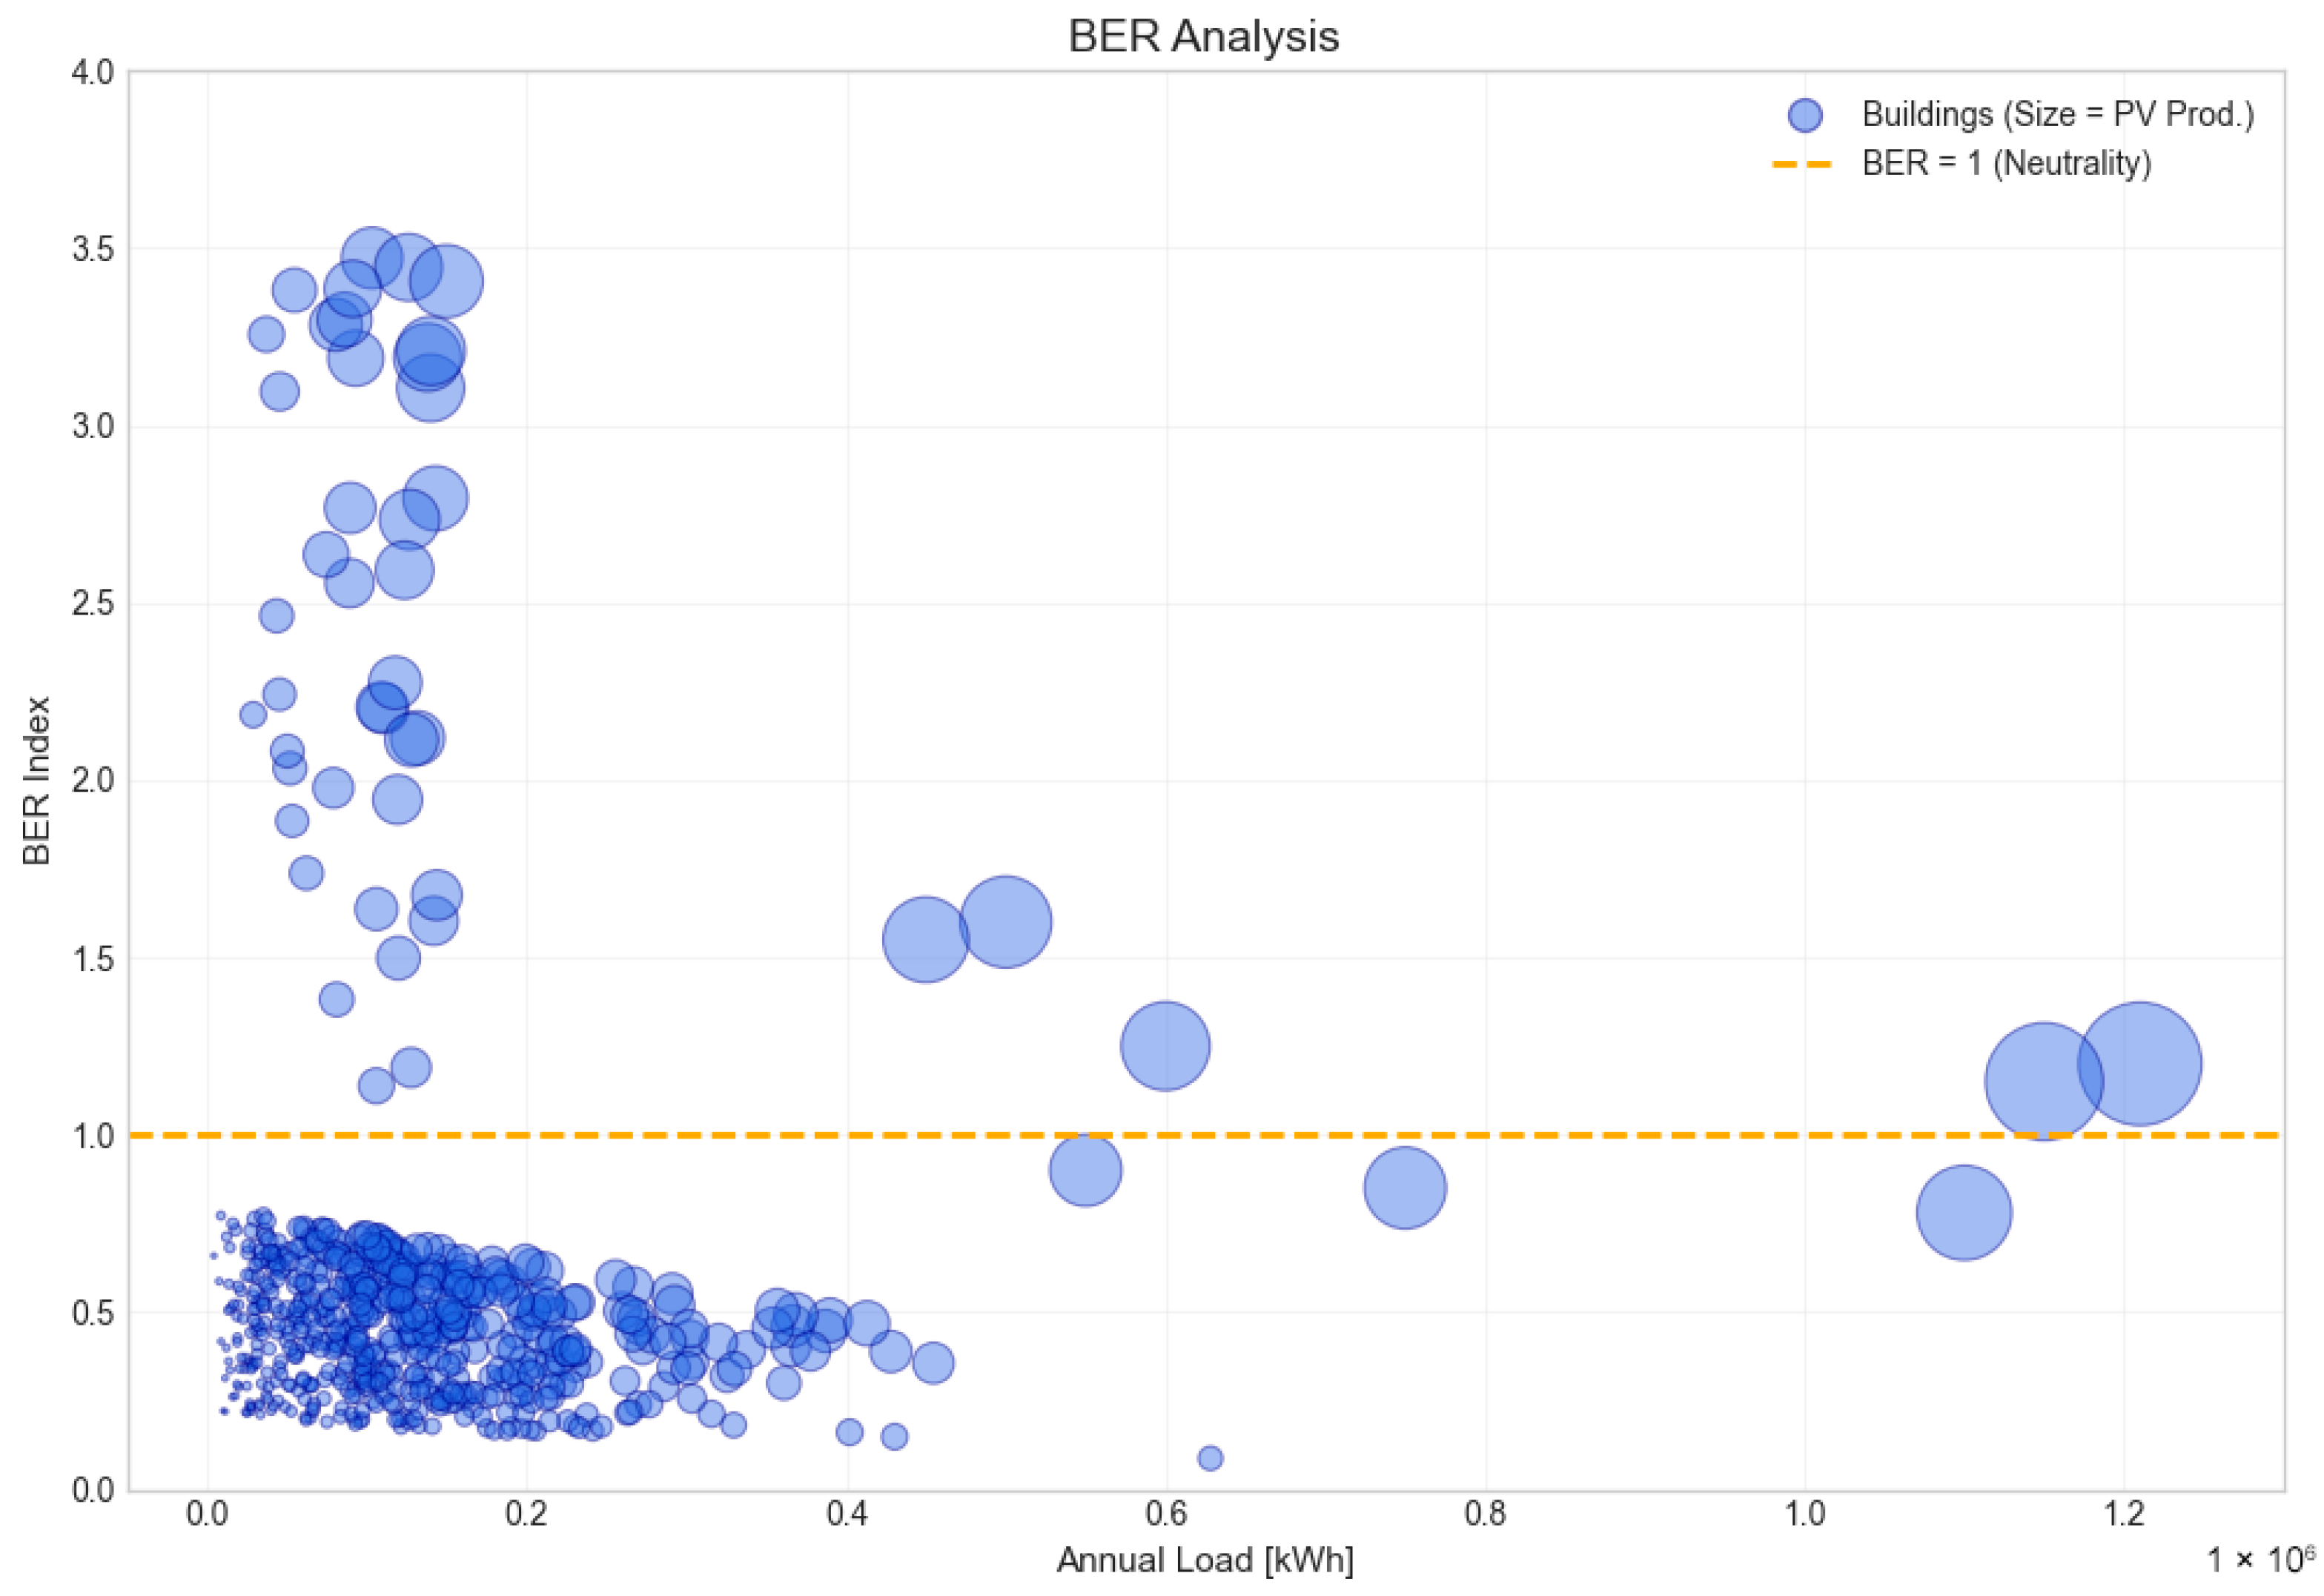
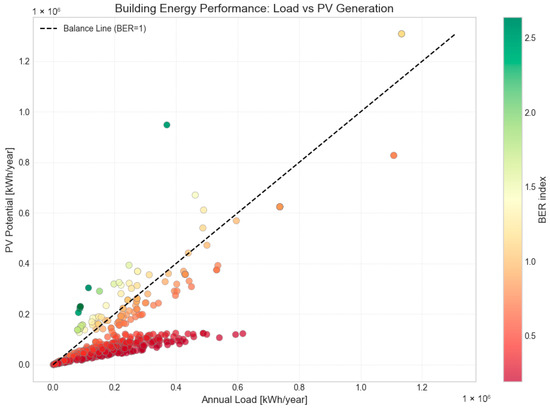
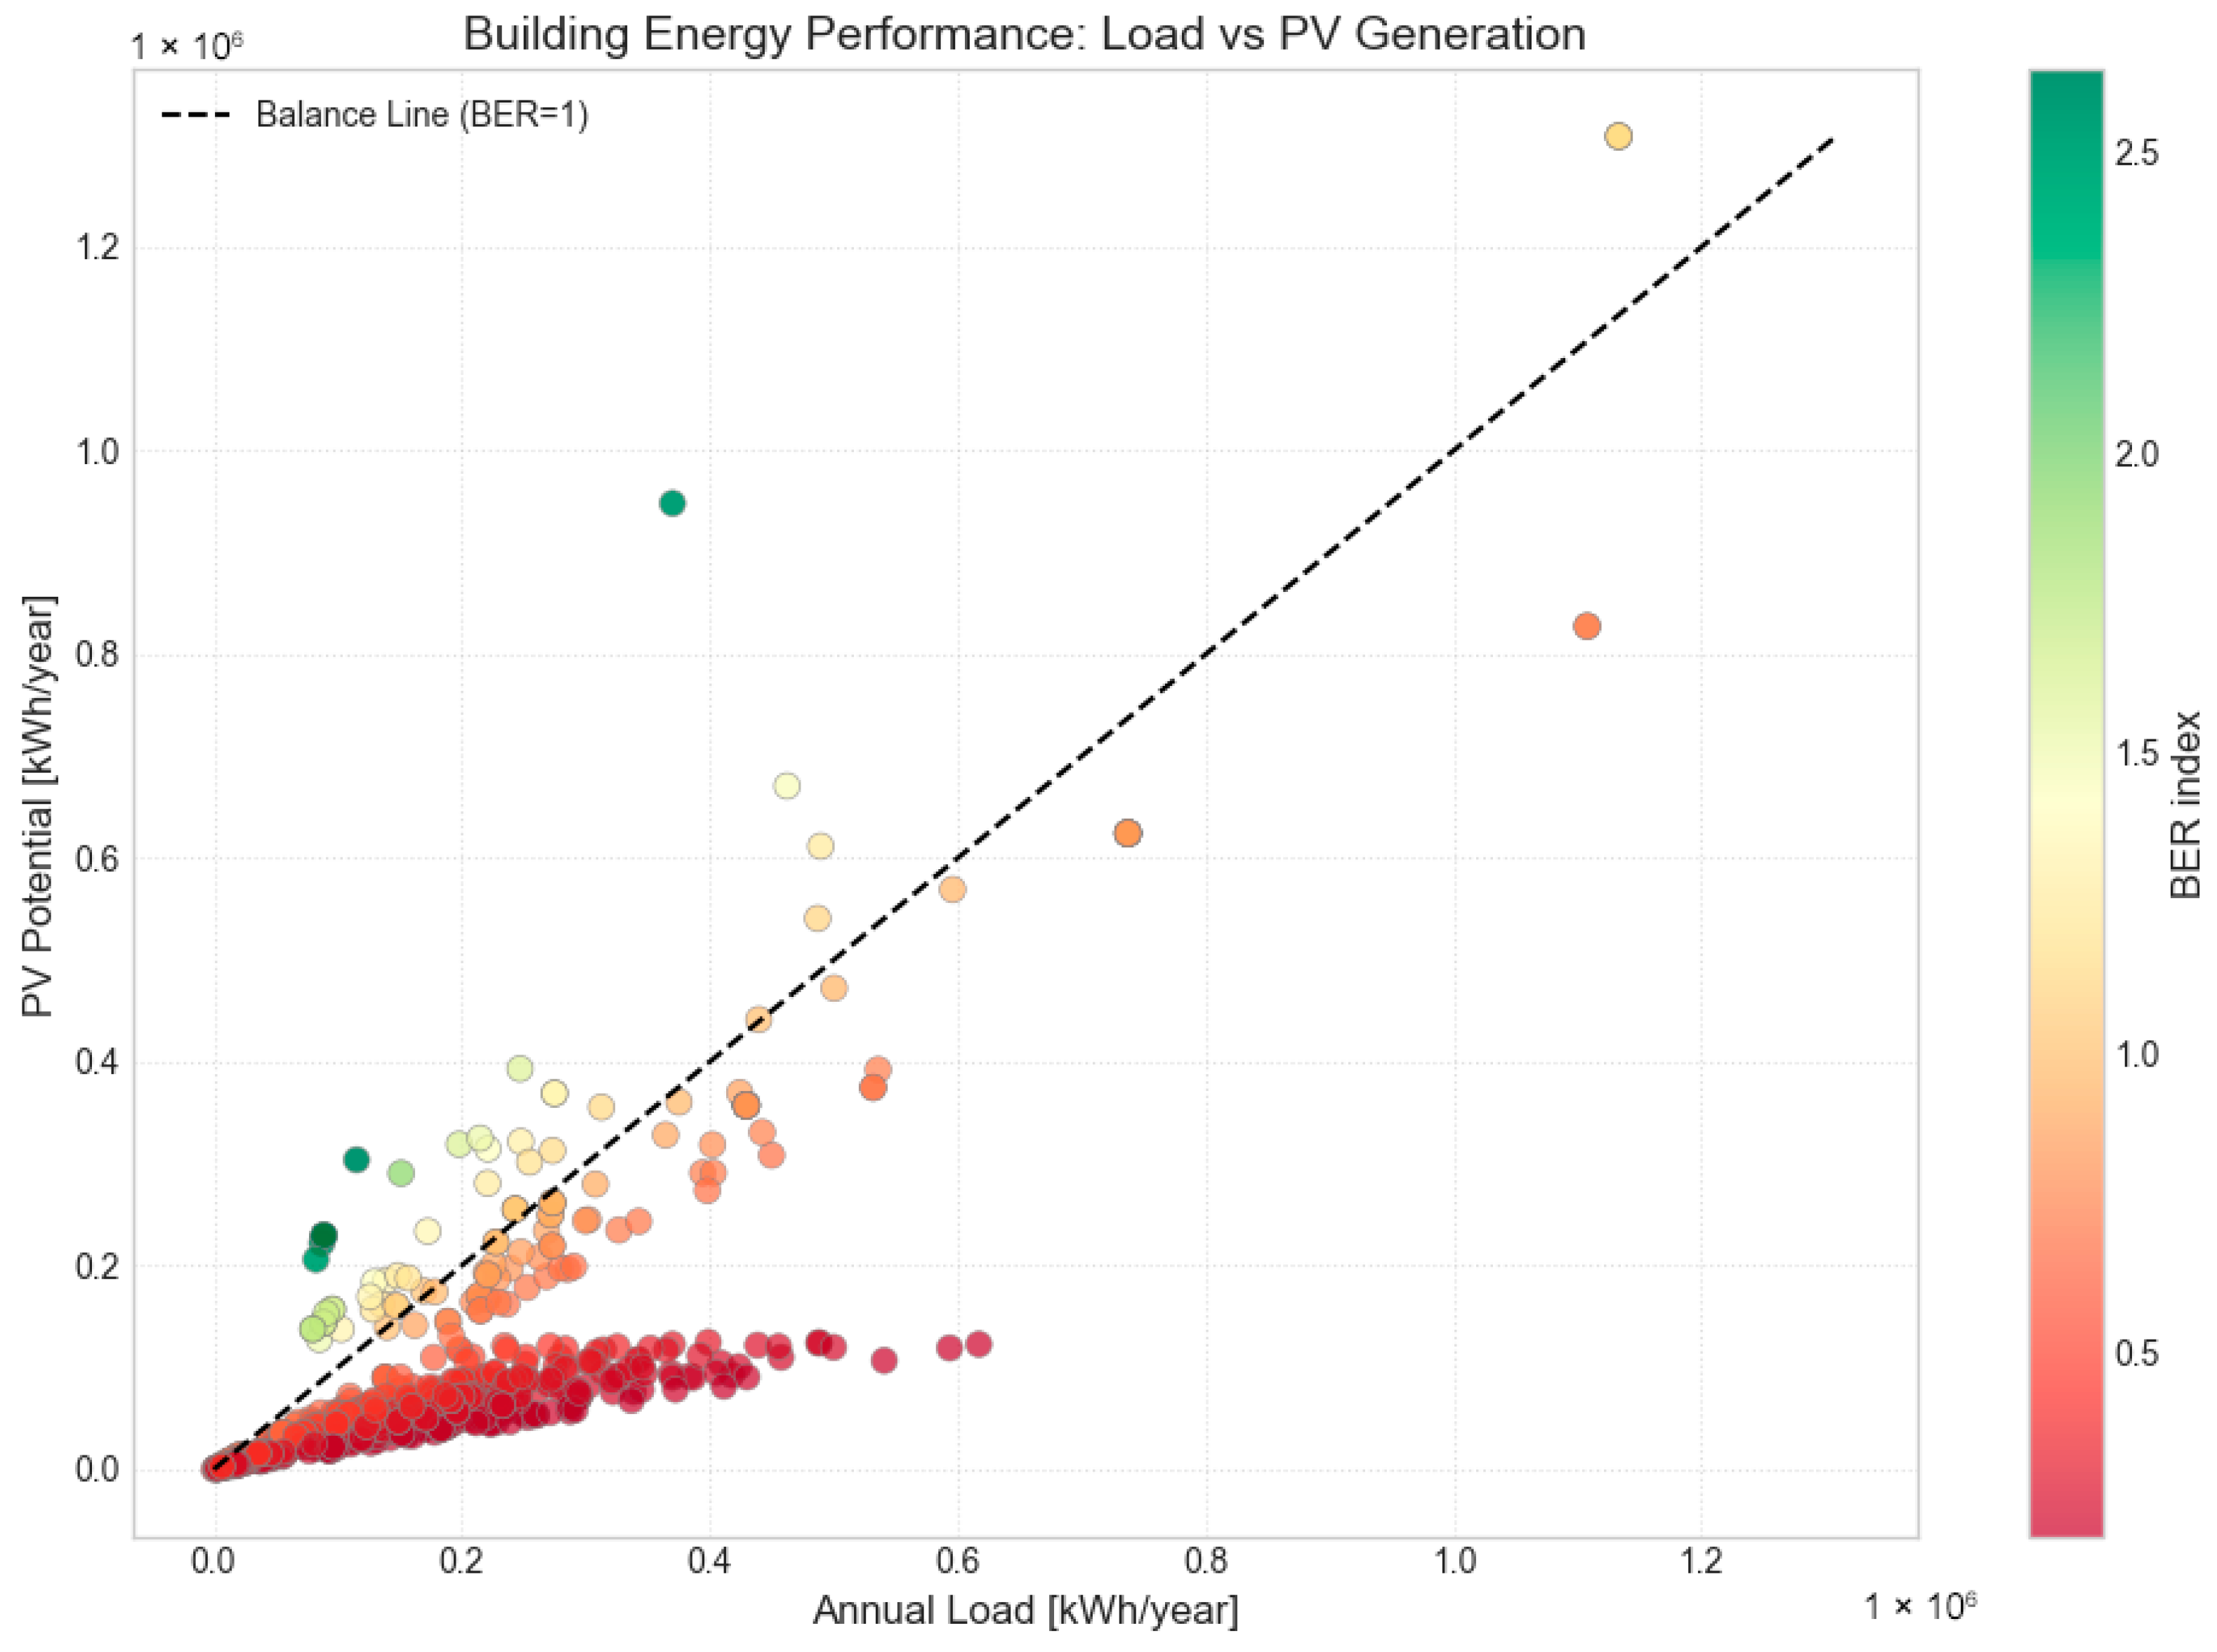
Figure 6 analyzes the energy vocation of the urban fabric by mapping the BER Index as a function of the Annual Load, with each point weighted by its total PV Production volume. The sheer volume (area) of the bubbles above the orange line represents the massive energy surplus that must be managed. Correlation analysis between Annual Energy Demand and Photovoltaic Potential is shown in Figure 7. Each point represents a building in the district. The color scale highlights the energy performance index: green points (above the dashed bisector) indicate Net Producers (BER > 1) generating summer surplus, while red/orange points identify large energy-intensive condominiums (BER < 1) that maximize the instantaneous self-consumption of the REC.
Figure 6.
Energy Balance Analysis: BER Bubble Chart distinguishing Net Producers (above orange line) from Net Consumers.
Figure 7.
Load vs. Generation Scatter, where the diagonal represents energy neutrality and color intensity reflects the deficit/surplus status.
As highlighted in Table 1, the district’s total energy demand stands at 142.26 GWh/year, against a maximum estimated photovoltaic production capacity of 74.91 GWh/year. This structural asymmetry (nominal roverage ratio equal to 52%) confirms the initial hypothesis: that in high-density urban contexts, the physical solar hosting capacity of rooftops is insufficient, in absolute terms, to fully cover the energy demand, rendering the district dependent on the national grid for the remaining 48% of its annual needs.
Table 1.
Baseline and optimization scenario energy results.
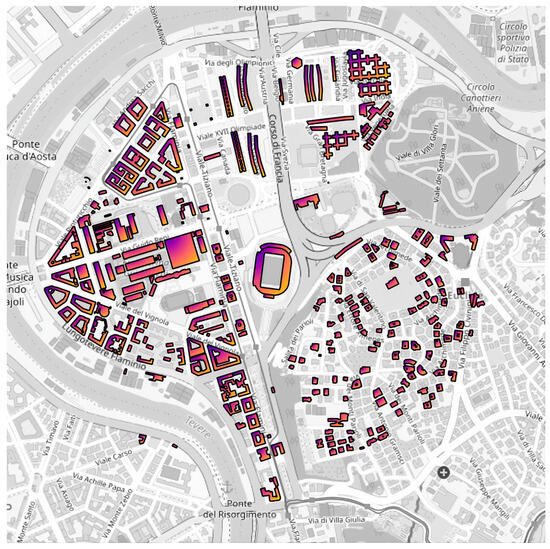
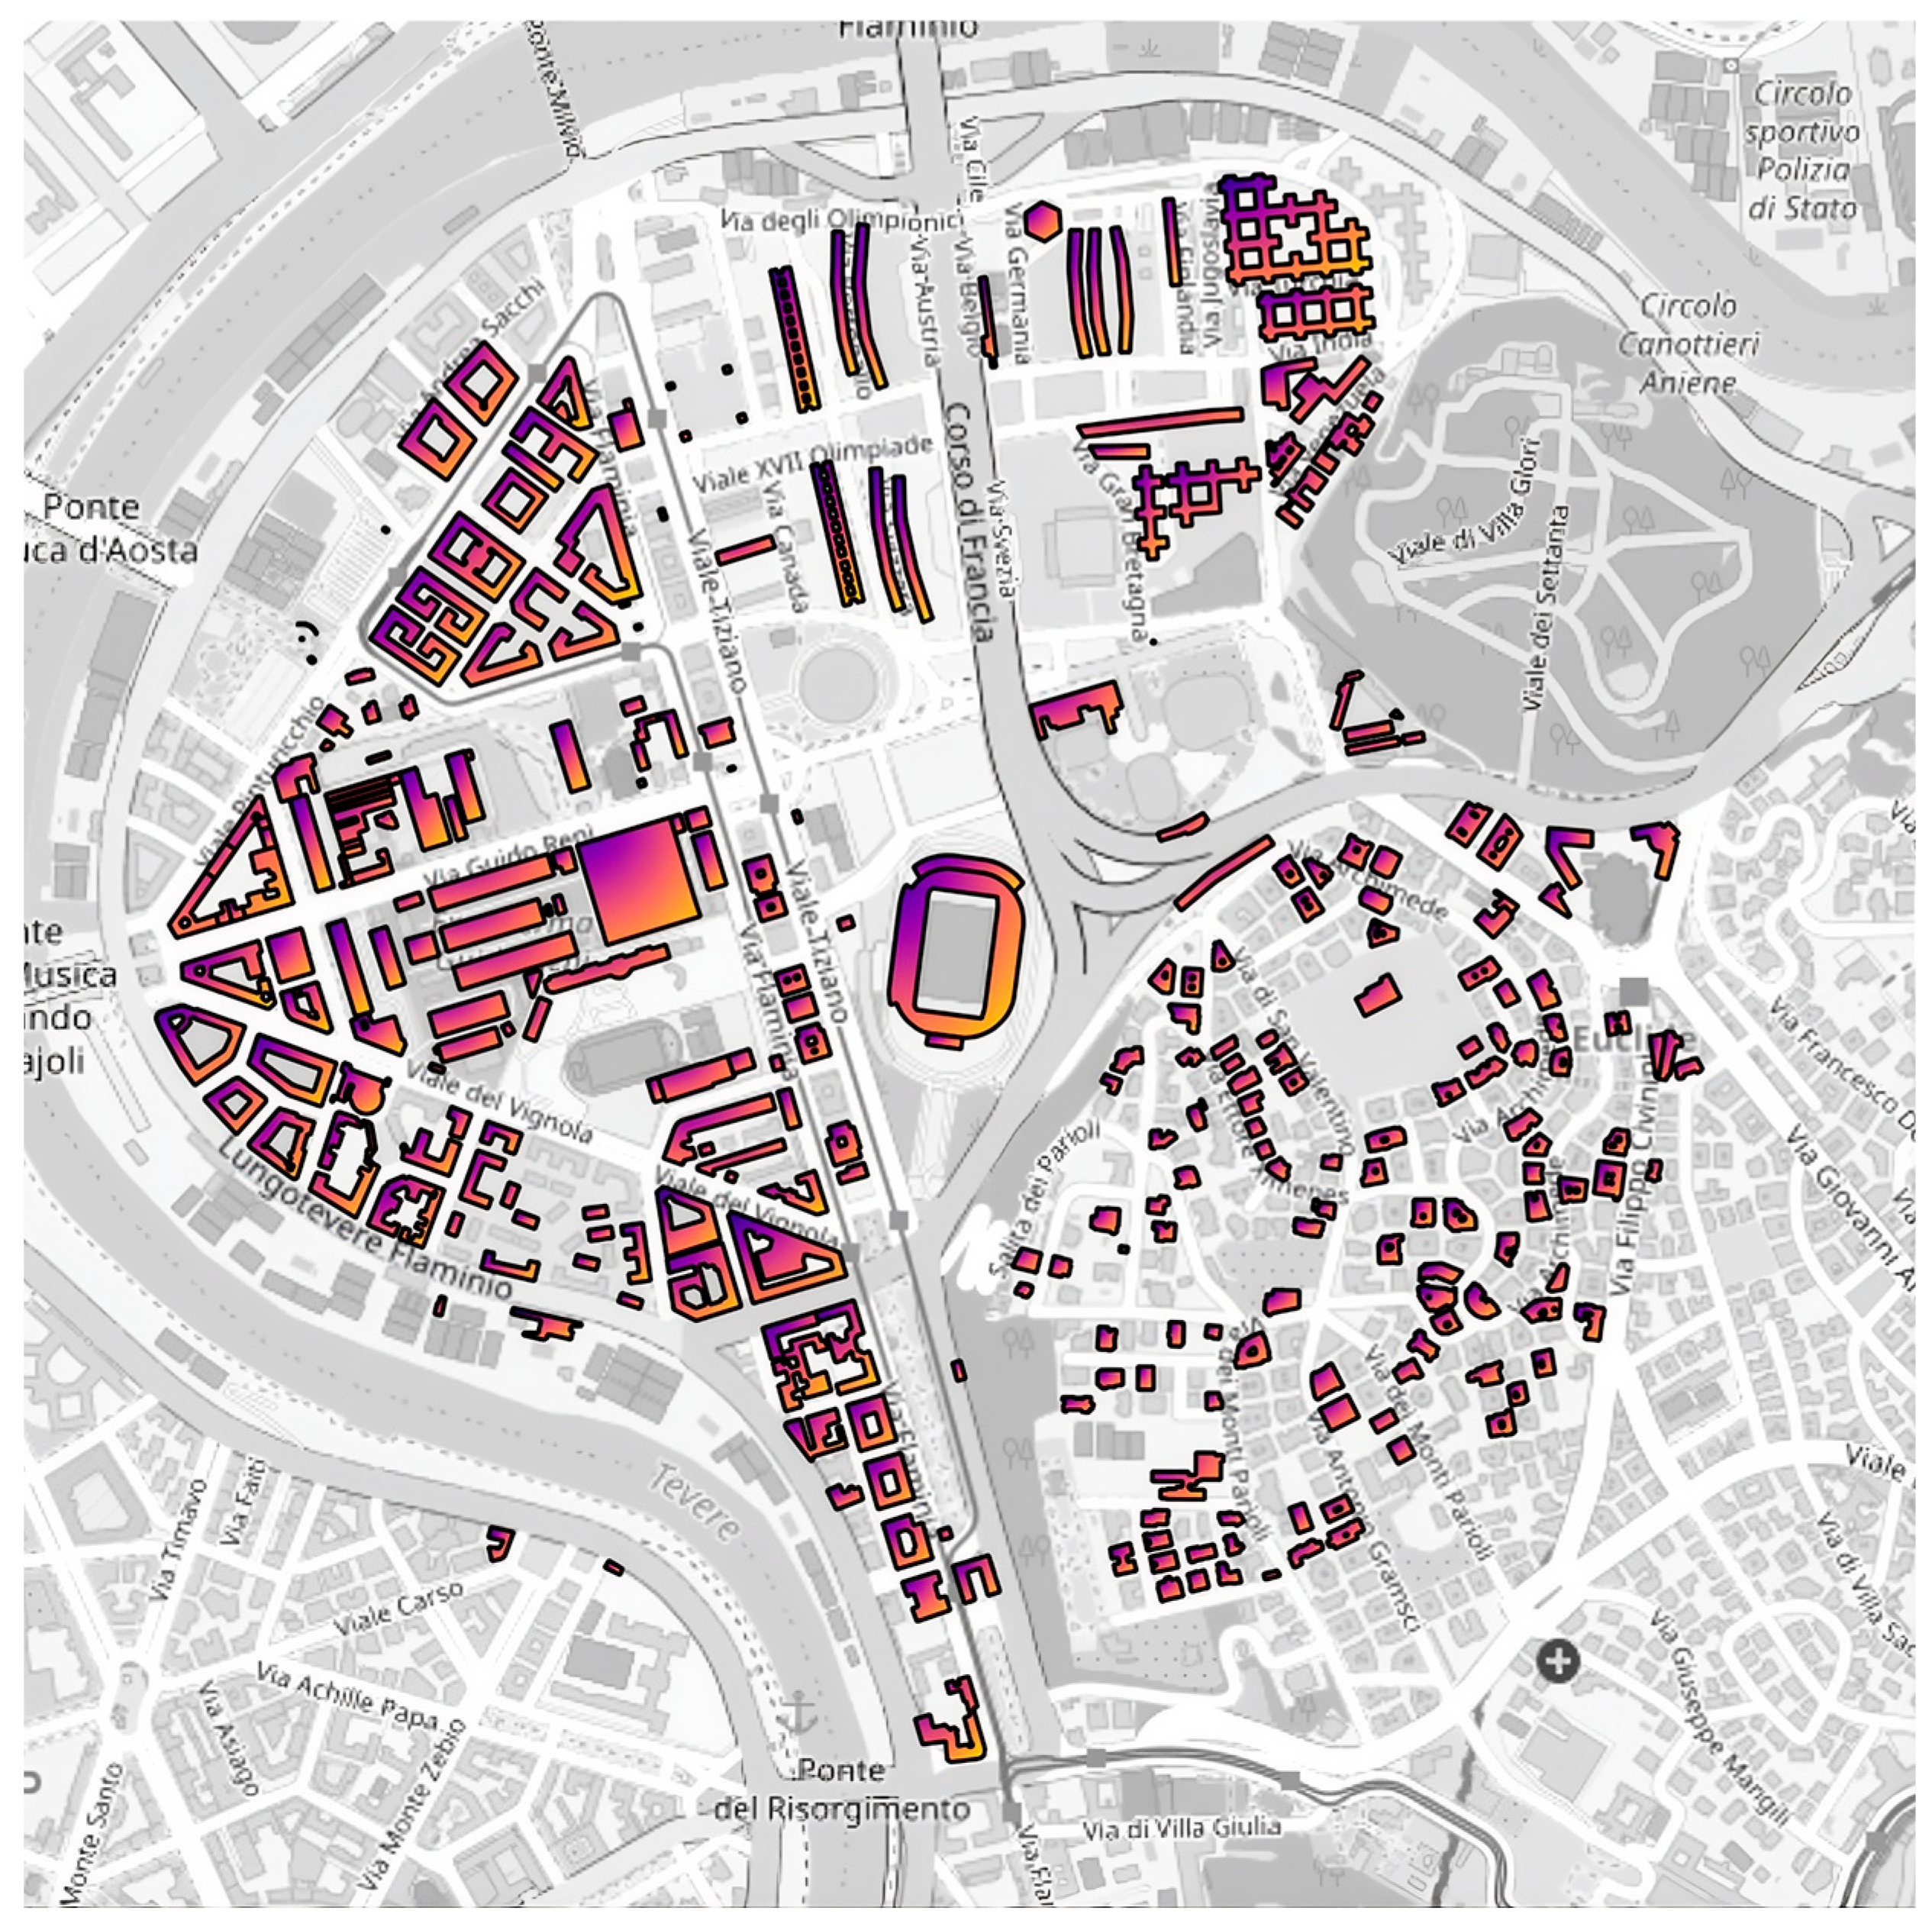
From an initial pool of 854 units, the iterative selection algorithm algorithm identified a subset of 734 buildings as the most efficient configuration (Figure 8). The remaining 120 buildings were excluded because their integration would have generated a solar surplus that the local cluster could not absorb.
Figure 8.
Buildings selected for the most efficient REC configuration.
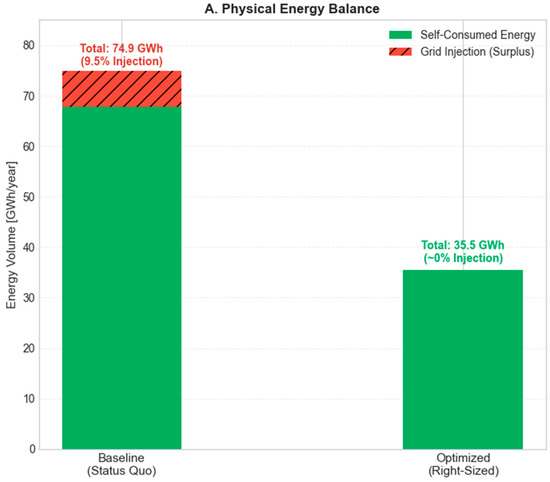
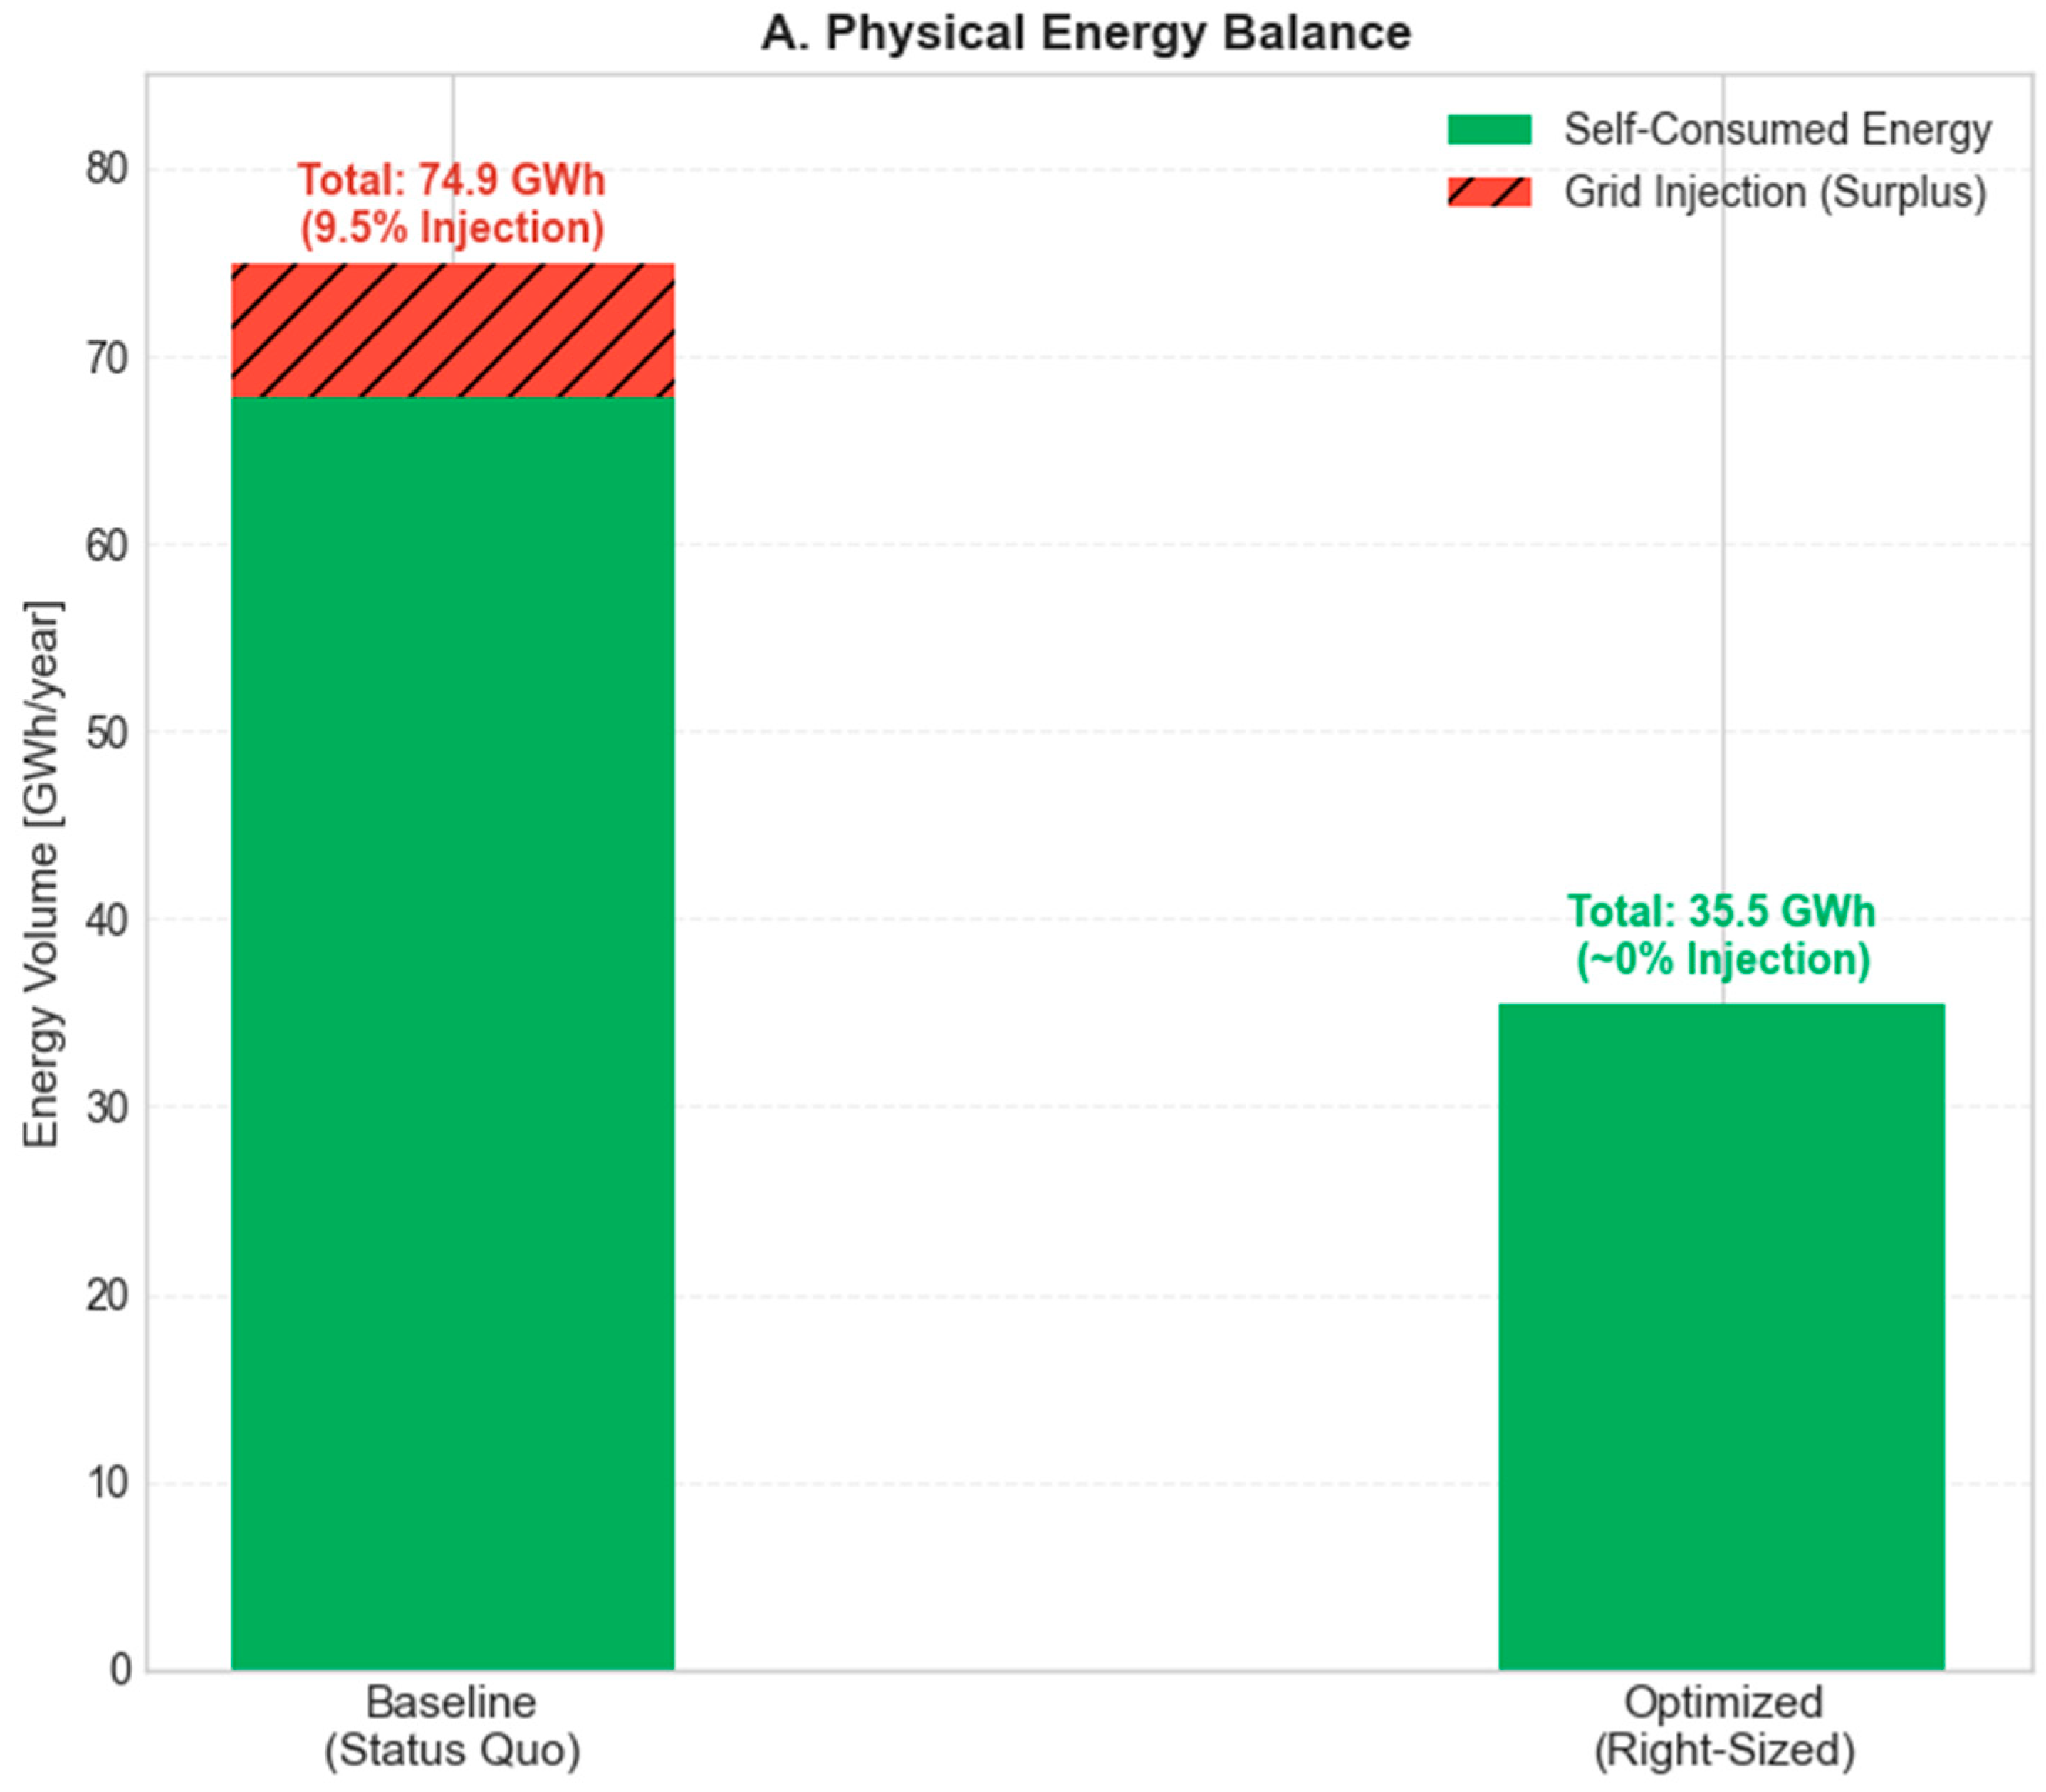
The graphical analysis highlights the dichotomy between the two design philosophies through a dual perspective. The physical energy balance presented in Figure 9 demonstrates that the optimization entails a drastic reduction in installed capacity. This transition reveals a distinct trade-off between the physical efficiency of the system and its independence, as visualized in the performance indicators. The Self-Consumption Rate, rises to near-perfection at 99.8%.
Figure 9.
Energy balance between the baseline and the optimized.
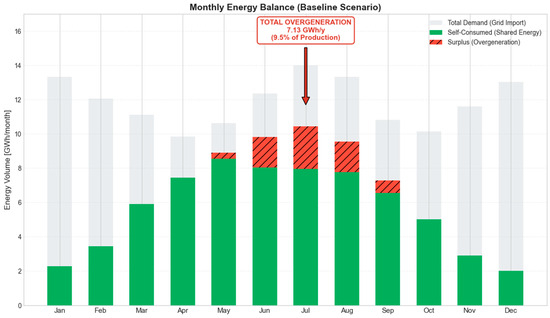
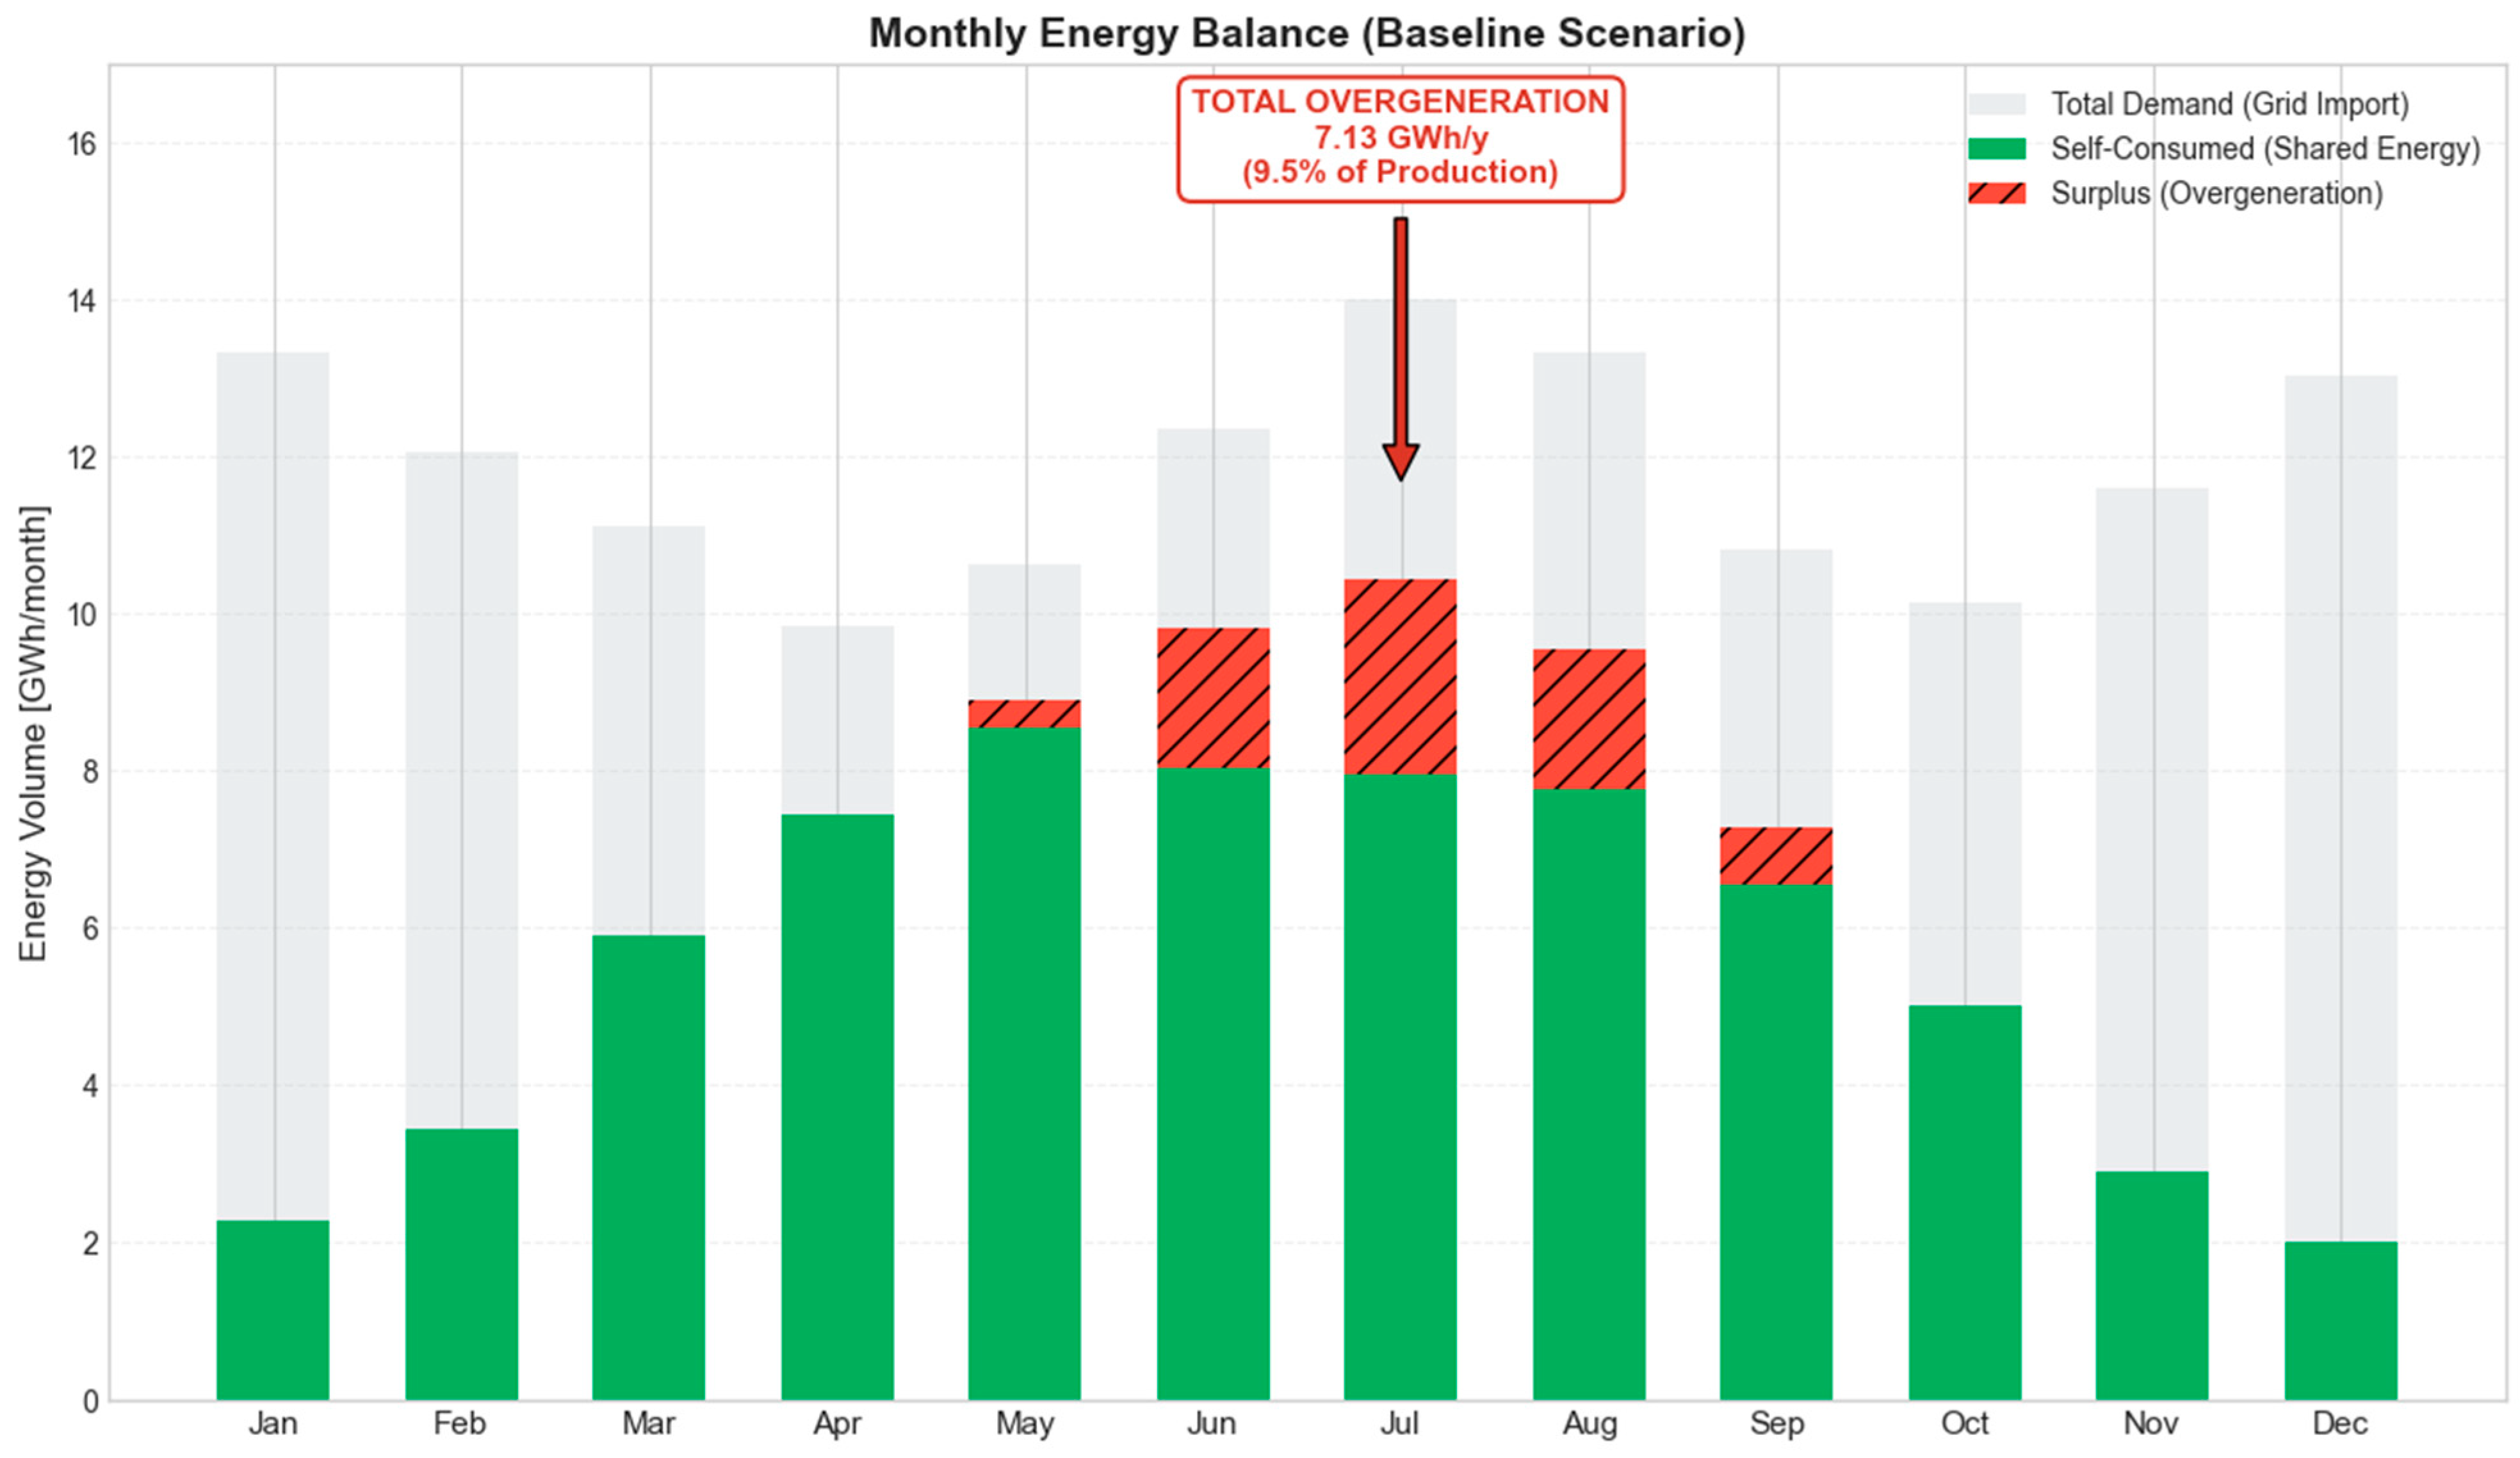
In Figure 10 the effect of the selection strategy becomes visually evident. The red cap of summer overgeneration, which characterized the baseline scenario, is completely eroded in the optimized configuration where the renewable generation volume is substantially contained within the district’s demand envelope, maximizing the instantaneous utility of the installed capacity.
Figure 10.
Monthly energy balance between the baseline and the optimized scenario.
Specifically, while the district’s aggregate load remained relatively stable, with a minor reduction of 7.5%, the volume of renewable energy collapsed by nearly half. This reduction is driven by the exclusion of large buildings, which previously provided a massive volume of base energy coverage. This analysis of the 120 excluded buildings reveals their specific energetic morphology: they are predominantly structures with expansive rooftop surfaces but remarkably low internal electrical demand. Integrating these specific nodes into the REC would have introduced an estimated 39.4 GWh/year of surplus generation. Because the Flaminio Stadium already saturates the district’s daytime absorption capacity, this additional 39.4 GWh/year would be exported to the national grid at low market prices (50 €/MWh), severely diluting the financial efficiency of the community. The Renewable Energy Community thus transitions from a volume-based strategy, characterized by high production and high waste, to a precision strategy that prioritizes grid stability and efficiency over absolute energy independence.
3.2. Flaminio Stadium Energy Analysis
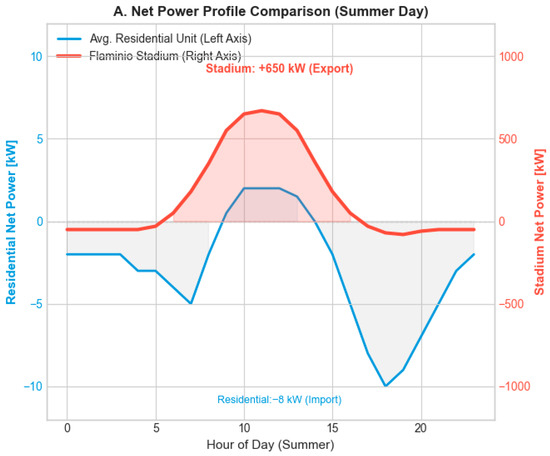
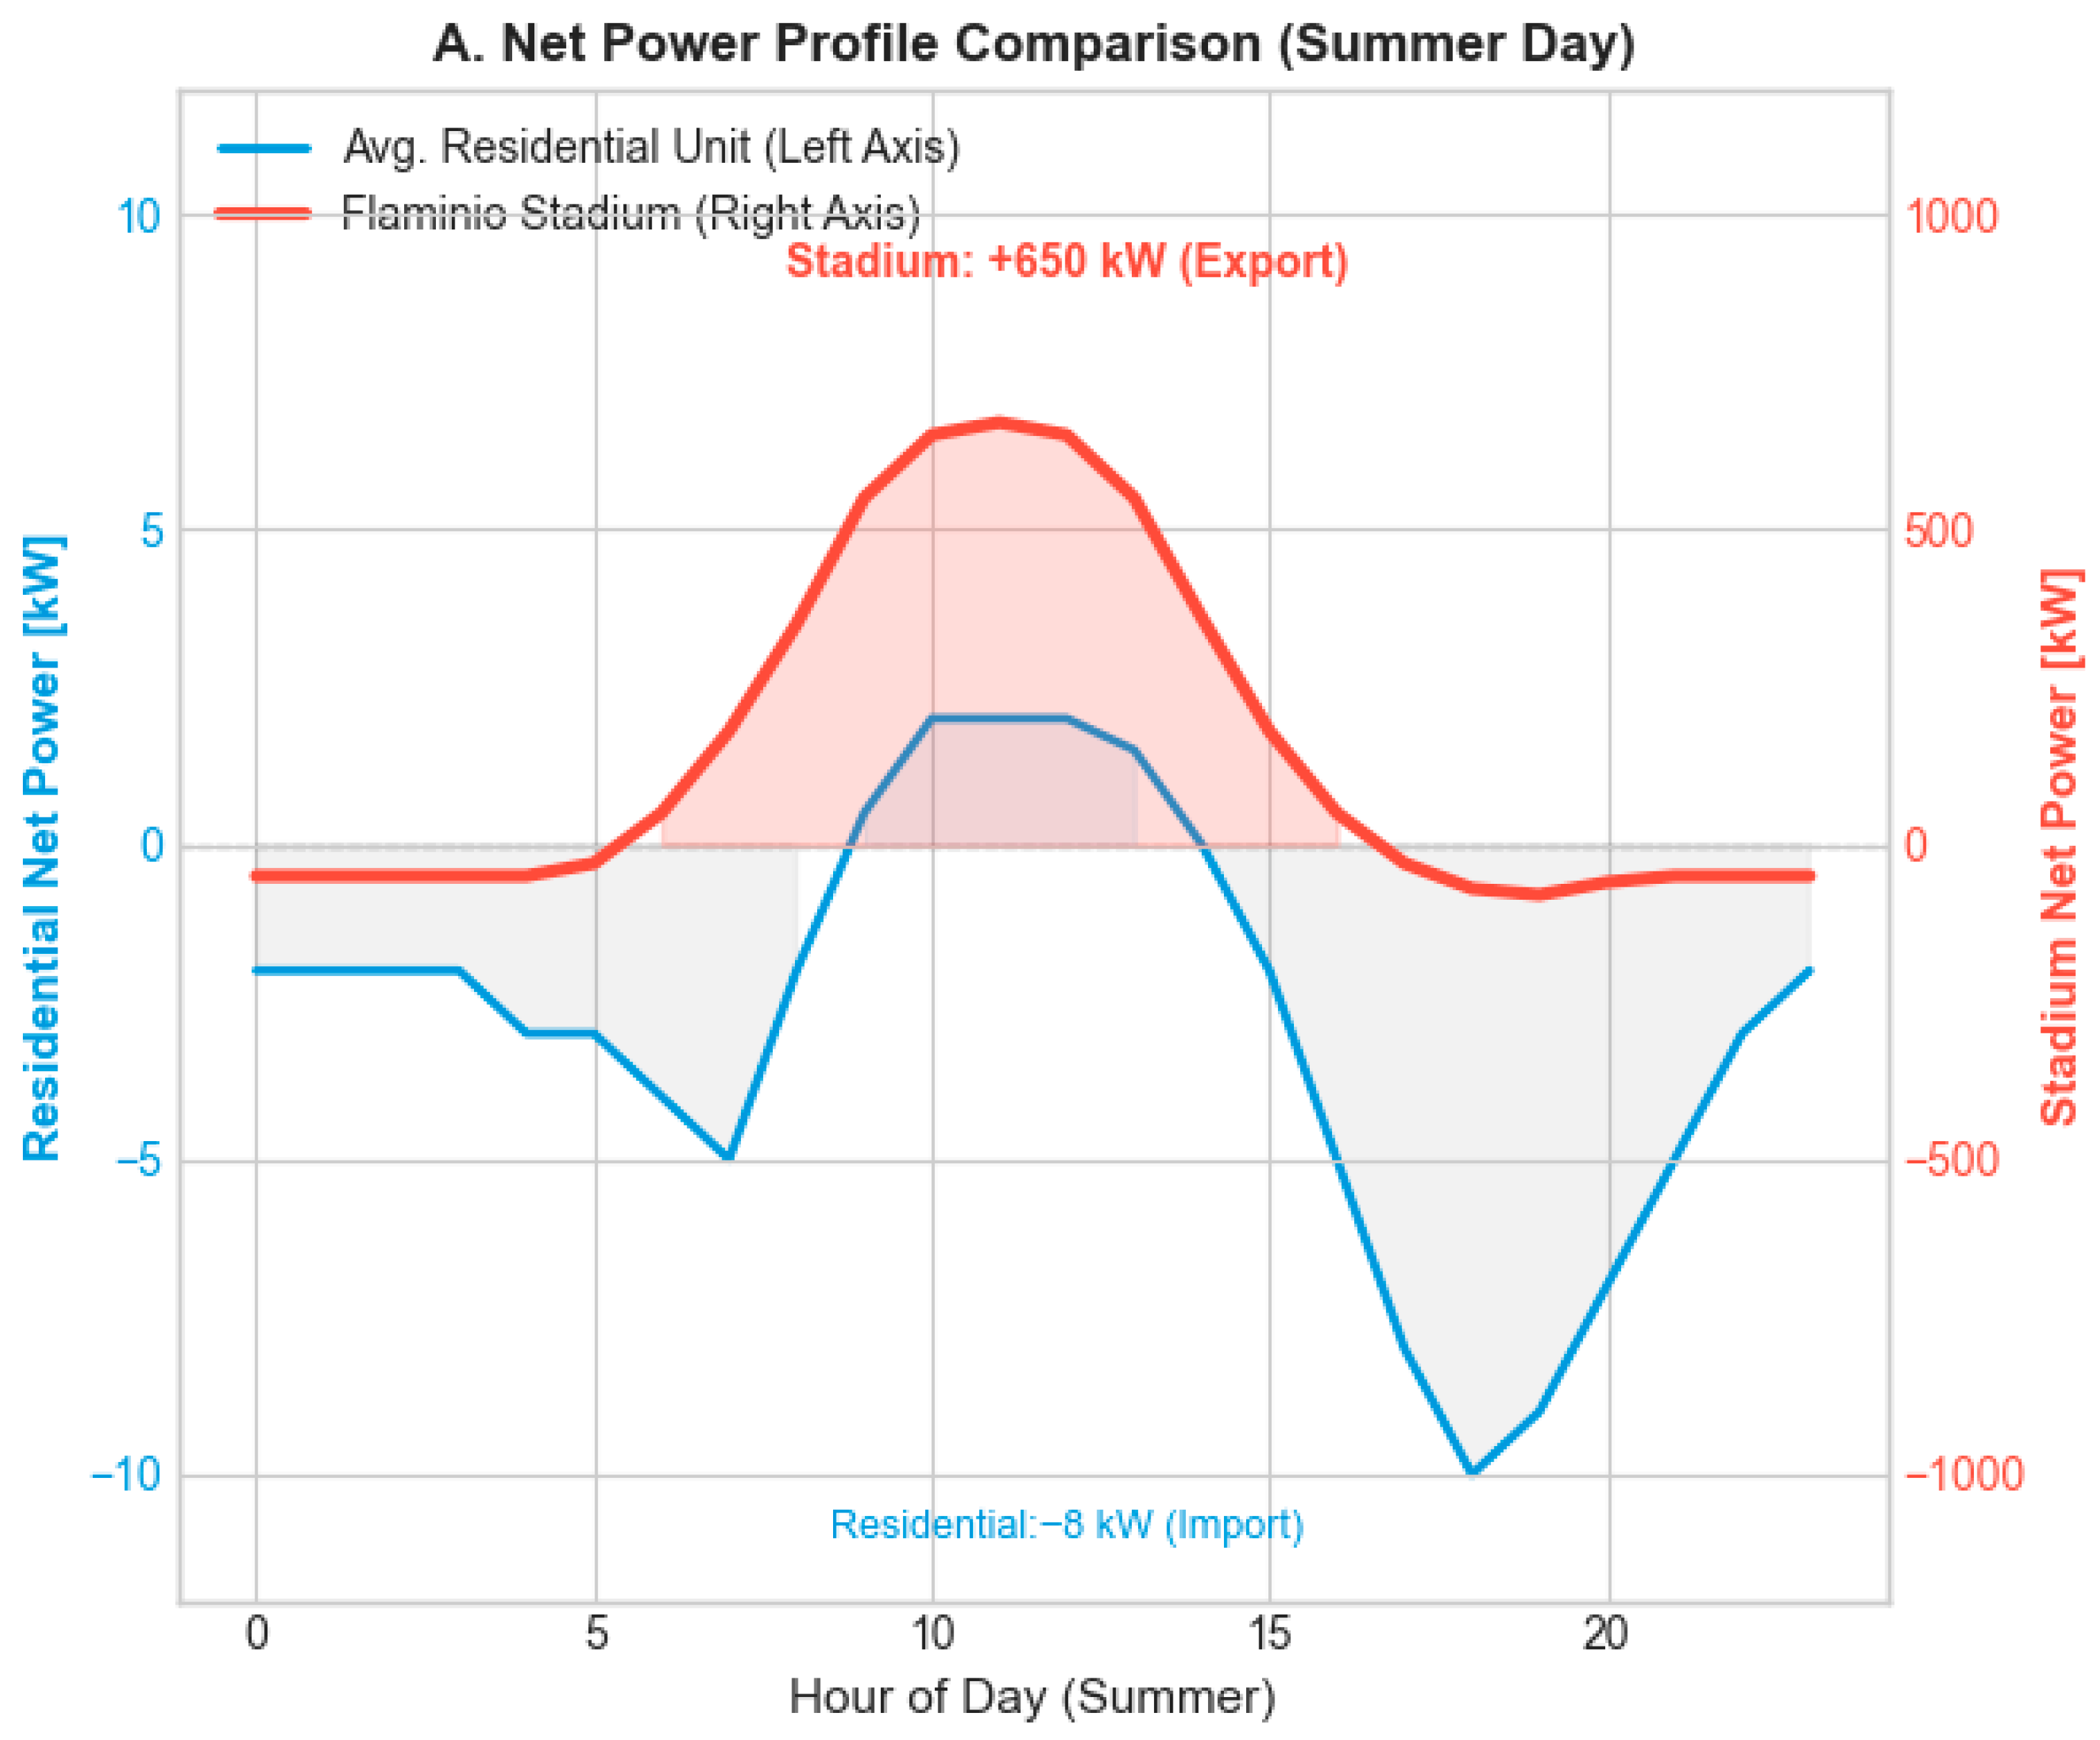
A specific focus was dedicated to the analysis of the Flaminio Stadium, identified as the single prosumer with the largest capturing surface (6681 m2). The stadium exhibits behavior typical of an power plant: against a limited physical self-consumption of 42.7%, the infrastructure exports 57.3% of its daily generation to the local grid (Table 2). This energy, which in a stand-alone configuration would be sold to the grid at low value, is instantly absorbed by the surrounding residential fabric within the REC, acting as a neighborhood virtual power plant. The specific impact of the Flaminio Stadium is detailed in Figure 11, revealing the scale mismatch that characterizes the district’s energy dynamics. While the average residential unit (blue line) oscillates within a narrow power range of ±8 kW, acting as a net consumer during peak evening hours, the Flaminio Stadium (red line) exhibits a massive positive injection peak exceeding 650 kW during midday hours. This behavior creates a systemic imbalance. Although the stadium is a valuable asset for annual energy generation, its instantaneous profile is strongly asynchronous with the residential district’s demand.
Table 2.
Stadium energy modeling results.
Figure 11.
Energy impact of the Flaminio Stadium.
It is crucial to contextualize these results within the specific morphology of the historical dense city. The baseline Self-Consumption Rate of 90.5% is already an exceptionally high figure when compared to typical urban Renewable Energy Communities, which frequently report collective SCR values ranging between 60% and 75% in standard European pilot projects [42,43]. This remarkably high starting baseline is structurally driven by the physical constraints of the district: the very limited available rooftop surfaces for PV installations, juxtaposed with the high density of residential electrical loads, naturally transforms the urban fabric into an ‘energy sponge’. In this load-dominant environment, the inclusion of the Flaminio Stadium acts as a massive centralized generation hub that meets the district’s chronic energy deficit. By algorithmically excluding the few remaining surplus-generating nodes, the framework successfully mitigates the residual grid injections that traditional proximity-based aggregations fail to address.
3.3. Economic Assessment and Financial Sustainability
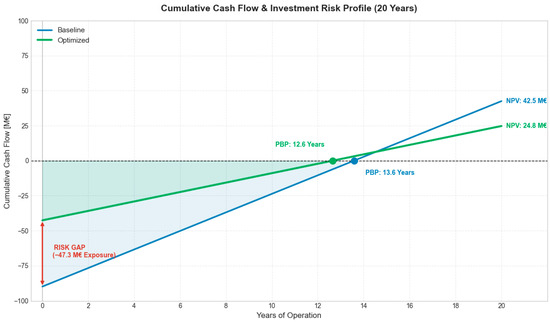
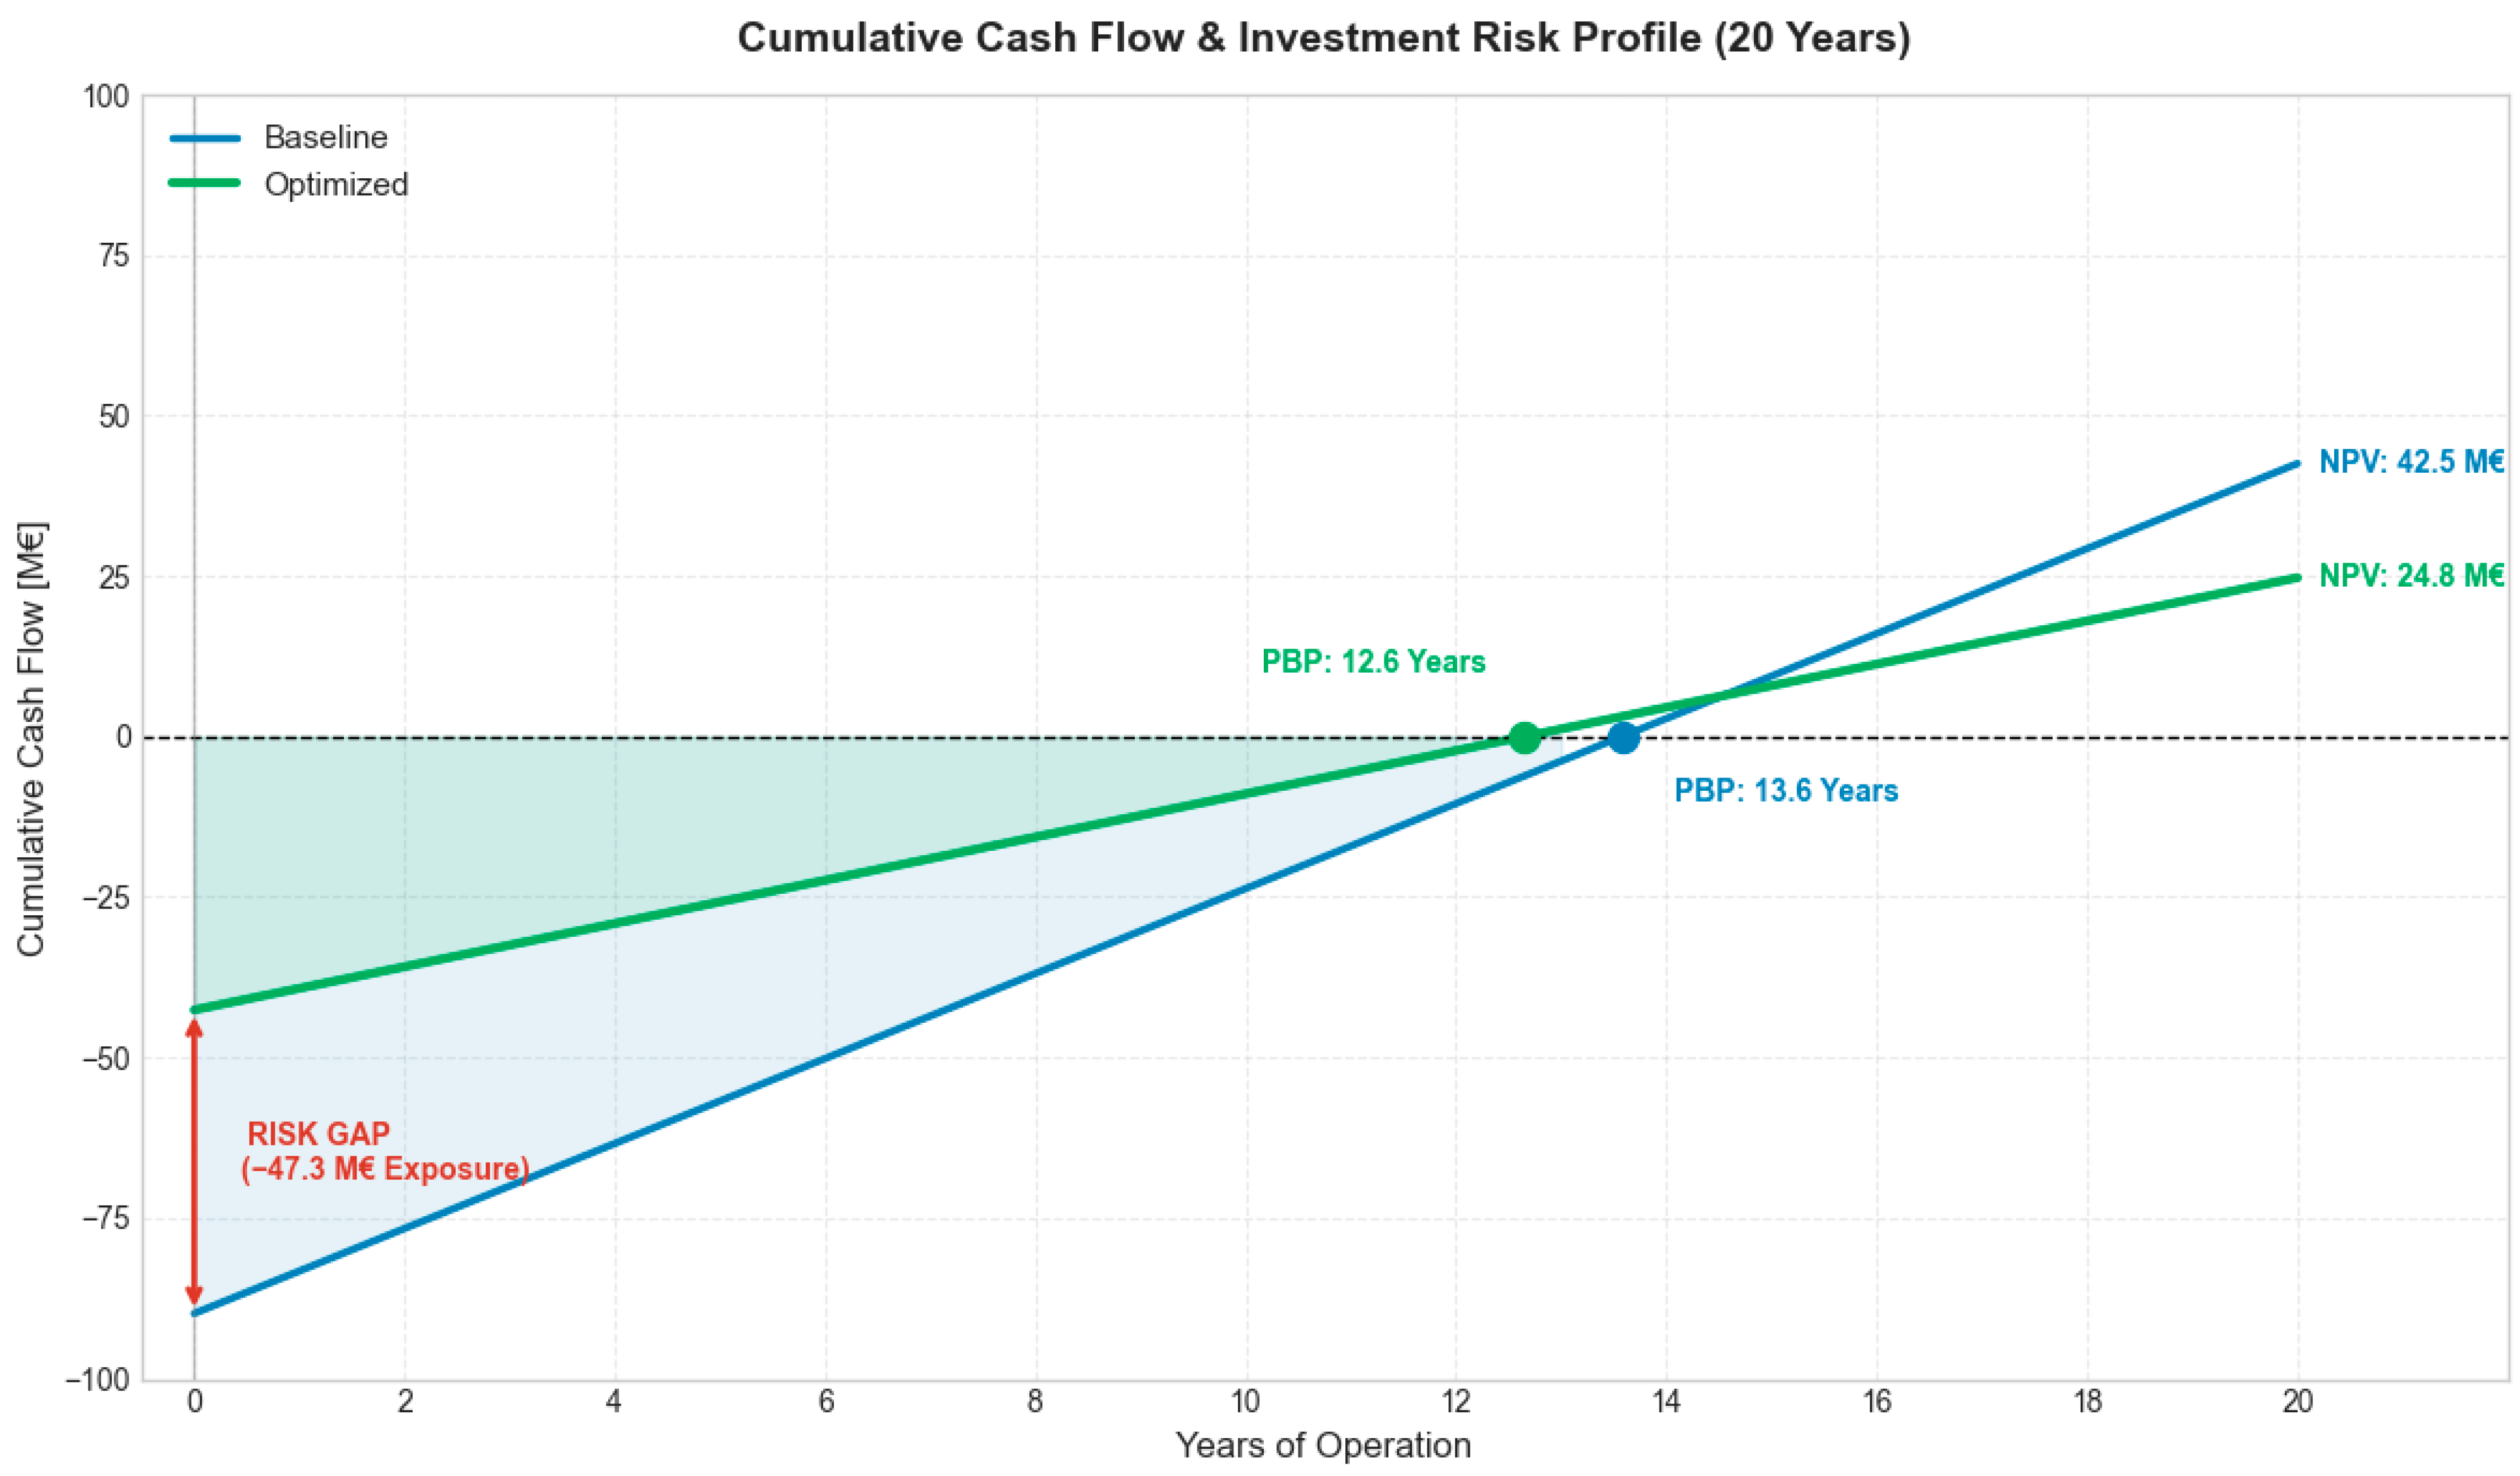
The economic evaluation was performed according to the current regulatory framework for Renewable Energy Communities (Decree MASE 2024), adopting a conservative approach to assess the project’s bankability. The financial trajectory of the investment over a 20-year horizon is visualized in the cumulative cash flow diagram in Figure 12.
Figure 12.
Baseline and optimized scenario cumulative cash flow.
The graph highlights the structural difference in risk exposure between the two configurations. The baseline scenario (Blue Line) requires a massive initial capital injection of 89.9 M€. While this configuration generates a higher terminal Net Present Value due to the sheer volume of installed capacity, it imposes a steep barrier to entry in terms of debt exposure. Conversely, the optimized scenario (Green Line) acts as a financial derisking tool. By rightsizing the generation capacity, the initial capital requirement drops by 52.6 M€ to 42.6 M€. As shown by the intersection with the horizontal axis, this drastic reduction in the investment does not negatively impact the return speed; both scenarios share a nearly identical Payback Period (PBP) of approximately 13 years. The detailed comparison of key financial indicators is presented in Table 3.
Table 3.
Comparison of key financial indicators.
The data confirm that the optimization strategy improves the quality of revenue. In the baseline scenario, a portion of the cash flow is derived from low-value market sales of surplus energy, diluting the overall efficiency. In the optimized scenario, 99.9% of revenues are generated by the high-value incentive tariff (119 €/MWh). Consequently, the Renewable Energy Community transitions from a high-volume, high-risk infrastructure project to an agile, highly bankable asset with a manageable debt profile and a stabilized cash flow protected from market price volatility. The techno-economic results reveal a consistent payback period of approximately 13 years across the evaluated configurations, even when scaling the cluster boundaries leads to a near doubling of both the initial Capital Expenditure (CAPEX) and the annual revenues. This constancy is not a coincidence, but rather the arithmetic reflection of the system’s linear scalability. Because the modular cost of PV installations scales proportionally with capacity, and the algorithm successfully curates the cluster to maintain an optimal Self-Consumption Rate (SCR) near 99.8%, the high-value incentive revenues (119 €/MWh) scale in perfect tandem with the capital costs. Consequently, the ratio between the total investment and the annual cash flow remains stable. From a sensitivity perspective, this demonstrates that the payback duration of the framework is highly inelastic to the volumetric size of the REC. Instead, the financial risk is concentrated almost entirely on exogenous market factors, meaning the 13-year return is primarily sensitive to macro-fluctuations in PV hardware costs or future regulatory alterations to the national incentive tariffs.
4. Conclusions
This study proposed a data-driven, GIS-based methodology for the optimal design of Renewable Energy Communities (RECs) within consolidated urban fabrics, using the Flaminio district in Rome as a pilot case. The research highlighted the complex interaction between the residential fabric and large-scale urban infrastructures, with a specific focus on the impact of the Flaminio Stadium.
The application of the spatial selection algorithm demonstrated that, to ensure the immediate economic and energetic sustainability of the residential REC, it is preferable to configure a virtuous cluster of 734 buildings starting from 854 ones, which achieves a near-perfect SCR of 99%. The simulations confirm that the massive production capacity of the new photovoltaic coverage, estimated at approximately 1.37 GWh/year, is perfectly sized to bridge the district’s energy gap. The load profile analysis demonstrates that the REC possesses an aggregate absorption capacity sufficient to fully consume the energy produced by the stadium, even during peak solar generation hours. The residential cluster acts as an energy sponge, absorbing the sports facility’s daytime surplus and transforming it into virtuous self-consumption. Consequently, the stadium’s contribution goes beyond mere power generation; it serves as the indispensable catalytic core that provides the critical mass of energy required to achieve near-total self-sufficiency.
Regarding the applicability limits of this research, the proposed framework is best suited for high-density urban fabrics where roof space is structurally limited, and load diversity is high. In rural contexts or industrial districts with low building density, the ‘energy core’ model may not be strictly necessary, as individual buildings often possess sufficient surface area to achieve high Self-Consumption Rates (SCR) independently. Furthermore, while the spatial filtering logic remains theoretically universal, the Building Energy Ratio (BER) metric requires specific calibration and adaptation when applied to regions with drastically different solar irradiance patterns and climatic conditions (e.g., Northern Europe vs. the Mediterranean basin). Future research phases will aim to extend this methodological approach to non-urban contexts, such as rural areas or industrial districts.
A recognized limitation of this study is the reliance on synthetic load profiles derived from standard ARERA curves rather than high-resolution smart-metering data. Consequently, synthetic profiles tend to smooth out extreme localized demand peaks and valleys. This ‘flattening’ effect may lead to a slight overestimation of the continuous temporal overlap between photovoltaic generation and electrical demand, thereby affecting the extreme instantaneous precision of the calculated Self-Consumption Rate. Future developments will greatly benefit from the integration of real-world smart-meter datasets, which would allow for a more granular, real-time assessment of peer-to-peer energy exchanges within the district.
Future research directions will therefore proceed along two parallel paths. First, the study will investigate the integration of industrial scale Battery Energy Storage Systems (BESS), capable of decoupling the stadium’s production from immediate consumption, thereby transforming its surplus into a deferred reserve for the community. Second, the research aims to extend the application of the proposed morphological selection algorithm to non-urban contexts, such as rural areas or industrial districts. This will allow for verification of whether the correlation between building density and REC efficiency maintains the same validity observed in the compact fabric of the historic city, potentially generalizing the method for broader territorial planning.
It could be argued that relying on spatial filtering (excluding buildings) rather than integrating Battery Energy Storage Systems (BESS), Demand Response (DR) protocols, or dynamic pricing renders the optimization framework incomplete. However, from an urban planning perspective, this passive optimization is not a substitute for active technology, but a critical prerequisite that drastically reduces the required size, and thus the cost, of future BESS or DR systems, ensuring the long-term financial resilience of the community.
From an algorithmic perspective, a recognized limitation of this study is the use of a single-objective heuristic without benchmark comparisons against other established methodologies. While this approach demonstrates the practical viability of the spatial GIS framework, future research should rigorously compare this heuristic against advanced meta-heuristics (e.g., Genetic Algorithms or Particle Swarm Optimization) and exact mathematical programming (e.g., Mixed-Integer Linear Programming). Furthermore, transitioning to a multi-objective optimization framework, simultaneously maximizing collective SCR, individual NPV, and minimizing grid import, will be essential to fully capture the complex trade-offs inherent in REC design.
Ultimately, future research should contain simulations to quantify uncertainty ranges for key performance indicators (SCR, NPV) arising from input data variability and model assumptions.
Author Contributions
Conceptualization, G.B.; Software, D.V.; Validation, D.V.; Formal Analysis, D.V.; Investigation, G.B. and D.V.; Data Curation, D.V.; Writing—Original Draft Preparation, G.B., D.V., L.B. and E.d.L.V.; Writing—Review and Editing, G.B., D.V., L.B. and E.d.L.V.; Visualization, R.d.L.V.,L.B. and E.d.L.V.; Supervision, R.d.L.V. and G.B. All authors have read and agreed to the published version of the manuscript.
Funding
This research received no external funding.
Institutional Review Board Statement
Not applicable.
Informed Consent Statement
Not applicable.
Data Availability Statement
The aggregated data, mathematical formulations, and algorithmic logic supporting the findings of this study are contained within the article. The raw high-resolution spatial datasets and scripts are not publicly available due to privacy and licensing restrictions, but the methodology is fully replicable using the provided parameters and pseudo-code.
Acknowledgments
I use Gemini 3 Flash AI to improve the writing.
Conflicts of Interest
The authors declare no conflicts of interest.
Abbreviations
The following abbreviations are used in this manuscript:
| REC | Renewable Energy Community |
| RES | Renewable Energy System |
| SCR | Self-Consumption Rate |
| SSR | Self-Sufficiency Rate |
| PV | Solar Photovoltaics |
| DSS | Decision Support System |
| BER | Building Energy Ratio |
| DSM | Digital Surface Model |
| KPI | Key Performance Indicators |
| GFA | Gross Floor Area |
| NPV | Net Present Value |
| PBP | Pay Back Period |
| CAPEX | Capital Expenditure |
References
- Ellabban, O.; Abu-Rub, H.; Blaabjerg, F. Renewable Energy Resources: Current Status, Future Prospects and Their Enabling Technology. Renew. Sustain. Energy Rev. 2014, 39, 748–764. [Google Scholar] [CrossRef] [Scilit]
- Zeng, Q.; Li, R.; Zhang, T. Do Natural Resources Ensure Energy Efficiency? A Novel Paradigm of Resources-Efficiency Nexus for Sustainable Development. Resour. Policy 2023, 87, 104323. [Google Scholar] [CrossRef] [Scilit]
- The European Parliament and the Council of the European Union. Directive (EU) 2018/2001 of the European Parliament and of the Council of 11 December 2018 on the Promotion of the Use of Energy From Renewable Sources. Off. J. Eur. Union 2018, 328, 82–209. [Google Scholar]
- Bouckaert, S.; Pales, A.F.; McGlade, C.; Remme, U.; Wanner, B.; Varro, L.; D’Ambrosio, D.; Spencer, T. Net Zero by 2050: A Roadmap for the Global Energy Sector; International Energy Agency: Paris, France, 2021. [Google Scholar]
- Ahmed, S.; Ali, A.; D’Angola, A. A Review of Renewable Energy Communities: Concepts, Scope, Progress, Challenges, and Recommendations. Sustainability 2024, 16, 1749. [Google Scholar] [CrossRef] [Scilit]
- Kuzemko, C.; Blondeel, M.; Dupont, C.; Brisbois, M.C. Russia’s War on Ukraine, European Energy Policy Responses & Implications for Sustainable Transformations. Energy Res. Soc. Sci. 2022, 93, 102842. [Google Scholar] [CrossRef] [Scilit]
- Mišík, M.; Nosko, A. Post-Pandemic Lessons for EU Energy and Climate Policy after the Russian Invasion of Ukraine: Introduction to a Special Issue on EU Green Recovery in the Post-COVID-19 Period. Energy Policy 2023, 177, 113546. [Google Scholar] [CrossRef] [Scilit]
- Zhu, Y.; Salvalai, G.; Zangheri, P. Italian Renewable Energy Communities: Status and Prospect Development Analysis. Energy Build. 2025, 348, 116404. [Google Scholar] [CrossRef] [Scilit]
- López, I.; Goitia-Zabaleta, N.; Milo, A.; Gómez-Cornejo, J.; Aranzabal, I.; Gaztañaga, H.; Fernandez, E. European Energy Communities: Characteristics, Trends, Business Models and Legal Framework. Renew. Sustain. Energy Rev. 2024, 197, 114403. [Google Scholar] [CrossRef] [Scilit]
- Wierling, A.; Schwanitz, V.J.; Zeiss, J.P.; von Beck, C.; Paudler, H.A.; Koren, I.K.; Kraudzun, T.; Marcroft, T.; Müller, L.; Andreadakis, Z.; et al. A Europe-Wide Inventory of Citizen-Led Energy Action with Data from 29 Countries and over 10000 Initiatives. Sci. Data 2023, 10, 9. [Google Scholar] [CrossRef] [Scilit]
- Dupré la Tour, M.A. Photovoltaic and Wind Energy Potential in Europe—A Systematic Review. Renew. Sustain. Energy Rev. 2023, 179, 113189. [Google Scholar] [CrossRef] [Scilit]
- Al-Shetwi, A.Q. Sustainable Development of Renewable Energy Integrated Power Sector: Trends, Environmental Impacts, and Recent Challenges. Sci. Total Environ. 2022, 822, 153645. [Google Scholar] [CrossRef] [Scilit]
- Deason, J.; Borgeson, M. Electrification of Buildings: Potential, Challenges, and Outlook. Curr. Sustain./Renew. Energy Rep. 2019, 6, 131–139. [Google Scholar] [CrossRef] [Scilit]
- Şirin, C.; Goggins, J.; Hajdukiewicz, M. A Review on Building-Integrated Photovoltaic/Thermal Systems for Green Buildings. Appl. Therm. Eng. 2023, 229, 120607. [Google Scholar] [CrossRef] [Scilit]
- Gielen, D.; Boshell, F.; Saygin, D.; Bazilian, M.D.; Wagner, N.; Gorini, R. The Role of Renewable Energy in the Global Energy Transformation. Energy Strategy Rev. 2019, 24, 38–50. [Google Scholar] [CrossRef] [Scilit]
- Peeters, L.; López, L.F.; Trompoukis, C. Addressing the Gaps in Understanding and Assessing Energy Communities. Energy Res. Soc. Sci. 2025, 127, 104176. [Google Scholar] [CrossRef] [Scilit]
- Kubli, M.; Puranik, S. A Typology of Business Models for Energy Communities: Current and Emerging Design Options. Renew. Sustain. Energy Rev. 2023, 176, 113165. [Google Scholar] [CrossRef] [Scilit]
- Musolino, M.; Maggio, G.; D’Aleo, E.; Nicita, A. Three Case Studies to Explore Relevant Features of Emerging Renewable Energy Communities in Italy. Renew. Energy 2023, 210, 540–555. [Google Scholar] [CrossRef] [Scilit]
- Blečić, I.; Carrus, A.S.; Congiu, E.; Desogus, G.; Muroni, E.; Saiu, V. Renewable Energy Communities Design: A Decision Support Tool for Integrated Impact Assessment. Insights from the First REC in Cagliari, Italy. J. Clean. Prod. 2025, 510, 145600. [Google Scholar] [CrossRef] [Scilit]
- Caiaffa, E.; Pollino, M.; Marucci, A. A GIS Based Methodology in Renewable Energy Sources Sustainability. Int. J. Agric. Environ. Inf. Syst. 2014, 5, 17–36. [Google Scholar] [CrossRef] [Scilit]
- Anselmo, S.; Safaeianpour, A.; Moghadam, S.; Ferrara, M. GIS-Based Solar Radiation Modelling for Photovoltaic Potential in Cities: A Sensitivity Analysis for the Evaluation of Output Variability Range. Energy Rep. 2024, 12, 4656–4669. [Google Scholar] [CrossRef] [Scilit]
- Gao, Y.; Tahir, M.; Siano, P.; Hussain, S.; Sun, W.; He, Y.; Meng, Q. A Bi-Level Hybrid Game Framework for Stochastic Robust Optimization in Multi-Integrated Energy Microgrids. Sustain. Energy Grids Netw. 2025, 44, 102024. [Google Scholar] [CrossRef] [Scilit]
- Moyroud, N.; Portet, F. Introduction to QGIS. In QGIS and Generic Tools; John Wiley & Sons: Hoboken, NJ, USA, 2018; Volume 1, pp. 1–17. [Google Scholar]
- Battista, G.; Roncone, M.; Vollaro, E. Urban Overheating Impact: A Case Study on Building Energy Performance. Appl. Sci. 2021, 11, 8327. [Google Scholar] [CrossRef] [Scilit]
- Barbaro, L.; Battista, G.; De Lieto Vollaro, E.; Sapia, C.; De Lieto Vollaro, R. School Roofs: Hubs of New Renewable Energy Communities. E3S Web Conf. 2024, 566, 04003. [Google Scholar] [CrossRef] [Scilit]
- Katsaprakakis, D.A.; Papadakis, N.; Giannopoulou, E.; Yiannakoudakis, Y.; Zidianakis, G.; Katzagiannakis, G.; Dakanali, E.; Stavrakakis, G.M.; Kartalidis, A. Rational Use of Energy in Sport Centers to Achieving Net Zero—The SAVE Project (Part B: Indoor Sports Hall). Energies 2023, 16, 7308. [Google Scholar] [CrossRef] [Scilit]
- Ahmed, A.; Nadeem, T.B.; Naqvi, A.A.; Siddiqui, M.A.; Khan, M.H.; Bin Zahid, M.S.; Ammar, S.M. Investigation of PV Utilizability on University Buildings: A Case Study of Karachi, Pakistan. Renew. Energy 2022, 195, 238–251. [Google Scholar] [CrossRef] [Scilit]
- Devetaković, M.; Djordjević, D.; Radojević, M.; Krstić-Furundžić, A.; Burduhos, B.-G.; Martinopoulos, G.; Neagoe, M.; Lobaccaro, G. Photovoltaics on Landmark Buildings with Distinctive Geometries. Appl. Sci. 2020, 10, 6696. [Google Scholar] [CrossRef] [Scilit]
- Tiberi, M.; Carbonara, E.; Sforzini, V. Sustainable Requalification in Restricted Area: The Case Study of Flaminio Stadium in Rome. Energy Procedia 2017, 126, 305–312. [Google Scholar] [CrossRef] [Scilit]
- Union of European Football Associations. UEFA Sustainability Guidelines for Football Infrastructure. 2018. Available online: https://editorial.uefa.com/resources/027b-168e898b309b-c76f49dada9e-1000/the_uefa_sustainable_infrastructure_guidelines.pdf (accessed on 27 November 2023).
- Barbaro, L.; Battista, G.; de Lieto Vollaro, E.; de Lieto Vollaro, R. Harnessing Stadium Roofs for Community Electrical Power: A Case Study of Rome’s Olympic Stadium Title. Appl. Sci. 2024, 14, 7344. [Google Scholar] [CrossRef] [Scilit]
- Manni, M.; Coccia, V.; Nicolini, A.; Marseglia, G.; Petrozzi, A. Towards Zero Energy Stadiums: The Case Study of the Dacia Arena in Udine, Italy. Energies 2018, 11, 2396. [Google Scholar] [CrossRef] [Scilit]
- Besagni, G.; Premoli Vilà, L.; Borgarello, M. Italian Household Load Profiles: A Monitoring Campaign. Buildings 2020, 10, 217. [Google Scholar] [CrossRef] [Scilit]
- Qian, T.; Wang, K.; Li, Y.; Guo, X.; Liu, J. Analysis of Electric Load Characteristics of Commercial and Public Buildings Based on Big Data. IOP Conf. Ser. Mater. Sci. Eng. 2018, 394, 042105. [Google Scholar] [CrossRef] [Scilit]
- Georgitsioti, T.; Pearsall, N.; Forbes, I.; Pillai, G. A Combined Model for PV System Lifetime Energy Prediction and Annual Energy Assessment. Sol. Energy 2019, 183, 738–744. [Google Scholar] [CrossRef] [Scilit]
- IRENA—International Renewable Energy Agency. Available online: https://www.irena.org/ (accessed on 29 November 2023).
- Energetici, G.d.S. Mappa Interattiva Delle Cabine Primarie. Available online: https://www.gse.it/servizi-per-te/autoconsumo/mappa-interattiva-delle-cabine-primarie (accessed on 13 May 2024).
- Asdrubali, F.; De Lieto Vollaro, R.; Lelo, K.; Monni, S.; Roncone, M.; Tomassi, F. La Povertà Energetica a Roma: Un’analisi Dei Consumi Di Energia Elettrica Nelle 155 Zone Urbanistiche. Econ. E Politica 2023, 25, 1–4. [Google Scholar]
- Prataviera, E.; Vivian, J.; Bertelli, F.; De Carli, M. An Italian Residential Electric Consumption Generator for Renewable Energy Communities Analyses. In Proceedings of the 2024 AEIT International Annual Conference (AEIT), Trento, Italy, 25–27 September 2024; pp. 1–6. [Google Scholar]
- How Much Energy Does a World Cup Stadium Use in 2018? Available online: https://selectra.co.uk/energy/news/world/world-cup-2018-stadium-energy-use (accessed on 28 November 2023).
- TSJ Staff. Premier League Football Clubs Stadium Costs Data. The Sports Journal, 10 February 2024.
- Fina, B.; Auer, H.; Friedl, W. Profitability of PV Sharing in Energy Communities: Use Cases for Different Settlement Patterns. Energy 2019, 189, 116148. [Google Scholar] [CrossRef] [Scilit]
- Weckesser, T.; Dominković, D.F.; Blomgren, E.M.V.; Schledorn, A.; Madsen, H. Renewable Energy Communities: Optimal Sizing and Distribution Grid Impact of Photo-Voltaics and Battery Storage. Appl. Energy 2021, 301, 117408. [Google Scholar] [CrossRef] [Scilit]

Disclaimer/Publisher’s Note: The statements, opinions and data contained in all publications are solely those of the individual author(s) and contributor(s) and not of MDPI and/or the editor(s). MDPI and/or the editor(s) disclaim responsibility for any injury to people or property resulting from any ideas, methods, instructions or products referred to in the content. |
© 2026 by the authors. Licensee MDPI, Basel, Switzerland. This article is an open access article distributed under the terms and conditions of the Creative Commons Attribution (CC BY) license.