


Abstract
Existing encoder–decoder architectures operating in the field of deep learning-based image segmentation face fundamental limitations such as information loss, performance degradation as network depth increases, and high computational costs. To overcome these issues, we propose a new architecture that integrates features from different depth levels at a single fusion point. This approach enables both comprehensive representation power and the preservation of very small details. The proposed approach creates an efficient structure that achieves high accuracy values without requiring unnecessary network deepening. The designed model was comprehensively compared with state-of-the-art architectures such as U-Net, V-Net, W-Net, T-Net, Seg-Net, and Multiple U-Net, which are accepted in the literature, on datasets with different characteristics such as MedSeg, Retina Drive, and Massachusetts datasets. Experimental findings reveal that the developed method outperforms its competitors in all test metrics. In particular, the dice (DSC) score, the most critical indicator of segmentation accuracy, achieved a value of 0.957 on the Retina DRIVE dataset, demonstrating a significant performance difference compared to existing models that remained in the 0.68–0.81 range in challenging scenarios. Furthermore, the 99.6% accuracy (Acc) and 0.006 loss (Loss) values obtained on COVID-19 CT data confirm the architecture’s error-free learning capacity. The stable loss function trend observed across all datasets demonstrates the model’s stable learning ability and high generalization capability.
1. Introduction
Image segmentation is a critical research topic in computer vision, forming the basis of pattern recognition and image understanding, and is of vital importance for many disciplines and applications. From medical imaging to autonomous driving systems, satellite image analysis, security, industrial inspection, smart medical technology, and augmented reality, image segmentation enables the extraction of regions of interest (ROIs) by dividing images into meaningful and non-overlapping regions based on color, texture, and other features [1]. However, image segmentation faces challenges such as the clear definition of meaningful regions and the effective representation of objects [2]. The uncertainty and diversity of human visual perception complicate the nature of segmentation; extracting high-level semantic information from low-level local features remains a difficult problem [3]. Traditional segmentation approaches typically rely on information from a single image and require expert knowledge and human intervention. On the other hand, co-segmentation methods aim to identify common objects across multiple images, but high-level semantic inference problems persist.
In recent years, deep learning models based on encoder–decoder architectures have become widely used in image segmentation. These structures reduce the input image to a low-dimensional feature space using an encoder and increase the spatial resolution using a decoder to produce pixel-level segmentation output [4]. However, these architectures have various limitations, such as high computational cost, information loss, overfitting risk, and performance degradation, especially in large datasets.
This study proposes a new, more efficient, and stable architecture to overcome the limitations of existing architectures and improve segmentation accuracy. The proposed model can perform well even at low depths, adapt to different datasets, and minimize information loss through a multi-level data processing approach. Furthermore, it enables real-time applications by making faster and more accurate predictions, while its flexible and scalable structure offers a wide range of applications.
The main innovative contributions of the study are as follows:
- High performance at low depth: Reliable segmentation at low levels thanks to an architecture that minimizes information loss that may occur in deep layers.
- High compatibility with different datasets: Consistent and robust performance of the model across various datasets.
- Multi-level data processing: Comprehensive representation and computational efficiency by combining features from different depths.
- Reduced information loss: Minimization of information loss in traditional encoder–decoder structures.
- Fast and accurate prediction: Gaining speed in training and testing phases without accuracy loss despite depth reduction.
- Flexible and scalable design: A structure that can be easily adapted to different datasets, problem types, and depth levels.
These advancements are intended to enhance the efficacy of image segmentation, thereby offering more resilient and efficient solutions for a range of applications within the domain of computer vision.
2. Related Works
Image segmentation is a fundamental computer vision problem that aims to separate objects or regions in an image at the pixel level and plays a critical role, particularly in medicine, remote sensing, autonomous driving, and industrial applications. The most commonly used deep learning-based architectures for segmentation in the literature include models such as SegNet [4], U-Net [5], V-Net [6], W-Net, ResU-Net [7], Nested U-Net (U-Net++) [8], and DeepLab [9], all of which follow an encoder–decoder structure. These architectures have become the standard in segmentation studies by providing high accuracy on different datasets thanks to multi-scale feature extraction, skip-connection structures, wide receptive fields, and attention mechanisms.
2.1. Studies on COVID-19 CT Image Segmentation
In the literature, Computed Tomography (CT) images have been widely used for the automated analysis of COVID-19 due to their high sensitivity in visualizing pulmonary infections. While earlier studies mainly focused on chest X-ray–based classification approaches, recent research has shifted toward semantic segmentation of COVID-19 CT images in order to localize infected regions and enable region-level disease assessment. In this study, COVID-19 CT image segmentation is adopted to provide a more detailed and clinically meaningful analysis of lung infection areas.
In the evolving landscape of COVID-19 diagnostics, recent research has shifted towards Transformer-based architectures to overcome the limitations of convolutional neural networks in capturing long-range dependencies. A significant contribution in this direction is the CoviSwin model proposed by Alsenan et al. [10], which utilizes a Transformer-based U-shaped encoder–decoder structure. This architecture integrates the Swin Transformer V2 model with attention mechanisms and residual connections to effectively segment heterogeneous COVID-19 lesions, such as ground-glass opacities and consolidations, in chest CT scans. To address the challenge of limited labeled data, the authors implemented a strategic two-phase training approach involving the SemiSeg and MedSeg datasets. Experimental results demonstrated that CoviSwin achieved a mean Dice Similarity Coefficient (DSC) of 0.781 and a specificity of 0.962. Notably, the model’s sensitivity of 0.790 outperformed recent state-of-the-art models, including NextSeg of 2024 and GFNet of 2022, by 8.07% and 7.48%, respectively. These findings underscore the efficacy of hybrid Transformer models in providing precise clinical decision support for lesion quantification.
A hybrid deep learning–based framework for COVID-19 CT lesion segmentation was presented in [11]. In this study, several encoder–decoder architectures, including PSPNet, VGG-SegNet, ResNet-SegNet, VGG-UNet, and ResNet-UNet, were investigated to localize and segment ground-glass opacities in chest CT scans. The models were trained using a five-fold cross-validation strategy on CT images collected from COVID-19-positive patients and were evaluated using annotations provided by two expert radiologists and the MedSeg benchmark. The experimental results showed that the ResNet-UNet model achieved higher dice and Jaccard scores than MedSeg, with reported improvements of up to 9% and 15%, respectively, and the statistical significance of the performance gains was confirmed by multiple hypothesis tests (p < 0.0001), demonstrating the reliability of the proposed hybrid learning framework.
A lightweight hybrid CNN–Transformer architecture, named MMViT-Seg, was introduced in [12] for COVID-19 CT image segmentation. The proposed method integrates CNN and MobileViT within a two-branch encoder to jointly capture global contextual dependencies and low-level spatial details and further employs a multi-query attention (MQA) module to fuse multi-scale features from different decoder levels. The model was evaluated on three COVID-19 segmentation datasets, including the same dataset used in this study. The experimental results reported that MMViT-Seg achieves the best overall performance with a significantly reduced number of parameters among several popular segmentation models for binary infection labeling, while also providing competitive results for multi-class infection segmentation, demonstrating the effectiveness of lightweight CNN–Transformer hybrid designs for COVID-19 lesion segmentation.
In addition to architectural innovations, recent studies have emphasized the role of advanced preprocessing and loss functions in improving segmentation performance for low-contrast COVID-19 lesions. For instance, ref. [13] proposed an integrated deep learning framework that combines Attention U-Net with Contrast-Limited Adaptive Histogram Equalization (CLAHE) to enhance image quality before processing. To address the inherent class imbalance in CT scans, the authors utilized a hybrid dice-Tversky loss function, which prioritizes the accurate detection of small, infected regions. Their approach, validated through 5-fold cross-validation on a public dataset, achieved a dice score of 0.83 and an IoU of 0.71. Furthermore, the study integrated Explainable AI (XAI) techniques, specifically Grad-CAM, to visualize the model’s decision-making process. This focus on both performance and interpretability highlights the growing importance of transparent and robust clinical decision support systems in medical imaging.
2.2. Related Studies on Retinal Vessel Segmentation
Segmenting retinal blood vessels is considered a challenging problem, particularly due to the irregular structure of small, low-contrast vessels. Accordingly, approaches that address blood vessel segmentation together with arterial and venous (A/V) classification have been proposed in the literature. In the study presented by Bhimavarapu [14], image contrast was enhanced and edge information was preserved using an ensemble-based preprocessing stage that included Bilateral and Laplacian edge detectors. Furthermore, a directionality map was created to strengthen vessel orientation information. A detailed vessel map was obtained using a fully convolutional neural network and attention mechanisms during the vessel extraction process. The proposed method was tested on the STARE, DRIVE, HRF, and INSPIRE-AVR datasets and demonstrated high performance, achieving accuracy rates of 99.25%, 97.5%, 98.67%, and 98.33%, respectively. Tchinda et al. [15] presented a method based on classical edge detection filters and artificial neural networks for the segmentation of blood vessels in retinal images. In the study, feature vectors were first extracted using edge detection filters, and then these features were fed into an artificial neural network to classify each pixel as a vessel or background. The proposed method was tested on the DRIVE, CHASE, and STARE datasets. Experimental results show that the method achieved 0.7352 sensitivity, 0.9775 specificity, 0.9480 accuracy, and 0.9678 AUC values.
Rehman et al. [16] presented a computationally controlled method for improving image quality for retinal vessel segmentation. In the study, statistical features such as vessel tracking, maximum curvature, and curvelet coefficients obtained for each pixel were extracted; these features were evaluated for vessel/background separation using Support Vector Machines (SVM) and k-Nearest Neighbor (KNN) classifiers. Segmentation outputs were improved using morphological operators to obtain more accurate results. The method’s performance was evaluated using the dice similarity coefficient, yielding a dice value of 95% for the supervised approach and 92% for the unsupervised approach. The proposed method was tested on the DRIVE dataset, and the results showed competitive performance compared to classical vessel segmentation approaches. Gargari et al. [17] presented a multi-stage deep learning-based approach for segmenting blood vessels and diagnosing diseases from retinal images. In the study, green channel images obtained after color enhancement and Gabor filtering were segmented using the U-Net++ architecture; then, HOG and LBP features were extracted from the binary images, and classification was performed using a one-dimensional convolutional neural network. The method was evaluated on the DRIVE dataset, yielding 98.9% accuracy, 94.1% sensitivity, 98.8% specificity, and 98.14% F1-score values. The results demonstrate that the proposed method offers high performance in retinal vessel segmentation.
Abdulsahip et al. [18] developed a two-stage approach for fully automatic segmentation of blood vessels and extraction of clinical features in retinal fundus images. The proposed method consists of two main stages: image segmentation and clinical feature extraction. The study was assessed using the DRIVE and HRF datasets, with a performance analysis conducted on the DRIVE dataset. This analysis utilized such metrics as Accuracy (Acc.), Sensitivity (Sen.), Specificity (Spe.), Positive Predictive Value (PPV), and Negative Predictive Value (NPV). The experimental results indicate that the method achieved accuracy, sensitivity, specificity, 93.45% PPV, and 98.89% NPV, demonstrating a notable improvement in performance over existing state-of-the-art vessel segmentation techniques. In the study proposed by Fakhouri et al. [19], CoDLRBVS, a U-Net-based hybrid deep learning model for retinal blood vessel segmentation, is presented. In the proposed approach, vessel features are enhanced using a matched filter (MF) in the preprocessing stage, and segmentation results are improved using morphological techniques in the output stage. Furthermore, multi-scale line detection and scale-space methods were integrated into the model. The method was evaluated on the DRIVE, STARE, HRF, and CHASE-DB1 datasets, yielding average accuracy, precision, sensitivity, and specificity values of 96.7%, 96.9%, 99.3%, and 80.4%, respectively. The results show that hybrid deep learning approaches offer competitive performance in retinal vessel segmentation. While these studies demonstrate the effectiveness of deep learning-based approaches in retinal vessel segmentation, they have various limitations in terms of evaluation metrics and architectural complexity.
2.3. Remote Sensing-Based Road Segmentation and Extraction Studies
Road extraction from remote sensing images is a challenging problem due to complex topological structures, background diversity, and high pixel-level labeling costs. To address this issue, Yuan et al. [20] proposed the WR2E model, a scribble-based weakly supervised road extraction network that does not require intensive annotation. In the proposed method, a road trimap generation algorithm is used to propagate semantic information from scribble labels. The WR2E network consists of a road localization module, which aims to determine the global location of road networks, and an attention module that directs semantic information propagation based on image similarities. Experimental results show that the proposed method achieves 86.9% IoU and 93.7% F1-score values and provides an effective solution for remote sensing road extraction under weakly supervised learning. Pan [21] et al. proposed a fully convolutional network (FCN)-based method for the automatic extraction of road networks from very high-resolution (VHR) remote sensing images. In the study, OpenStreetMap (OSM) road centerlines were used for label generation during the training and validation phases. Experiments conducted on different VHR datasets with spatial resolutions of 0.3 m and 1 m showed that the proposed approach achieved completeness and correctness values above 94% and 98%, respectively, in road extraction. These results demonstrate that OSM-based automatic labeling offers an effective solution for road segmentation in high-resolution satellite imagery. Khan and Singh [22] proposed a deep learning-based method to address the problems of low spectral discrimination and complex backgrounds (such as building and tree shadows) encountered in road extraction from high-resolution remote sensing images. The study used a U-Net model with a feature space reorganization of the basic U-Net architecture and fine-tuning. Additionally, a BRISQUE-based preprocessing stage was integrated into the model to enhance image quality and improve segmentation performance. Experiments were conducted on 200 high-quality images selected from the Massachusetts Roads dataset and prioritized according to quality ranking; due to memory constraints, the images were rescaled to 256 × 256 pixels. The proposed method achieved 95.45% accuracy in the road segmentation task, demonstrating competitive performance.
Khan et al. [23] addressed the road segmentation problem in high-resolution satellite images, focusing on challenges arising from complex backgrounds, inter-class similarity, and occlusions. To this end, they proposed the DSMSA-Net architecture, an attention-enhanced encoder–decoder model. The encoder part of the network extracts multi-scale features from different convolutional layers; the decoder part consists of two main modules: the Scale Attention Unit (SaAU), which combines multi-scale information, and the Spatial Attention Unit (SpAU), which improves the spatial representation of regions of interest. The proposed method was evaluated on the DeepGlobe and Massachusetts Roads datasets. Experimental results show that the method achieves 0.86 precision, 0.85 recall, and 0.85 F1-score in the road segmentation task and demonstrates superior performance compared to reference methods. Tao et al. [24] proposed a hybrid architecture called Seg-Road to reduce connectivity issues in road segmentation. The study combined a transformer structure to capture long-range contextual information with CNN-based feature extraction to preserve local details. Additionally, the Pixel Connectivity Structure (PCS) mechanism was developed to enhance road continuity. In experiments, the Seg-Road model achieved 68.38% IoU and 90.01% F1-score on the Massachusetts Roads dataset, outperforming many state-of-the-art methods. One of the studies focusing on the road segmentation problem, D-FusionNet [25], aims to improve the balance between effective receptive field and coverage width. In this context, the receptive field is expanded during the encoding phase using the dilated convolutional block (DCB) module based on sparse convolution, while reducing feature loss. Experiments conducted on GF-2 satellite images and the Massachusetts Roads dataset report that D-FusionNet offers higher performance compared to common architectures such as FCN, U-Net, LinkNet, and D-LinkNet; it provides significant improvements in IoU and F1-Score metrics, particularly in the Massachusetts dataset.
2.4. Cross-Domain Comparative Literature Analysis
The methodological approaches, datasets used, and performance achieved in all studies reviewed in the related work section are summarized comparatively in Table 1. Table 1 shows that the vast majority of studies in the literature either focus on a specific application area or aim to achieve performance by increasing architectural complexity. In contrast, it is noteworthy that there are limited studies that have tested generalizability on different datasets and are architecturally balanced and based on multi-scale information interaction.
Table 1.
Comparative summary of proposed methods in the fields of retinal vessel, COVID-19, and remote sensing-based road segmentation.
2.5. Motivation and Research Gap
Comprehensive review of the literature indicates the majority of studies predominantly concentrate on individual datasets or specific domains, retinal imaging, CT-based infection analysis, and segmentation, which are treated in isolation from one another. Numerous methodologies escalate architectural complexity or depend on steps tailored to specific applications. In this study, however, the generalizability of a single holistic approach is investigated on three separate datasets with different structural features, and the segmentation performance of the proposed method in different domains is evaluated comparatively through comprehensive experiments.
3. Materials and Methods
This section introduces the datasets used in the study and summarizes the experimental infrastructure for evaluating the proposed method.
3.1. Datasets Used in the Study
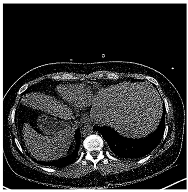
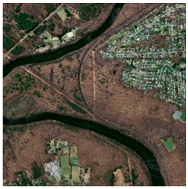
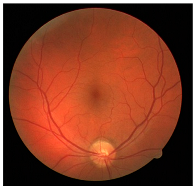
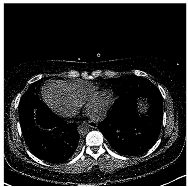
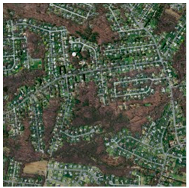
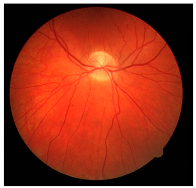
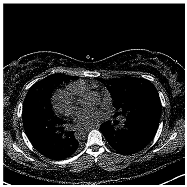
To evaluate the generalization capability of the proposed architecture, training and testing were performed on three different datasets obtained from Kaggle and open-access data sources. The datasets selected were the COVID-19 CT [26], DRIVE [27], and Massachusetts Roads Datasets [28]. The selected datasets cover different application areas, such as medical imaging and remote sensing, and were chosen to evaluate the model’s segmentation performance and generalization ability on images with different resolutions, textures, and structural features.
Basic information about the datasets used in the study, including the application area, image dimensions, number of images/masks, and sources, is summarized in Table 2. The COVID-19 CT [26], the DRIVE [27], and Massachusetts Roads [28] datasets were all employed to evaluate the pixel-based segmentation performance of the proposed architecture, utilizing their respective lesion masks and ground-truth annotations. This approach allowed for a comprehensive analysis of the model’s performance in tasks requiring both large-scale region identification and the separation of detailed spatial structures. Examples from the datasets used in the study are presented in Table 3. These examples illustrate the general character of the dataset and the structure of the data used in the experimental studies.
Table 2.
Basic characteristics of the datasets used in the study.
Table 3.
Some examples from the datasets used in the study.
3.2. Proposed Architecture
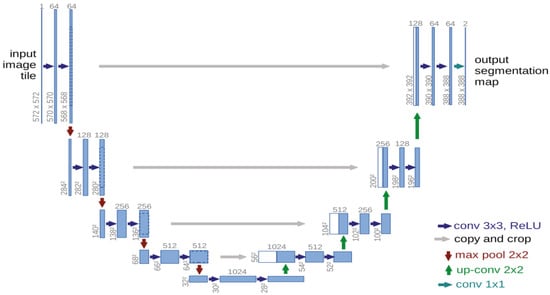
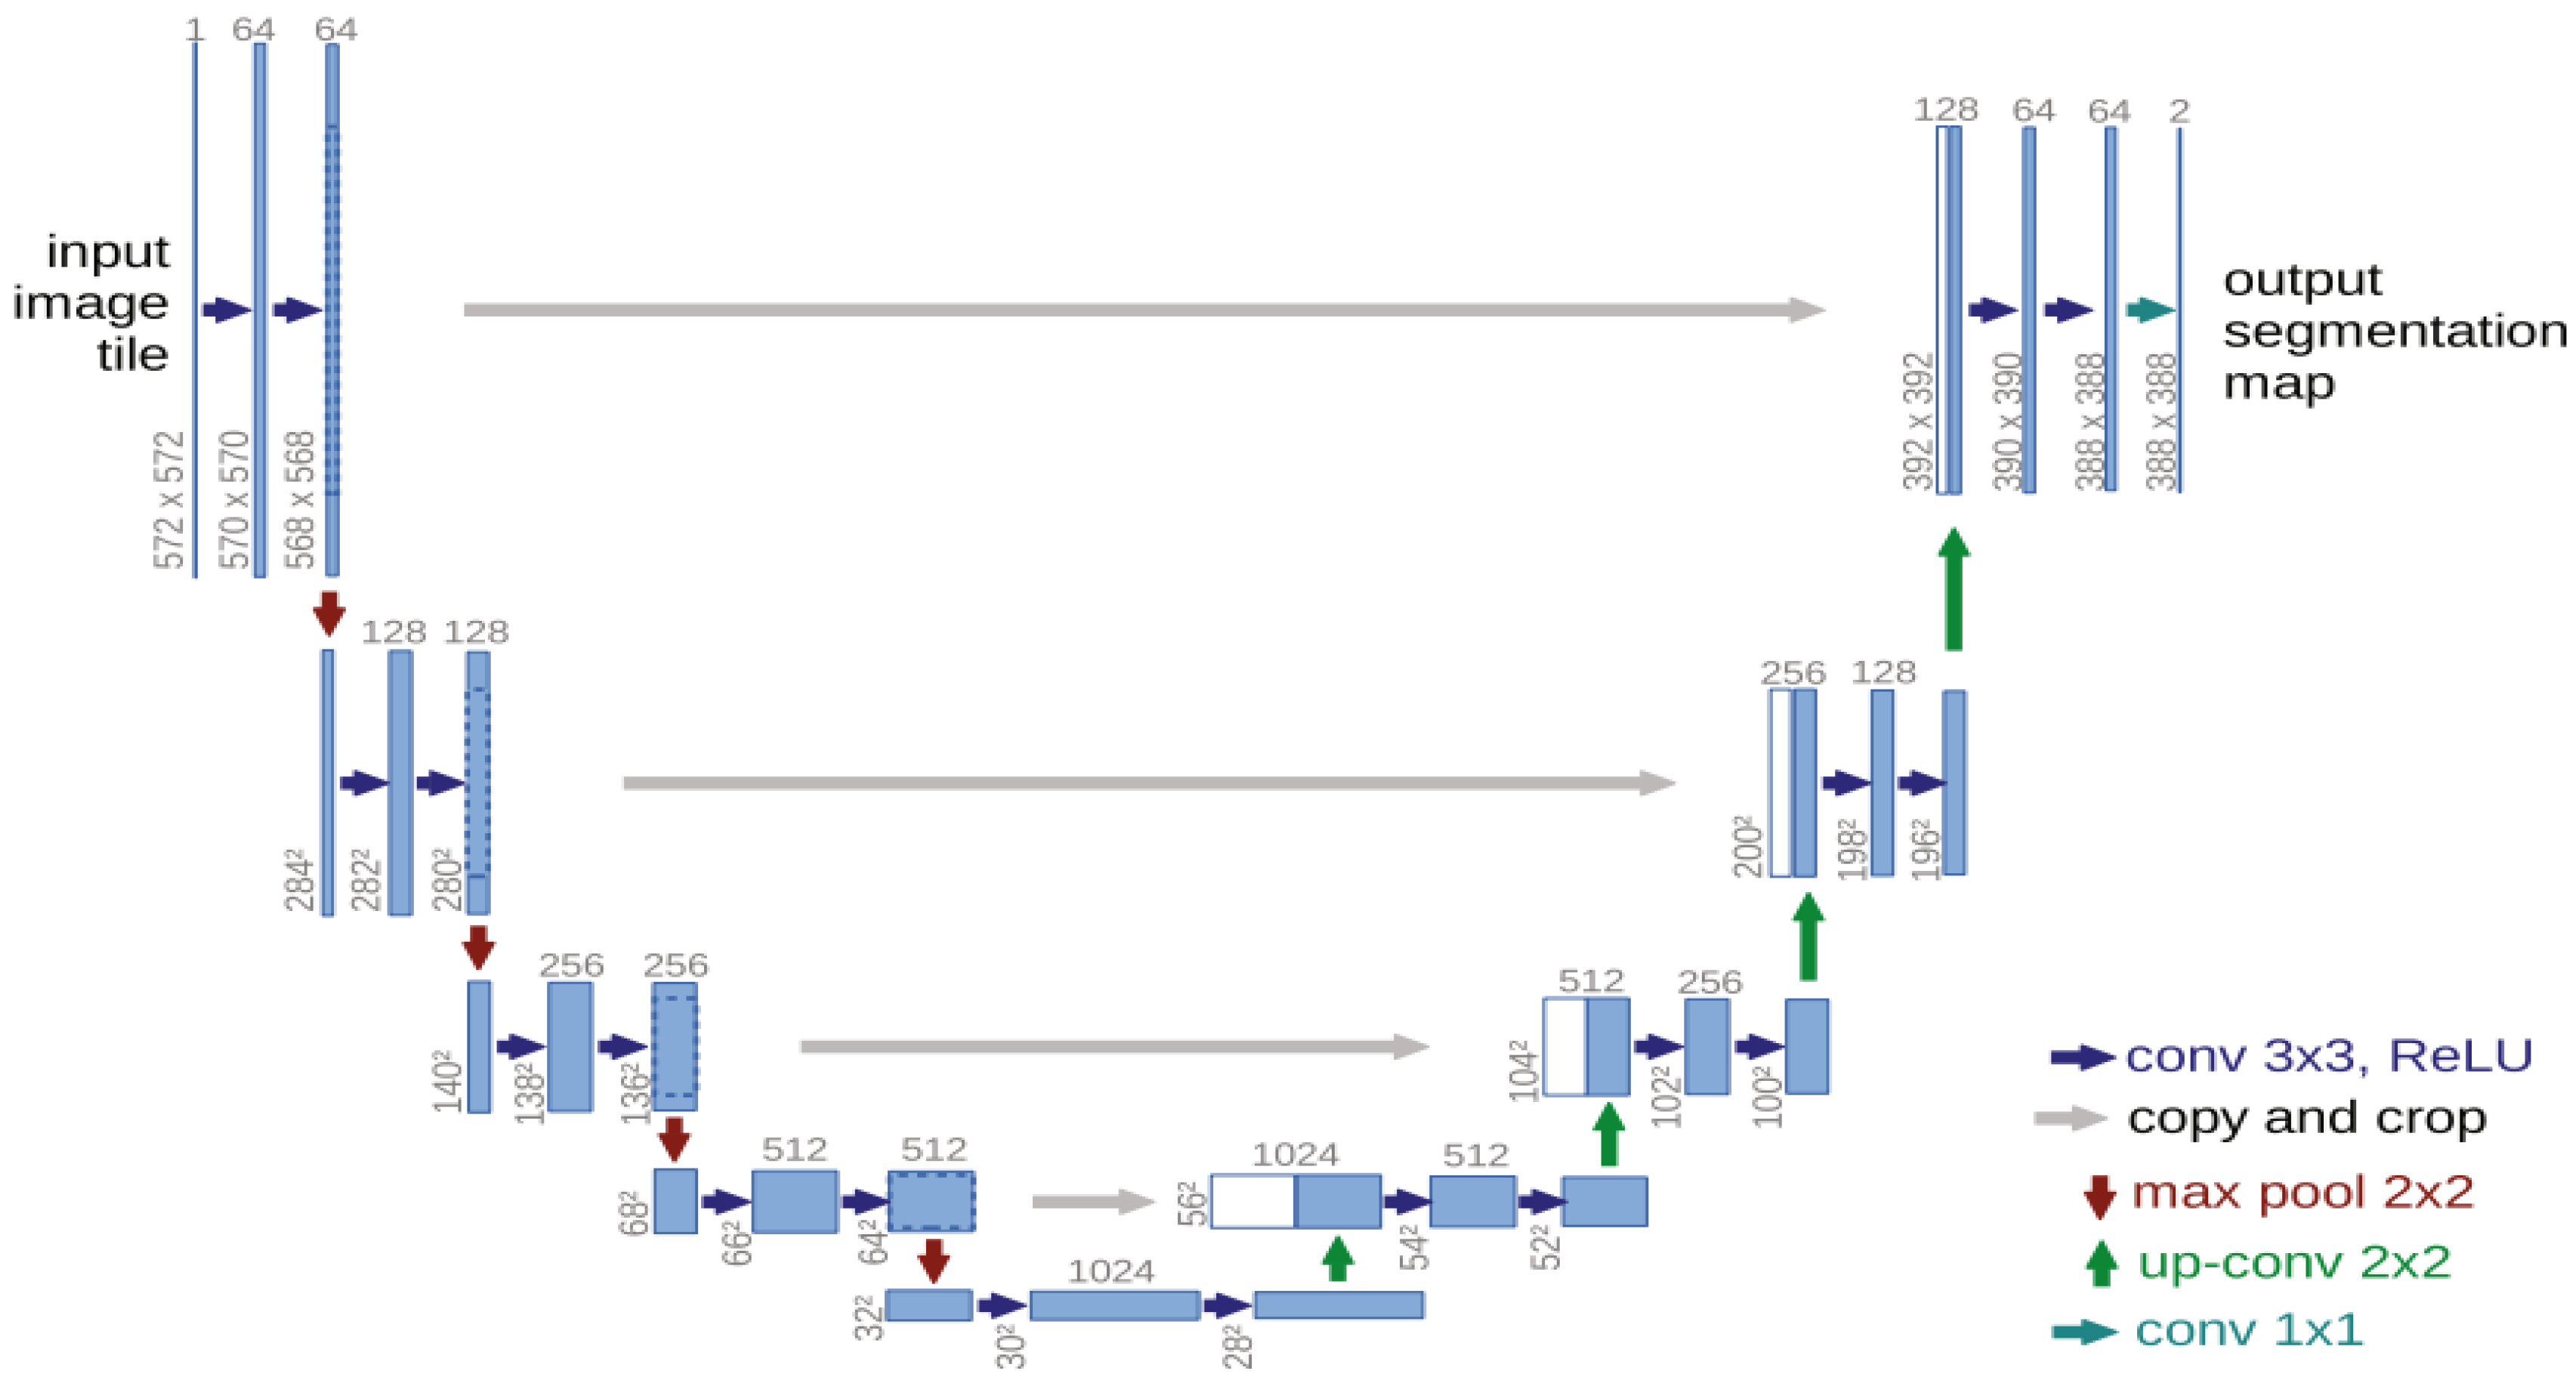
Skip-connection structures in the standard U-Net architecture are established only between corresponding encoder and decoder levels to preserve local spatial information. However, this structure limits the holistic interaction of features from different depth levels and can lead to information loss, particularly in deep layers. The standard U-Net architecture is shown in Figure 1.
Figure 1.
U-Net Architecture [5].
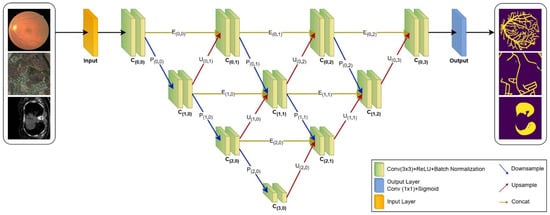
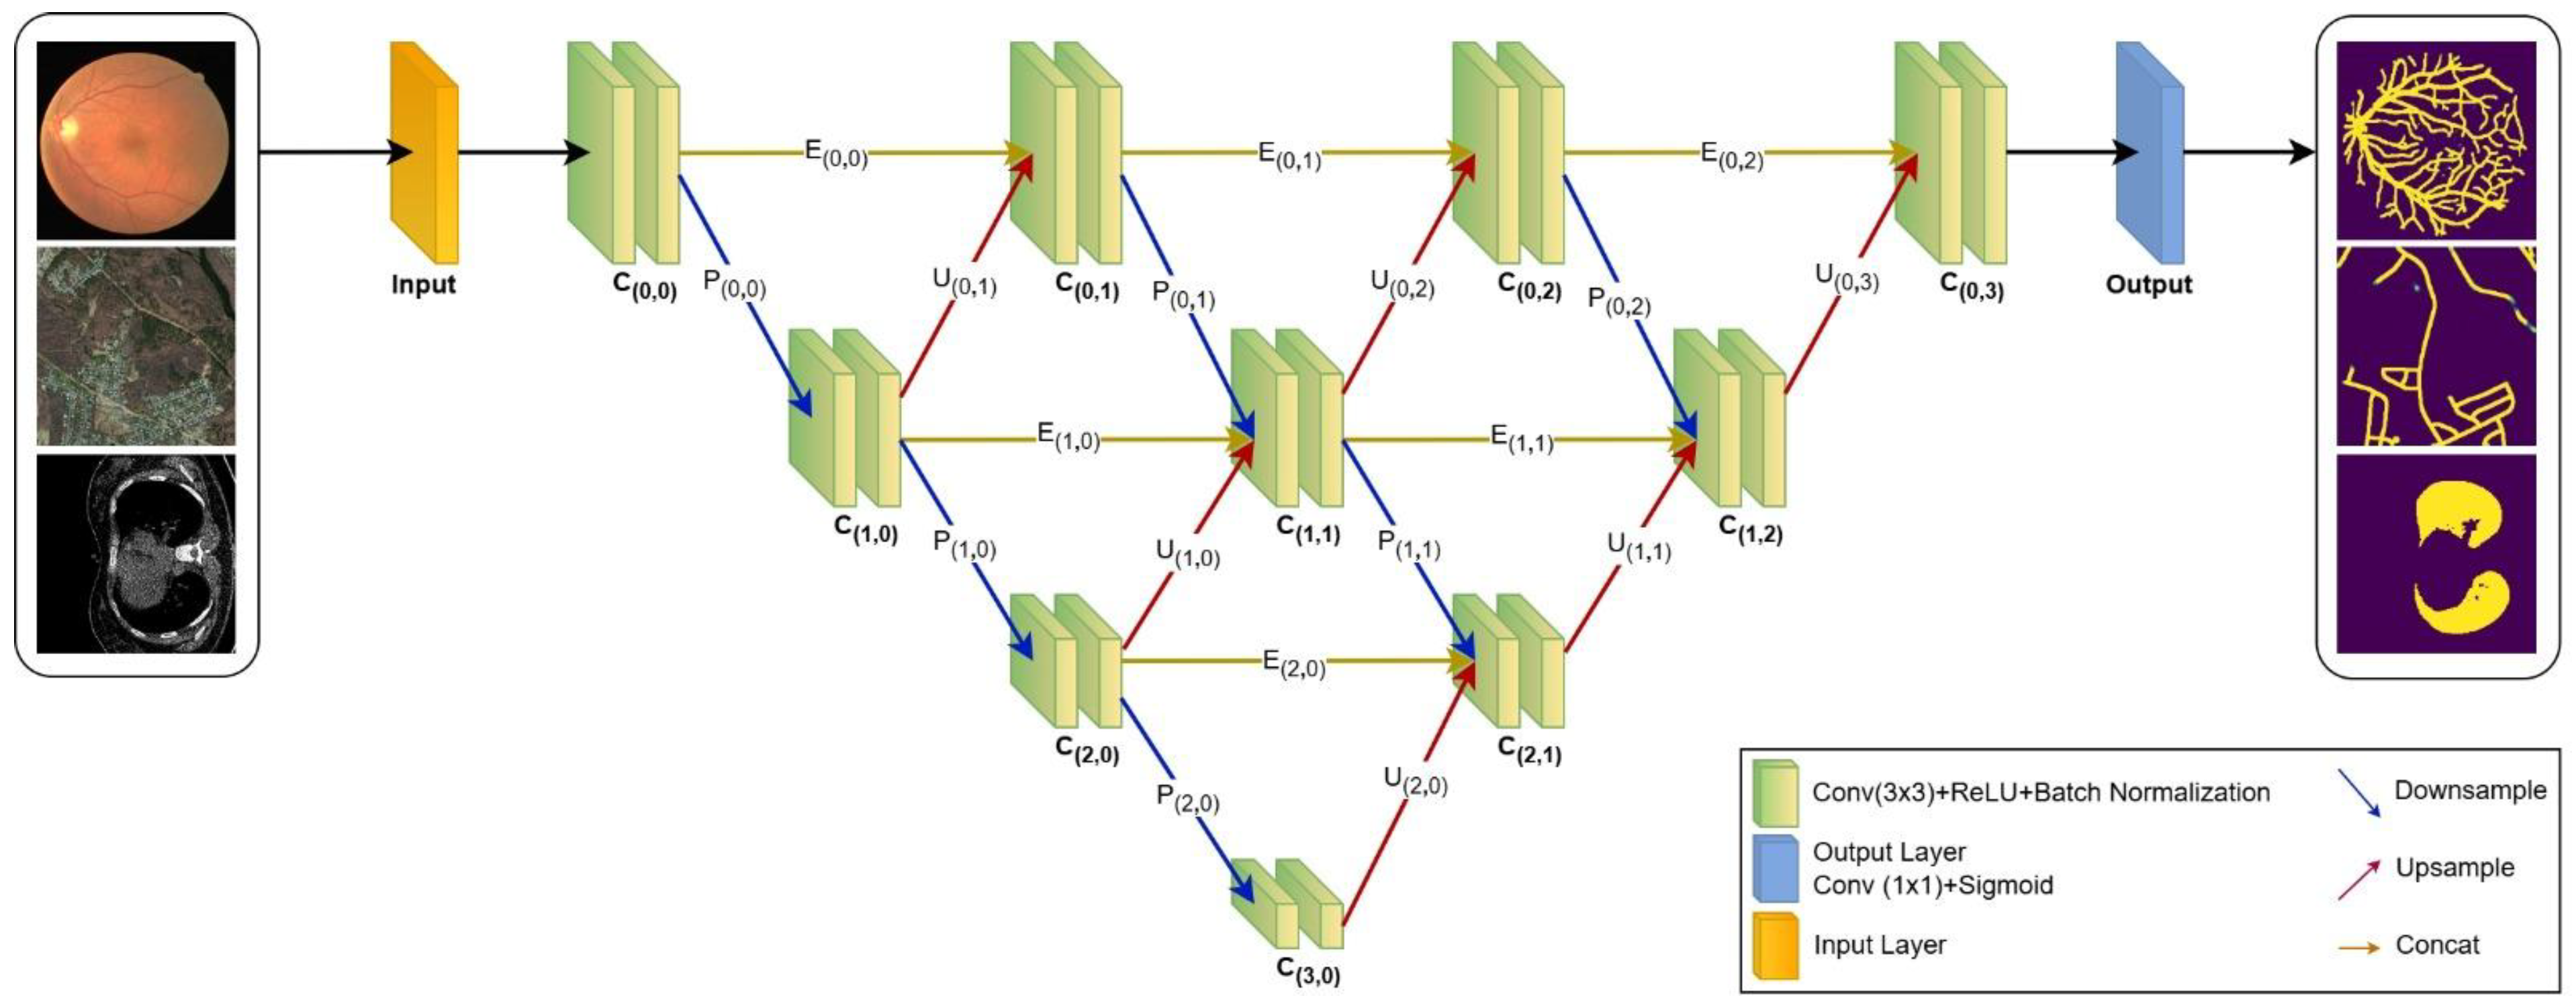
The method proposed in this study is based on an enhanced architectural structure that preserves the structural advantages of the classic U-Net architecture while strengthening multi-level information flow across network depths (Figure 2). In the proposed model, information loss is minimized through multi-level skip connections between the encoder and decoder layers. Each convolutional block consists of a 3 × 3 convolution, a ReLU activation function, and a Batch Normalization operation. This structure improves the trainability of the network and alleviates the gradient vanishing problem.
Figure 2.
Proposed Architecture.
In the encoder stage, the network progressively increases representational capacity by extracting hierarchical features from the input data. In the decoder stage, these features are transformed into a reconstructed output map through upsampling operations. The concatenation connections established between the encoder and decoder blocks enable the simultaneous processing of both local and global contextual information. Furthermore, unlike the classical U-Net, the proposed model employs cross-level connection structures at each sub-level. Through these interconnections, each decoder node receives not only the output from the corresponding encoder layer but also the aggregated outputs from preceding encoder and decoder nodes. Consequently, the model can effectively integrate both low-level and high-level features, resulting in more coherent and structurally consistent segmentation outputs. In the final layer, the model utilizes a Sigmoid activation function to generate the output segmentation map, where each pixel is represented by a probability value (for instance, distinguishing between object and background).
Thanks to this multi-level and cross-connection structure, the proposed architecture offers stronger feature interaction compared to the classic U-Net, thereby improving segmentation performance, especially in fine and continuous structures.
3.2.1. Intra-Layer Operations
In this study, each node consisting of binary convolution and batch normalization operations is defined as a convolution block. In the developed architecture, 3 × 3 convolution and batch normalization operations are applied in each convolution block. The ReLU activation function shown in Equation (1) is used in convolution operations to enable fast computation in forward and backward propagation, prevent gradient vanishing, and achieve sparsity by zeroing negative values:
The ReLU activation function is considered the default choice in this field due to its successful results in many deep learning-based image segmentation studies and is widely used in developed architectures.
In architecture, the Batch Normalization function was applied after each convolution operation to reduce the effect of outliers and improve convergence. Furthermore, 2 × 2 max pooling was used in the encoder operations to extract the most prominent features from the feature maps, while 2 × 2 upsampling was used in the decoder operations to increase the resolution and size of the feature map. The outputs of the convolutional blocks at the inner levels are transferred to the lower levels via max pooling, to the upper levels via upsampling, and to the same level via the encoder block. As the depth level of the architecture increases, the convolutional blocks in the inner layers perform operations by combining information from three different levels. This structure is mathematically expressed in Equation (2):
Here, denotes the number of each convolution level, and denotes the number of convolution blocks at each level. The j’th convolution block at the I’th level () performs operations using data from the encoder block at its own level (), max pooling from the upper level (), and upsampling from the lower level (). For example, is a convolution block at the inner level. Here, the block performs operations using the sms of the , , and blocks. The model’s output function uses a 1 × 1 convolution function that employs the Sigmoid activation function from Equation (3).
3.2.2. Similarity Measures
In this study, dice and Jaccard (Intersection over Union—IoU) similarity ratios were used to evaluate similarity ratios, as the accuracy value can yield misleading results in comparisons of similarity between architectures. The dice similarity ratio in Equation (4) is a widely used metric in segmentation studies. The most common reasons for its preference are that it is compatible with the sigmoid function due to its values in the [0, 1] range and that it provides reliable results in imbalanced datasets. Furthermore, the fact that the dice and Jaccard ratios produce similar results indicates that the model performs consistently.
Another metric preferred in segmentation processes is the Jaccard similarity ratio given in Equation (5). The Jaccard metric is sometimes used in segmentation studies to a limited extent because it is a strict criterion. However, the reason for using the Jaccard ratio in this study is that it allows for a more comprehensive evaluation of model performance when interpreted together with the dice metric.
The terms in the equation are as follows— represents a small constant used to prevent division by zero, denotes the total number of pixels, indicates the true mask value, and signifies the probability value predicted by the model.
3.2.3. Loss Function
Binary Cross-Entropy (BCE) is a widely used loss function in image segmentation applications that require pixel-level binary predictions, such as background/object separation. The BCE function shown in Equation (6) is effective in optimizing the class distribution of pixels. However, it is known that when there is class imbalance in the datasets, it can cause the model to overemphasize the dominant class.
The dice loss function is another metric used to improve segmentation quality by increasing the overlap ratio. This function, shown in Equation (7), prevents rare classes from being ignored and minimizes loss by maximizing the dice similarity ratio.
In this study, both loss functions were used together to achieve a balance between local accuracy (BCE) and global similarity (dice). As shown in Equation (8), the α value is the weight value of the BCE and dice loss functions in the calculation of the loss function and takes values in the range [0, 1]. To define a balanced learning process in the calculation of the loss value, α = 0.5 was taken.
4. Findings and Discussion
In this section, the performance of the proposed model was examined on three different datasets, and the experimental results obtained are presented comparatively. The accuracy, generalization ability, and segmentation performance of the model are discussed in detail for each dataset. To ensure transparency and reproducibility, the standardized hyper-parameters and training configurations applied consistently across all models and datasets are detailed in Table 4.
Table 4.
Summary of experimental hyper-parameters and training configurations for all datasets.
4.1. Comparative Performance Analysis on the COVID-19 Dataset
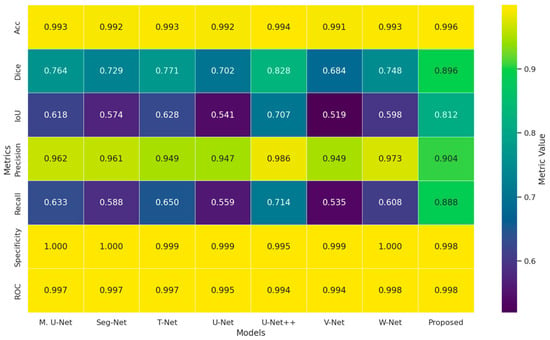
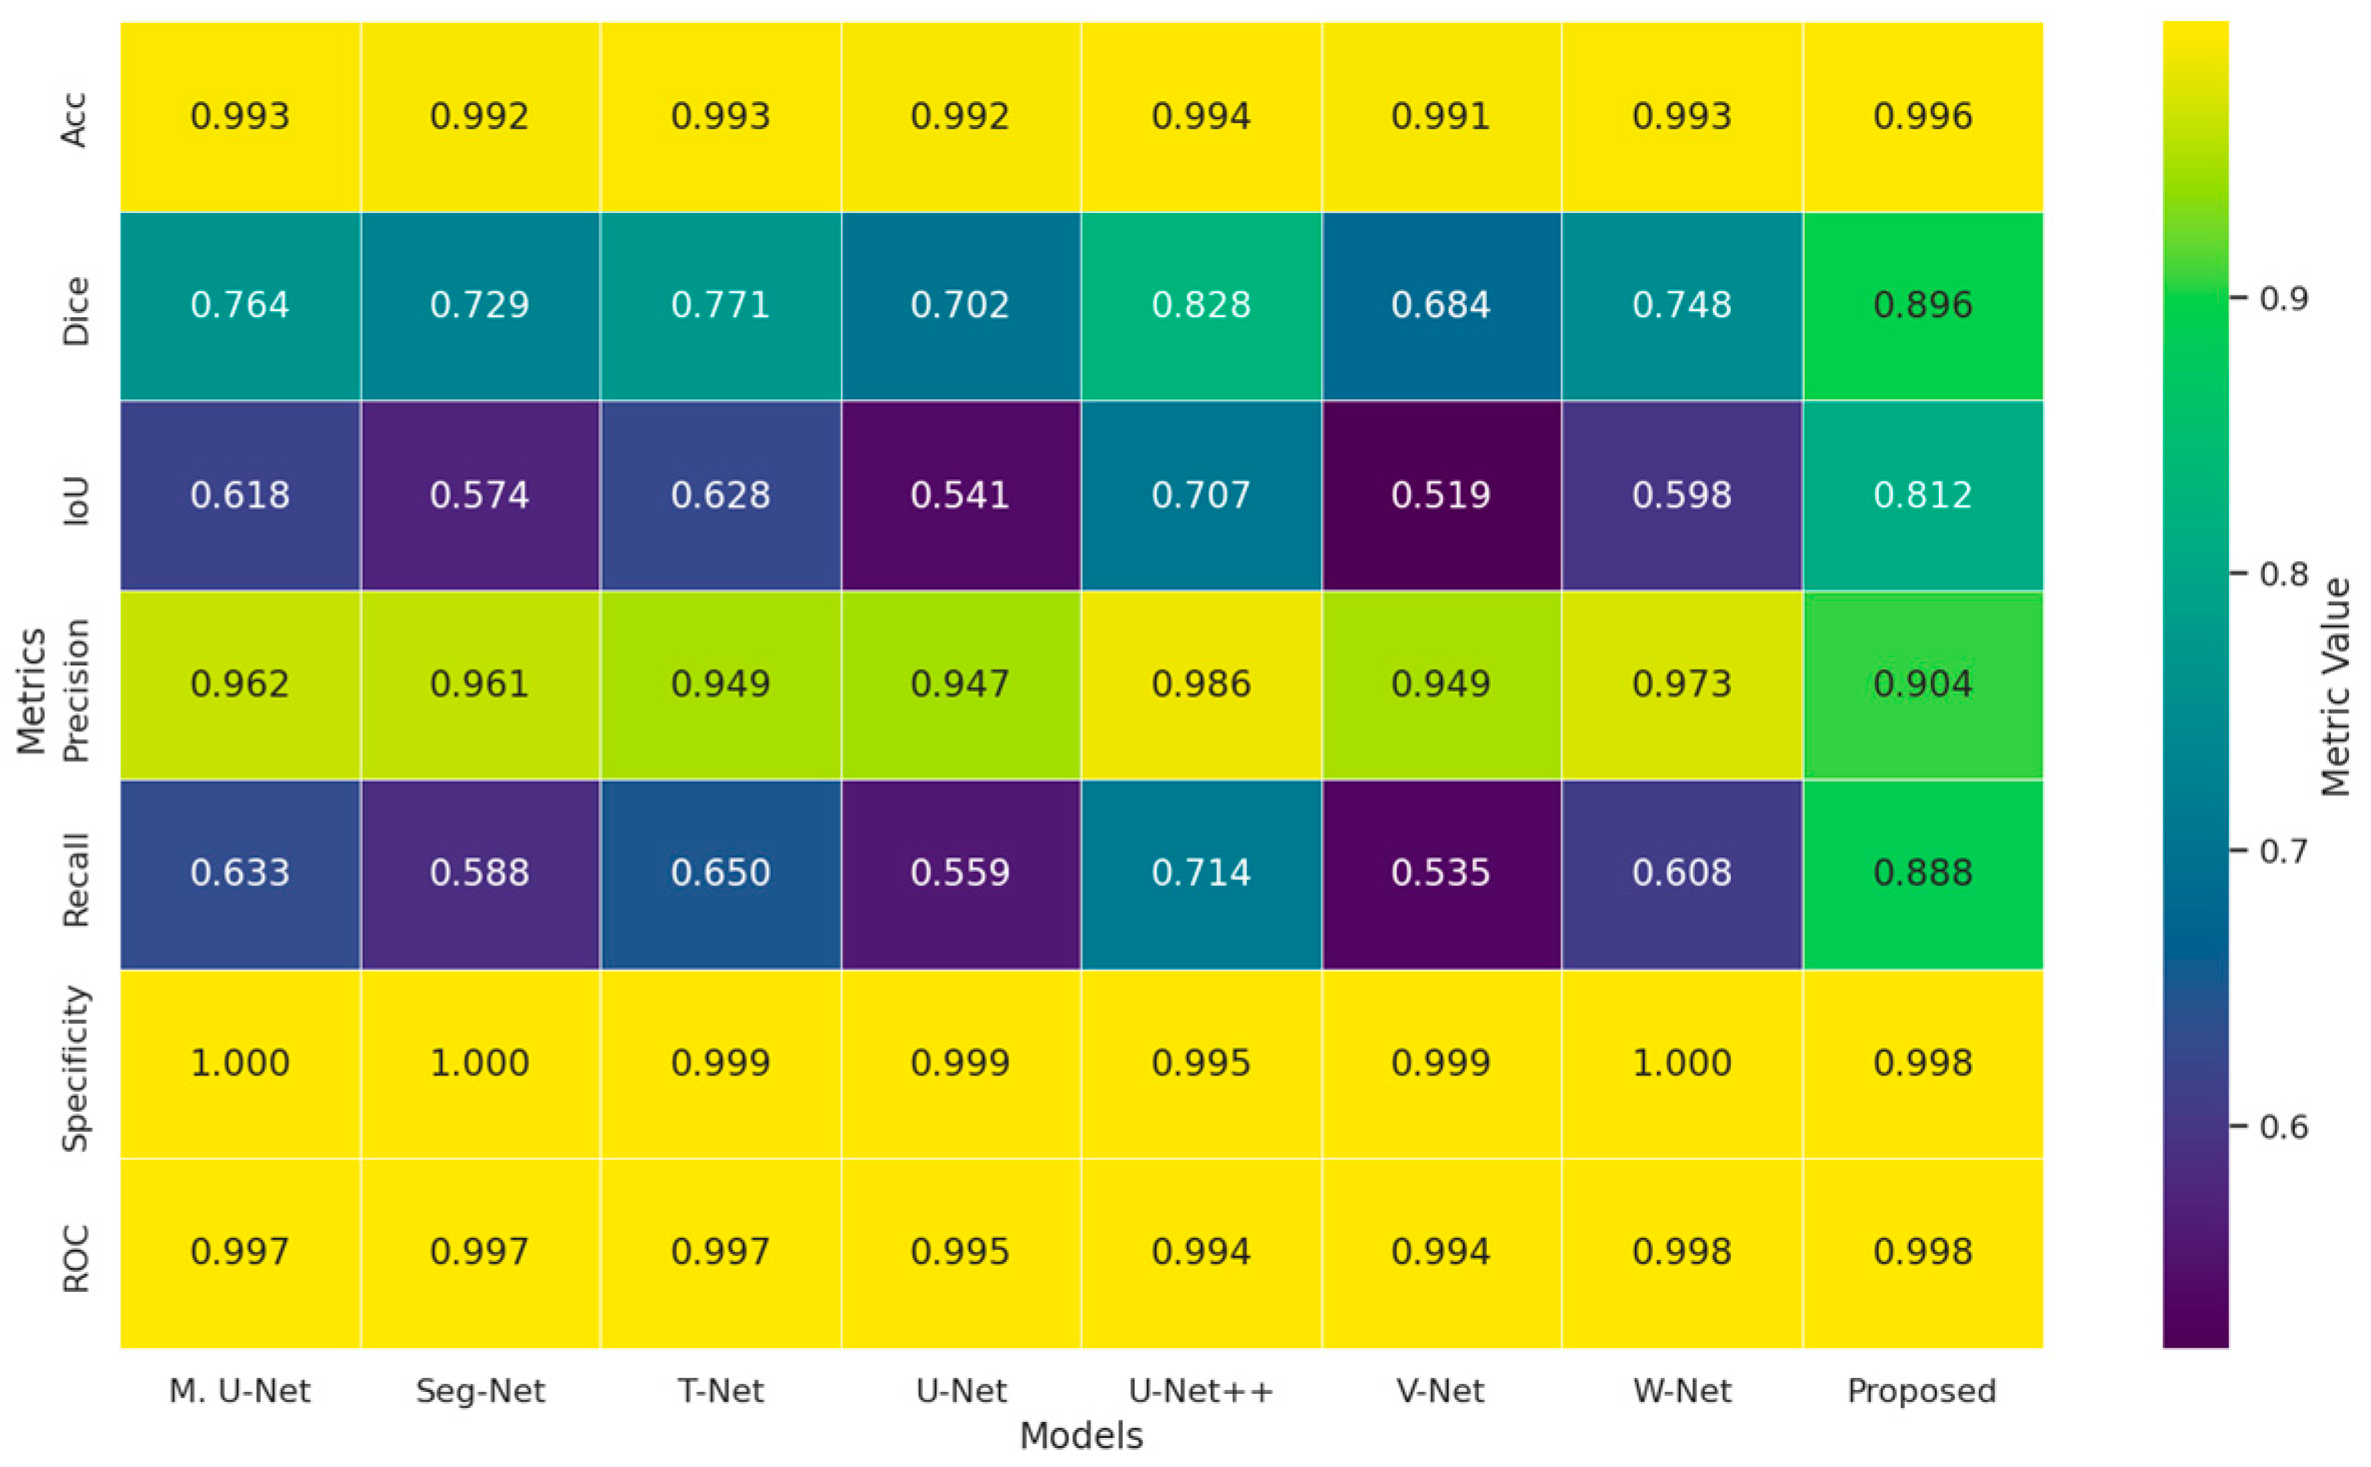
The performance outputs of the experimental studies conducted on the COVID-19 dataset are presented in Figure 2, Figure 3 and Figure 4. The heat map presented in Figure 3 shows the comparative results of the methods evaluated on the MedSeg dataset in terms of multiple performance metrics. The visual analysis clearly reveals that the proposed method achieves the highest performance values in almost all metrics. The significant superiority obtained, particularly in the dice and IoU metrics, demonstrates that the proposed approach can segment COVID-19 lesions more accurately and consistently. In addition, the high and balanced results in precision and recall values reveal that the model effectively reduces misclassifications. The lowest loss value also belongs to the proposed method, confirming that the model exhibits a stable learning process and strong generalization ability.
Figure 3.
Comparative heatmap showing different segmentation models evaluated based on metrics on the MedSeg [26] dataset.
Figure 4.
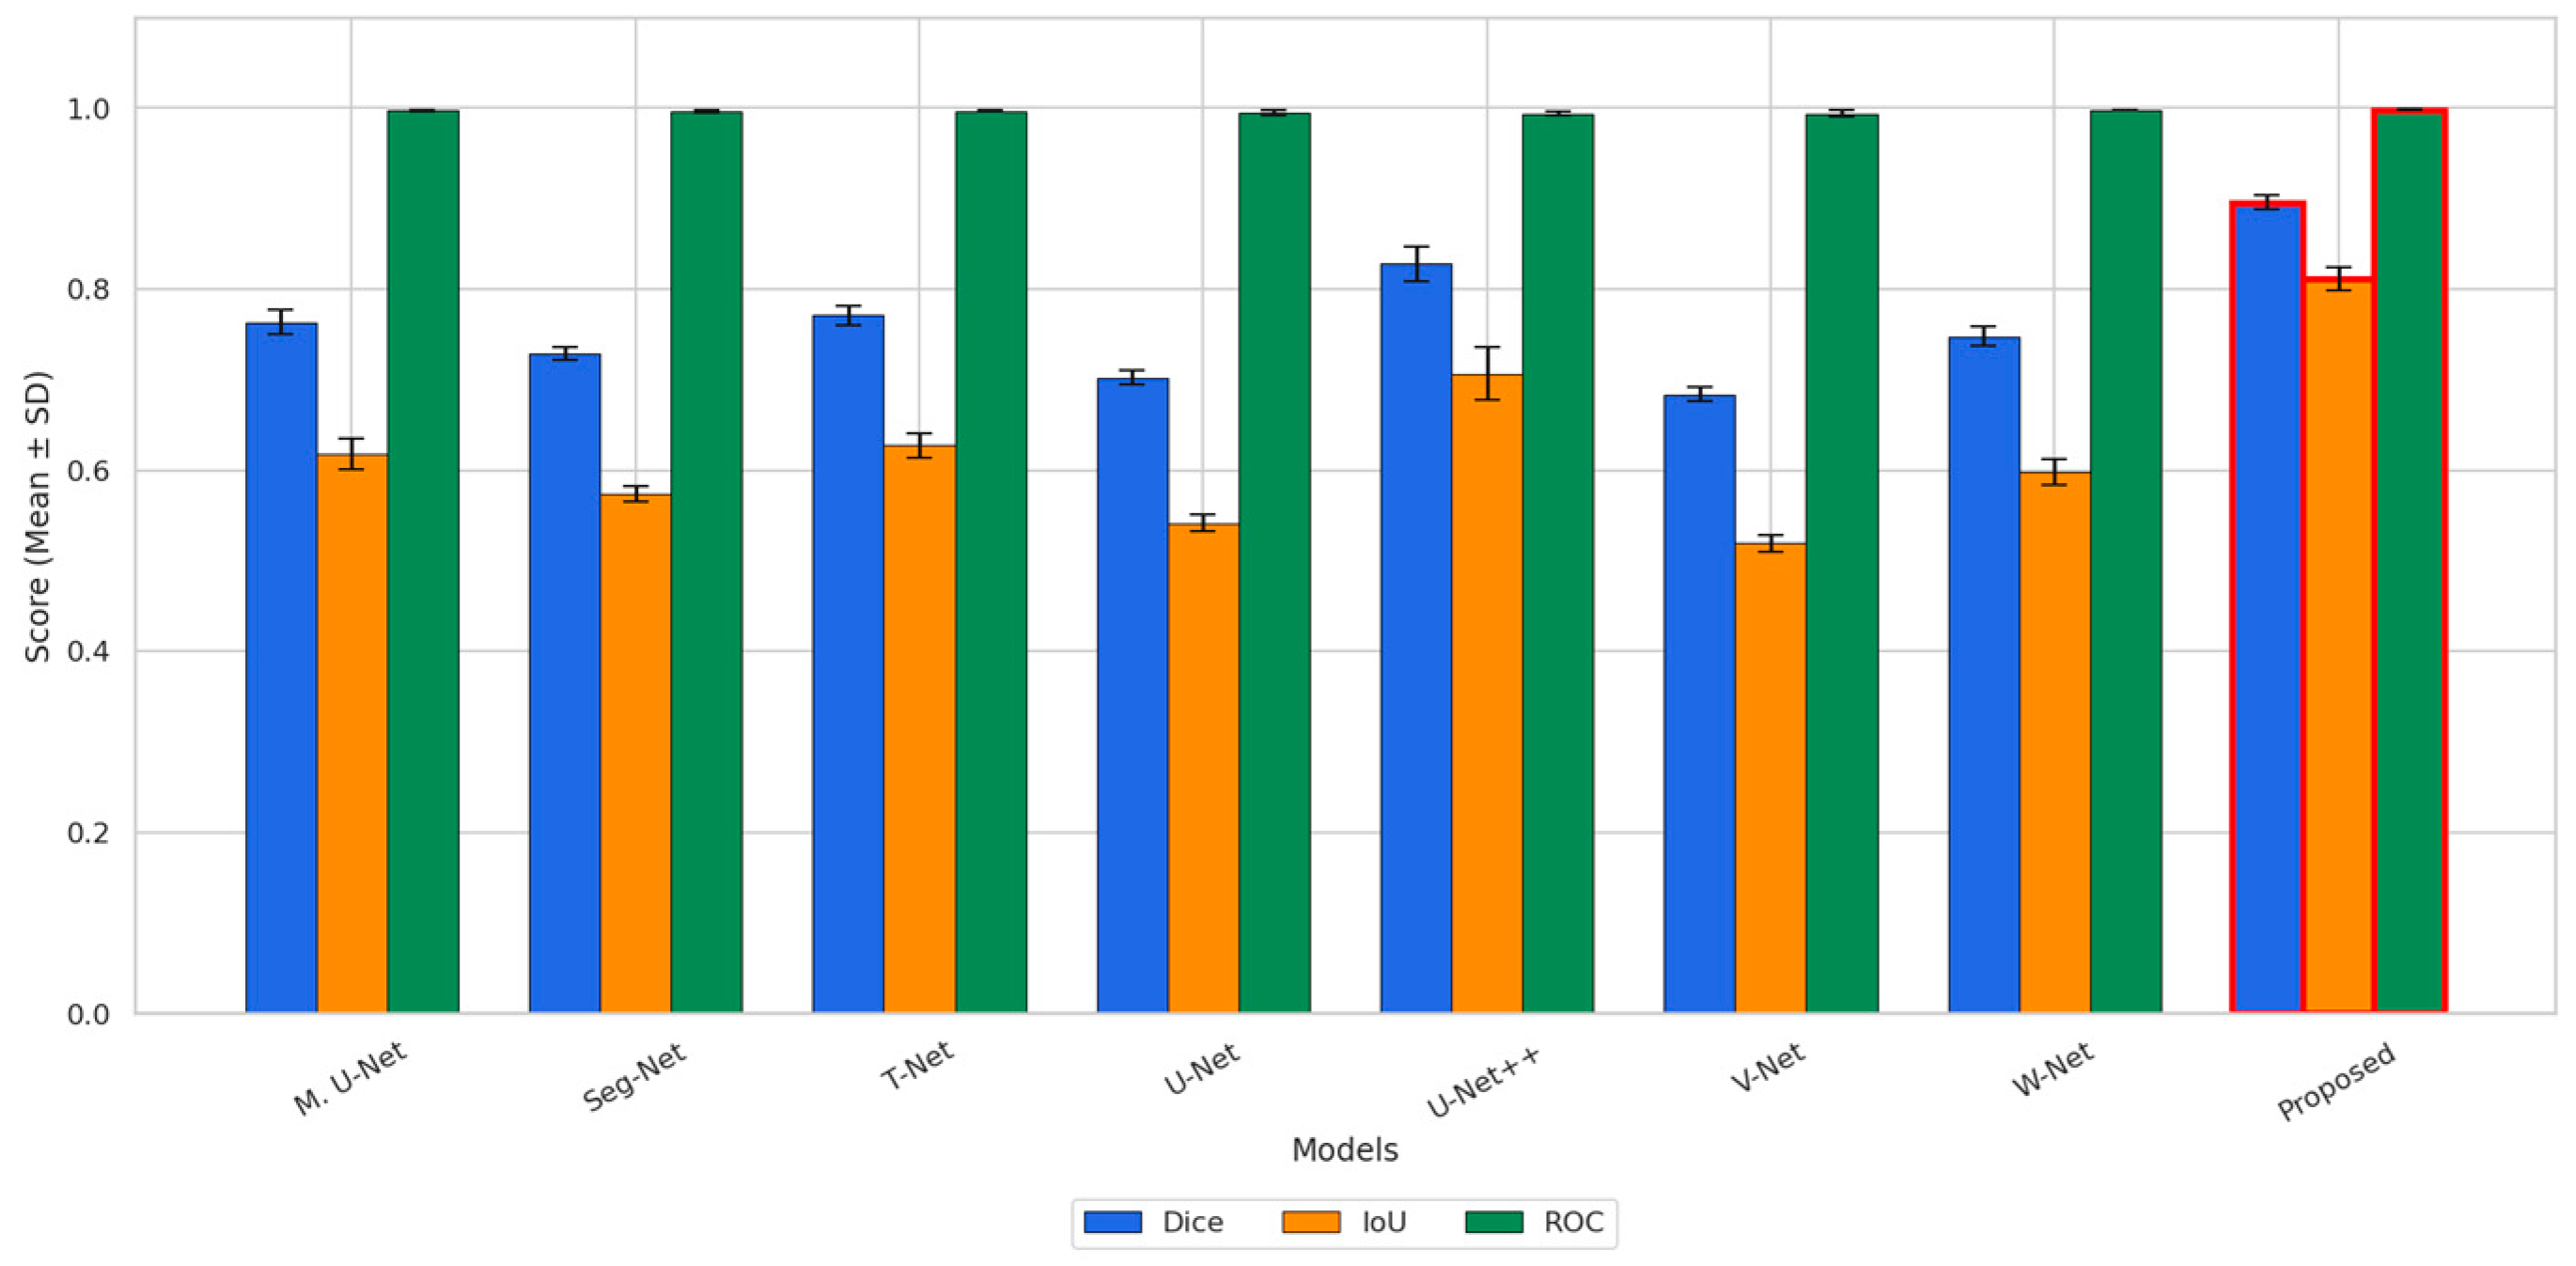
Comparative performance analysis of dice, IoU and ROC metrics on the MedSeg dataset.
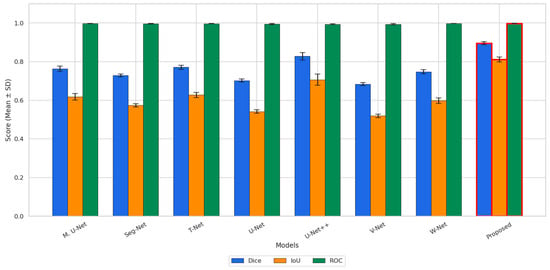
Figure 4 illustrates the means and standard deviations of the dice, IoU, and ROC metrics obtained from 10 independent experiments on the MedSeg dataset. The results indicate that the proposed method achieves the highest mean values for both dice and IoU among all compared models, demonstrating its superior segmentation accuracy. In addition, the proposed method attains a near-perfect ROC score, which is comparable to the best-performing competing methods. The relatively small error bars observed for the proposed method, especially in the dice and IoU metrics, indicate stable and reproducible performance across different experimental runs. Although similarly high ROC values are obtained by several methods, the proposed approach provides the most consistent and accurate overall segmentation performance.
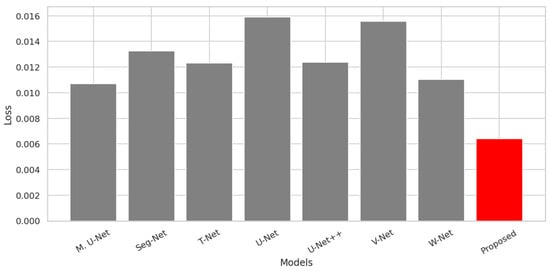
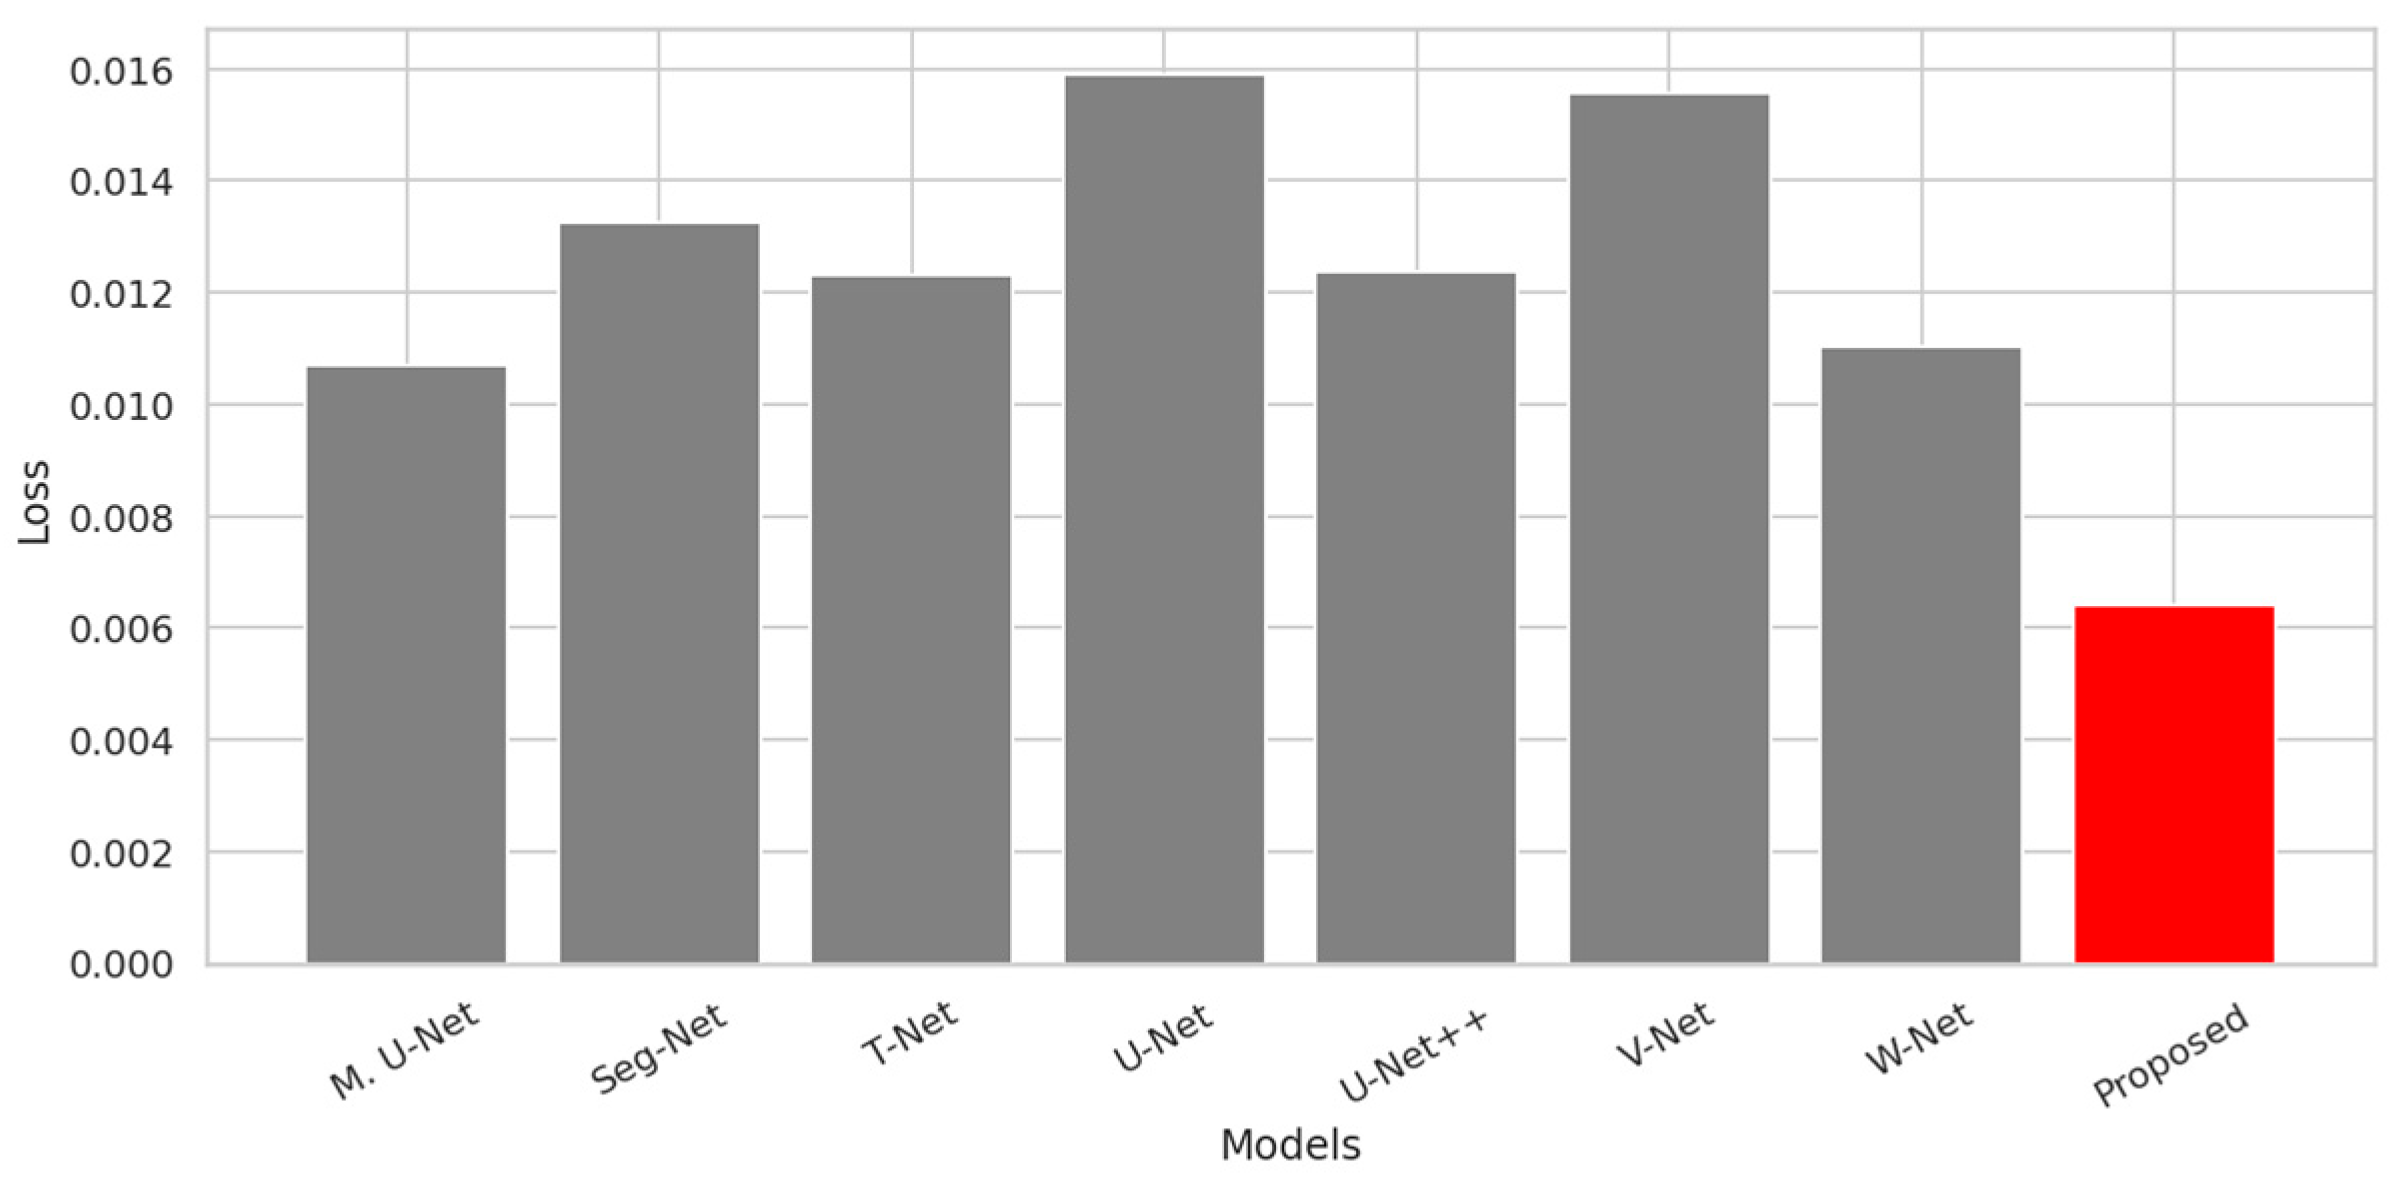
Figure 5 presents a comparison of the final training loss values obtained for all models on the MedSeg dataset. As illustrated in the figure, the proposed method achieves the lowest loss value (approximately 0.006) among all compared architectures. This result indicates a more effective optimization outcome compared to both the standard U-Net (approximately 0.016) and the U-Net++ model (approximately 0.012), as well as the other competing methods. The lower loss achieved by the proposed approach suggests that the model fits the training data more accurately and converges with a better optimum solution. Overall, Figure 5 demonstrates that the proposed method provides superior optimization performance in terms of training loss for COVID-19-based image segmentation.
Figure 5.
Comparison of loss values for segmentation models on the MedSeg dataset. The red bar represents our proposed method, while the other color indicates the baseline models used for comparison.
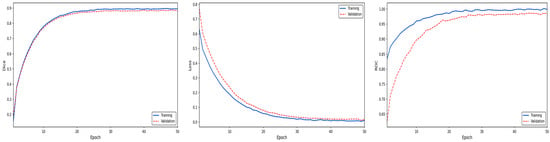
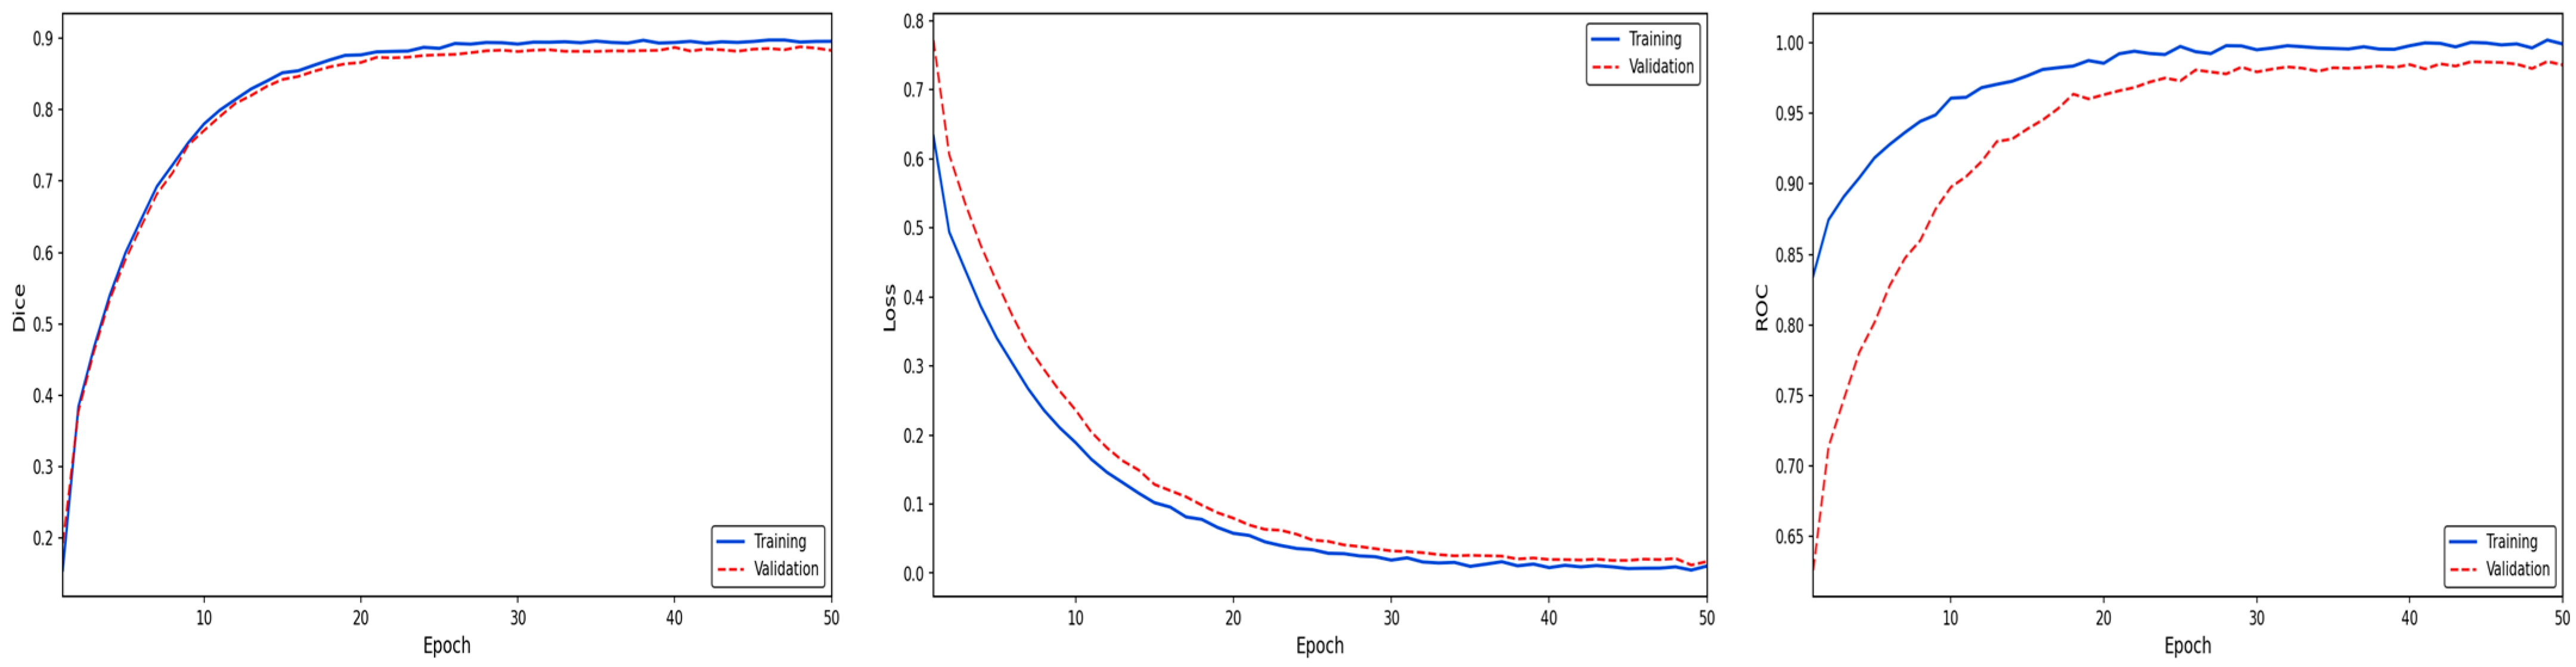
Examining the performance characteristics presented in Figure 6, it is observed that the training process of the proposed method follows an extremely stable and convergent course. The dice coefficient graph in the figure proves that the segmentation success of the model gains significant momentum within the first 15 epochs and reaches saturation at approximately 0.90; the parallel and close trajectory of the training and validation curves reveals that the model has a high generalization ability and does not show signs of overfitting. The smooth decrease in the Loss function in the center of Figure 6 to minimum levels confirms that the optimization strategy used performs effective learning on the dataset and successfully minimizes the error margin. Finally, the convergence of the ROC AUC values on the right to 1.00 documents that the proposed method has superior selectivity in distinguishing target regions from the background and that its classification performance is within a statistically strong confidence interval.
Figure 6.
Performance analysis of the proposed model on the MedSeg dataset.
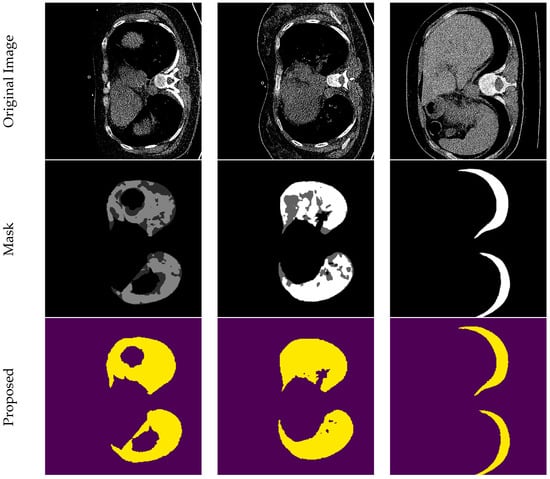
Figure 7 shows the qualitative segmentation performance of the proposed method on COVID-19 images. The figure sequentially presents the original images, reference masks, and prediction outputs of the proposed approach. The visual results clearly demonstrate that the model can distinguish lung regions and pathological opacities with high accuracy and boundary consistency.
Figure 7.
Visual evaluation of segmentation predictions on COVID-19 CT images.
Table 5 reports the quantitative comparison of all models on the MedSeg dataset in terms of means and standard deviations of multiple evaluation metrics. The proposed method achieves the highest dice (0.896) and IoU (0.812) values among all compared approaches, indicating a clear improvement in segmentation accuracy and consistency for infected regions. In addition, the proposed method obtains the highest Recall value (0.888), demonstrating its superior ability to correctly detect COVID-19-affected areas. Although the accuracy values of all models are generally high and very close to each other, the dice and IoU metrics, which are more representative of segmentation quality, clearly highlight the advantage of the proposed method. While some competing methods achieve slightly higher precision and specificity values, the proposed method provides a better balance between precision and recall. Moreover, the proposed method yields the lowest mean loss value (0.006) together with a very small standard deviation (0.001), indicating a more stable and well-optimized learning process. Overall, the results presented in Table 5 demonstrate that the proposed method offers the most balanced and effective segmentation performance on the MedSeg dataset.
Table 5.
Comparative performance analysis of segmentation models on the MedSeg dataset.
4.2. Comparative Segmentation Performance Analysis on the Retinal Vessel Dataset
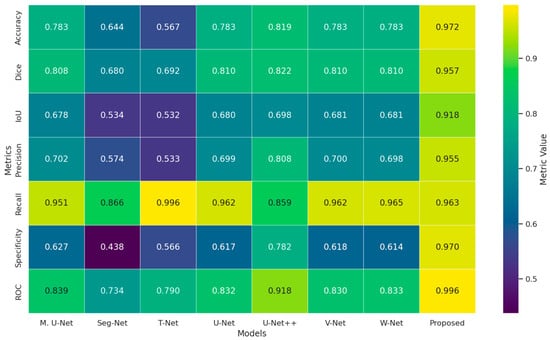
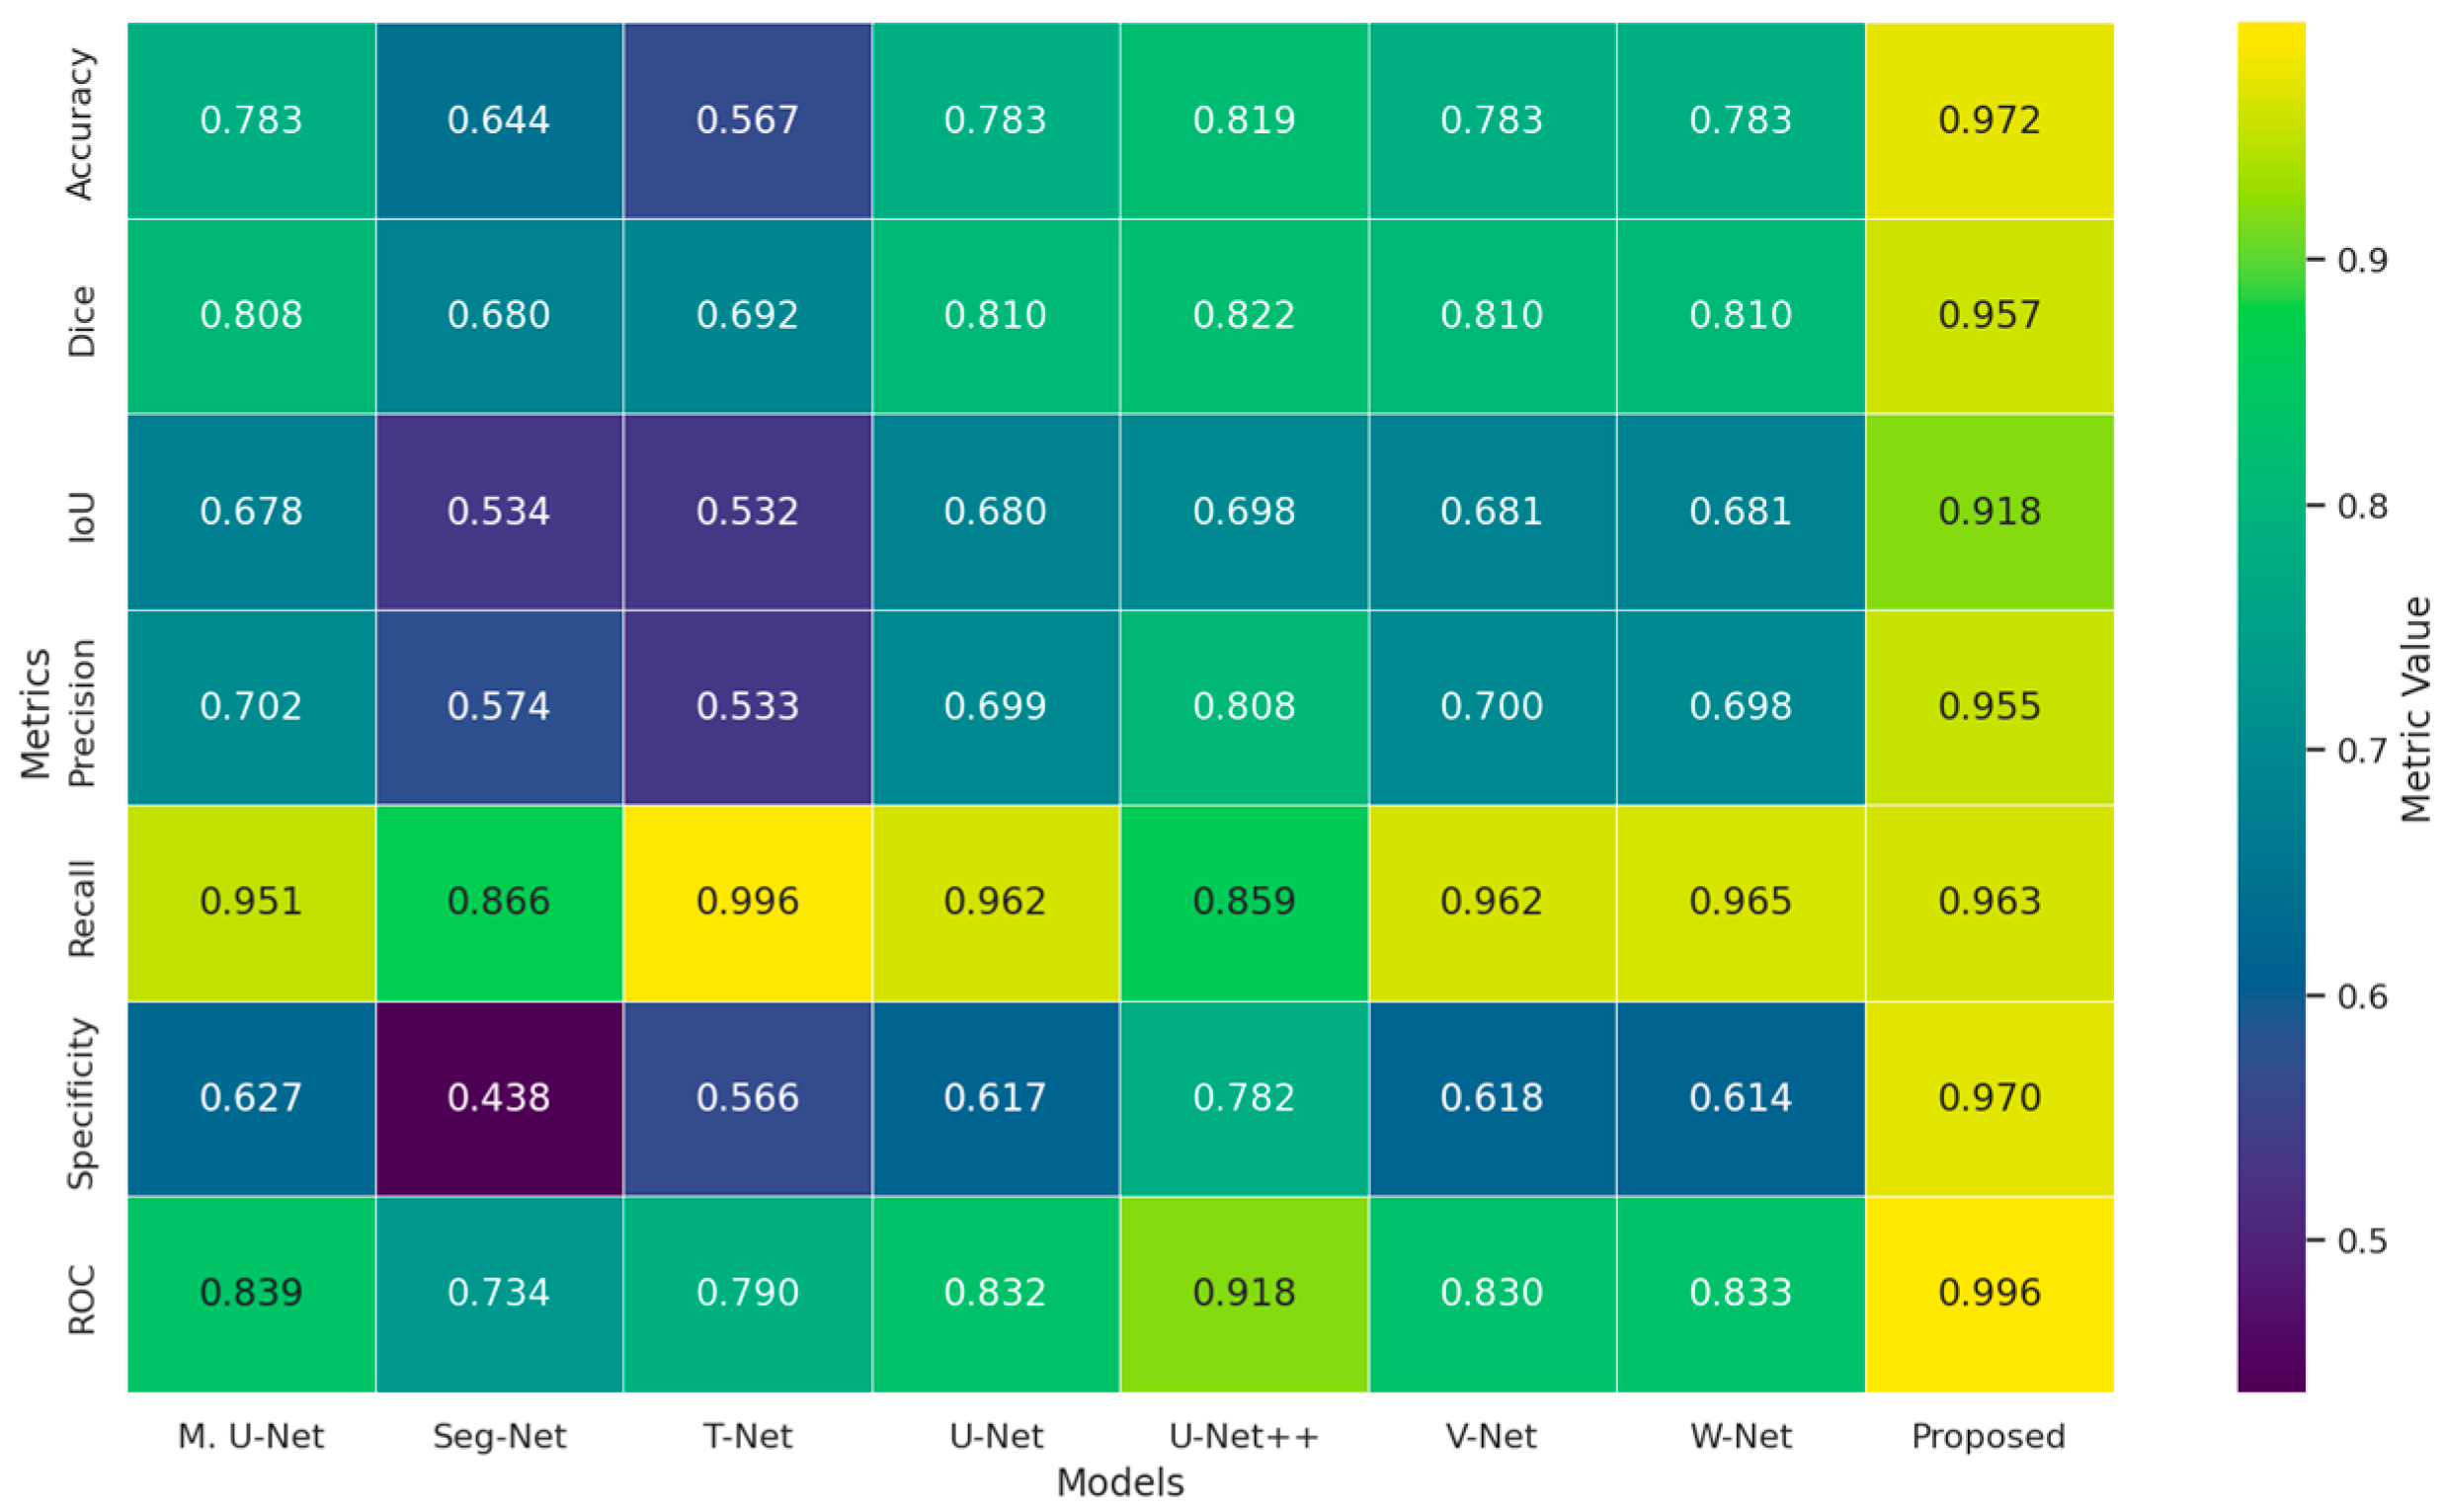
Figure 8 presents the heatmap of the comparative performance of all models on the DRIVE dataset in terms of multiple evaluation metrics. The proposed method achieves the highest scores in accuracy (0.972), dice (0.957), IoU (0.918), precision (0.955), specificity (0.970), and ROC (0.996), clearly demonstrating its superior segmentation accuracy and class discrimination capability. Although the highest Recall value is obtained by T-Net (0.996), the proposed method also attains a very high recall of 0.963. In contrast to several competing architectures that exhibit high Recall at the expense of very low specificity, the proposed method maintains a well-balanced performance with simultaneously high precision, recall, and specificity values. These results indicate that the proposed model effectively reduces both false positives and false negatives.
Figure 8.
Comparative heatmap showing the evaluation metrics of different segmentation models on the DRIVE dataset.
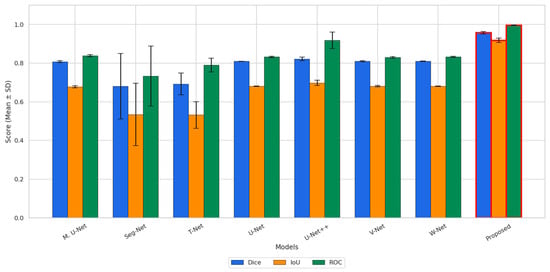
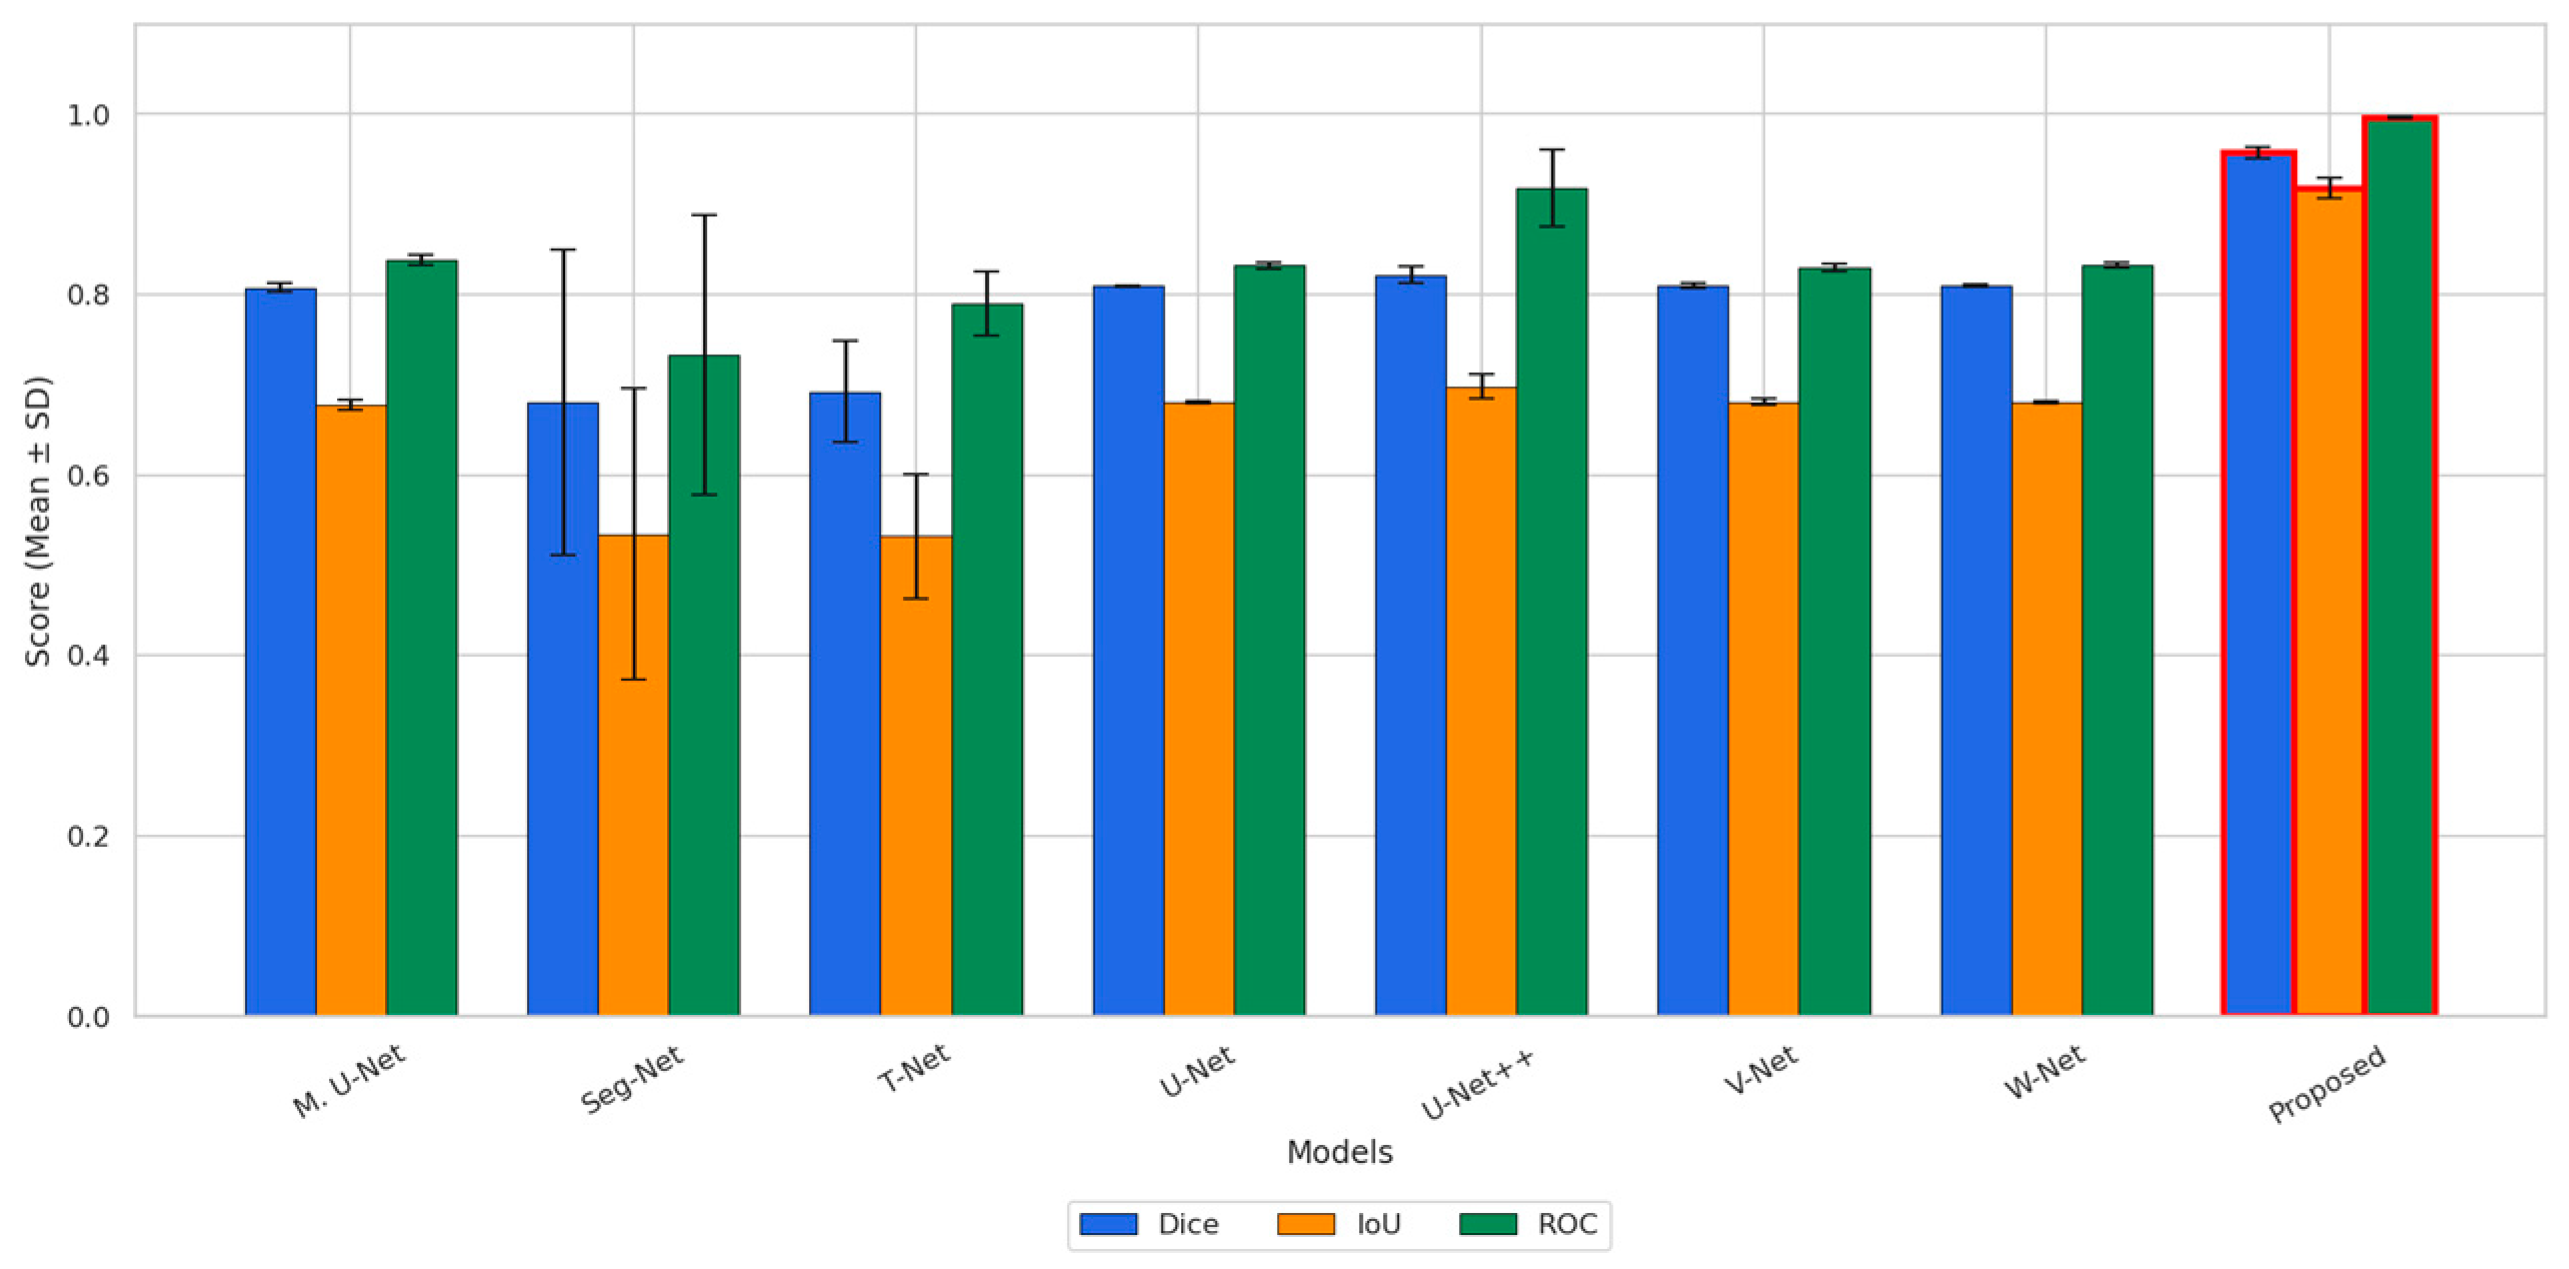
Figure 9 illustrates the segmentation performance of all models in terms of dice, IoU, and ROC metrics reported as mean ± standard deviation. The baseline architectures generally exhibit moderate performance, with dice values ranging approximately from 0.67 to 0.83 and IoU values from about 0.52 to 0.70. In addition, Seg-Net and T-Net present noticeably larger standard deviations, particularly in the IoU metric, indicating less stable segmentation behavior across repeated experiments. In contrast, the proposed method achieves the highest mean values for all three evaluation metrics, with a dice score of approximately 0.95 and an IoU value exceeding 0.90. The comparatively small error bars of the proposed method indicate a more stable and repeatable performance across different runs. With respect to the ROC metric, while most baseline models obtain values in the range of approximately 0.83–0.92, the proposed method further improves this result to nearly 1.0, demonstrating superior discriminative capability.
Figure 9.
Comparative performance analysis of dice, IoU and ROC metrics on the Drive dataset.
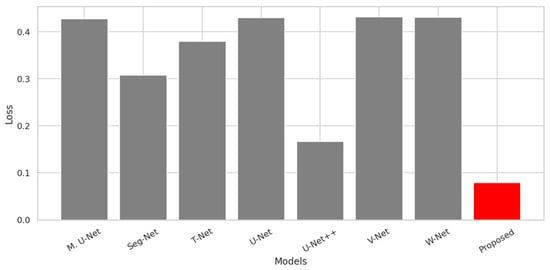
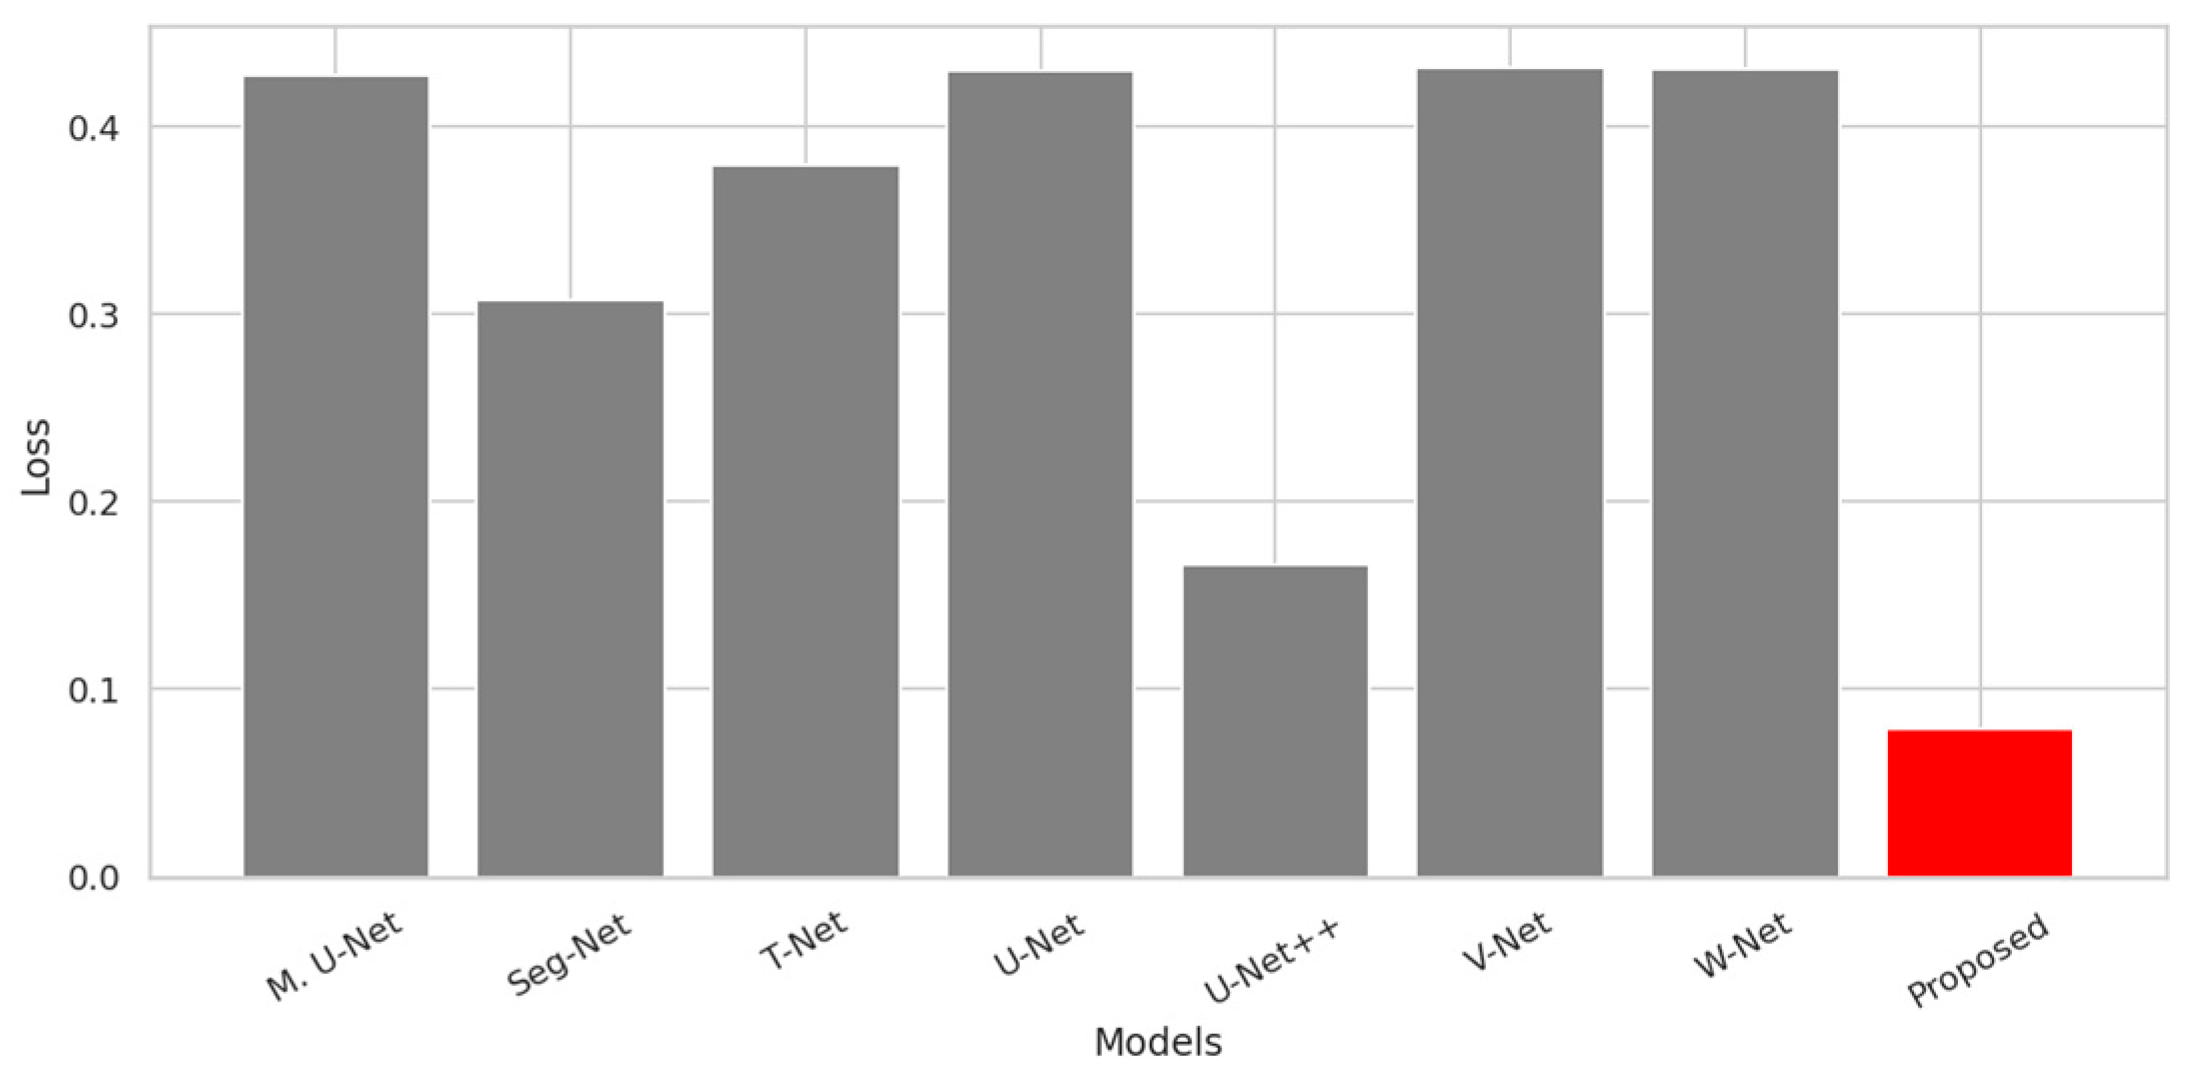
Figure 10 shows the final training loss values obtained for all models on the DRIVE dataset. As illustrated in the figure, the proposed method achieves the lowest loss value (approximately 0.08) among all compared architectures. The second lowest loss is obtained by U-Net++ (approximately 0.16), whereas the remaining baseline models converge to noticeably higher loss levels, generally ranging between approximately 0.30 and 0.44. The substantially lower loss achieved by the proposed approach indicates a more effective optimization outcome and a better fit to the training data compared to the competing methods. Overall, the results in Figure 10 demonstrate that the proposed method provides superior optimization performance in terms of final training loss on the DRIVE dataset.
Figure 10.
Comparison of loss values for segmentation models on the Drive dataset. The red bar represents our proposed method, while the other color indicates the baseline models used for comparison.
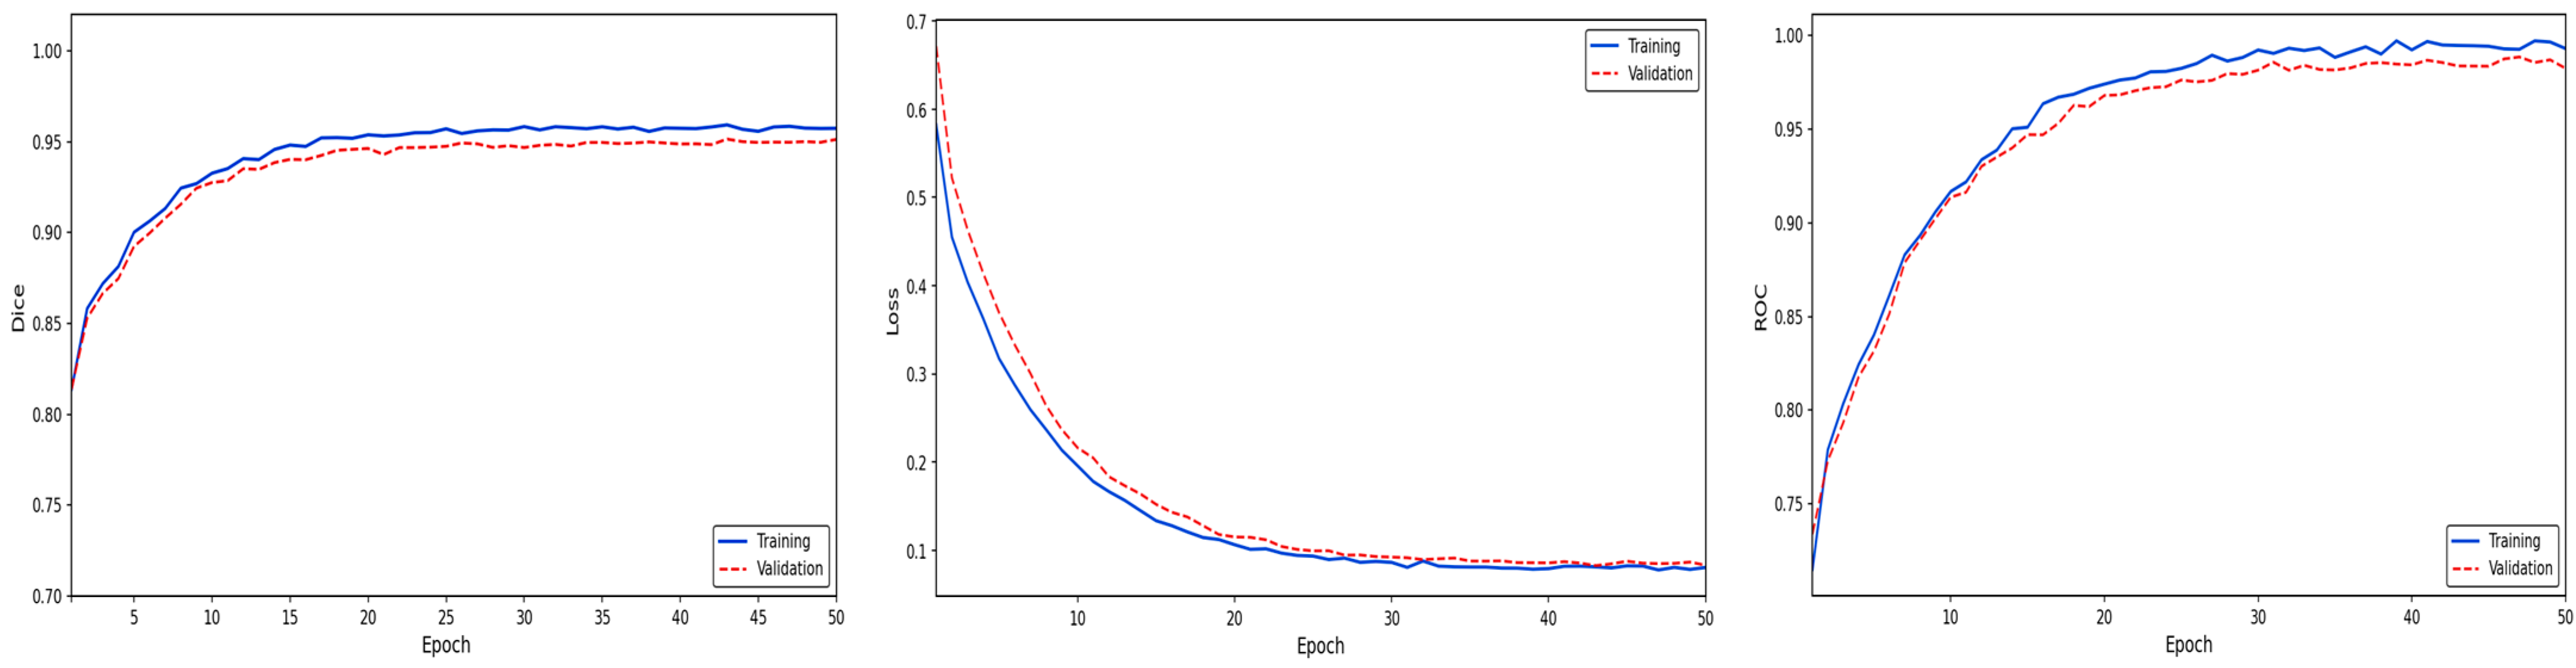
A detailed examination of the performance metrics presented in Figure 11 reveals the superiority of the proposed method, particularly in terms of ultimate accuracy and system stability. The 0.95 (training) and 0.94 (validation) values observed in the dice coefficient graph demonstrate the high saturation point reached by the model in segmentation sensitivity and the homogeneous distribution of this success across the entire dataset. The minimal difference between the training and validation curves (generalization gap) reveals that the model possesses a high generalization capacity and is completely free from the risk of overfitting. The very low error levels achieved by the loss function and the flawless stability in the 0.99 band seen in the ROC AUC graph on the right confirm that the method exhibits operational excellence in distinguishing target structures.
Figure 11.
Performance analysis of the proposed model on the Drive [27] dataset.
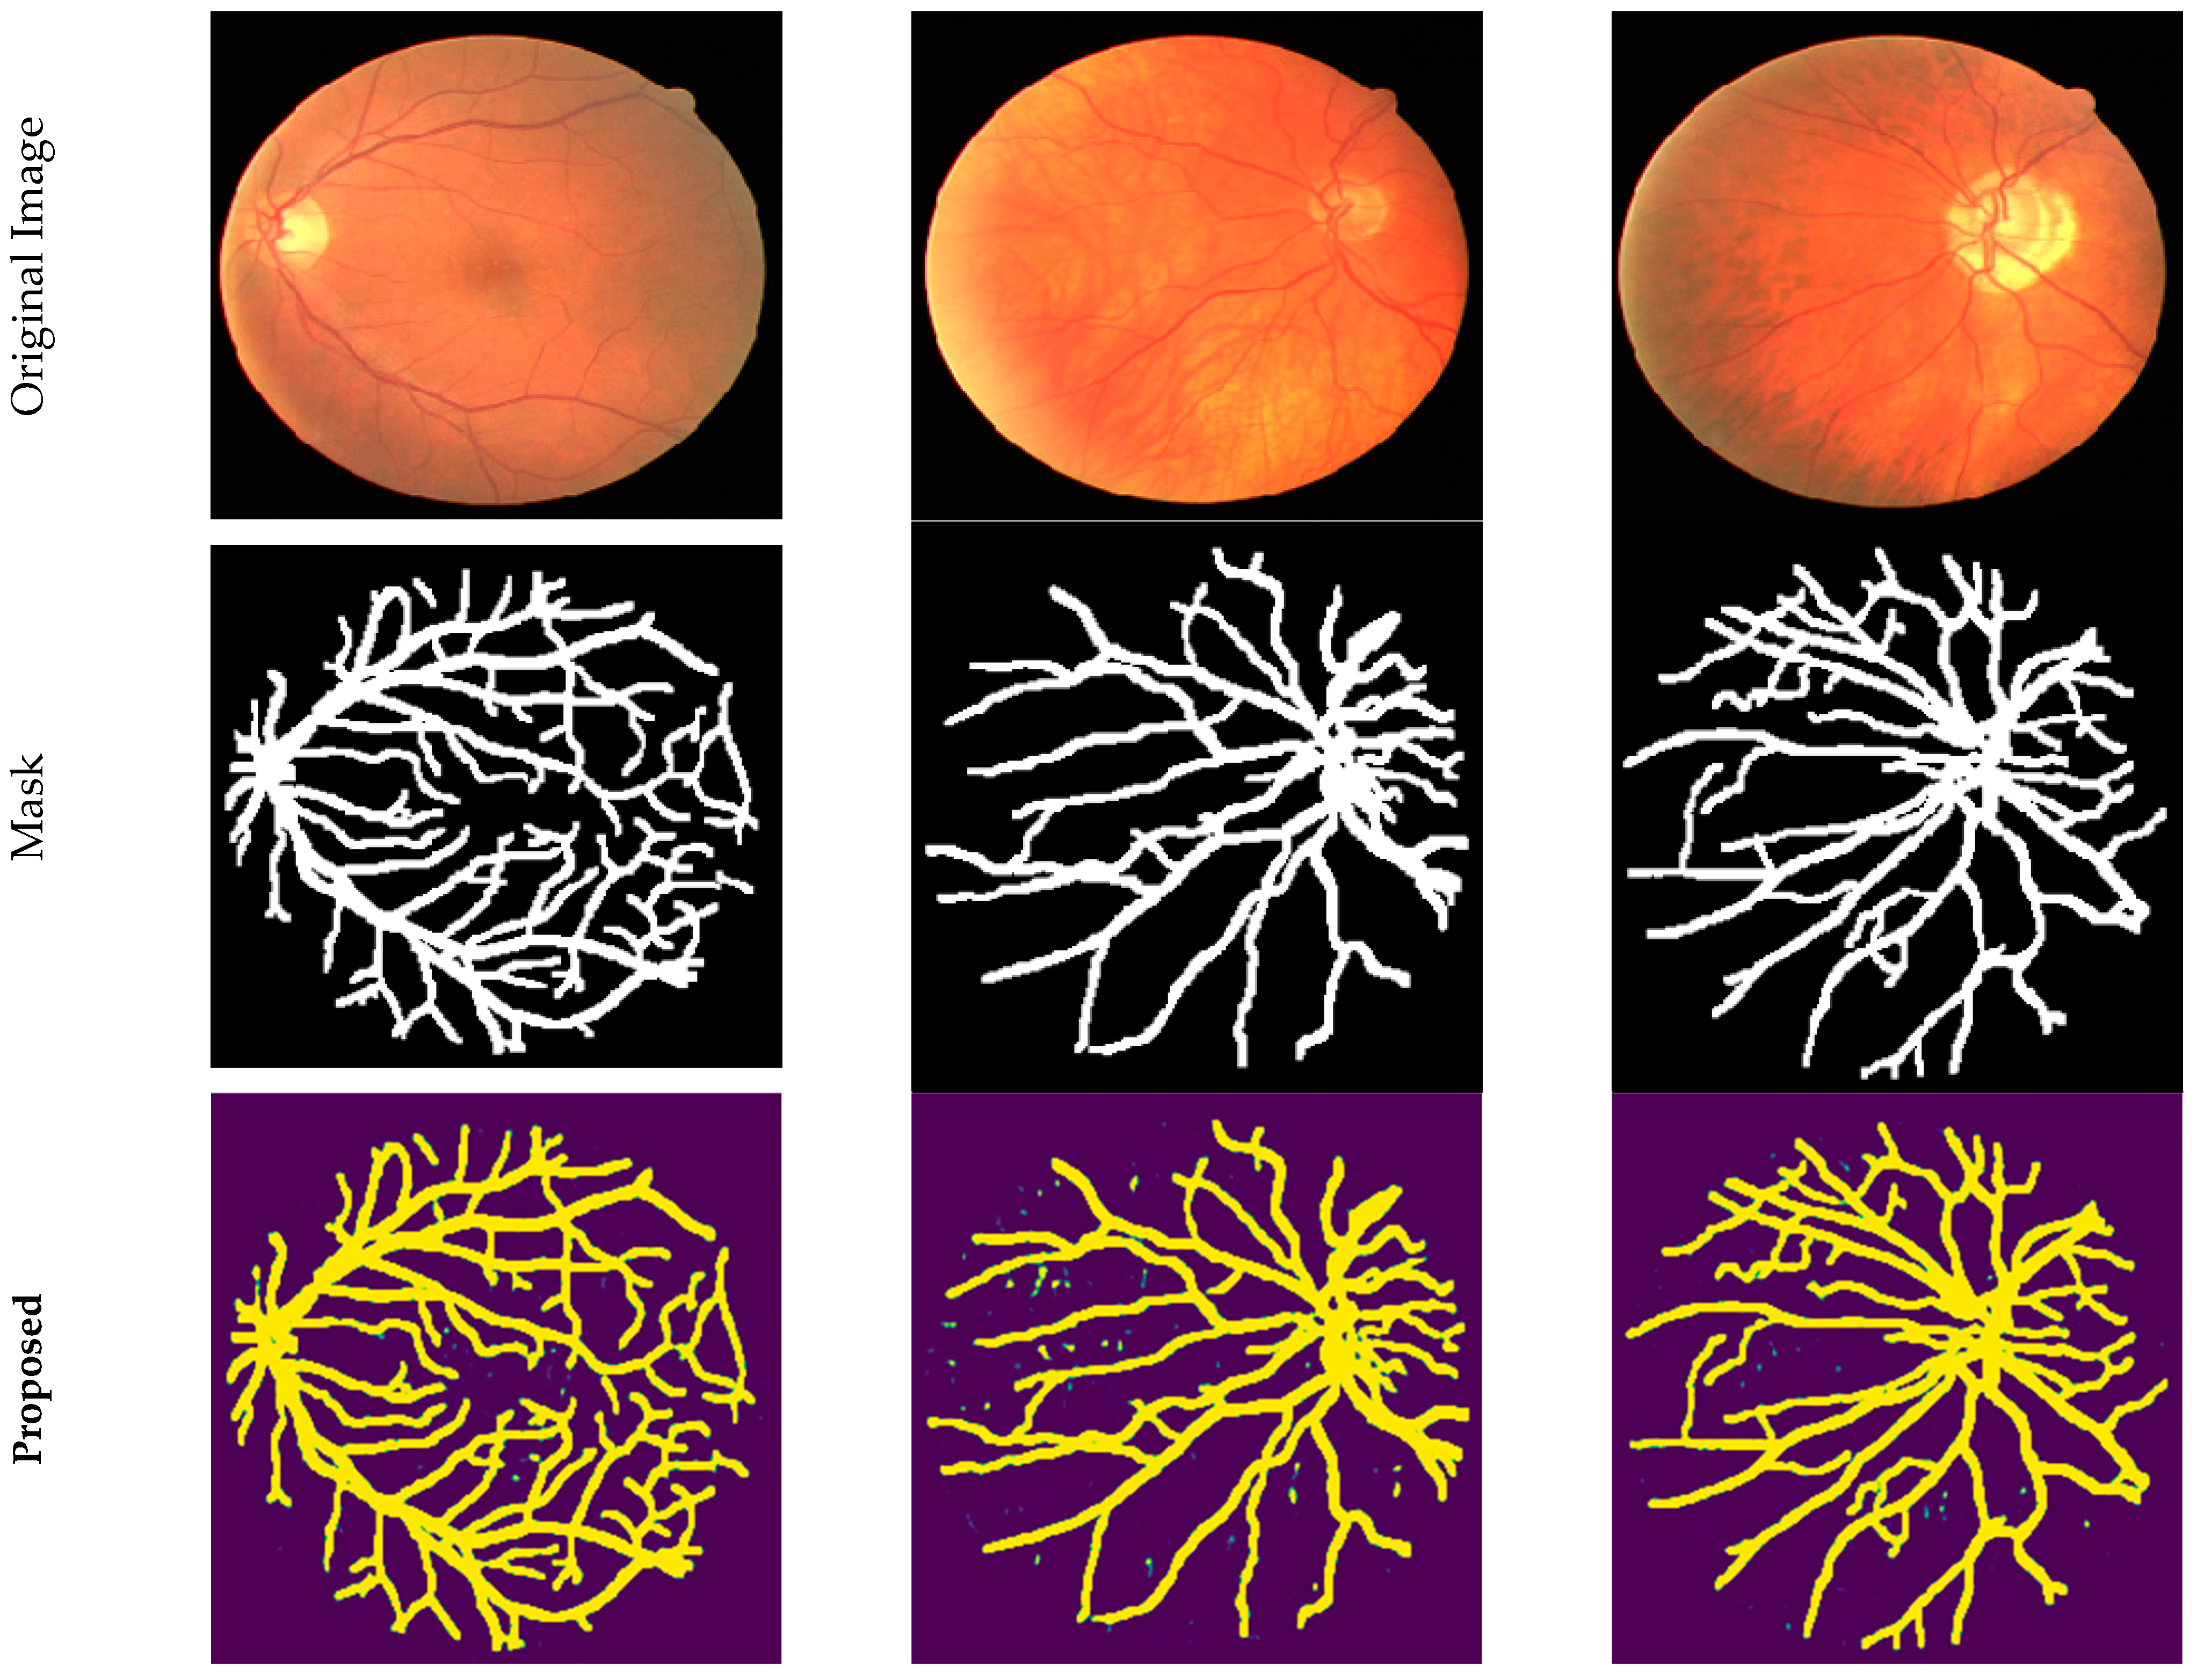
The qualitative prediction results of the proposed method on retinal images are presented in Figure 12. The figure shows, in order, the original fundus images, the reference (ground truth) vessel masks created by experts, and the segmentation outputs obtained by the proposed method. Visual comparison demonstrates that the model can accurately distinguish major vessel structures as well as thin and low-contrast vessel branches. In particular, the preservation of vessel continuity, the accurate representation of branching points, and the significant suppression of noise-induced false positive regions clearly demonstrate the prediction performance of the proposed approach. These qualitative results confirm that the proposed method can effectively learn both global vessel morphology and local structural details, producing consistent segmentation outputs that highly overlap with reference masks.
Figure 12.
Qualitative prediction results on retinal vessel segmentation.
Table 6 reports the quantitative comparison of all models on the DRIVE dataset in terms of means and standard deviations of multiple evaluation metrics. The proposed model achieves the highest performance in all major metrics, including accuracy (0.972), dice (0.957), and IoU (0.918), indicating a substantial improvement in segmentation accuracy and region overlap compared to the competing approaches. In addition, the proposed method attains high and well-balanced precision (0.955) and recall (0.963) values, demonstrating its effectiveness in reducing both false positive and false negative predictions.
Table 6.
Comparative Performance Analysis of Segmentation Models on the retina dataset.
The proposed model also achieves the highest specificity (0.970) and ROC (0.996) scores among all methods, confirming its superior background discrimination capability and class separability. Furthermore, the proposed approach yields the lowest Loss value (0.079) together with a very small standard deviation (0.005), indicating a more stable and well-optimized learning process. In contrast, several baseline models, particularly Seg-Net and T-Net, exhibit noticeably lower mean performance and much larger standard deviations across multiple metrics, revealing a less stable and more data-sensitive behavior. Although some architectures such as V-Net, U-Net, W-Net, and M. U-Net show comparable performance to each other, they are consistently outperformed by the proposed method across all evaluation criteria. Overall, the results presented in Table 6 demonstrate that the proposed model provides superior accuracy, robustness, and overall segmentation performance on the DRIVE dataset.
4.3. Comparative Road Segmentation Performance Analysis on the Massachusetts Roads Dataset
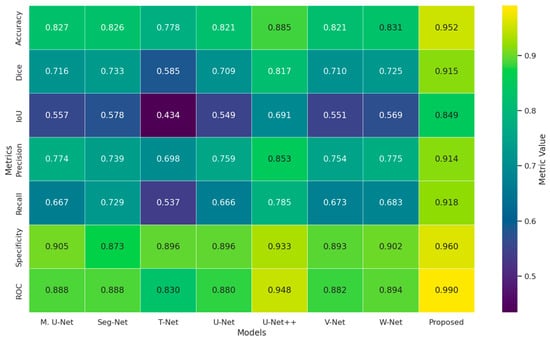
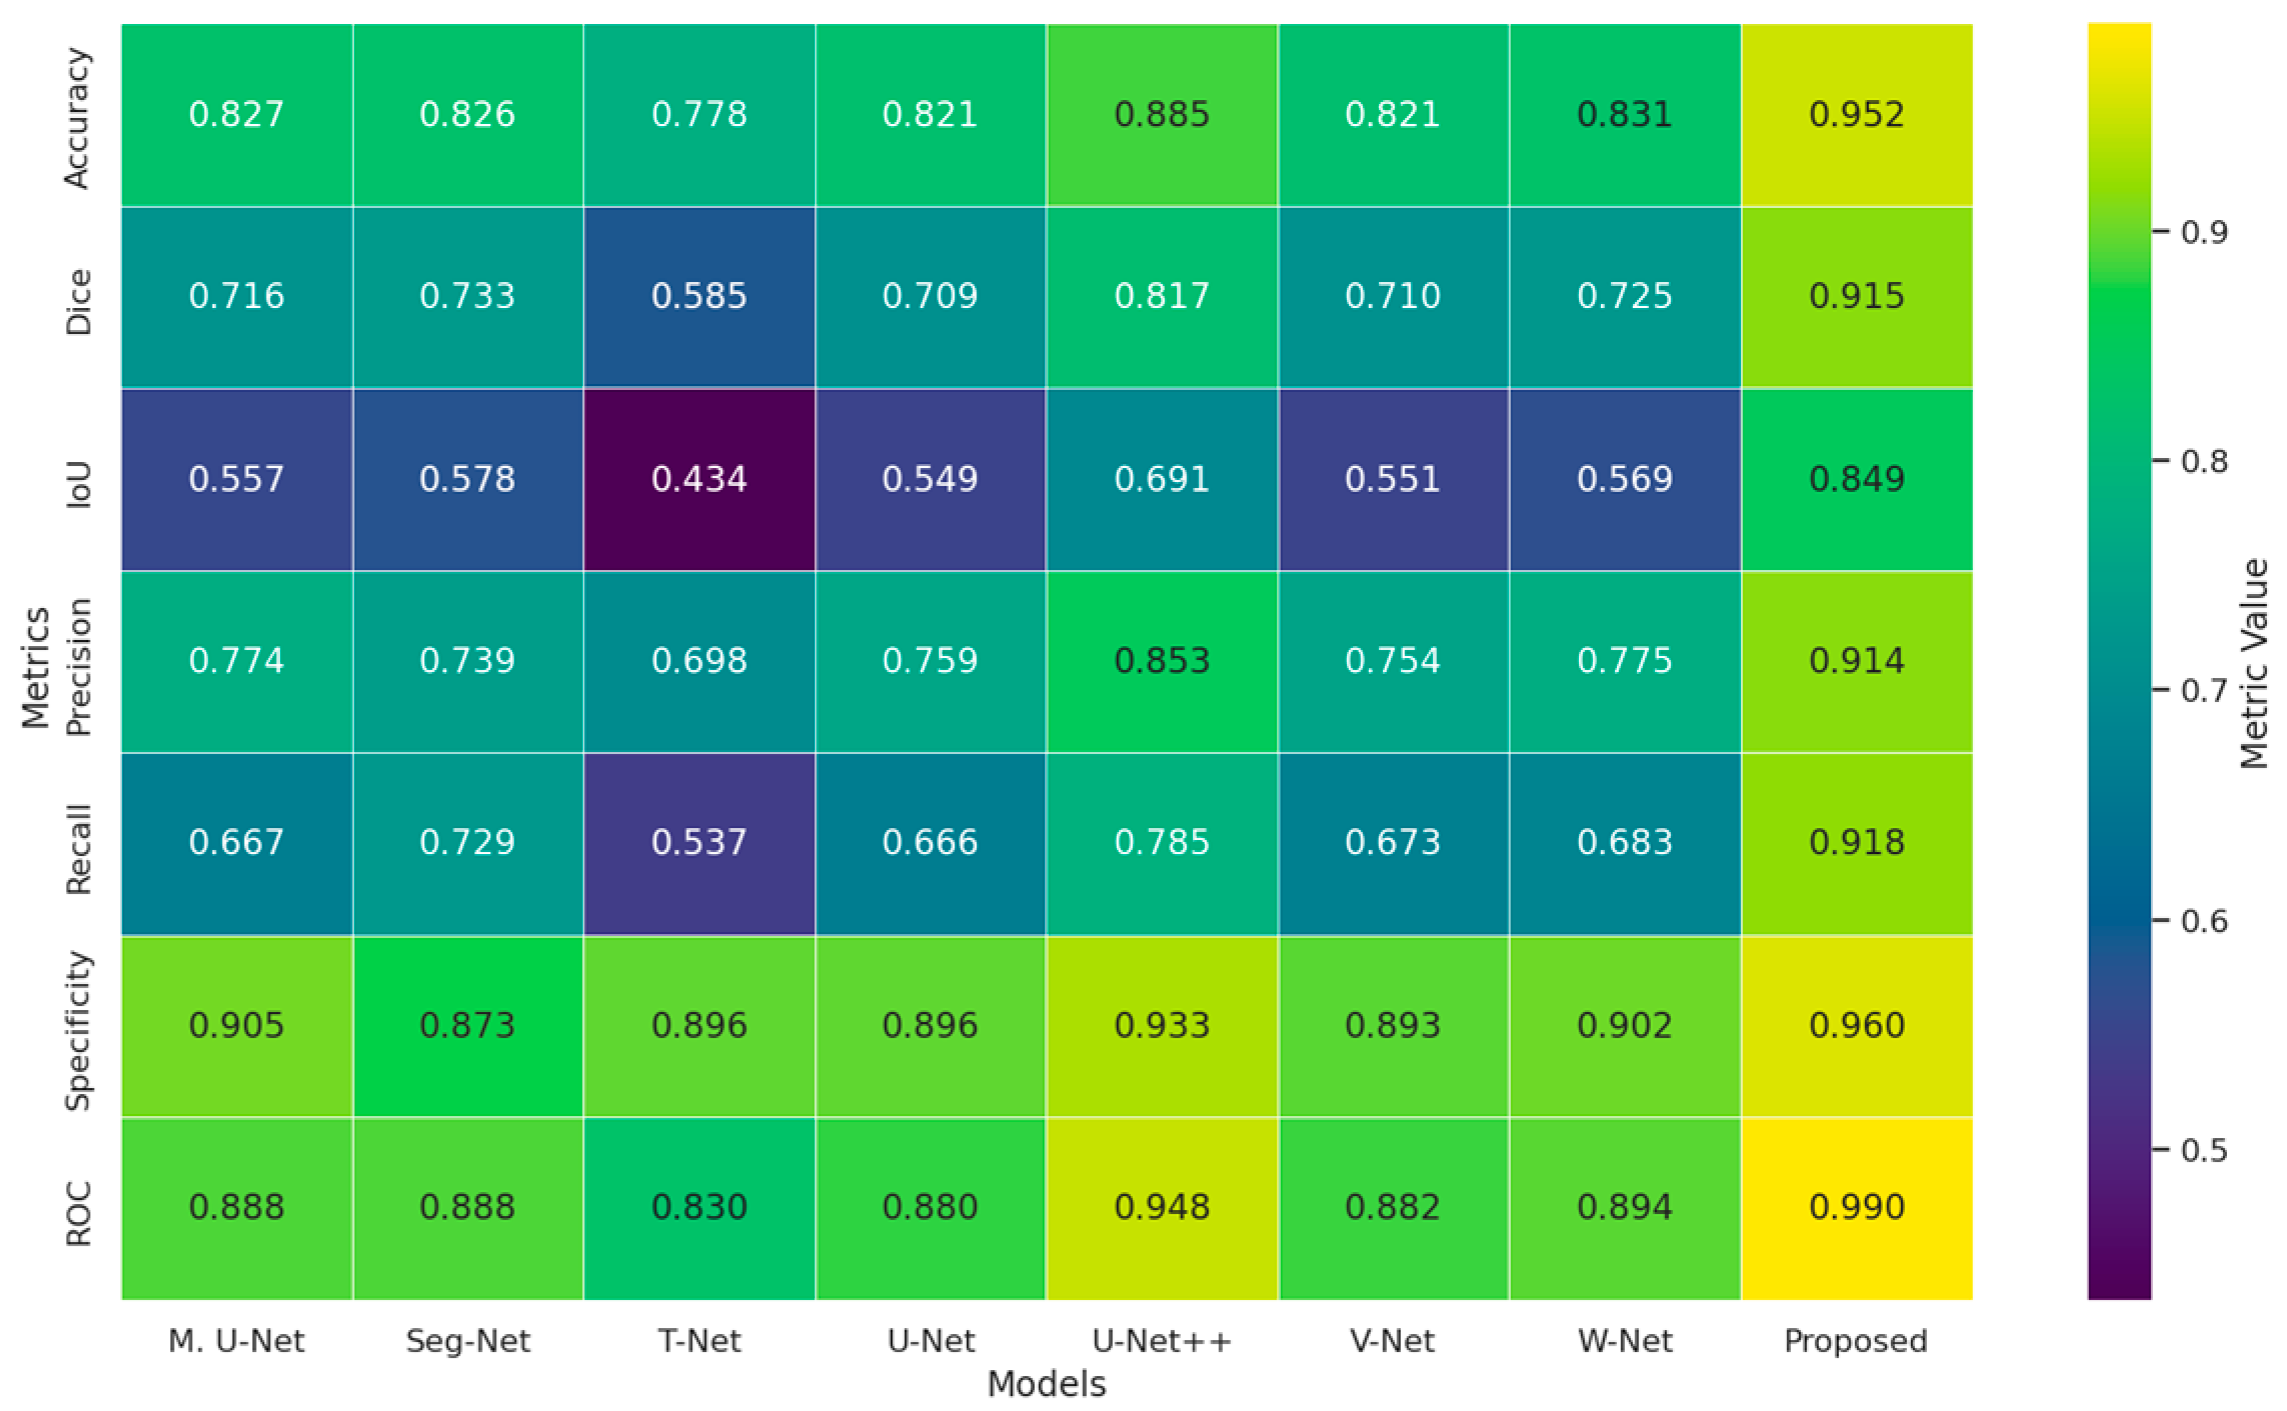
Figure 13 summarizes the experimental results obtained on fine and continuity-sensitive structures, such as road segmentation, using multiple evaluation metrics. As shown in the heatmap, the proposed method achieves the highest performance in all reported metrics, including accuracy (0.952), dice (0.915), and IoU (0.849), demonstrating a clear improvement in segmentation accuracy and region overlap compared to the competing architectures. In addition, the proposed approach maintains a well-balanced performance with high precision (0.914) and recall (0.918), indicating an effective reduction in both false positive and false negative predictions. The proposed model also attains the highest specificity (0.960) and ROC (0.990) values among all methods, confirming its superior background discrimination capability and strong class separability. Overall, the results presented in Figure 13 indicate that the proposed model provides more consistent, balanced, and reliable segmentation performance for road segmentation tasks than the existing architectures.
Figure 13.
Comparative heatmap representation of different segmentation models based on evaluation metrics on the Massachusetts dataset.
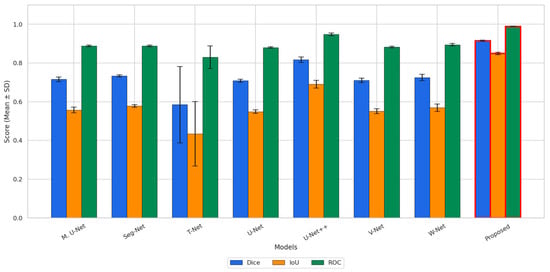
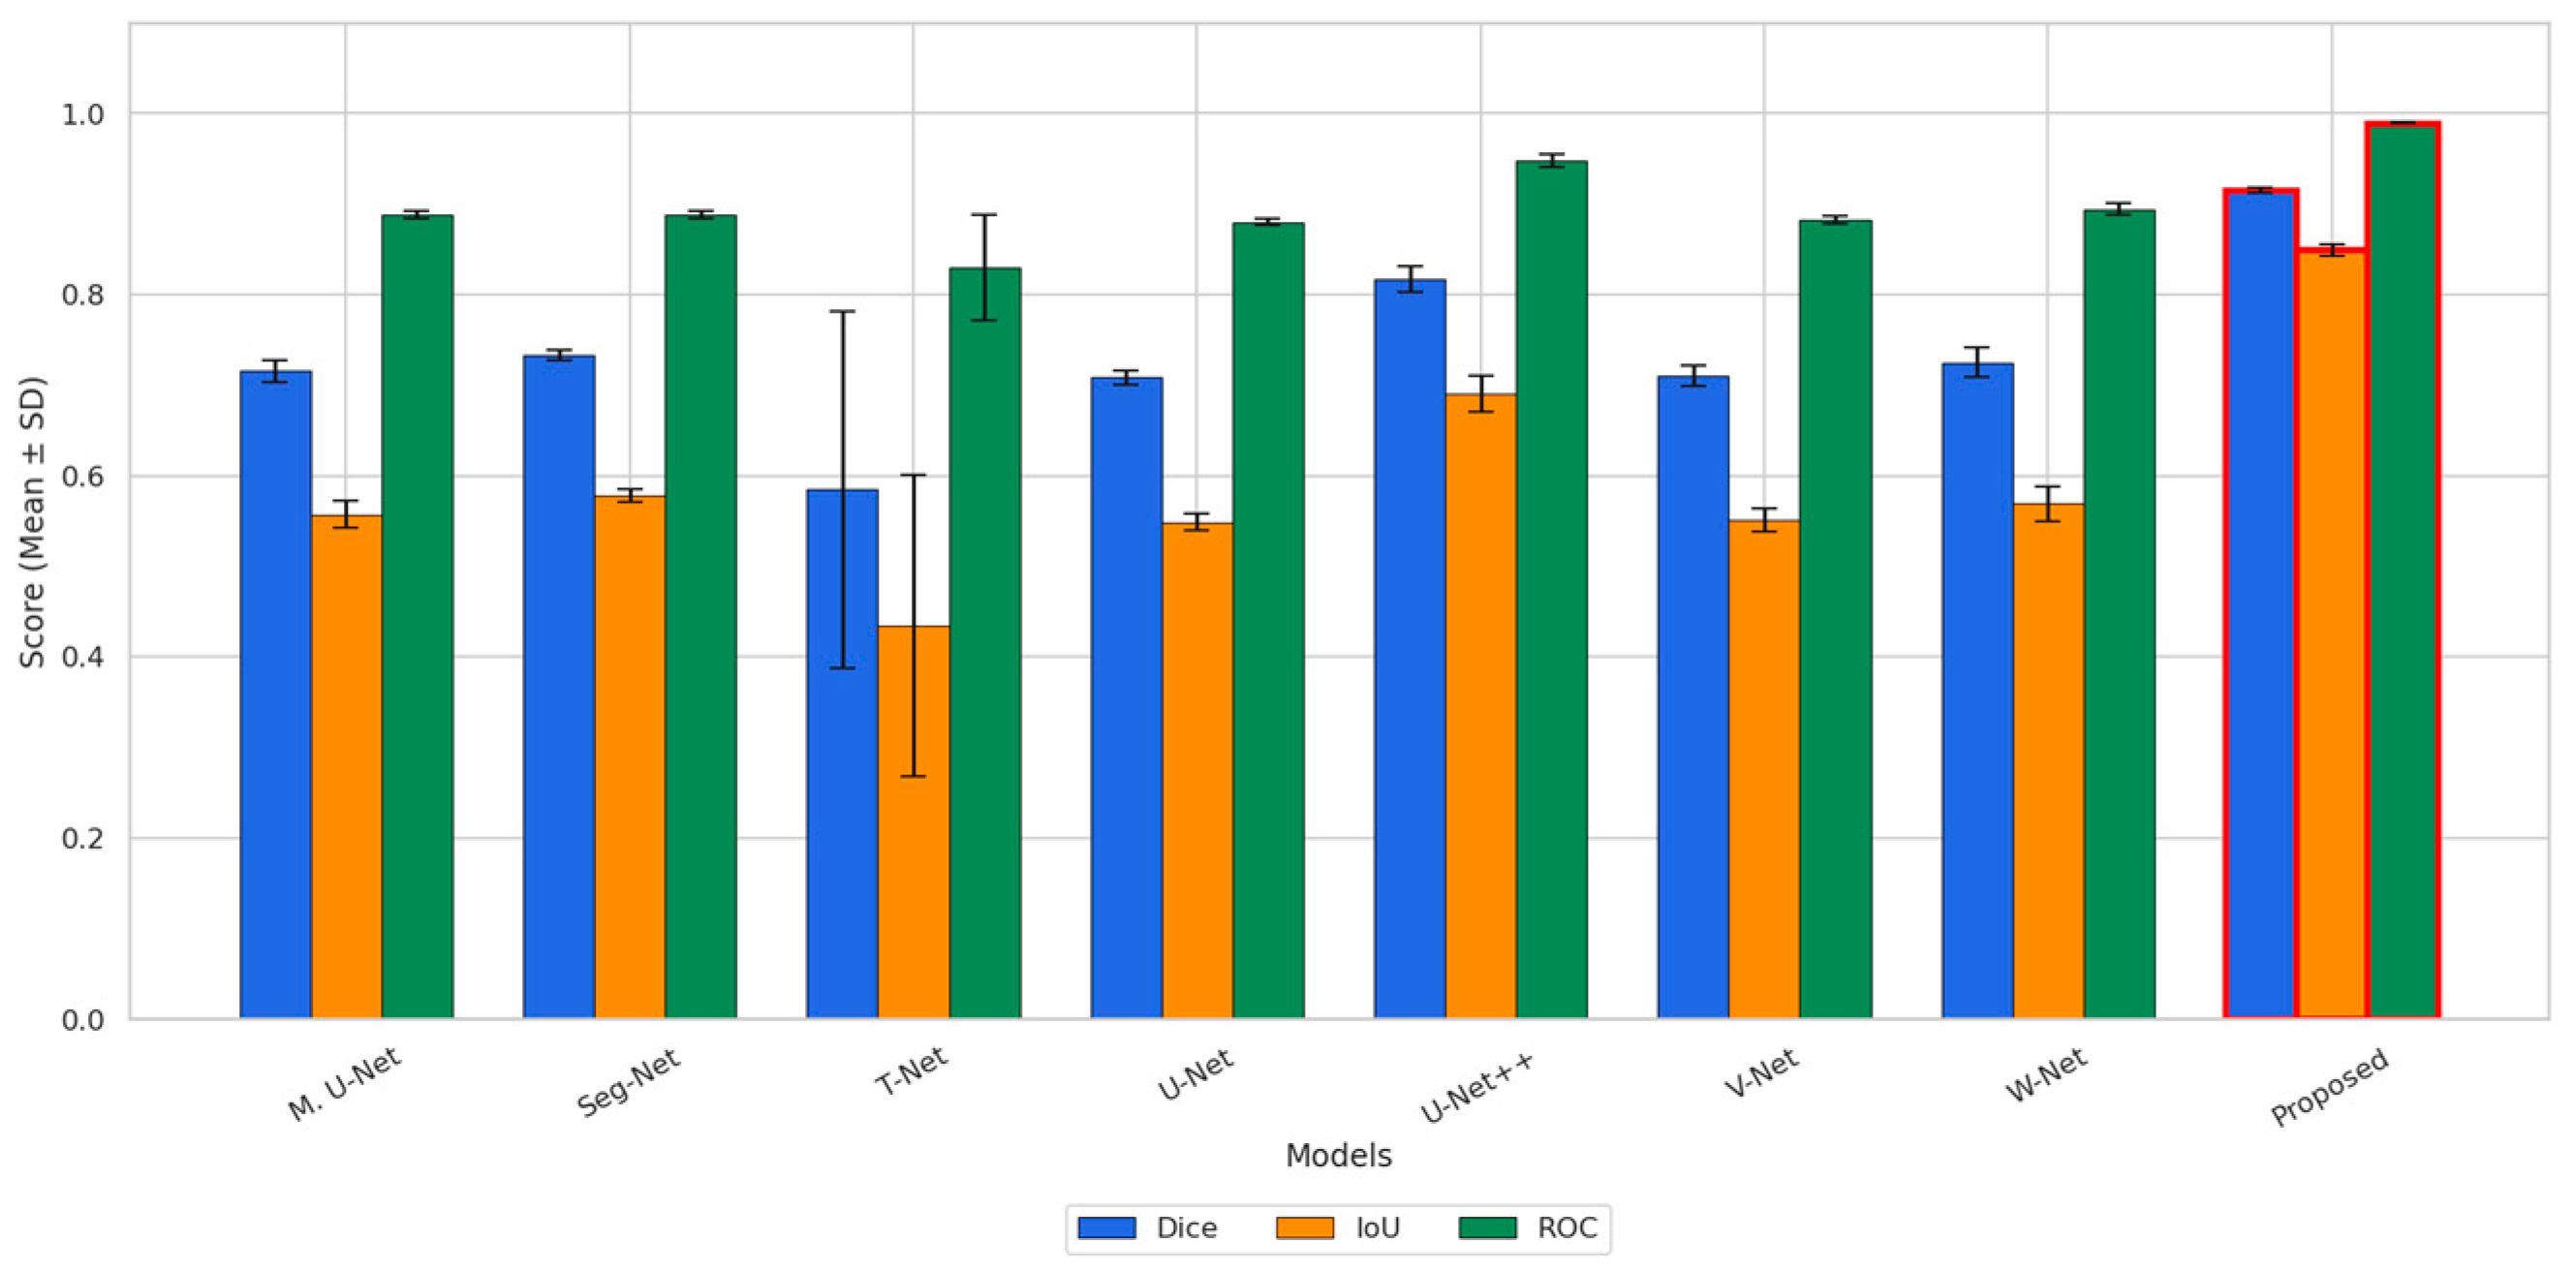
Figure 14 presents the segmentation performance of all models on the road scene dataset in terms of dice, IoU, and ROC metrics reported as mean ± standard deviation. The baseline architectures generally achieve moderate segmentation performance, with dice values ranging approximately from 0.59 to 0.82 and IoU values between about 0.43 and 0.69. Among the baseline models, T-Net exhibits noticeably larger standard deviations, particularly for both dice and IoU, indicating less stable segmentation behavior across repeated experiments. In contrast, the proposed method achieves the highest mean values for all three evaluation metrics, with a dice score of approximately 0.91 and an IoU value of about 0.85. The relatively small error bars associated with the proposed method indicate more stable and repeatable performance compared to the competing approaches. With respect to the ROC metric, while the baseline models obtain values roughly in the range of 0.83–0.94, the proposed method further improves this result to nearly 1.0, demonstrating superior discriminative capability. Overall, the results shown in Figure 14 confirm that the proposed method provides more accurate and more robust segmentation performance than the existing architectures for complex road scene segmentation tasks.
Figure 14.
Comparative performance analysis of dice, IoU, F1-Score, and ROC metrics on the Massachusetts [28] dataset.
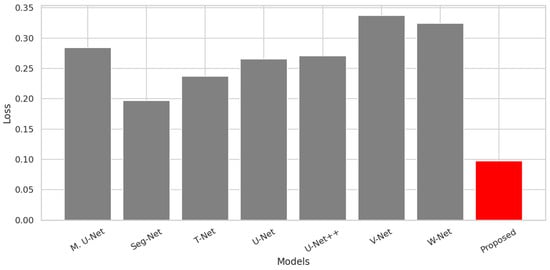
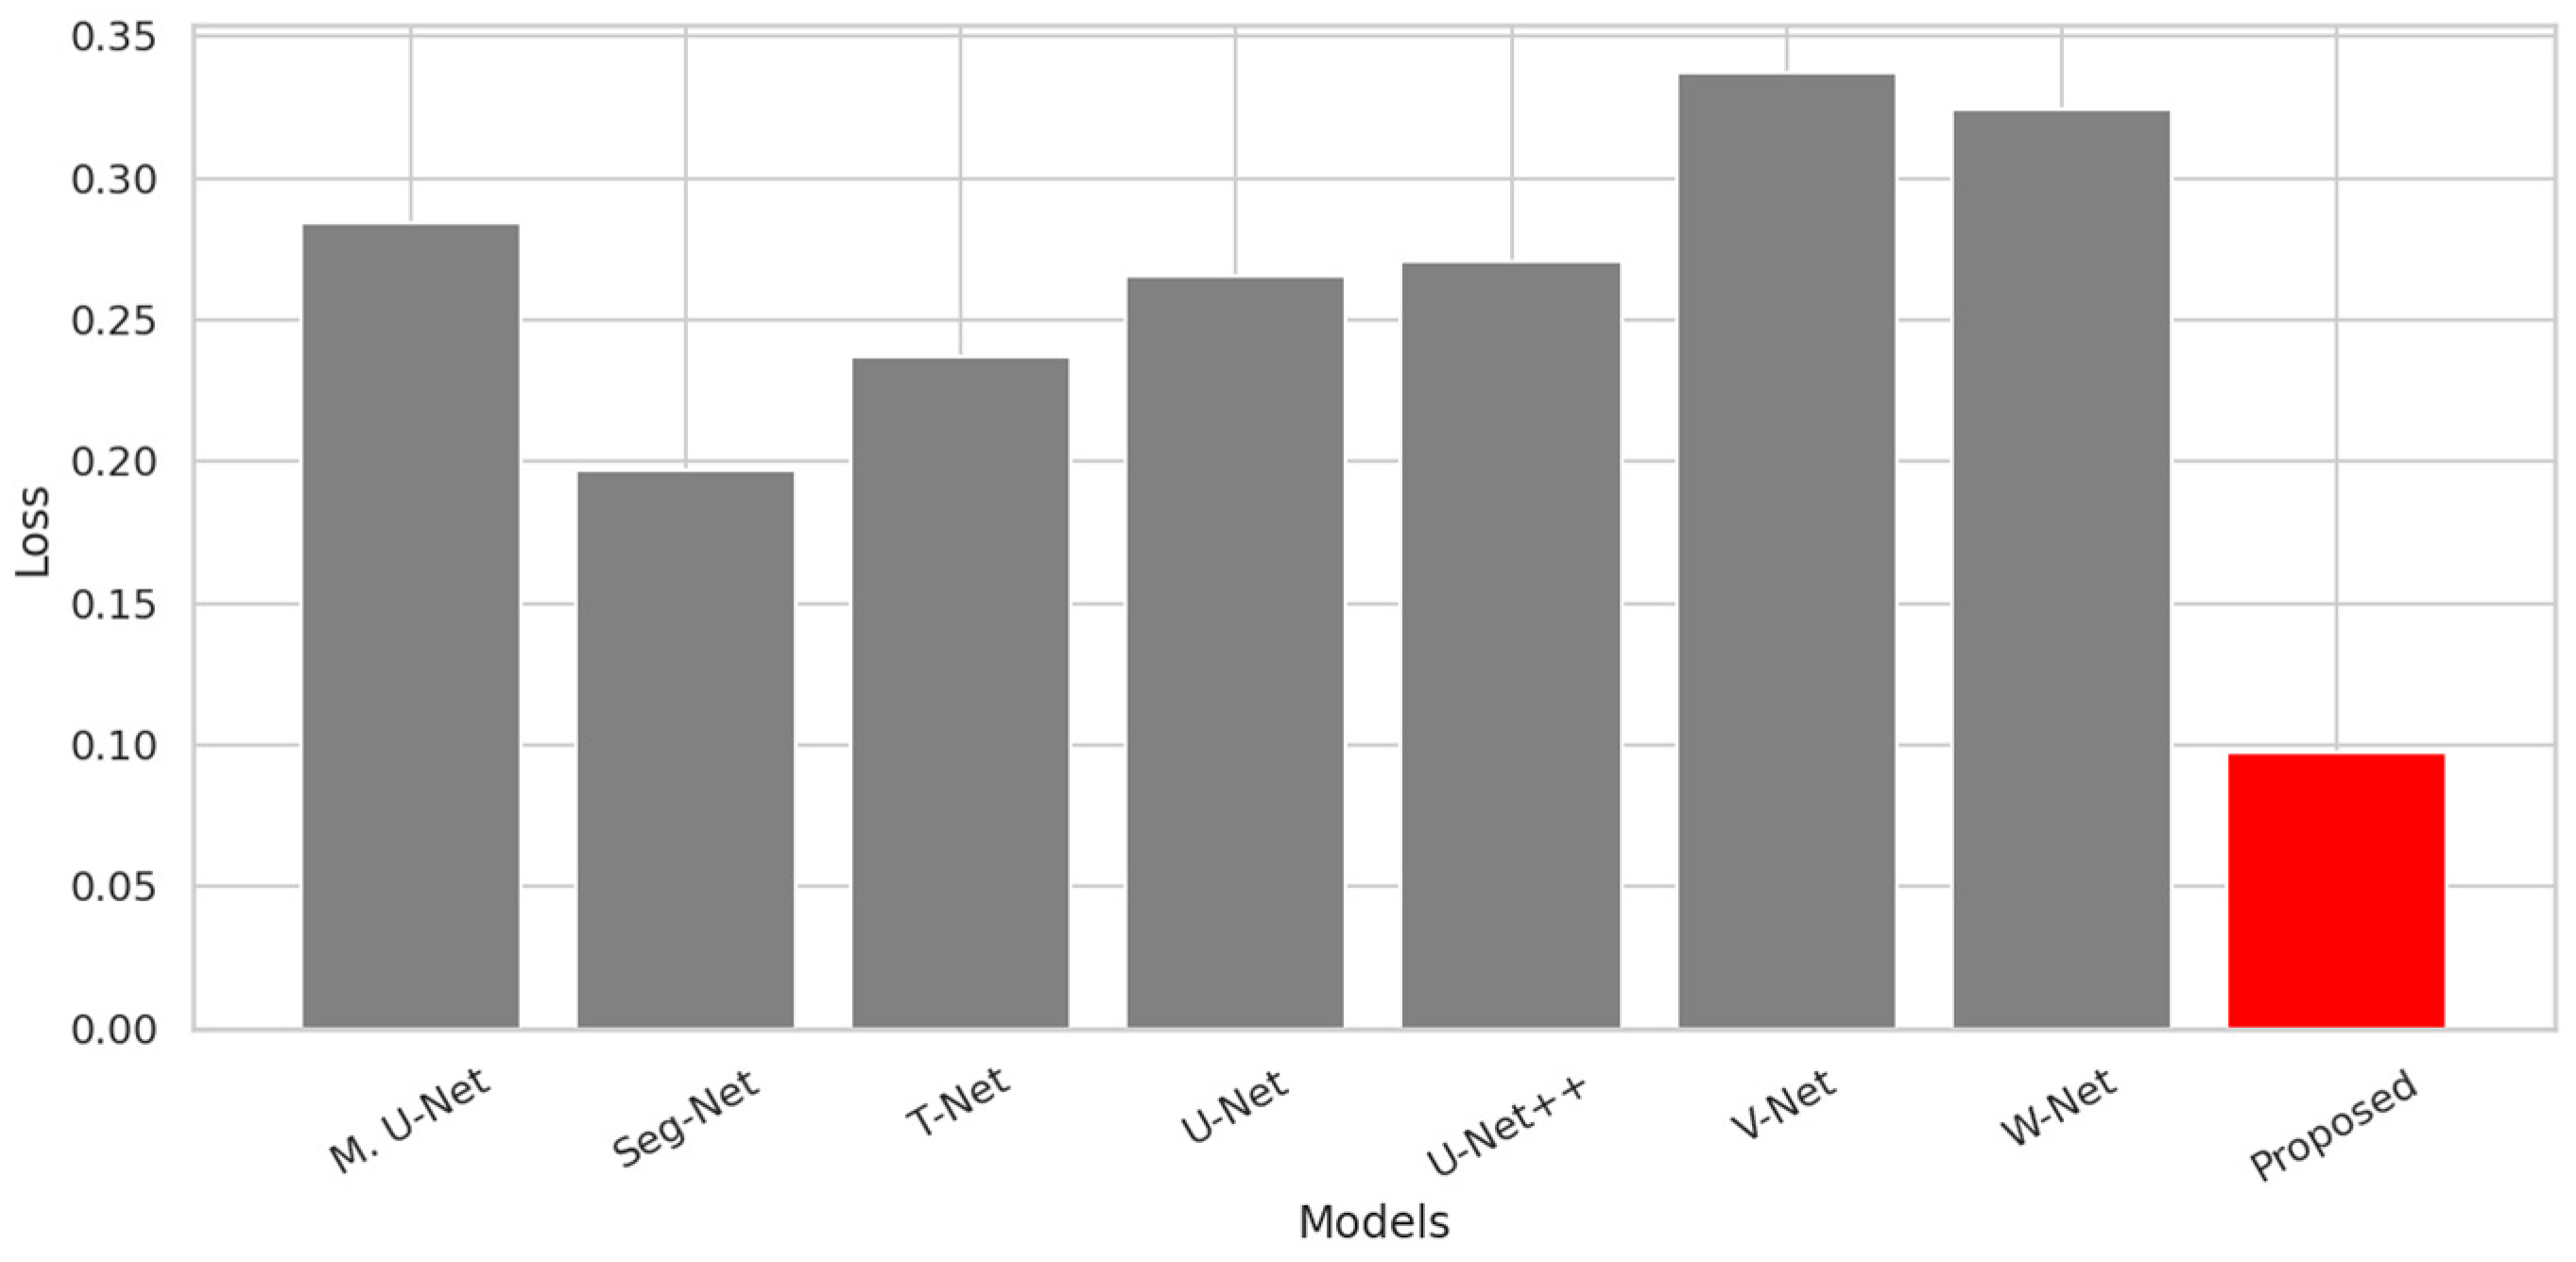
Figure 15 illustrates the final training loss values obtained on the road scene dataset for all compared models. As shown in the figure, the proposed method achieves the lowest loss value (approximately 0.10) among all architectures, indicating a lower fitting error compared to the competing approaches. In contrast, the baseline models converge to noticeably higher loss levels, generally ranging from approximately 0.20 to 0.34. In particular, V-Net and W-Net exhibit the highest loss values, whereas Seg-Net achieves the lowest loss among the baseline methods. The substantially lower loss obtained by the proposed model suggests a more effective optimization outcome and a better fit to the training data for road scene segmentation. Overall, the results in Figure 15 demonstrate that the proposed method provides superior optimization performance in terms of final training loss compared to the existing architectures.
Figure 15.
Comparison of loss values for segmentation models on the Massachusetts [28] dataset. The red bar represents our proposed method, while the other color indicates the baseline models used for comparison.
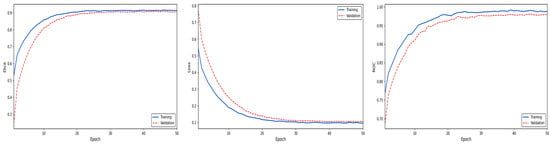
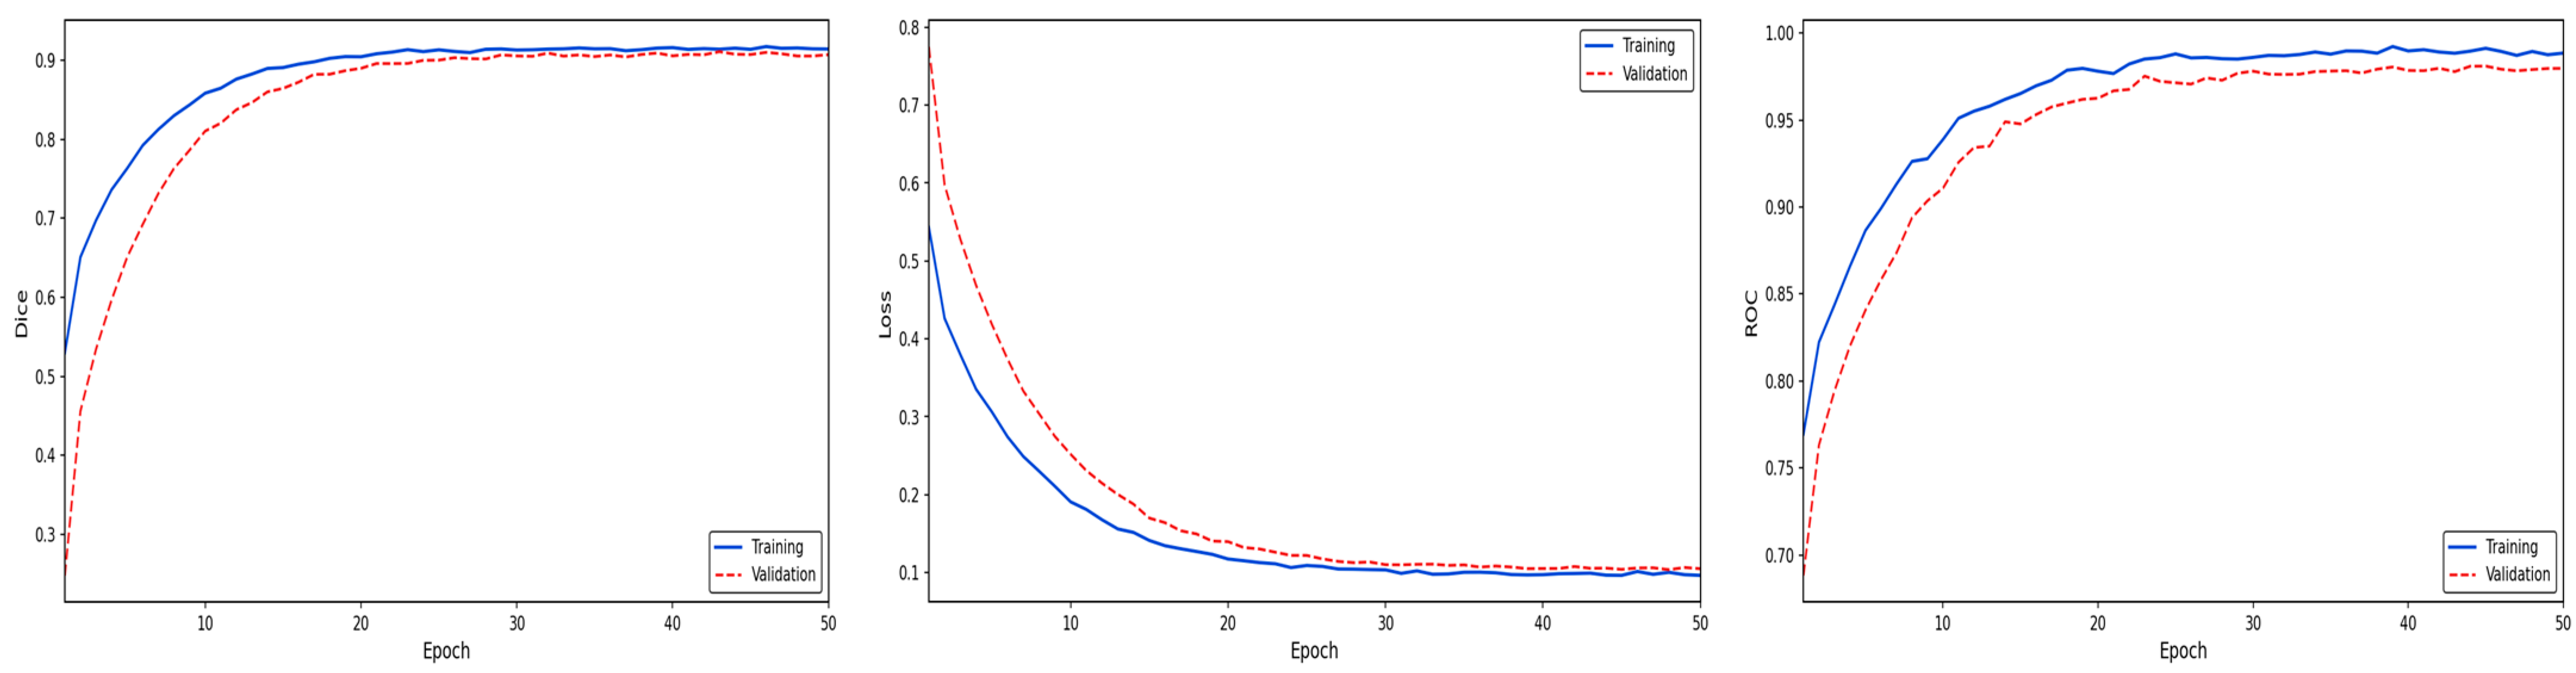
A detailed examination of the performance curves presented in Figure 16 reveals that the proposed model produces results consistent with the high-performance levels accepted in the literature, both in terms of segmentation accuracy and learning dynamics. The dice coefficient graph shows that the training and validation curves reach a stable plateau at approximately 0.95 and 0.94, respectively, indicating that the model successfully learned to represent complex texture structures and exhibited a strong generalization ability on previously unseen data. The smooth and monotonic decreasing trend observed in the loss function suggests that the optimization process is progressing steadily, revealing that the model converges with an error value of approximately 0.08. Additionally, the fact that the ROC AUC curves are extremely close to 1.00 confirms that the proposed approach has a very high capacity to distinguish between the target region and background classes, and that its classification performance offers statistically strong discrimination. In conclusion, Figure 16 confirms that the proposed method demonstrates effective performance with both high segmentation success and stable and reliable learning behavior throughout the training process.
Figure 16.
Performance analysis of the proposed method on the Massachusetts dataset [28].
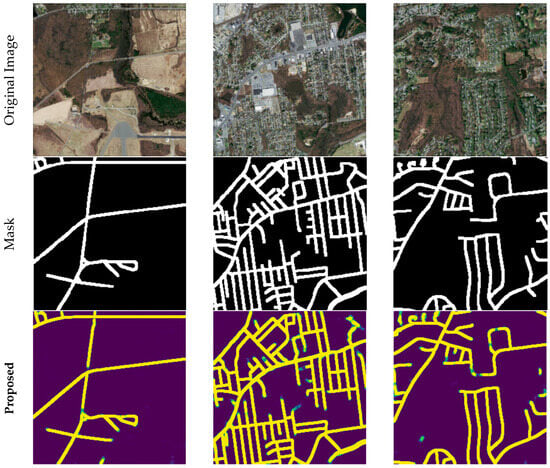
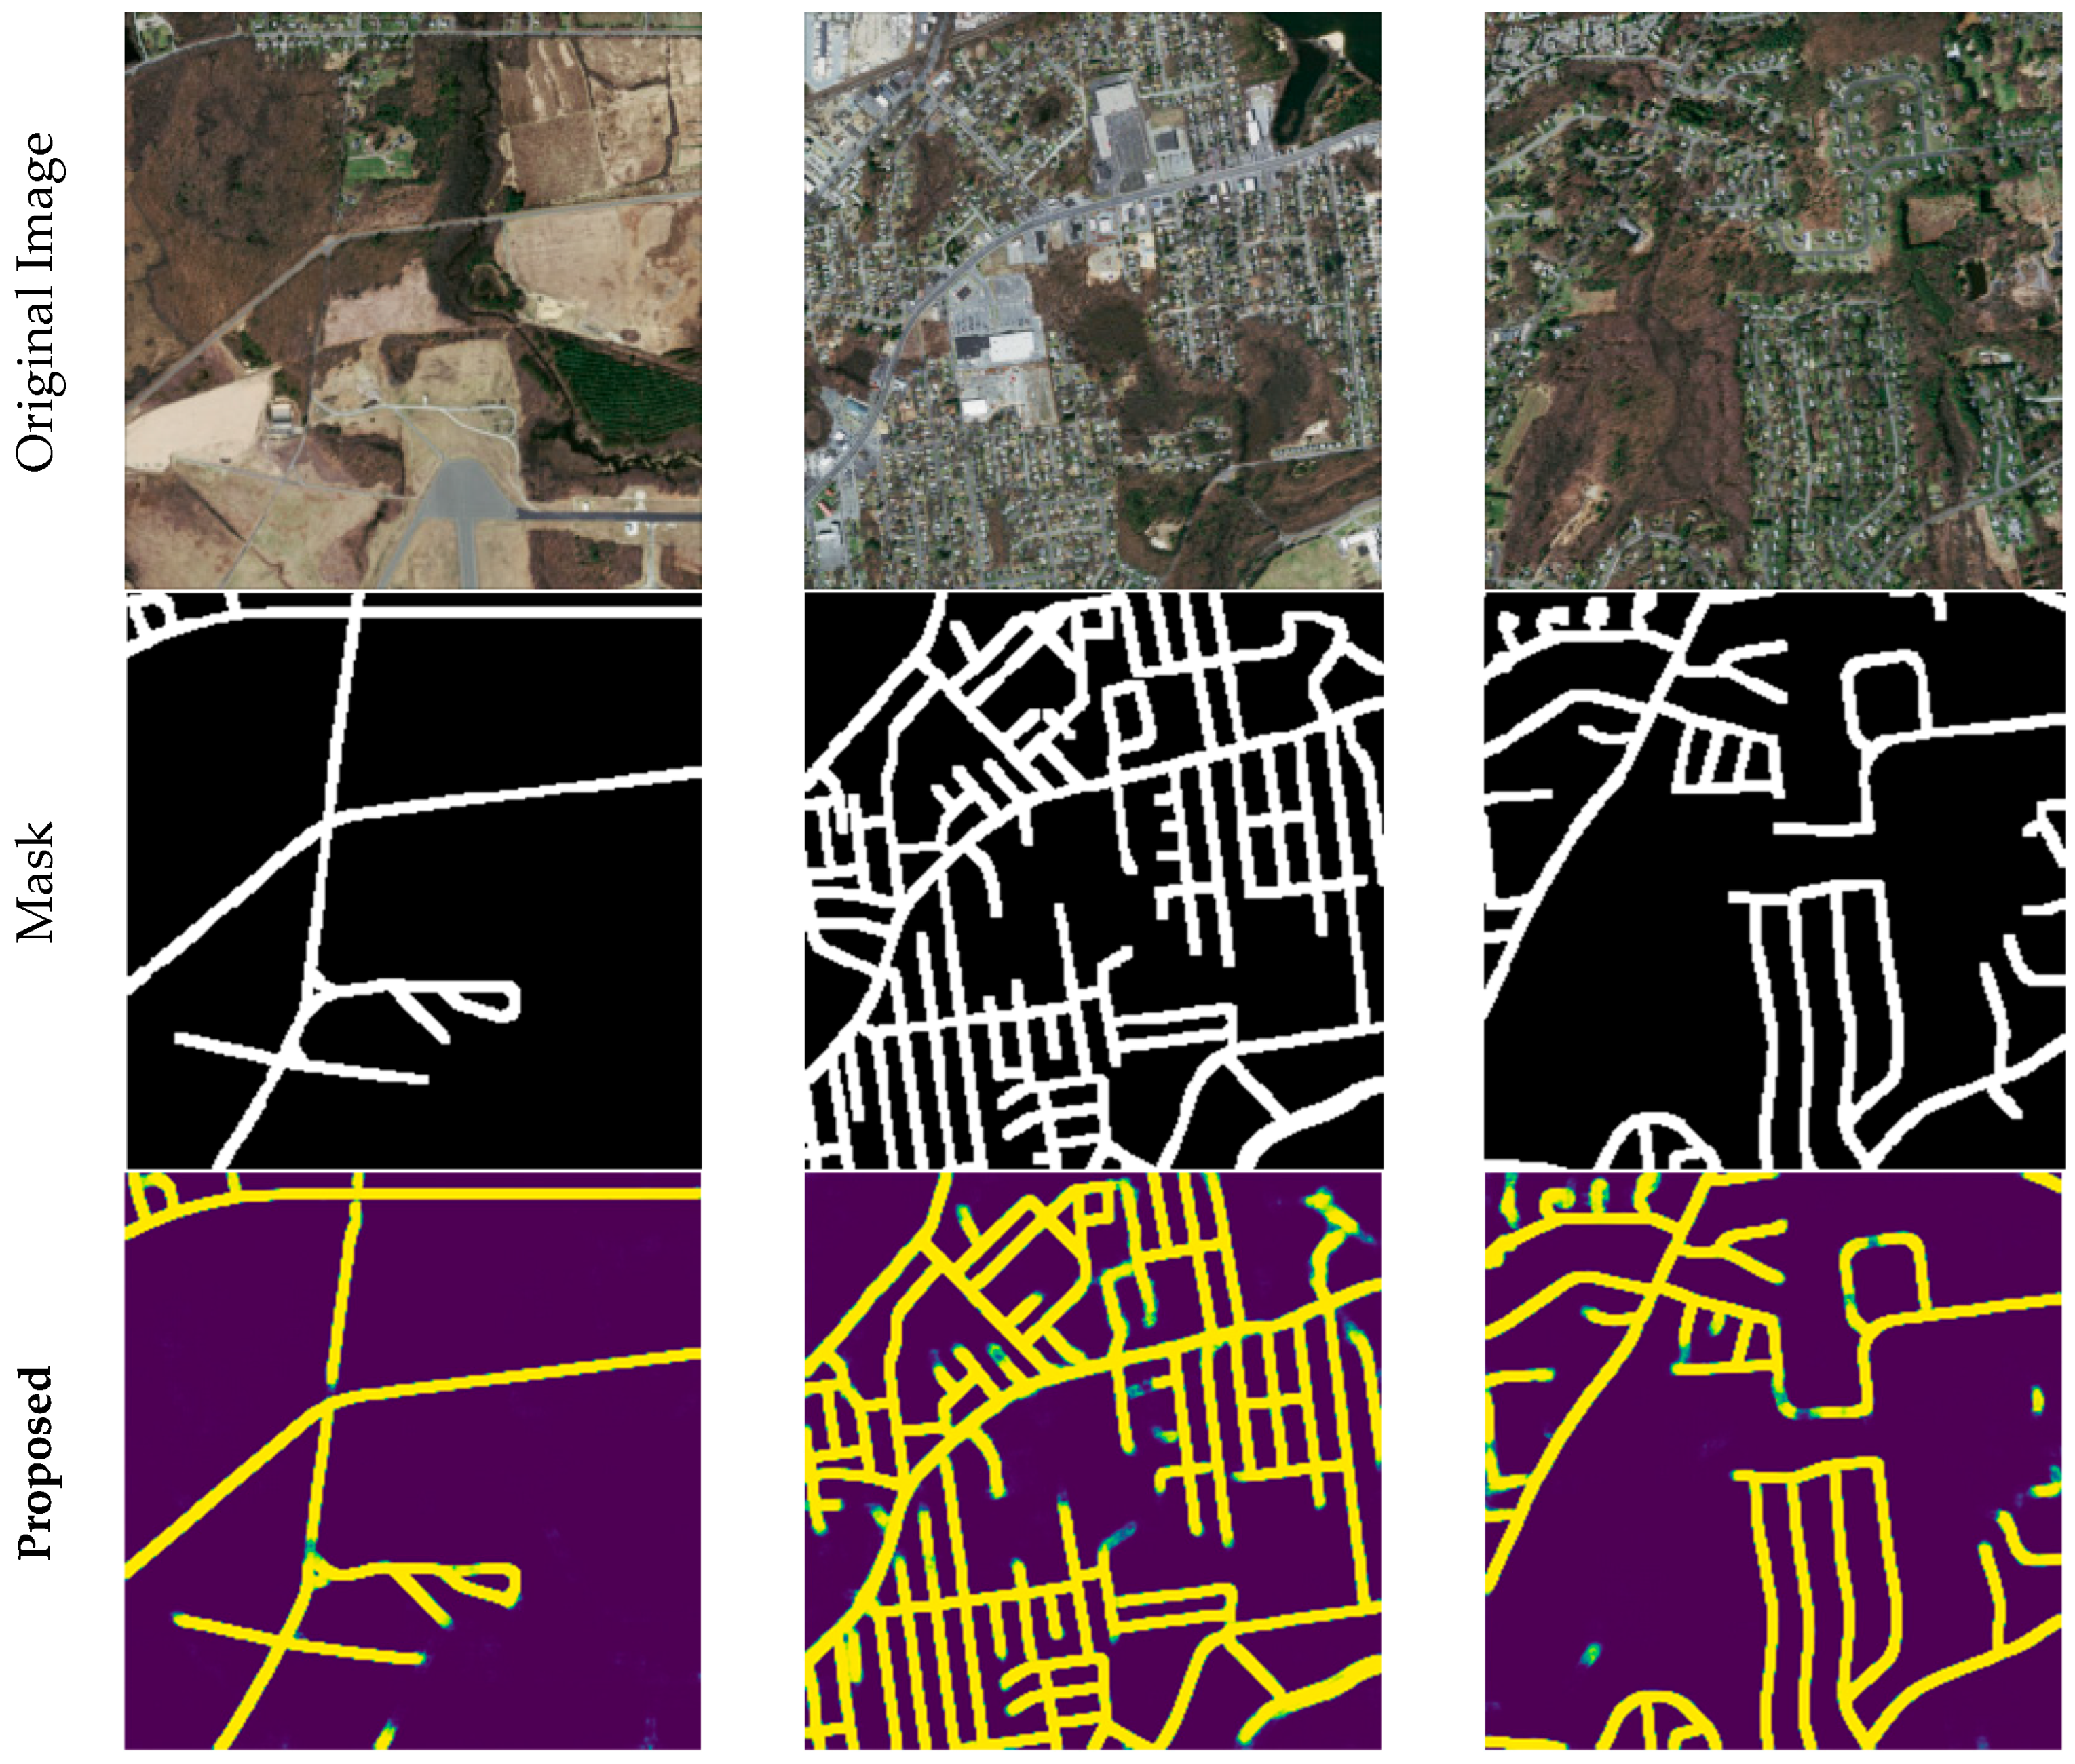
The qualitative prediction results of the proposed method on the Massachusetts road dataset are presented in Figure 17. The figure shows, in order, the original remote sensing images, the reference (ground truth) road masks, and the segmentation outputs obtained by the proposed method. The visual comparison demonstrates that the model can detect main road networks and minor road connections with high accuracy. In particular, the preservation of road continuity, the correct segmentation of intersections and junctions, and the significant suppression of background-induced false positives clearly demonstrate the prediction performance of the proposed approach. The obtained qualitative results confirm that the proposed method can produce consistent and reliable segmentation outputs even in remote sensing images with complex urban structures.
Figure 17.
Qualitative prediction results on the Massachusetts road dataset.
Table 7 reports the quantitative comparison of all models on the road dataset in terms of means and standard deviations of multiple evaluation metrics. The proposed method achieves the best performance across all major metrics, including Accuracy (0.930), dice (0.870), and IoU (0.778), indicating a clear improvement in segmentation accuracy and region overlap compared to the competing approaches. In addition, the proposed model attains the highest Recall value (0.874), demonstrating its strong ability to correctly detect road pixels. The proposed method also achieves the highest Precision (0.870), Specificity (0.948), and ROC (0.978) scores among all compared models, confirming its superior discrimination capability between road and background classes and its balanced error behavior. Furthermore, the proposed approach yields the lowest mean Loss value (0.149) together with a small standard deviation (0.012), indicating a more stable and well-optimized learning process. Overall, the results presented in Table 7 demonstrate that the proposed method provides superior accuracy, segmentation quality, and robustness on the road dataset compared to the other evaluated architectures.
Table 7.
Comparative Performance Analysis of Segmentation Models on the Massachusetts Road Dataset.
4.4. Ablation Study
In this study, an ablation study was conducted to examine the effect of the Batch Normalization and Skip Connection components used in the proposed architecture on segmentation performance. Accordingly, three separate configurations (A, B, and C) containing different combinations of these components were designed, and the details of these configurations are presented in Table 8. The results obtained were evaluated comparatively with the proposed full model, which includes both components. The evaluations were performed on the COVID-19 CT, retinal vessel (DRIVE), and Massachusetts road datasets, and the contribution of the model components was analyzed through multiple performance metrics.
Table 8.
Ablation configurations used in the experiments.
The ablation results presented in Table 9 clearly demonstrate the contribution of the Batch Normalization and Skip Connection components used in the proposed architecture to performance. Findings obtained on three different datasets (MedSeg, DRIVE and Massachusetts) reveal that the combined use of these components is critical for segmentation performance. In the MedSeg dataset, while Model A produced higher dice and IoU values compared to Models B and C, it did not reach the full model level. Similarly, in the DRIVE and Massachusetts datasets, Model A yielded the best ablation performance, while segmentation accuracy gradually decreased in Models B and especially C. The increase in Loss values from Model A to Model C indicates that removing architectural components negatively impacted learning stability. Overall, the findings in Table 9 confirm that Skip Connection enhances spatial information transfer, while Batch Normalization improves training stability; however, the combined use of both components provides the highest performance in terms of accuracy, generalization, and stability.
Table 9.
Performance analysis and ablation study of the proposed method.
5. Discussion
Table 10 presents a comparative overview of segmentation approaches commonly used in the literature, considering criteria such as multi-level feature interaction, cross-level connections, architectural complexity, and generalizability to different domains. As seen in the table, the vast majority of existing studies either offer partial multi-scale representation or contain architectural designs specific to a single problem domain. In contrast, approaches that establish clear and systematic cross-connections throughout the encoder–decoder are quite limited in the literature. The proposed method distinguishes itself by integrating full multi-level feature interactions and explicit cross-level connections, which directly translates to its superior generalization across diverse datasets, including MedSeg, DRIVE, and Massachusetts road images.
Table 10.
Comparison of the proposed method with segmentation approaches in the literature in terms of architectural structure and generalization capability.
The architecture proposed in this study differs from many methods in the literature by addressing multi-level feature interaction through a design that enables direct information transfer across different resolution levels. This approach has yielded significant performance gains, particularly in datasets requiring the preservation of fine structures and geometric continuity. Experimental results confirm that the proposed method exhibits consistent and superior performance across diverse datasets. Notably, the dice score of 0.957 and ROC value of 0.996 achieved on the retinal DRIVE dataset (as seen in Table 6) demonstrate the architecture’s exceptional effectiveness in capturing fine, low-contrast vascular structures. Similarly, as illustrated in Figure 16, the model achieves a steady convergence on the COVID-19 CT dataset, with both training and validation loss values successfully declining to a level below 0.10 without any divergence. This stable learning curve proves the model’s robust representation capability and its resistance to overfitting even in complex medical imaging tasks. Furthermore, the results obtained on the Massachusetts road dataset confirm that the proposed architecture successfully generalizes to domains beyond medical imaging.
However, the proposed approach has certain limitations. The integration of explicit cross-level connections increases memory usage and computational cost compared to vanilla U-Net structures. Although this complexity remains favorable when compared to multi-stage or transformer-based architectures—as highlighted in Table 10—it requires consideration in hardware-constrained environments. Additionally, while performance is consistent across datasets, the model’s reliance on data augmentation for very small-scale datasets warrants further investigation. Overall, this study demonstrates that the proposed architecture, with its balanced complexity and high cross-domain generalizability, stands as a robust alternative to existing state-of-the-art methods.
6. Conclusions
In this study, a novel deep learning–based segmentation architecture derived from the classical U-Net and enriched with multi-level and cross-connections has been proposed. By establishing multiple information flows between encoder and decoder stages, the proposed architecture is able to simultaneously exploit low-level spatial details and high-level semantic representations.
Extensive experiments conducted on three different application domains, namely COVID-19 lesion segmentation, retinal vessel segmentation on the DRIVE dataset, and road scene segmentation, demonstrate that the proposed method consistently outperforms the classical U-Net and other state-of-the-art comparative models in terms of dice, IoU, and overall segmentation accuracy. In addition, the proposed architecture achieves a more balanced error behavior, as reflected by its simultaneously high precision, recall, and specificity values across all evaluated datasets.
The superior performance obtained on fine and continuity-sensitive structures, such as retinal vessels and road networks, highlights the effectiveness of the proposed multi-level cross-connection mechanism in preserving structural continuity and improving region overlap. Moreover, the lower training loss and smaller performance variations observed in the experimental results indicate a more stable and well-optimized learning process.
Overall, the results confirm that enhancing U-Net-based architectures with multi-level and cross-scale information interaction significantly improves segmentation performance and robustness. The proposed architecture can serve as a strong baseline for a wide range of medical image analysis and remote sensing applications. In future work, the model can be further extended by incorporating attention mechanisms and lightweight design strategies to improve computational efficiency and applicability in real-time or resource-constrained environments.
Author Contributions
Conceptualization, L.B. and A.Ç.; methodology, C.B.; software, L.B.; validation, C.B., L.B. and A.Ç.; formal analysis, L.B.; investigation, C.B.; resources, A.Ç.; data curation, L.B.; writing—original draft preparation, C.B.; writing—review and editing, L.B. and C.B.; visualization, A.Ç.; supervision, C.B.; project administration, L.B. All authors have read and agreed to the published version of the manuscript.
Funding
This research received no external funding.
Institutional Review Board Statement
Not applicable.
Informed Consent Statement
Not applicable.
Data Availability Statement
The original contributions presented in this study are included in the article. Further inquiries can be directed to the corresponding author.
Acknowledgments
Generative AI tools were used in a limited manner to improve language quality (grammar, spelling, and clarity) of the manuscript. No scientific content, data analysis, results, or interpretations were generated by GenAI. All ideas, analyses, and conclusions are solely the responsibility of the authors.
Conflicts of Interest
The authors declare no conflicts of interest.
Abbreviations
The following abbreviations are used in this manuscript:
| Acc | Accuracy |
| BCE | Binary Cross-Entropy |
| CNN | Convolutional Neural Network |
| CT | Computed Tomography |
| DCB | Dilated Convolutional Block |
| DSC | Dice Similarity Coefficient |
| KNN | k-Nearest Neighbor |
| MQA | Multi-Query Attention |
| NPV | Negative Predictive Value |
| OSM | OpenStreetMap |
| PCS | Pixel Connectivity Structure |
| PPV | Positive Predictive Value |
| SaAU | Scale Attention Unit |
| Sen | Sensitivity |
| SpAU | Spatial Attention Unit |
| Spe | Specificity |
| SVM | Support Vector Machines |
| XAI | Explainable AI |
References
- Minaee, S.; Boykov, Y.; Porikli, F.; Plaza, A.; Kehtarnavaz, N.; Terzopoulos, D. Image Segmentation Using Deep Learning: A Survey. IEEE Trans. Pattern Anal. Mach. Intell. 2022, 44, 3523–3542. [Google Scholar] [CrossRef] [Scilit] [PubMed]
- Pal, N.R.; Pal, S.K. A review on image segmentation techniques. Pattern Recognit. 1993, 26, 1277–1294. [Google Scholar] [CrossRef] [Scilit]
- Yu, Y.; Wang, C.; Fu, Q.; Kou, R.; Huang, F.; Yang, B.; Yang, T.; Gao, M. Techniques and Challenges of Image Segmentation: A Review. Electronics 2023, 12, 1199. [Google Scholar] [CrossRef] [Scilit]
- Badrinarayanan, V.; Kendall, A.; Cipolla, R. Segnet: A deep convolutional encoder-decoder architecture for image segmentation. IEEE Trans. Pattern Anal. Mach. Intell. 2017, 39, 2481–2495. [Google Scholar] [CrossRef] [Scilit] [PubMed]
- Ronneberger, O.; Fischer, P.; Brox, T. U-Net: Convolutional Networks for Biomedical Image Segmentation. In International Conference on Medical Image Computing and Computer-Assisted Intervention; Springer: Cham, Switzerland, 2015. [Google Scholar]
- Milletari, F.; Navab, N.; Ahmadi, S.-A. V-Net: Fully Convolutional Neural Networks for Volumetric Medical Image Segmentation. In Proceedings of the 2016 Fourth International Conference on 3D Vision (3DV), Stanford, CA, USA, 25–28 October 2016. [Google Scholar]
- Zhang, Z.; Liu, Q.; Wang, Y. Road Extraction by Deep Residual U-Net. IEEE Geosci. Remote Sens. Lett. 2018, 15, 749–753. [Google Scholar] [CrossRef] [Scilit]
- Zhou, Z.; Siddiquee, M.M.R.; Tajbakhsh, N.; Liang, J. UNet++: A Nested U-Net Architecture for Medical Image Segmentation. In International Workshop on Deep Learning in Medical Image Analysis; Springer: Cham, Switzerland, 2018; Volume 11045, pp. 3–11. [Google Scholar] [CrossRef] [Scilit]
- Chen, L.-C.; Papandreou, G.; Kokkinos, I.; Murphy, K.; Yuille, A.L. DeepLab: Semantic Image Segmentation with Deep Convolutional Nets, Atrous Convolution, and Fully Connected CRFs. IEEE Trans. Pattern Anal. Mach. Intell. 2018, 40, 834–848. [Google Scholar] [CrossRef] [Scilit]
- Alsenan, A.; Ben Youssef, B.; Alhichri, H.S. CoviSwin: A Deep Vision Transformer for Automatic Segmentation of COVID-19 CT Scans. Bioengineering 2025, 12, 1227. [Google Scholar] [CrossRef] [Scilit] [PubMed]
- Suri, J.S.; Agarwal, S.; Chabert, G.L.; Carriero, A.; Paschè, A.; Danna, P.S.C.; Saba, L.; Mehmedović, A.; Faa, G.; Singh, I.M.; et al. COVLIAS 1.0Lesion vs. MedSeg: An Artificial Intelligence Framework for Automated Lesion Segmentation in COVID-19 Lung Computed Tomography Scans. Diagnostics 2022, 12, 1283. [Google Scholar] [CrossRef] [Scilit]
- Yang, Y.; Zhang, L.; Ren, L.; Wang, X. MMViT-Seg: A lightweight transformer and CNN fusion network for COVID-19 segmentation. Comput. Methods Programs Biomed. 2023, 230, 107348. [Google Scholar] [CrossRef] [Scilit]
- Bakheet, S.; Youssef, R.; Mofaddel, M.H.; Hassan, M.; Alshehri, A. Automated segmentation of COVID-19 lesions in CT scans using attention U-net with hybrid loss functions. Sci. Rep. 2026, 16, 1551. [Google Scholar] [CrossRef] [Scilit]
- Bhimavarapu, U. Retina Blood Vessels Segmentation and Classification with the Multi-featured Approach. J. Imaging Inform. Med. 2025, 38, 520–533. [Google Scholar] [CrossRef] [Scilit]
- Saha Tchinda, B.; Tchiotsop, D.; Noubom, M.; Louis-Dorr, V.; Wolf, D. Retinal blood vessels segmentation using classical edge detection filters and the neural network. Inform. Med. Unlocked 2021, 23, 100521. [Google Scholar] [CrossRef] [Scilit]
- Rehman, A.; Harouni, M.; Karimi, M.; Saba, T.; Bahaj, S.A.; Awan, M.J. Microscopic retinal blood vessels detection and segmentation using support vector machine and K-nearest neighbors. Microsc. Res. Tech. 2022, 85, 1899–1914. [Google Scholar] [CrossRef] [Scilit] [PubMed]
- Gargari, M.S.; Seyedi, M.H.; Alilou, M. Segmentation of Retinal Blood Vessels Using U-Net++ Architecture and Disease Prediction. Electronics 2022, 11, 3516. [Google Scholar] [CrossRef] [Scilit]
- Abdulsahib, A.A.; Mahmoud, M.A.; Aris, H.; Gunasekaran, S.S.; Mohammed, M.A. An Automated Image Segmentation and Useful Feature Extraction Algorithm for Retinal Blood Vessels in Fundus Images. Electronics 2022, 11, 1295. [Google Scholar] [CrossRef] [Scilit]
- Fakhouri, H.N.; Alawadi, S.; Awaysheh, F.M.; Alkhabbas, F.; Zraqou, J. A cognitive deep learning approach for medical image processing. Sci. Rep. 2024, 14, 4539. [Google Scholar] [CrossRef] [Scilit]
- Yuan, G.; Li, J.; Liu, X.; Yang, Z. Weakly supervised road network extraction for remote sensing image based scribble annotation and adversarial learning. J. King Saud Univ.—Comput. Inf. Sci. 2022, 34, 7184–7199. [Google Scholar] [CrossRef] [Scilit]
- Pan, D.; Zhang, M.; Zhang, B. A Generic FCN-Based Approach for the Road-Network Extraction from VHR Remote Sensing Images—Using OpenStreetMap as Benchmarks. IEEE J. Sel. Top. Appl. Earth Obs. Remote Sens. 2021, 14, 2662–2673. [Google Scholar] [CrossRef] [Scilit]
- Khan, M.J.; Singh, P.P. Advanced road extraction using CNN-based U-Net model and satellite imagery. e-Prime—Adv. Electr. Eng. Electron. Energy 2023, 5, 100244. [Google Scholar] [CrossRef] [Scilit]
- Khan, S.D.; Alarabi, L.; Basalamah, S. DSMSA-Net: Deep Spatial and Multi-scale Attention Network for Road Extraction in High Spatial Resolution Satellite Images. Arab. J. Sci. Eng. 2023, 48, 1907–1920. [Google Scholar] [CrossRef] [Scilit]
- Tao, J.; Chen, Z.; Sun, Z.; Guo, H.; Leng, B.; Yu, Z.; Wang, Y.; He, Z.; Lei, X.; Yang, J. Seg-Road: A Segmentation Network for Road Extraction Based on Transformer and CNN with Connectivity Structures. Remote Sens. 2023, 15, 1602. [Google Scholar] [CrossRef] [Scilit]
- Zhang, R.; Zhu, W.; Li, Y.; Song, T.; Li, Z.; Yang, W.; Yang, L.; Zhou, T.; Xu, X. D-FusionNet: Road extraction from remote sensing images using dilated convolutional block. GIScience Remote Sens. 2023, 60, 2270806. [Google Scholar] [CrossRef] [Scilit]
- Medical Segmentation COVID-19. Medical Segmentation 2025. Available online: https://medicalsegmentation.com/covid19/ (accessed on 5 March 2025).
- Staal, J.; Abràmoff, M.D.; Niemeijer, M.; Viergever, M.A.; van Ginneken, B. DRIVE: Digital Retinal Images for Vessel Extraction. 2004. Available online: https://www.kaggle.com/datasets/andrewmvd/drive-digital-retinal-images-for-vessel-extraction (accessed on 1 March 2026).
- Mnih, V. Machine Learning for Aerial Image Labeling; University of Toronto: Toronto, ON, Canada, 2013. [Google Scholar]
- Kong, L.; Cheng, J. Classification and detection of COVID-19 X-Ray images based on DenseNet and VGG16 feature fusion. Biomed. Signal Process. Control 2022, 77, 103772. [Google Scholar] [CrossRef] [Scilit] [PubMed]

Disclaimer/Publisher’s Note: The statements, opinions and data contained in all publications are solely those of the individual author(s) and contributor(s) and not of MDPI and/or the editor(s). MDPI and/or the editor(s) disclaim responsibility for any injury to people or property resulting from any ideas, methods, instructions or products referred to in the content. |
© 2026 by the authors. Licensee MDPI, Basel, Switzerland. This article is an open access article distributed under the terms and conditions of the Creative Commons Attribution (CC BY) license.