Abstract
One of the most critical challenges in gas turbine design is preventing the ingestion of hot mainstream gases into the disk space between the stator and rotor disks. Rim seals and superposed sealant flows are commonly used to mitigate the risk of component overheating. However, leakage paths inevitably form between the mating interfaces of adjacent components due to the complex architecture of the engine. Therefore, the interaction between the different flows present within the disk space complicates the accurate determination of the optimal sealing flow quantity. For this reason, this study experimentally investigates fluid dynamics inside a stator–rotor cavity, with a particular focus on leakage flows. In particular, this work examines the impact of multiple parameters, including injection radius position, number of leakage holes, and injection angle, on the sealing effectiveness values measured on the stator side of the cavity through CO2 gas sampling measurements. By comparing the effectiveness values with the swirl measurements derived from static and total pressure readings, the development of flow structures and the impact of leakage injection on sealing performance were finally evaluated. The results indicate that leakage injection has a minimal effect on the sealing effectiveness above the injection point, but significantly improves the performance at a lower radius. Moreover, it was observed that for a given mass flow rate, using a lower number of holes results in worse sealing performance due to a higher jet momentum, which causes the leakage flow to penetrate through the cavity toward the rotor side. In the end, employing two distinct injection angles—both aligned with the rotor’s direction of rotation—showed no substantial impact on sealing effectiveness.
1. Introduction
Hot gas ingestion refers to the ingress of high-temperature gases into the turbine disk space, mitigated by purge air supplied through the Secondary Air System (SAS); while necessary for sealing and cooling, this extracted air reduces efficiency since it does not contribute to power generation. Insufficient purge flow risks overheating and component failure, while excessive flow causes mixing losses and reduced work output, negating gains from higher turbine inlet temperature (TIT) [1]. An accurate estimation of sealing air is necessary, as cooling effectiveness depends not only on geometry and flow rate but also on the complex interactions between the main hot gas, bore sealing air, and leakage air. In fact, leakage enters the cavity through gaps between engine components, altering the internal flow structure. Thermal and centrifugal stresses during turbine operation make its extent and impact on ingress difficult to predict. Among control strategies, stator injection of leakage flow appears promising, as it can enhance cavity cooling by optimizing the supply air system.
Over the years, many researchers have investigated the fluid dynamics of hot gas ingestion, aiming to clarify the complex interaction mechanisms that govern the exchange between mainstream and cavity flows. Owen et al. [2,3,4] identified externally induced (EI) ingress as a dominant mechanism, arising from non-axisymmetric pressure variations in the turbine annulus caused by vane–blade interactions. These pressure fields drive hot gas into the disk space while expelling sealing air. Ingestion can also occur in the absence of vane–blade interaction through rotationally induced (RI) ingress, where centrifugal forces establish a radial pressure gradient that entrains hot gases [5,6]; while EI ingress generally prevails under engine-representative conditions, RI ingress can become significant at off-design conditions, leading to combined ingress (CI) [7,8,9]. More recently, ingestion has been attributed to unsteady, large-scale flow structures rotating inside the rim seal, where this intrinsic unsteadiness governs the dominant mechanism driving hot gas ingress. Building on this understanding, Tang et al. [10] introduced a low-order model, the Ingress Wave Model (IWM), which interprets ingestion as the result of swirl velocity differences between the annulus and the wheel space, neglecting the contribution of disk pumping. By representing radial and circumferential velocities as sinusoidal functions, the IWM provides a simplified analytical solution of the continuity and inviscid momentum equations, and provides a practical tool for preliminary estimation of ingestion under a range of operating conditions.
Over the past two decades, researchers have systematically investigated how cavity geometry, cooling air supply, and purge flow influence sealing effectiveness. Early computational studies by Andreini et al. [11,12] demonstrated that the orientation of purge jets and the positioning of secondary air holes could significantly improve thermal management and reduce aerodynamic losses inside stator–rotor cavities. Building on this, Ong et al. [13] showed that adjusting hub coolant injection and swirl angles could enhance coolant distribution along the rotor hub and improve stage efficiency, although a portion of the flow remains entrained in secondary vortices. Subsequent studies revealed the complexity of purge flow interactions with cavity ingestion. Zlatinov et al. [14] highlighted that pre-swirling purge flow could both reduce losses and, paradoxically, increase hot gas ingress if synchronized with rotating pressure non-uniformities. Clark et al. [15,16] and Patinios et al. [17] confirmed experimentally that the number, radial location, and distribution of purge holes strongly affect sealing performance. Specifically, leakage flows may generate vortex-dominated flow regimes inside the cavity, leading to substantial reductions in sealing performance. The creation, intensity, and spatial distribution of these vortices are strongly influenced by the radial position and injection angle of the leakage flow [18]. More recent investigations have focused on mitigating ingestion through auxiliary sealing strategies. Zhang et al. [19], Wang et al. [20,21] Gai et al. [22], and Qiang et al. [23] demonstrated that high-radius auxiliary holes, when properly inclined, can redistribute sealing air, suppress Kelvin–Helmholtz instabilities, and improve flow uniformity in the rim seal zone, enhancing sealing effectiveness. Recent studies by Jackson [24] and Choi et al. [25] highlighted that the swirl of cavity flows can have a greater impact on sealing effectiveness than the pressure difference between the mainstream and the cavity. Their findings show that leakage flow, purge air, and cavity vortices interact in complex ways, making the control of swirl essential for preventing hot gas ingestion.
This literature review highlights numerous prior studies examining various aspects of sealing effectiveness in turbine cavities. It is well accepted that primary sealing air introduced from the bore (bottom of the cavity) positively contributes to sealing performance. However, the role of auxiliary sealing air, typically associated with leakage flows, remains ambiguous, and further exploration is necessary. In particular, the influence of leakage flow configurations, such as the number, location, and inclination of injection holes, is not fully understood in the current literature. The aim of this study is to experimentally investigate the fluid dynamics inside a stator–rotor cavity, with particular focus on the influence of purge-flow delivery methods. Experiments were conducted on a non-reactive, low-pressure, single-stage Rotating Cavity Rig to evaluate sealing effectiveness across different conditions.
2. Experimental Facility
The present study has been performed on the single-stage Rotating Cavity Rig, designed at the THT LAB by Orsini et al. [26]. This section provides a brief overview of the test facility and the instrumentation used to perform the measurements presented in this study. Special attention is given to the leakage flow setup, described in the final part of the section, which was employed for the first time to experimentally investigate the effects of injection radius, injection angle, and number of holes on sealing effectiveness, measured on the stator side of the wheel space.
2.1. Test Rig Configuration and Operating Conditions
The single-stage test rig comprises a stationary disk with 44 integrated vanes and a rotating disk with 66 integrated blades; each disk is equipped with interchangeable cover plates to simulate different rotor/stator geometries. The test rig follows the typical hot gas ingestion setup commonly found in the literature, enabling fundamental sealing tests under cold, near-atmospheric conditions. Operating with non-reactive flow and slight overpressure, it avoids the complexity and cost of high-temperature testing. To better replicate real-engine thermal gradients, researchers often utilize the Density Ratio (DR); current literature indicates that matching engine-realistic DR (≈1.5) values typically increases the required amount of purge flow [27,28]. In addition, to study hot gas ingestion phenomena, the test bench is equipped with instruments to measure temperature, static and total pressure, and CO2 concentration.
- As illustrated by the cross-sectional view in Figure 1, the mainstream flow passes the vanes and blades in the annulus path, creating pressure asymmetries. In addition to the main air mass flow in the turbine annulus, there are smaller secondary air flows known as bore flow and leakage flow. Bore flow enters from the center/axis of the stator disk and then moves radially outward through the wheel space to pressurize it.
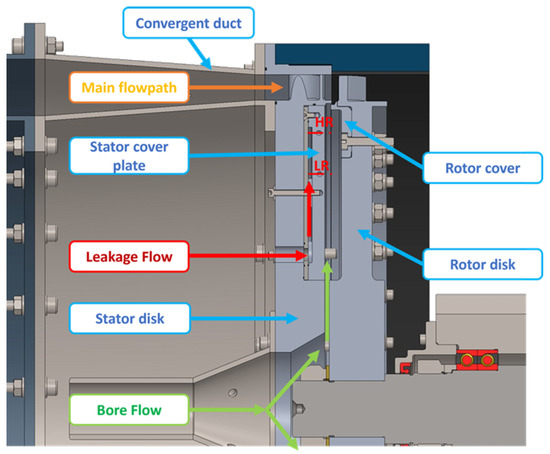 Figure 1. Cross-section of the Rotating Cavity Rig.
 - The leakage flow enters a plenum created inside the stator cover plate, where it becomes uniform and maintains constant pressure. From the plenum, the flow discharges through injection holes located under the rim seal into the wheel space to pressurize it. This flow simulates leakage paths that naturally occur throughout the engine’s architecture.
The investigated rim seal, referred to as M1A (shown in Figure 2), consists of a single radial geometry characterized by a small radial gap () and an axial overlap (), which has been already investigated in previous works [26,29,30].
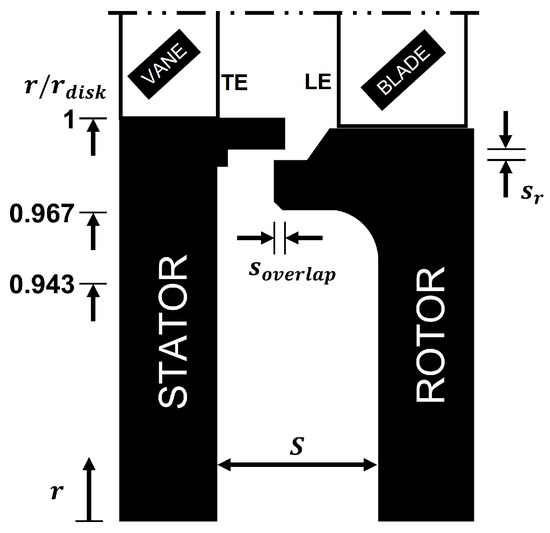
Figure 2.
M1A rim seal configuration used in this study.
The operating conditions of the test rig are defined by imposing the value of the flow coefficient at the design value of 0.33. This parameter is defined as the ratio between the axial Reynolds number in the annulus () and the rotational Reynolds number ():
These Reynolds numbers are, respectively, defined as:
Here, denotes the main flowpath fluid density, is the axial velocity component of the main flow, represents the local radius on the rotating disk surface, is the angular velocity of the rotor, and is the dynamic viscosity of the fluid. As previously shown in Figure 1, the purge flow is introduced into the cavity both from the center of stator disk (bore flow) and from a discrete number of holes (leakage flow). The total amount of injected purge flow is expressed through , indicating the sum of the non-dimensional flow rate from the bore and from the leakage :
where non-dimensional sealing parameters are defined as
and the seal clearance ratio is defined as the ratio between the radial gap and the disk radius:
Different values of sealing mass flow () have been employed to evaluate the sealing performance of the rim seal under different operating and geometrical conditions. Finally, by imposing the rotational speed of the rotor disk, one value of rotational Reynolds number has been set . For a more detailed description of the test rig, its features, and the commissioning phase, readers may refer to previous works [26,31].
2.2. Experimental Setup
The experimental setup used to evaluate the sealing performance of the current configuration includes various instruments installed on the stator side of the cavity. As shown in Figure 3, the cavity is equipped with 13 static pressure taps positioned between and ( FS), and 7 total pressure probes aligned with alternating static pressure taps ( FS). The measurements of static pressure and total pressure were then combined together to obtain the radial distribution of swirl ratio:
which is defined as the ratio between the tangential velocity of the flow, , and the angular velocity of the rotor, [32]. The literature shows that ingestion of highly swirled flow increases , explaining the radial rise in swirl near the rim seal entrance. Conversely, higher reduces ingress, leading to a progressive decrease in with increasing purge flow. Additionally, 3 T-type thermocouples, with an uncertainty of 0.5 °C (FS), and 11 concentration taps, placed between and , have been installed inside the wheel space.
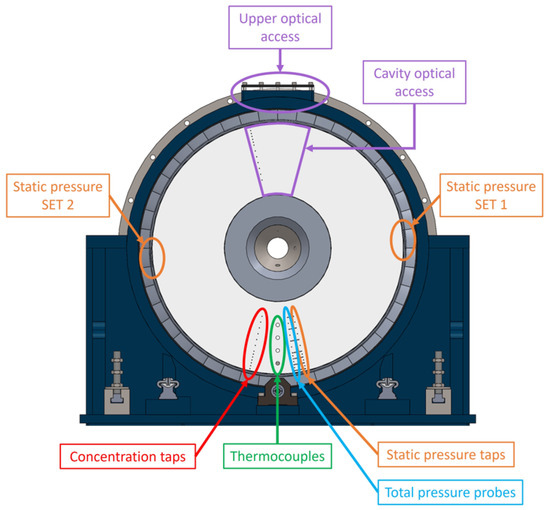
Figure 3.
Main instrumentation placed in the test section.
The acquisition setup enables simultaneous gas sampling at two radial positions using two distributors equipped with multiple valves. To perform this type of measurement, a small amount of CO2 was introduced into the purge, and an infrared gas analyzer (X-STREAM XEGP, Emerson Electric Co., Hasselroth, Germany) was used, which operates optimally within a flow range of 0.2 to 1.5 L/min. The sealing effectiveness can be determined by applying the following definition:
where , , and , respectively, represent the concentration of CO2 at a given radial position on the stator surface, in the annulus and at the sealant flow inlet. The cavity can be considered fully sealed when . Two independent lines were used to control the purge flow, which was separated into leakage and bore flow paths. Both mass flows were measured using a 25 mm calibrated orifice plate.
2.3. Investigated Geometries
The investigated configurations tested in this work are reported in Table 1. MS1 stands for the case with an injection angle of 60 degrees, while MS2 is the case with a 45-degree angle of injection. All injection angles were co-swirled, inclined in the direction of rotor rotation to align the injected flow’s angular momentum with that of the rotating flow field.

Table 1.
Summary of disk configurations. © 2026 Baker Hughes Company—all rights reserved.
For the MS1 disk configuration, several hole number combinations (44, 22, and 8 holes) were tested. During this test campaign, various mass flow rate distributions between bore supply and leakage injection were evaluated. For the sake of brevity, this paper reports results for two cases: 100% bore supply and 0% bore supply. In the 100% bore configuration, the entire cooling mass flow is supplied through the central bore, aligned with the axis of the stator disk, representing the typical baseline case. In contrast, in the 0% bore configuration, the entire cooling flow is supplied exclusively through the leakage holes located on the stator disk. For the leakage injection scenario, the influence of varying injection radii was also investigated. A specific notation system was adopted to distinguish between the different injection radii, as described below:
- HR (Higher Radius): the flow is delivered from holes located under the rim seal zone at = 0.893.
- LR (Lower Radius): the flow is delivered from holes located in the rim cavity zone at = 0.760.
The detailed sketch of the baseline configuration, which will be investigated, is presented in Figure 4. Here, the position of the vanes and blades has been indicated in order to clearly visualize the distance between the TE and the LE in relation to the characteristic dimensions of the investigated geometry. The image shows both the bore flow supply and the leakage flow, along with the two possible injection radii for the leakage. Additionally, Figure 4 includes the radial positions of the two outermost concentration taps available in the current test rig, = 0.943 (triangle) and = 0.967 (circle). These concentration taps will be used to conduct multiple gas sampling measurements, allowing the comparison of the behavior of – curves. In the results figures, the two leakage injection radii are marked using green ticks to denote open holes and red crosses to indicate closed holes.
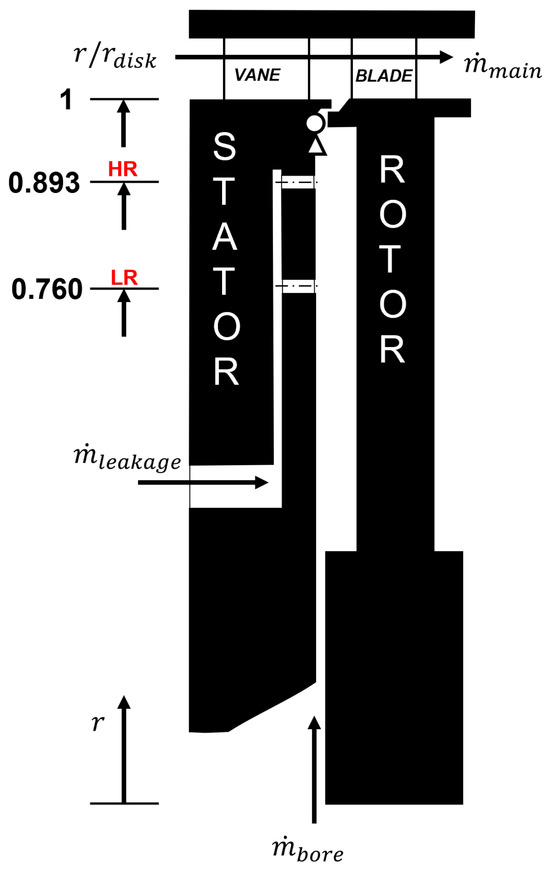
Figure 4.
Sketch of the baseline configuration, © 2026 Baker Hughes Company—all rights reserved.
To summarize, for each test carried out, the notation adopted will be as follows:
- 1.
- Disk designation (MS1 or MS2);
- 2.
- Configuration in terms of number of holes (44, 22, 8);
- 3.
- Injection radius (HR or LR);
2.4. Measurement Uncertainty
Many of the physical quantities of interest in this work were determined indirectly by directly measuring other quantities. To determine the uncertainty of the indirectly obtained quantities, the theory of uncertainty propagation developed by Kline and McClintock [33] was applied. Using the uncertainty propagation formula, the uncertainties for these parameters at the rig’s nominal operating conditions are shown in Table 2, with a ±95% confidence level. The table demonstrates that the parameters exhibit notably low uncertainties.
Table 2.
Measurement uncertainties of the main parameters used in this study, © 2026 Baker Hughes Company—all rights reserved.
3. Results
3.1. Reference Tests
During the references tests, flow was supplied from the bore only, and different curves were obtained. It is important to highlight that all the values of reported in this chapter have been normalized by using a reference value indicated by the subscript . As represented in Figure 5 the effectiveness values were simultaneously recorded at two different radial positions, = 0.943 (triangles) and = 0.967 (circles). Results were fitted using the Ingress Wave Model [10]. The derivation of this model leads to a formulation that expresses the sealing flow rate () as a function of the sealing effectiveness (), incorporating an empirical constant () that characterizes the dimensionless amplitude of the radial flux variation.
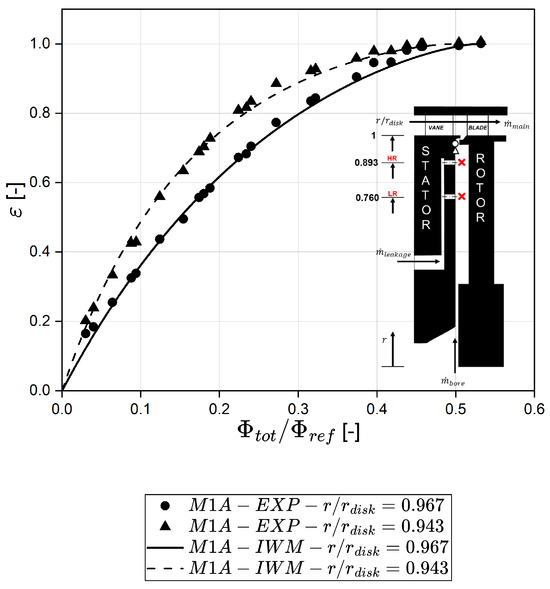
Figure 5.
Comparison between – curves obtained at = 0.943 and = 0.967 for the MS1 baseline with bore flow only, © 2026 Baker Hughes Company—all rights reserved.
As can be noticed, the resulting curves obtained at both = 0.943 (dashed line) and = 0.967 (continuous line), fitted with the Ingress Wave Model, appear to be in excellent agreement with the measured data.
Consequently, the radial variation in effectiveness on the stator surface has been further investigated by conducting dedicated tests to obtain the radial profiles of reported in Figure 6. The following two values of non-dimensional flow rate were selected:
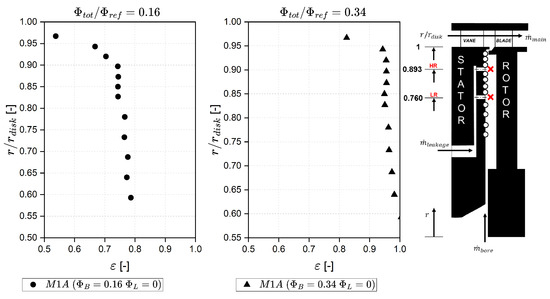
Figure 6.
Comparison between radial profiles of obtained for two values of for the MS1 baseline configuration, © 2026 Baker Hughes Company—all rights reserved.
- (at = 0.967).
- (at = 0.967).
These values of were chosen in order to obtain the corresponding values of at higher radius, thus allowing the comparison of the radial variation in effectiveness under different sealing conditions. As can be noticed, for each tested value of , the radial effectiveness remains approximately constant up to . However, the three concentration taps located at higher radii recorded a great decrease in effectiveness, which can be attributed to the ingestion of air from the external annulus flow.
As expected, this effect is more evident at lower values of non-dimensional sealing flow supplied to the system due to the resulting lower pressurization of the wheel space, which leads to increased ingress of air into the cavity. The obtained radial profiles confirm that the effectiveness exhibits variations along the radial direction, and therefore, it does not appear to be perfectly constant.
3.2. Effect of the Injection Radius
After characterizing the MS1 baseline (MS1 Ref) configuration under design conditions, several – curves were obtained for various test rig configurations. This enabled a comparison of the sealing performance of the rim seal between the lower and higher leakage injection point. In particular, two configurations have been tested: MS1-44-LR for the lower injection radius at = 0.760, and MS1-44-HR for the higher injection radius at = 0.893. Both configuration were tested in the 44 hole setup. The resulting – curves for the investigated radial positions, = 0.967 (circles) and = 0.943 (triangles), are depicted in Figure 7a and Figure 7b, respectively. Tests were conducted without flow from the bore (0% bore), varying the amount of non-dimensional leakage flow. The reference condition has been highlighted in red in order to distinguish it from the high-radius-injection conditions, which are instead indicated in black, while low-radius-injection conditions are in blue. It should be noted that while the experimental setup provides high measurement accuracy, certain configurations exhibit closely aligned sealing effectiveness curves. In these instances, variations in are interpreted with caution, as they may approach the experimental uncertainty margin. To ensure the reliability of these trends, the global results were cross-referenced with radial effectiveness profiles. The consistency between the integrated effectiveness values and the radial distributions confirms that despite the proximity of some data sets, the reported comparative trends remain physically representative of the investigated geometries. A detailed analysis of the obtained – curves indicates that at lower values of , there is a slight increase in for the high-radius-injection (HR) case compared to the reference case, while the low injection radii do not cause any improvement in terms of , and the curve follows the reference one.
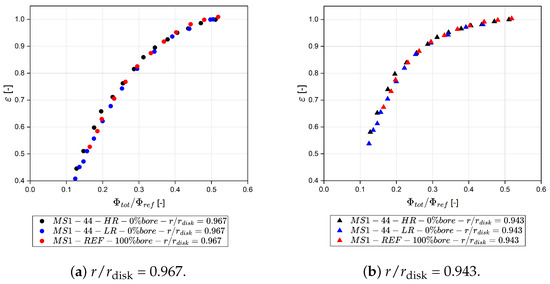
Figure 7.
Comparison of – curves between the MS1-REF baseline configuration and the MS1-44-HR and MS1-44-LR configurations at the two measurements radius, © 2026 Baker Hughes Company—all rights reserved.
This behavior is in accordance with previous studies [17], where the use of leakage injection at upper radii improved the for very low values of . However, in the conducted tests, this behavior is not consistently true across the entire investigated range of non-dimensional sealing parameters. In fact, after a certain degree of , the difference between the three curves (HR-LR-REF) diminished for both the investigated radial positions. When = 0% ( = 100%), injecting through 44 holes at lower radii (LR) is almost equivalent to the typical cooling supply method (100% bore), while injecting at higher radii (HR) might slightly improve the situation only at very low .
In order to highlight the effect of the injection radius on sealing performance inside the cavity region, additional measuring points located below the injection hole (diamond at = 0.873 and square at = 0.850) are reported in Figure 8. As can be noticed, measurements taken below the injection hole, when compared to the 100% bore supply at the same measurement point, demonstrate a significant impact of the leakage flow on the sealing performance of the rim seal. While this does not directly impact rim seal performance at the most critical point ( = 0.967), it introduces an additional blockage that restricts the migration of ingestion toward lower radii below the injection hole. Moreover there is an inflection in at . This inflection can be attributed to the formation of a toroidal vortex in the outer part of the cavity when the momentum of the leakage flow increases. Notably, unlike previous cases, the highest values are observed near the injection hole at the measurement radius = 0.873, rather than deeper in the cavity. This behavior aligns with the flow structure described by Patinios et al. [17] and Darby et al. [18]. The radial variation in effectiveness on the stator surface has been investigated by conducting dedicated tests to obtain the radial profiles of reported in Figure 9. To investigate the radial variation in effectiveness under different sealing conditions, two values of were selected: 0.16 (low flow rate) and 0.34 (high flow rate). These profiles show that for the lower value of non-dimensional purge flow, the effectiveness is influenced by the injection radius. For the LR injection, an increase in is found below the injection zone with respect to the bore only (100% Bore) flow supply method. In the case of HR injection, there is a noticeable increase in as well. For both cases, the improvement occurs near the respective injection hole and then extends throughout the cavity to the measurement point located at the lowest radius. It has been hypothesized that for lower non-dimensional flow rate, the leakage flow remains attached to the stator wall, improving the effectiveness. Meanwhile, for the higher value of dimensional purge flow, radial effectiveness appears independent of the leakage injection radius, as the cavity is approximately at sealing conditions. Between HR and LR injection, in the region from to , a marked difference in is observed. The effectiveness exhibits variations along the radial direction for both cases, and therefore, it does not appear to be perfectly constant. Additionally, although less pronounced, a slight improvement in near the rim seal region is observed for high-radius injection, but only at low values of . This confirms the slight increase seen in Figure 7 for the high-radius (HR) case at lower values, consistent across both measured radii ( = 0.967–0.943).
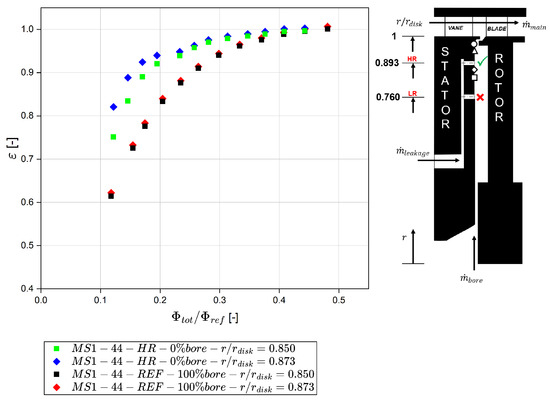
Figure 8.
– curves for the MS1-44-HR configuration with leakage flow only, evaluated at two radial positions under the injection radius, © 2026 Baker Hughes Company—all rights reserved.
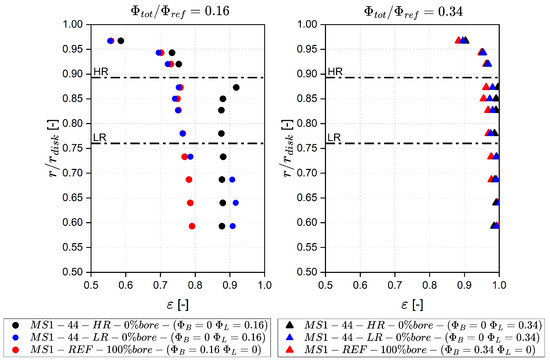
Figure 9.
Comparison of radial profiles of obtained for two values of between MS1-44-LR, MS1-44-HR, and MS1-REF baseline configuration, © 2026 Baker Hughes Company—all rights reserved.
The radial profiles of swirl ratio () are reported in Figure 10. Values of = 0.16, 0.30, 0.50 were selected in order to obtain the corresponding values of at low, medium, and high sealing flow rates. As can be noticed, for each tested value of non-dimensional purge flow, the swirl ratio of the MS1-44-HR or LR configuration diverges from the MS1 REF case. The most significant differences between the two configurations (44 HR and 44 LR) are observed near the injection radius. In these regions, there is an increase in swirl compared to the reference case. This growth extends to lower radii and is attributed to the local increase in tangential velocity induced by injection through co-swirled holes. This phenomenon becomes more pronounced with the increase in leakage flow momentum. In the high-sealing-flow-rate case, a noticeable difference in at larger radii is observed between the HR and LR configurations, with respect to the other two cases. This difference may be attributed to enhanced recirculation, which supplies flow to the rim seal region as a consequence of the increased momentum of the injected flow. The evaluation of this flow difference aligns with the results reported by Darby et al. [18].
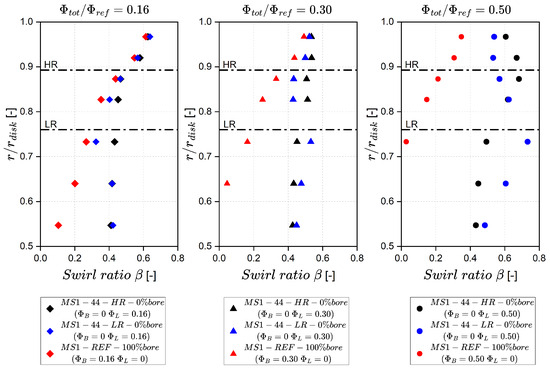
Figure 10.
Comparison of radial profiles of obtained for three values of between MS1-44-LR, MS1-44-HR, and MS1-REF baseline configuration, © 2026 Baker Hughes Company-All rights reserved.
3.3. Effect of the Number of Injection Holes
The previously reported tests revealed a slight improvement in for the high-radius-injection (HR) case, in particular for low non-dimensional purge flow values. According to these results, the higher radius injection configuration has been used to evaluate the effect of the number of holes and the injection angle. In this section, several – curves were obtained for various number of holes configurations. This enabled a comparison of the sealing performance of the rim seal between few (eight) and many leakage injection holes (forty-four). The resulting – curves for the investigated radial positions, = 0.967 (circles) and = 0.943 (triangles), are depicted in Figure 11a and Figure 11b, respectively. The reference condition has been highlighted in red in order to distinguish it from the 44-hole condition in black, 22-hole condition in blue, and 8-hole condition in green. The analysis of the – curves measured at indicates that the behavior does not vary significantly compared to the reference case. For higher non-dimensional purge flow values (), the 22-hole configuration performs worse across all the tested values. However, at the = 0.943 measuring point, the worst performance is observed with the eight-hole configuration, deteriorating across all values. The 22-hole configuration performs slightly worse than the reference, while the 44-hole configuration practically coincides with the baseline case. It is hypothesized that, as the measurement point approaches the HR injection radius (), the influence of the leakage flow increases. Moreover, in cases with a low number of holes, where the momentum per hole is high, the leakage flow entrains ingress flow into the cavity, thereby reducing effectiveness measured above the injection radius.
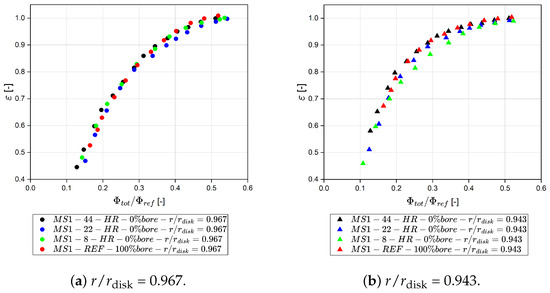
Figure 11.
Comparison of – curves for MS1-44-HR, MS1-22-HR, MS1-8-HR and MS1-REF baseline configurations, with leakage flow only. © 2026 Baker Hughes Company—all rights reserved.
The radial variation in effectiveness on the stator surface is reported in Figure 12. Two values of were selected: and . These profiles show that for both high and low value of , the radial effectiveness is affected by the number of the leakage holes. In particular, for a large number of holes (44, 22), increases below the injection zone respect to the reference case (red circles). These configurations allow for broader circumferential diffusion, with the same injected flow rate, resulting in better deeper in the cavity.
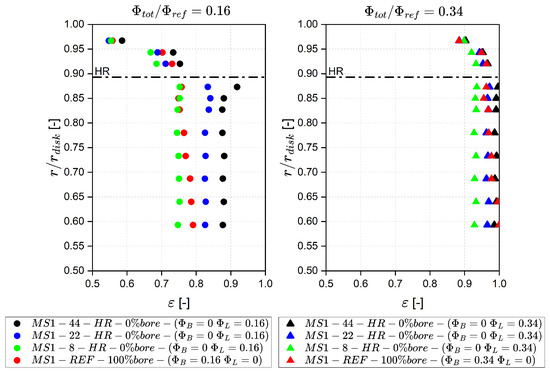
Figure 12.
Comparison of radial profiles of obtained for two values of between MS1-44-HR, MS1-22-HR, MS1-8-HR and MS1-REF baseline configuration. © 2026 Baker Hughes Company—all rights reserved.
For configurations with fewer injection holes (eight), the effectiveness decreases compared to the reference values. It is assumed that, as the number of holes decreases, the momentum per hole increases, causing the injected flow to bypass the stator boundary layer and impact the rotor disk surface, resulting in a lower concentration measurement on the stator disk. Conversely, effectiveness increases when the momentum per hole is lower, as observed in the 44-hole leakage supply case, where the flow remains attached to the stator wall. As expected, the effect becomes more pronounced at lower sealing flow rates, due to the reduced pressurization of the wheel space. It is important to highlight that the presence of jets with high momentum (8-hole configuration) would likely lead to an improvement in on the rotor disk. Finally, the radial variation in swirl ratio on the stator surface has been further investigated by conducting tests to obtain the radial profiles of reported in Figure 13.
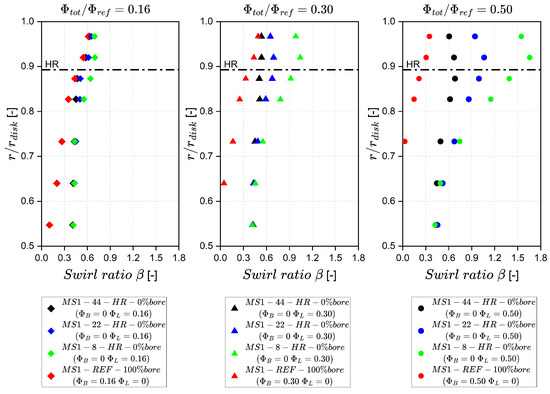
Figure 13.
Comparison between radial profiles of obtained for three values of between MS1-44-HR, MS1-22-HR, MS1-8-HR, and MS1-REF baseline configuration, © 2026 Baker Hughes Company—all rights reserved.
For all tested values of , the radial swirl ratio diverges from the MS1 REF case (red). As the number of holes decreases, the magnitude of the deviation from the baseline case increases. The most pronounced deviations among the 44-, 22-, and 8-hole configurations occur near the injection radius at high , where rises above unity. This increase extends to lower radii, and it is attributed to the rise in tangential velocity induced by injection through co-swirled holes. It should be noted that the observed increase in swirl is associated with a decrease in effectiveness. This is in contrast with the common literature, where effectiveness and , defined as the difference in swirl between the annulus and cavity (), are typically correlated. As decreases, the swirl levels in the annulus and cavity become more uniform, thereby enhancing effectiveness. In the present study, a possible explanation of this disagreement lies in the characteristic of leakage injection. In the case of discrete leakage flow injection, the swirl is influenced locally near the holes rather than globally. Consequently, the measured swirl values may be influenced by the proximity of the total pressure probes and static pressure taps to the leakage injection point. In conclusion, the tests conducted revealed marked improvements in for the 44-hole case, especially at low measurement radii.
3.4. Effect of the Injection Angle
The last result reported in this work is the injection angle effect. Figure 14 presents the investigated cases: MS1 with a 60-degree injection angle and MS2 with a 45-degree injection angle.
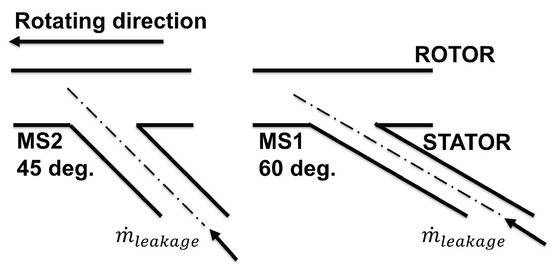
Figure 14.
Sketch of MS1 and MS2 geometries investigated, with angles defined with respect to the axial direction, © 2026 Baker Hughes Company—all rights reserved.
The following figures (Figure 15) highlight the sealing performances of the two investigated cases. The – curves for the = 0.967 measuring point are depicted in Figure 15a, while the radial variation in effectiveness on the stator surface for the lower value of is reported in Figure 15b. The 60-degree injection is highlighted in black in order to distinguish it from the 45-degree injection in blue.
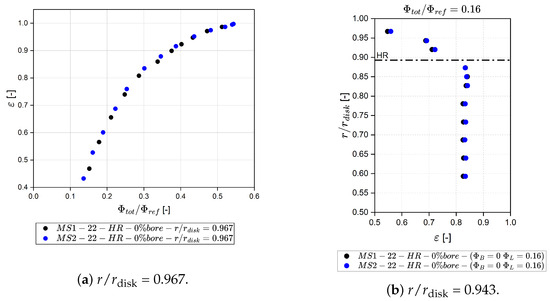
Figure 15.
Comparison of – and radial profiles of for MS1-22-HR and MS2-22-HR configurations, © 2026 Baker Hughes Company—all rights reserved.
A detailed analysis of the – curve in Figure 15a reveals that the injection angle does not influence the values. Moreover, the 60-degree curve follows the 45-degree curve perfectly. The radial variation in on the stator surface demonstrates that for lower values of , effectiveness inside the cavity is not influenced by the angle of leakage injection. For both 60-degree and 45-degree injections, remains constant despite variations in the injection angle. However, Figure 15b shows an increase in near the injection hole and extends throughout the cavity up to the measurement point located at the lowest radius. Hence, the obtained radial profiles confirm that the effectiveness exhibits variations below the point of injection for both cases.
4. Conclusions
The aim of this work was to experimentally investigate the impact of purge injection on rim seal performance. The employed setup aimed to assess the impact of different geometrical parameters, like the injection radius, number of holes, and injection angle on sealing performance. From the – curves, the radial profiles of and swirl ratio suggest that
- The injection radius play a primary role in hot gas ingestion, modifying the cavity flow structure inside the cavity. The radial profiles revealed an increase in effectiveness values in the radial direction, attributed to an additional vortex generated by leakage flow injection. This effect is more pronounced at lower non-dimensional flow values.
- Measurements below the injection hole reveal that leakage flow significantly affects rim seal performance, inhibiting the migration of ingestion toward lower radii and creating a buffer region where ingestion is locally constrained, although its effect at the upper measurement point ( = 0.967) remains minimal. An inflection in sealing effectiveness at is linked to the formation of a toroidal vortex in the outer cavity region.
- Analysis using different numbers of injection holes showed that increasing the number of holes results in uniformly higher effectiveness values, distributed more evenly across the circumferential direction. In contrast, the eight-hole setup performed worse than the others, likely because the flow detaches from the stator and impinges on the rotor disk. This phenomenon has been attributed to the higher momentum of leakage injection.
- The impact of leakage injection angles has been evaluated by comparing inclined holes at 60 degrees (MS1) and 45 degrees (MS2), inclined in the direction of rotor rotation. It was found that effectiveness increases in the rim cavity region for both cases compared to the reference case; however, this improvement is independent of the injection angle.
In conclusion, the tests conducted show that leakage injection slightly influences the effectiveness values above the injection point but significantly affects values at points located below. This indicates that leakage influences sealing performance in the core of the cavity rather than at the rim seal. Therefore, the leakage injection effect can be exploited by using less expensive materials for the disk cavity, resulting in material cost savings during gas turbine development.
Author Contributions
Conceptualization, M.C., L.O., A.P., B.F. and A.B.; methodology, M.C., L.O., A.P. and A.B.; formal analysis, M.C., L.O., A.P. and A.B.; investigation, M.C., L.O., A.P. and A.B.; resources, B.F. and A.B.; data curation, M.C. and L.O.; writing—original draft preparation, M.C., L.O. and A.P.; supervision, B.F. and A.B.; project administration, B.F. and A.B.; funding acquisition, B.F. and A.B. All authors have read and agreed to the published version of the manuscript.
Funding
This research was co-funded by Baker Hughes.
Data Availability Statement
The datasets presented in this article is not publicly available and cannot be shared due to industrial confidentiality.
Acknowledgments
Baker Hughes is thankfully acknowledged for the possibility of publishing the results and for partially funding the research.
Conflicts of Interest
Alessio Bonini is an employee of Baker Hughes. The remaining authors declare that the research was conducted without any commercial or financial relationships that could be interpreted as a potential conflict of interest.
Abbreviations
The following abbreviations are used in this manuscript:
| Nomenclature | |
| Swirl ratio [–] | |
| Concentration effectiveness [–] | |
| Dynamic viscosity [Pa·s] | |
| Density [kg/m3] | |
| Non-dimensional sealing parameter [–] | |
| Empirical Constant for IWM [–] | |
| Minimum value of to prevent ingress [–] | |
| Angular velocity of rotation [rad/s] | |
| A | Leakage injection area [mm2] |
| C | Concentration of gas [–] |
| Axial velocity component [m/s] | |
| Flow coefficient [–] | |
| d | Hole diameter [mm] |
| Seal clearance ratio [–] | |
| Mass flow rate [kg/s] | |
| r | Radius [mm] |
| Characteristic radius of the seal [mm] | |
| Axial Reynolds number in annulus [–] | |
| Rotational Reynolds number [–] | |
| Axial seal clearance [mm] | |
| Radial seal clearance [mm] | |
| Seal overlap [mm] | |
| S | Axial width between stator and rotor [mm] |
| Tangential velocity component [m/s] | |
| Subscripts | |
| Annulus | |
| Average value | |
| Bore flow | |
| Design condition | |
| Refer to the EI regime | |
| Leakage flow | |
| Maximum | |
| Minimum | |
| r | Radial direction |
| Reference value | |
| R | Rotor side |
| Refer to the RI regime | |
| Stator side | |
| Sum of bore and leakage flow | |
| 0 | Location at sealant flow inlet |
| Acronyms | |
| CFD | Computational Fluid Dynamics |
| CI | Combined Ingress |
| CO2 | Carbon dioxide |
| EI | Externally Induced |
| EXP | Experimental results |
| HR | Higher Injection Radius |
| IWM | Ingress Wave Model |
| LR | Lower Injection Radius |
| PSP | Pressure-Sensitive Paint |
| RI | Rotationally Induced |
| SAS | Secondary Air Systems |
| THT Lab | Laboratory of Technology for High Temperature |
| TIT | Turbine Inlet Temperature |
References
- Johnson, B.; Mack, G.; Paolillo, R.; Daniels, W. Turbine Rim Seal Gas Path Flow Ingestion Mechanisms; AIAA Paper 94-2703; AIAA: Reston, VA, USA, 1994. [Google Scholar]
- Owen, J. Prediction of Ingestion Through Turbine Rim Seals–Part I: Rotationally Induced Ingress. J. Turbomach. 2010, 133, 031005. [Google Scholar] [CrossRef]
- Owen, J.; Zhou, K.; Pountney, O.; Wilson, M.; Lock, G. Prediction of Ingress Through Turbine Rim Seals–Part I: Externally Induced Ingress. J. Turbomach. 2011, 134, 031012. [Google Scholar] [CrossRef]
- Sangan, C.; Pountney, O.; Zhou, K.; Wilson, M.; Owen, J.; Lock, G. Experimental Measurements of Ingestion Through Turbine Rim Seals–Part I: Externally Induced Ingress. J. Turbomach. 2012, 135, 021012. [Google Scholar] [CrossRef]
- Owen, J. Prediction of Ingestion Through Turbine Rim Seals–Part II: Externally Induced and Combined Ingress. J. Turbomach. 2010, 133, 031006. [Google Scholar] [CrossRef]
- Sangan, C.; Pountney, O.; Zhou, K.; Owen, J.; Wilson, M.; Lock, G. Experimental Measurements of Ingestion Through Turbine Rim Seals–Part II: Rotationally Induced Ingress. J. Turbomach. 2012, 135, 021013. [Google Scholar] [CrossRef]
- Scobie, J.A.; Sangan, C.M.; Teuber, R.; Pountney, O.J.; Owen, J.M.; Wilson, M.; Lock, G.D. Experimental Measurements of Ingestion Through Turbine Rim Seals: Part 4 — Off-Design Conditions. In Proceedings of the ASME Turbo Expo 2013: Turbine Technical Conference and Exposition, San Antonio, TX, USA, 3–7 June 2013; ASME: New York, NY, USA, 2013; Volume 3A: Heat Transfer, p. V03AT15A002. [Google Scholar] [CrossRef]
- Sangan, C.; Pountney, O.; Scobie, J.; Wilson, M.; Owen, J.; Lock, G. Experimental Measurements of Ingestion Through Turbine Rim Seals–Part III: Single and Double Seals. J. Turbomach. 2013, 135, 051011. [Google Scholar] [CrossRef]
- Revert, A.B.; Beard, P.; Chew, J.; Bottenheim, S. Performance of a Turbine Rim Seal Subject to Rotationally-Driven and Pressure-Driven Ingestion. J. Eng. Gas Turbines Power 2021, 143, 081025. [Google Scholar] [CrossRef]
- Tang, H.; Scobie, J.; Wang, Z.; Lock, G. A theoretical model for ingress through turbine rim seals based on physically-observed unsteadiness. Int. J. Heat Fluid Flow 2024, 106, 109300. [Google Scholar] [CrossRef]
- Andreini, A.; Soghe, R.D.; Facchini, B.; Zecchi, S. Turbine Stator Well CFD Studies: Effects of Cavity Cooling Air Flow. In Proceedings of the ASME Turbo Expo 2008: Power for Land, Sea, and Air, Berlin, Germany, 9–13 June 2008; pp. 2509–2521. [Google Scholar] [CrossRef]
- Andreini, A.; Soghe, R.D.; Facchini, B. Turbine Stator Well CFD Studies: Effects of Coolant Supply Geometry on Cavity Sealing Performance. J. Turbomach. 2011, 133, 021008. [Google Scholar] [CrossRef]
- Ong, J.; Miller, R.; Uchida, S. The Effect of Coolant Injection on the Endwall Flow of a High Pressure Turbine. J. Turbomach. 2012, 134, 051003. [Google Scholar] [CrossRef]
- Zlatinov, M.; Tan, C.; Little, D.; Montgomery, M. Effect of purge flow swirl on hot-gas ingestion into turbine rim cavities. J. Propuls. Power 2016, 32, 1055–1066. [Google Scholar] [CrossRef]
- Clark, K.; Barringer, M.; Thole, K.; Clum, C.; Hiester, P.; Memory, C.; Robak, C. Effects of Purge Jet Momentum on Sealing Effectiveness. J. Eng. Gas Turbines Power 2017, 139, 031904. [Google Scholar] [CrossRef]
- Clark, K.; Barringer, M.; Johnson, D.; Thole, K.; Grover, E.; Robak, C. Effects of Purge Flow Configuration on Sealing Effectiveness in a Rotor Stator Cavity. J. Eng. Gas Turbines Power 2018, 140, 112502. [Google Scholar] [CrossRef]
- Patinios, M.; Ong, I.; Scobie, J.; Lock, G.; Sangan, C. Influence of Leakage Flows on Hot Gas Ingress. J. Eng. Gas Turbines Power 2018, 141, 021010. [Google Scholar] [CrossRef]
- Darby, P.; Mesny, A.; Cosmo, G.D.; Carnevale, M.; Lock, G.; Scobie, J.; Sangan, C. Conditioning of Leakage Flows in Gas Turbine Rotor Stator Cavities. J. Eng. Gas Turbines Power 2021, 143, 021009. [Google Scholar] [CrossRef]
- Zhang, F.; Wang, X.; Li, J.; Zheng, D. Numerical investigation on the effect of radial location of sealing air inlet and its geometry on the sealing performance of a stator-well cavity. Int. J. Heat Mass Transf. 2017, 115, 820–832. [Google Scholar] [CrossRef]
- Wang, R.; Liu, G.; Du, Q.; Lian, Z.; Xie, L. An Improved Control Method of Rim Seal Based on Auxiliary Sealing Holes; GPPS-TC-2019-0010; GPPS: Zug, Switzerland, 2019. [Google Scholar]
- Wang, R.; Du, Q.; Liu, G.; Lian, Z.; Xie, L.; Zhu, J. Influence of Secondary Sealing Flow on Performance of Turbine Axial Rim Seals. J. Therm. Sci. 2020, 29, 840–851. [Google Scholar] [CrossRef]
- Gai, Z.; Zhu, P.; Hu, J.; Liu, Z.; Yin, H. Effects of Sealing Flow Supply Configuration with Holes on Sealing Effectiveness of Turbine Rim Seal. J. Therm. Sci. 2023, 32, 366–386. [Google Scholar] [CrossRef]
- Qiang, D.; Ruonan, W.; Lei, X.; Guang, L.; Zengyan, L. A Novel Design of Rim Sealing Flow for Improving Sealing Effectiveness. J. Eng. Gas Turbines Power 2023, 145, 071003. [Google Scholar] [CrossRef]
- Jackson, R.; Christodoulou, L.; Li, Z.; Sangan, C.; Ambrose, S.; Jefferson-Loveday, R.; Lock, G.; Scobie, J. Influence of swirl and ingress on windage losses in a low-pressure turbine stator-well cavity. Exp. Fluids 2023, 64, 173. [Google Scholar] [CrossRef]
- Choi, M.; Goo, B.; Cho, G.; Song, S. Swirl Enhancement Effect on Turbine Rim Seal Performance. J. Turbomach. 2024, 146, 051002. [Google Scholar] [CrossRef]
- Orsini, L.; Picchi, A.; Bonini, A.; Innocenti, L.; Di Benedetto, D.; Da Soghe, R.; Mazzei, L. Design Procedure of a Rotating Cavity Rig for Hot Gas Ingestion Investigation. In Proceedings of the ASME Turbo Expo 2022: Turbomachinery Technical Conference and Exposition, Rotterdam, The Netherlands, 13–17 June 2022; ASME: New York, NY, USA, 2022; Volume 10B, p. V10BT16A010. [Google Scholar] [CrossRef]
- Orsini, L.; Picchi, A.; Facchini, B.; Bonini, A.; Innocenti, L. Impact of the purge flow density ratio on the rim sealing effectiveness in hot gas ingestion measurements. J. Turbomach. 2024, 146, 021002. [Google Scholar] [CrossRef]
- Boldero, J.S.; Vella, S.; Tang, H.; Scobie, J.A.; Lock, G.D.; Sangan, C.M. The Effect of the Purge–Mainstream Density Ratio on Rim Seal Fluid Mechanics. Int. J. Turbomach. Propuls. Power 2025, 10, 46. [Google Scholar] [CrossRef]
- Orsini, L.; Picchi, A.; Facchini, B.; Bonini, A.; Innocenti, L. On the Use of Pressure-Sensitive Paint to Determine the Rim Sealing Effectiveness. J. Turbomach. 2023, 146, 021001. [Google Scholar] [CrossRef]
- Orsini, L.; Picchi, A.; Facchini, B.; Bonini, A.; Innocenti, L. Comparison of Rim Sealing Effectiveness in Different Geometrical Configurations. J. Eng. Gas Turbines Power 2024, 147, 021022. [Google Scholar] [CrossRef]
- Orsini, L.; Brocchi, S.; Picchi, A.; Facchini, B.; Bonini, A.; Innocenti, L. Commissioning of a Newly Designed Experimental Facility for Hot Gas Ingestion Investigation. In Proceedings of the 15th European Conference on Turbomachinery Fluid Dynamics and Thermodynamics, Budapest, Hungary, 24–28 April 2023; Euroturbo: Florence, Italy, 2023; Paper No. ETC2023-263. [Google Scholar] [CrossRef]
- Owen, J.; Rogers, R. Flow and Heat Transfer in Rotating Disc Systems; Research Studies Press: Taunton, UK, 1989; Volume 1. [Google Scholar]
- Kline, S.; McClintock, F. Describing Uncertainties in Single Sample Experiments. Mech. Eng. 1953, 75, 3–8. [Google Scholar]


Disclaimer/Publisher’s Note: The statements, opinions and data contained in all publications are solely those of the individual author(s) and contributor(s) and not of MDPI and/or the editor(s). MDPI and/or the editor(s) disclaim responsibility for any injury to people or property resulting from any ideas, methods, instructions or products referred to in the content. |
© 2026 by the authors. Licensee MDPI, Basel, Switzerland. This article is an open access article distributed under the terms and conditions of the Creative Commons Attribution (CC BY) license.