Featured Application
The proposed ABCDEFG framework for nutritional assessment provides a comprehensive tool for both clinical and community settings. By integrating traditional methods with ecological, functional, and genomic evaluations, it supports the shift toward personalized and precision nutrition. Its application is especially valuable for the early detection and management of malnutrition, sarcopenia, and chronic diseases, and it also provides a robust foundation for advancing research in nutrigenomics and the gut microbiota.
Abstract
Background: Nutritional status assessment is the cornerstone of the Nutrition Care Process, guiding diagnosis, intervention, and monitoring. The classical ABCD model (Anthropometry, Biochemical, Clinical, Dietary) has been widely applied; however, it presents limitations in addressing current nutritional and epidemiological challenges. Objective: This narrative review aims to synthesize and update the scientific evidence on the expanded nutritional assessment model, known as ABCDEFG, which incorporates the Ecological–microbiota (E), Functional (F), and Genomic–nutrigenomic (G) approaches. Methods: A narrative review of the literature was conducted through PubMed, Scopus, and Web of Science, covering publications from 2013 to 2025. Articles were selected based on relevance to at least one of the seven assessment domains. Findings were synthesized descriptively and critically, highlighting applications, strengths, and limitations. Results: The ABCDEFG framework offers a multidimensional perspective of nutritional assessment. While anthropometric, biochemical, clinical, and dietary methods remain essential, the inclusion of ecological dimensions (gut microbiota, environmental influences), functional measures (e.g., muscle strength, physical performance), and genomics enables a more sensitive and personalized evaluation. This integrative approach supports better clinical decision-making and research innovation in nutrition and health sciences. Conclusions: The seven-method model broadens the scope of nutritional assessment, bridging traditional and emerging tools. Its application enhances the capacity to identify nutritional risks, design targeted interventions, and advance precision nutrition.
1. Introduction
Nutritional status assessment is the first stage of the Nutrition Care Process (NCP), a framework standardized by the Academy of Nutrition and Dietetics to ensure an integrated and reproducible approach in both clinical and community settings. The NCP consists of four interrelated phases: assessment, diagnosis, intervention, and monitoring, with assessment serving as the foundation for evidence-based decision-making in health and nutrition [1].
Traditionally, assessment methods were grouped under the ABCD acronym (Anthropometric, Biochemical, Clinical, and Dietary), which established core parameters for identifying nutritional status across diverse populations [2,3]. However, recent epidemiological and nutritional shifts characterized by the coexistence of undernutrition and overnutrition, dietary transitions, and population aging have exposed important limitations of this classical model [4,5].
In response, new analytical dimensions have been introduced to enrich professional practice. This has led to the development of the expanded ABCDEFG model, which incorporates three additional components alongside the traditional four: E (Ecological assessment and gut microbiota), F (Functional assessment), and G (Genomic and nutrigenomic assessment) (Figure 1).
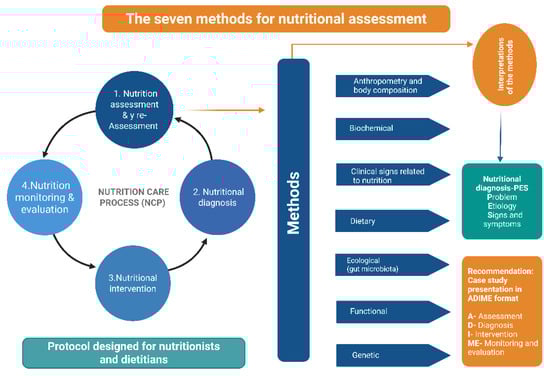
Figure 1.
The seven methods in the nutritional assessment process and the recommended format for presenting case studies in Nutrition and Dietetics are summarized in the diagram. It depicts the continuum of the Nutrition Care Process (NCP), which consists of four stages: (1) nutrition assessment and reassessment, (2) nutritional diagnosis, (3) nutritional intervention, and (4) nutrition monitoring and evaluation. On the right, seven complementary nutritional assessment methods are outlined: anthropometry and body composition, biochemical assessment, clinical signs related to nutrition, dietary assessment, ecological factors (including gut microbiota), functional assessment, and genetic evaluation. Together, these methods provide comprehensive data for identifying nutritional problems and determining their etiologies using the PES format (Problem, Etiology, Signs and Symptoms). This information supports structured case analysis and documentation through the ADIME format (Assessment, Diagnosis, Intervention, Monitoring, and Evaluation).
This expanded framework reflects the evolution of nutritional science toward a more integrative perspective that goes beyond morphological and biochemical indicators to include functional, molecular, and environmental factors affecting health [6].
However, despite the broad use of the classical ABCD model, the literature lacks an integrated framework that combines ecological–microbiota, functional, and genomic/nutrigenomic dimensions with traditional assessment domains. Existing evidence addresses these components separately, without clarifying how they collectively strengthen diagnosis, intervention, and monitoring within the NCP. This gap underscores the need for an updated and integrative perspective, which the present narrative review aims to address by examining the scientific basis, applications, strengths, and limitations of the proposed ABCDEFG framework. The objective of this narrative review is to synthesize and update scientific evidence on nutritional assessment methods, highlighting their applications, strengths, and limitations, as well as proposing an updated conceptual framework to guide professionals in nutrition and health sciences.
2. Materials and Methods
This narrative review considered a comprehensive body of literature relevant to the seven components of the ABCDEFG nutritional assessment framework. Literature searches were conducted in PubMed, Scopus, and Web of Science using combinations of keywords including nutritional assessment, nutrition status evaluation, anthropometry, muscle function, gut microbiota, genetics and nutrition, and biochemical markers.
Eligible sources included original research articles, systematic reviews, clinical guidelines, and consensus statements addressing at least one ABCDEFG domain. Animal studies, editorials, letters to the editor, and publications without full-text availability were excluded.
Titles and abstracts were independently screened by two reviewers (R.Z.-V. and L.D.D.B.) to assess relevance. Articles were advanced to full-text review only when both reviewers agreed on inclusion. Reference lists of selected publications were also manually screened to identify additional relevant sources.
Following selection, studies were categorized according to the nutritional assessment domain addressed. Full-text evaluation was performed to extract evidence supporting anthropometric, biochemical, clinical, dietary, ecological, functional, and genomic–nutrigenomic components. Where relevant, observations related to the potential role of multispecies probiotic formulations were noted in the context of microbiota-related findings.
Although this review follows a narrative rather than systematic methodology, efforts were made to ensure transparency and methodological rigor. The literature search covered publications from 2013 to 2025, reflecting the period during which functional, microbiota-related, and nutrigenomic concepts became increasingly integrated into nutritional assessment.
Database searches yielded approximately 98 records. After title and abstract screening and exclusion of studies lacking relevance to nutritional assessment or the conceptual development of the ABCDEFG framework, a final set of 65 publications was included. No formal flow diagram was applied, as sources were selected based on conceptual relevance and contribution to emerging assessment domains beyond traditional models.
This approach was designed to balance methodological transparency with the exploratory and integrative aims of a narrative review, prioritizing conceptual coherence over exhaustive systematic coverage.
3. Results
3.1. Anthropometry and Body Composition
3.1.1. Anthropometry and Kinanthropometry
The wide range of methods and contexts in which anthropometry is applied has created a growing need for written protocols, equipment calibration, and standardized training to ensure data accuracy and comparability [7]. Kinanthropometry, derived from the Greek kínisi (movement), ánthropos (human), and métron (measure), refers to the quantitative evaluation of human body structure in relation to movement and performance. Its contributions extend beyond sports science, providing valuable insights into body composition, proportionality, and somatotype, which can inform clinical decision-making [8].
To promote methodological consistency, the International Society for the Advancement of Kinanthropometry (ISAK) established globally recognized protocols that detail measurement techniques, anatomical landmarks, calibration requirements, and reporting standards [9].
ISAK currently offers two levels of standardized protocols: the restricted protocol (21 measurements) for Level 1 certification and the full protocol (43 measurements) for Level 2. Using these measurements, body composition can be estimated through fractionation models ranging from two to five components, including adipose tissue, muscle, bone, residual mass, and skin. Additional outputs include sums of skinfolds, corrected girths, somatotype, proportionality indices, and Z-scores. These indicators have broad applications in evaluating health, growth, physical development, and athletic performance optimization [10].
Further details related to anthropometric indicators are available in the Supplementary Material.
3.1.2. Body Composition
- Five-Component Fractionation Model
Kinanthropometry by the complete method can determine body composition in 5 fractions. Table 1 shows the distribution of total body mass into five anatomical components—adipose, muscular, bone, skin, and residual mass—expressed in kilograms. The estimated total mass is compared with the structured-brute mass, showing both the absolute (kg) and relative (%) differences. It should be considered that the adipose mass is not the same as the percentage of body fat, because the adipose mass contemplates all the components of the adipocyte, that is to say, in addition to the fat mass, water and minerals [11].

Table 1.
Five-component anatomical fractionation.
- Segmental Muscular and Adipose Distribution
The ISAK Metry software [12] also provides segmented estimates of adipose and muscle tissue. Adipose mass is regionally distributed into upper (biceps, triceps, subscapular), central (suprailiac, supraspinal, abdominal), and lower segments (mid-thigh and calf skinfolds). The muscle mass is segmented into upper limbs (arms), thorax and lower limbs (thighs and legs) (Figure 2).
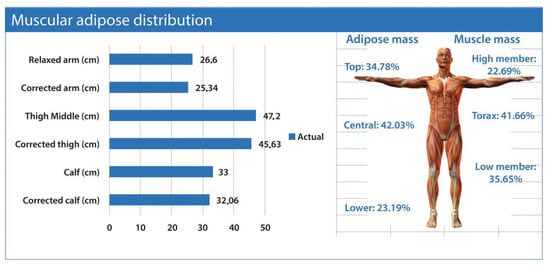
Figure 2.
Muscular–adipose distribution. The figure illustrates segmental estimates of muscle and adipose mass derived from anthropometric assessment. The bar graph presents the relaxed and corrected circumferences of the arm, mid-thigh, and calf, reflecting regional muscle–fat composition. On the right, the schematic human figure depicts the relative contribution of adipose and muscular tissue across body segments. Data were obtained using the ISAK Metry software [12].
- Adiposity and Muscularity Indices
Two key proportional indices can be derived from anthropometric fractionation: the adipose–muscle index (adipose mass in kg divided by muscle mass in kg) and the muscle–bone index (muscle mass in kg divided by bone mass in kg). Lower adipose–muscle index values denote a more favorable balance between muscle and adipose tissue. The muscle–bone index, in contrast, provides an estimate of the muscular potential permitted by the underlying skeletal frame, providing insight into constitutional morphology, structural robustness, and functional capacity (Figure 3).
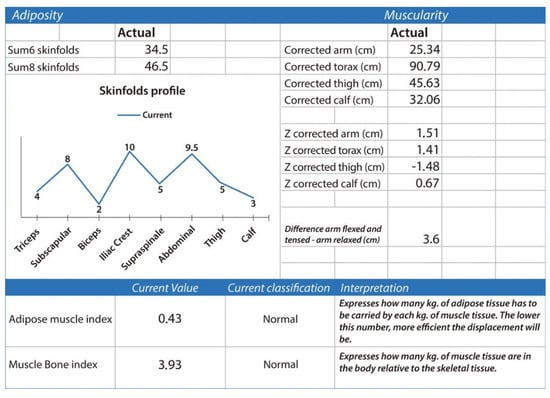
Figure 3.
Adiposity and muscularity. The figure summarizes anthropometric indicators of adiposity and muscularity derived from skinfolds and corrected limb circumferences, including regional fat distribution, muscular Z-scores, and the adipose–muscle and muscle–bone indices, both classified as normal. Data were obtained using the ISAK Metry software [12].
3.1.3. Skeletal Proportions and Bone Distribution
Bone distribution allows the derivation of several proportionality indices with broad applications in assessing physical development and athletic aptitude (Figure 4).
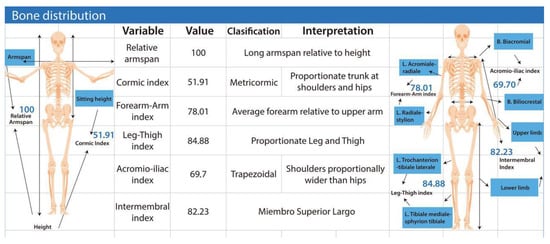
Figure 4.
The figure presents anthropometric indices used to assess skeletal proportions and body segment relationships. Variables include relative arm span, cormic index, forearm–arm index, leg–thigh index, acromio–iliac index, and intermembral index, each accompanied by its classification and interpretation. The diagrams on both sides illustrate the measurement points for upper- and lower-limb segments and trunk proportions. Together, these indices describe the geometric and functional balance among limb lengths, trunk height, and the shoulder–hip ratio, contributing to the evaluation of somatotype, biomechanics, and constitutional morphology. Data were obtained using the ISAK Metry software [12].
3.1.4. Somatotype Analysis
Kinanthropometry also enables the calculation of the three somatotype components, which are widely used in disciplines such as soccer [11]. Using the ISAK Metry tool [12], the corresponding somatotype chart can be generated. These values allow the determination of a somatotype profile—of which 13 variants are described—and its application in evaluating and optimizing athletic performance [13] (Figure 5).
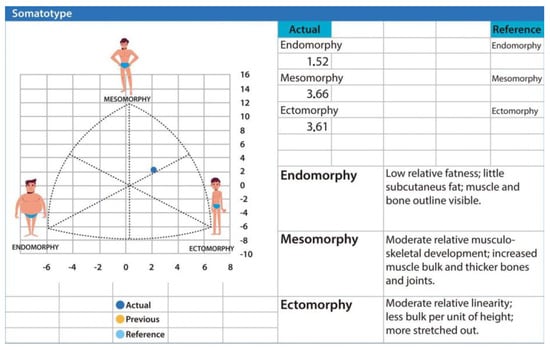
Figure 5.
The figure displays the individual’s somatotype based on endomorphic, mesomorphic, and ectomorphic components, placing the subject in the meso-ectomorphic region, indicative of moderate muscularity, low adiposity, and linear body proportions. Data were generated using the ISAK Metry software [12].
3.1.5. Health-Related Anthropometric Indices
Figure 6 shows that anthropometry generates information on some health indices, such as waist circumference, to determine cardiovascular risk, among others.
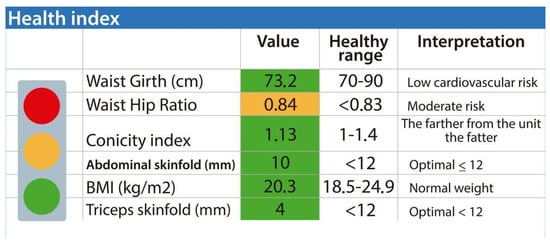
Figure 6.
Health index derived from anthropometric and adiposity indicators. The figure synthesizes key metrics commonly used to assess cardiometabolic and nutritional status. These parameters include waist circumference, waist–hip ratio, conicity index, abdominal and triceps skinfolds, and body mass index (BMI), each contrasted with established reference values for healthy populations. A color-coded scale (green = optimal, yellow = moderate risk, red = high risk) enhances interpretation by categorizing the degree of associated risk. The evaluated subject presents a normal BMI (20.3 kg/m2), optimal skinfold levels (<12 mm), and low cardiovascular risk according to waist circumference, while the waist–hip ratio of 0.84 indicates moderate risk of central adiposity. As a whole, this composite profile provides an integrated overview of body composition and cardiovascular risk. Obtained from ISAK Metry software [12].
3.2. Technologies for Body Composition Assessment
3.2.1. Bioelectrical Impedance Analysis (BIA)
Bioelectrical impedance analysis (BIA) is a non-invasive, widely used technique for estimating body composition parameters such as fat-free mass, total body water, and skeletal muscle index. The method is based on measuring the body’s resistance and reactance when exposed to a low-amplitude electrical current. BIA has demonstrated solid clinical utility in diverse populations, including individuals with chronic kidney disease undergoing hemodialysis, where it supports nutritional monitoring and fluid status evaluation [14]. Its rapid application, portability, and relatively low cost make it suitable for both clinical and field settings.
3.2.2. Muscle Ultrasound (MU)
Muscle ultrasound (MU) enables the real-time visualization and quantification of muscle architecture, including thickness, pennation angle, and cross-sectional area. It has proven to be an effective tool for diagnosing and monitoring sarcopenia, particularly in older adults and hospitalized patients [15]. For example, measurements of rectus femoris muscle thickness show strong correlations with functional indicators such as handgrip strength (HGS) and the fat-free mass index, supporting its value as a surrogate marker of muscular function and overall physical performance [16].
The integration of BIA and MU provides a more comprehensive assessment of muscular health by combining quantitative (mass, volume, hydration) and qualitative (structure, tissue integrity) information. This multimodal approach improves diagnostic accuracy for conditions such as sarcopenia and cachexia and enhances the capacity to track intervention-related changes over time [16]. Considering the rising prevalence of muscle-wasting disorders in aging populations, incorporating both tools into routine clinical practice supports earlier detection, targeted nutritional strategies, and optimized rehabilitation interventions.
Table 2 summarizes the use of BIA and MU in hospital, community and sports settings.
Table 2.
Use of bioelectrical impedance analysis (BIA) and muscle ultrasound (MU) in Hospital, Community and Sports settings.
3.3. Nutritional Biochemistry
Biochemical assessment is a fundamental component of nutritional evaluation. It relies on the quantification of biomarkers in blood, urine, and other biological fluids to identify nutrient deficiencies, excesses, metabolic dysfunctions, or inflammatory states that may compromise health. These biomarkers provide objective and sensitive information that complements anthropometric and clinical findings, allowing early detection of nutritional risk and guiding targeted interventions. Table 3 summarizes the most frequently used biochemical indicators for assessing nutritional status, including proteins, micronutrients, inflammatory markers, and metabolic risk indicators.
Table 3.
Key Biochemical Parameters in Nutritional Assessment.
In clinical practice, these procedures are used to diagnose nutritional deficiencies, evaluate the response to dietary interventions, and monitor health status in individuals with chronic or acute conditions. Collectively, they form a comprehensive framework for assessing nutritional care outcomes, enabling clinicians to detect specific nutrient imbalances, quantify the effectiveness of nutritional modifications, and support the long-term maintenance of metabolic stability and disease control [26].
Accordingly, biochemical evaluation constitutes a core pillar of nutritional assessment. Its proper interpretation—integrated with clinical, anthropometric, and dietary information—facilitates the development of effective intervention strategies aimed at improving patient health [27].
3.4. Clinical Signs Related to Nutrition
In addition to dietary and anthropometric assessments, the systematic identification of clinical signs related to nutrition provides essential information about an individual’s nutritional status and may reveal deficiencies or excesses of specific nutrients [28].
These signs can be subtle or pronounced and may affect diverse systems, including the skin, hair, nails, eyes, oral cavity, cardiovascular system, gastrointestinal tract, and nervous system [29]. It is important to highlight that clinical signs alone are not diagnostic; however, when interpreted alongside biochemical, dietary, and anthropometric data, they contribute to a comprehensive and accurate evaluation of the patient’s nutritional status [30].
3.4.1. Clinical Signs Associated with Nutritional Deficiencies
Several nutritional deficiencies produce characteristic clinical signs that may guide the clinician toward early detection of underlying metabolic or dietary imbalances. Below are some of the most relevant manifestations associated with common nutrient deficiencies:
Protein Deficiency: Protein deficiency may manifest through peripheral edema, loss of muscle mass, thinning and fragility of hair, brittle nails, and delayed wound healing [31]. In severe forms, protein-energy malnutrition can progress to kwashiorkor, a syndrome characterized by generalized edema, abdominal ascites, dermatoses, and changes in hair pigmentation and texture [32].
Iron deficiency is the most prevalent nutritional deficiency globally [33]. Clinically, it may present with pallor, fatigue, weakness, reduced attention span, koilonychia (spoon-shaped nails), and glossitis [34].
Vitamin A deficiency commonly results in ocular alterations such as xerophthalmia (dryness of the conjunctiva), night blindness, and the presence of Bitot’s spots, which are keratinized plaques on the conjunctival surface [35]. Advanced deficiency can lead to keratomalacia (corneal softening) and increased susceptibility to infectious diseases. Among children, this deficiency significantly elevates morbidity and mortality risk [36].
Vitamin C Deficiency: Vitamin C deficiency produces symptoms including bleeding gums, petechiae, ecchymoses, impaired wound healing, and arthralgia [37]. In advanced cases, scurvy may occur, presenting with severe fatigue, musculoskeletal pain, gingival hypertrophy, and widespread hemorrhagic manifestations [38].
Calcium Deficiency: Calcium deficiency is associated with neuromuscular irritability, presenting as tetany, paresthesia, and generalized muscle weakness [39]. Chronic deficiency contributes to decreased bone mineral density and osteoporosis, while in children, it may impair growth and bone development due to inadequate mineralization during key developmental stages [40].
3.4.2. Interpretation of Clinical Signs
It is essential to highlight that clinical signs may be nonspecific and can be associated with multiple causes, not only nutritional ones. Therefore, a complete medical history, including dietary, medical, and pharmacological backgrounds, as well as complementary examinations (laboratory tests and imaging studies), is crucial to confirm the nutritional deficiency and rule out other potential causes of clinical signs [41,42]. Thus, clinical evaluation of nutritional status should be an integral part of patient assessment.
A general inspection of the patient is recommended, looking for signs such as pallor, edema, muscle mass loss, and alterations in the skin and hair. Subsequently, a more detailed physical examination should be performed, assessing different body systems for specific signs of nutritional deficiencies. It is important to carefully document clinical findings and correlate them with dietary, anthropometric, and biochemical information to obtain a complete assessment of the patient’s nutritional status. The identification of clinical signs related to nutrition is a valuable tool in nutritional status assessment. These signs, in conjunction with dietary, anthropometric, and biochemical information, allow for a comprehensive patient evaluation and can reveal specific nutrient deficiencies or excesses [43]. Healthcare professionals must be familiar with the most relevant clinical signs associated with common nutritional deficiencies and use them as part of their clinical practice to improve patient care and monitoring of those at risk of malnutrition. The principal clinical signs related to nutritional deficiencies are summarized in Table 4, based on information from previous studies [31,32,33,34,35,36,37,38,39,40].
Table 4.
Clinical Signs Related to Nutrient Stores.
In addition to the clinical signs described above, it is important to highlight that additional nutrition-related physical findings have been systematically documented in specialized resources. The Nutrition-Focused Physical Exam for Adults: An Illustrated Handbook provides a comprehensive and clinically structured physical examination approach and includes pictorial representations of various stages of muscle and fat depletion, vitamin and mineral deficiencies, and fluid imbalance [44].
The Clinical Assessment of Nutritional Status (CANS) Score is another useful tool that enhances the identification of nutritional status in newborns. This scoring system integrates clinical signs of fat and muscle stores, allowing for an accessible and reliable evaluation of neonatal nutritional condition, particularly in settings where biochemical or anthropometric data may be limited [45].
3.5. Dietary Assessment
Assessing dietary intake involves collecting information on all foods and beverages (and in some cases supplements) consumed during a specific period of time. This information can be measured at different levels (national, collective or individual). Measuring the dietary intake of subjects, however, is particularly difficult and subject to both random and systematic measurement errors, so it is of great importance for the practitioner to know the strengths and weaknesses of each of the methods. Therefore, the level of assessment and the method must be carefully selected in relation to the objective of the research or intervention to be achieved, in the case that the assessment is at the individual level. Thus, nutritionists and researchers face a great challenge when selecting the method to be applied; for more details, Bates and Dao describe how to achieve an adequate selection of the method [46,47].
3.5.1. Methods for Assessing Dietary Intake
Table 5 shows the most commonly used methods for assessing dietary intake, both retrospective and prospective, and their strength, rationale, advantages and disadvantages, while Table 6 shows the recommended area of application of the method. Among the most commonly used methods are the frequency of consumption (FC), single or repeated 24 h recall (R24hrs), and consumption diaries (DC) [48], which can be administered for a variable number of days. However, the estimation of the food portion continues to be a great challenge for professionals in the area. For this, tools have been designed, such as the determination of standardized portion sizes, the use of standardized home measurements, and images and food models, which must be specific for the population under study.
Table 5.
Most commonly used methods for assessing dietary intake, their strength, rationale, advantages and disadvantages.
Table 6.
Recommended area of application of the method.
Among the visual materials studied, a food atlas has proved to be the most effective, clear and easily accessible tool for consultation and transport, which allows the quantification of food and nutrient intake and decreases the bias of people’s self-assessment. Therefore, the purpose of this tool is to complement traditional self-reporting methods (reminders or 24 h records) or to serve as a stand-alone method to provide the primary record of dietary intake [49]. Thus, when photographs of foods are used in the identification of portion sizes, the respondent’s ability to relate the amount consumed to that presented through an image is enhanced [53,54]. Moreover, digital photography has proven to be unobtrusive and accurate and has become the method of choice for assessing food consumption, both individually and collectively.
Ecuador published its first food atlas in 2019 [55] and a second edition in 2022 [56] as a support tool for professionals. This second edition presents 142 foods in their usual form of consumption and 49 representative home measurements for the Ecuadorian population. Once the portion consumed or the amount of food ingested has been estimated, the energy and nutrient intake should be multiplied by the values of the nutritional content of the foods, which are shown in the tables of chemical composition of foods. Given the great variability in nutritional composition among the different regions of the world, it is recommended to use nutritional composition tables specific to the country or region. Ecuador has two tools available: the food composition table of the city of Cuenca, which presents information on foods prepared in this city [57], and the table of chemical composition of foods based on nutrients of interest to the Ecuadorian population, which provides the nutritional content of more than a thousand locally used foods, including information on the nutritional labeling of more than 300 processed and ultra-processed foods [58].
3.5.2. Nutrient–Drug Interactions
Given the diversity of nutritional assessment tools, picking the proper method depends greatly on the setting, the objective of the study, and the characteristics of the population [59,60]. Assessing nutrient–drug interactions (NDIs) is a key complementary component of nutritional evaluation, particularly in clinical and aging populations where polypharmacy is widespread [61,62]. Despite not being a traditional dietary intake technique, NDIs have a direct impact on nutrient needs, metabolism, and absorption, which shapes the dietary (D) dimension’s accuracy and interpretation within the ABCDEFG framework. Integrating NDIs into dietary assessment helps practitioners to identify hazards that may impair nutritional status, interfere with treatment efficacy, or need personalized dietary interventions.
Drug pharmacokinetics and pharmacodynamics can be dramatically altered by food and dietary factors, which can affect absorption, metabolism, distribution, and excretion. On the other hand, some drugs may have a harmful effect on nutrient bioavailability, resulting in insufficiencies or higher needs [61]. Including validated tools to assess NDIs in clinical practice enhances patient safety, optimizes therapeutic efficacy, and supports personalized nutrition strategies. In both hospital and outpatient settings, screening tools like structured questionnaires offer a useful method for early detection of possible NDIs. To date, no fully standardized methods exist for the assessment of NDIs. Table 7 presents a plausible set of questions that may be considered for evaluation of NDIs [63].
Table 7.
Example of a screening questionnaire for Nutrient–Drug interactions (NDIs).
Such an assessment is crucial to monitor the risks associated with NDIs. Recently, for example, a study was conducted to assess the knowledge, attitudes, and awareness of Registered Nurses regarding food–drug interactions. The study involved administering a structured 40-question survey to 278 nurses, revealing a significant deficit in both knowledge and attitudes among nurses toward food–drug interactions [63]. Therefore, screening for NDIs not only complements dietary intake measurement but also enhances the clinical applicability of the ABCDEFG model by incorporating pharmaceutical influences into nutritional decision-making.
3.6. Ecological Assessment: Microbiome and Gut Microbiota
Ecological assessment includes the evaluation of environmental, dietary, and microbial factors influencing gastrointestinal and systemic health. The gut microbiota is a central component of this dimension due to its dynamic interaction with the host’s metabolic, immune, and neuroendocrine functions. Patterning of microbiota through molecular, sequencing, and bioinformatic approaches enables a more sensitive and personalized evaluation of nutritional status, complementing traditional anthropometric, biochemical, and clinical methods [64]. This ecological perspective also integrates lifestyle determinants, medication exposure, and dietary patterns, all of which modulate microbial diversity, composition, and function.
3.6.1. Tools for Screening the State of Gut Microbiota
Advances in sequencing technologies and bioinformatics have significantly enhanced our ability to profile these microbial communities, providing insights into their contributions to health and disease [65].
The process begins with microbial DNA extraction, followed by sequencing techniques such as 16S rRNA gene amplification for bacteria or ITS for fungi. Alternatively, shotgun metagenomic approaches are used to encompass the full genetic composition of the microbial community [65]. The sample quality, protocols used for extraction, and sequencing platforms (e.g., Illumina, Nanopore, PacBio) significantly impact data reliability.
For the bioinformatic workflow, raw sequencing data first undergo quality control using tools such as FastQC [66] and Trimmomatic [67], followed—when applicable—by assembly steps for metagenomic datasets. Taxonomic classification is typically performed with curated reference databases, including SILVA [68], Greengenes [69], or GTDB [70]. For 16S rRNA analyses, established pipelines such as QIIME2 or DADA2 are commonly employed [71], whereas shotgun metagenomic profiling may utilize tools such as METAnnotatorX2, MetaPhlAn, Kraken2, or HUMAnN [72]. Functional inference can be conducted using prediction tools like PICRUSt [73] or directly through gene annotation derived from shotgun metagenomic sequencing.
For common microbiota analysis indicators, Alpha diversity (e.g., Shannon, Simpson) and Beta diversity (e.g., UniFrac, Bray–Curtis) metrics are calculated alongside relative abundance profiles to understand the complexity and variation within microbial communities [74]. Whereas, associations between specific taxa and nutritional states or dietary patterns are explored using statistical analyses and multivariate models [75]. This approach helps us to understand how different factors influence gut microbiota composition and, subsequently, human health.
Data interpretation must be cautious due to high inter-individual variability, lack of standardization in pipelines, and the absence of a universally defined healthy microbiome [76,77]. Moreover, predicted functional analyses should not replace transcriptomic, proteomic, or metabolomic validation.
Within the ecological–microbiota dimension (E), key indicators include dysbiosis risk scores such as the Dys-R questionnaire, stool consistency and gastrointestinal function scales, molecular profiling through 16S rRNA sequencing or shotgun metagenomics, recent antibiotic exposure, and dietary patterns known to modulate gut microbial composition. In practice, gut microbiota profiling through 16S rRNA sequencing has become the gold standard for assessing ecological nutritional status [78].
However, when sequencing is not available, complementary tools can be integrated into the ecological assessment. These include the Dys-R questionnaire (Table 8) [79], the Bristol scale together with medication history (antibiotics and non-antibiotics) [65,80,81], evaluation of diet based on the intestinal microbiota [82] (Table 9), and, in the case of oncological patients, the gastrointestinal function evaluation scale (Table 10) [83].
Table 8.
Dys-R Questionnaire.
Table 9.
Evaluation of diet based on gut microbiota.
Table 10.
Gastrointestinal function assessment scale.
The Dys-R questionnaire was developed in Brazil in 2023 using a sample of 219 individuals with chronic diseases and a control group of 52 healthy participants from a tertiary hospital. All participants completed the Dysbiosis Frequently Asked Questions Management (DYS/FQM) semi-structured questionnaire to collect sociodemographic and clinical information, and fecal samples were obtained for microbiota analysis. The results showed that there were notable differences between the groups, evidencing a lower richness of intestinal microbiota as the main marker of intestinal dysbiosis and a positive predictive value of 79%, concluding that the new Dys-R questionnaire showed a good performance to rule out dysbiosis [79].
Dysbiosis is also frequent among oncologic patients, where medical treatments can yield substantial benefits when nutritional status is adequate but may also generate secondary effects or complications depending on the stage of disease [84].
One of the most common complications of this type of treatment is the increased prevalence of malnutrition [83]. This may be due to high predisposition in oncological treatment (chemotherapy and radiotherapy) related to gastrointestinal toxicity such as oral mucositis, constipation, esophagitis, intestinal perforations, hypertransaminasemia and the presence of diarrhea [85]. Among the most frequent gastrointestinal toxicities is chemotherapy- or radiotherapy-induced diarrhea. The NCI classifies diarrhea-related adverse events as follows: grade 1 (up to four stools per day), grade 2 (four to six stools per day), grade 3 (seven or more stools per day), and grade 4 (life-threatening consequences). This treatment-induced toxicity disrupts the intestinal microbiota, which in turn indirectly compromises nutritional status [86].
This alteration of the intestinal microbiota, induced by chemotherapeutic agents and exposure to radiotherapy [85], is referred to as intestinal dysbiosis. It is typically manifested through gastrointestinal symptoms such as diarrhea, abdominal pain, and abdominal distension. Therefore, a nutritional strategy would be to supplement with probiotics (live microorganisms) that provide immunological and non-immunological benefits with respect to the lymphoid tissue associated with the intestinal mucosa (GALT) in the oncologic patient submitted to medical therapies [85,86].
3.6.2. Physiological Axes and Systemic Implications of the Gut Microbiota
In addition to taxonomic and functional profiling, ecological evaluations should consider the physiological networks that connect the gut microbiota with multiple organ systems [86]. This broader viewpoint emphasizes the gut–muscle, gut–brain, and gut–liver axes, which together elucidate how microbial metabolites and community composition affect metabolic homeostasis, immune responses, and host physiology, essential elements of nutritional status.
The gut–muscle axis has gained particular relevance in the context of sarcopenia, frailty, and age-related functional decline. A recent systematic review concluded that modifying the gut microbiota through bacterial depletion, fecal transplantation, probiotics, prebiotics, or SCFAs can directly alter muscle phenotype [87]. In fact, in older adults, correlations have been observed between microbial diversity and composition and parameters of muscle mass, strength, and physical performance, with some intervention studies showing functional improvements after microbiota modulation [88]. This opens up a range of possibilities that could hold therapeutic potential, although further mechanistic and interventional research is needed.
The gut–brain axis is also part of the spectrum of systemic interactions. Accumulating evidence suggests that the microbiota influences the regulation of appetite, eating behavior, common mental illnesses, immunity, and even emotional states [89,90]. This relationship is mediated by the production of microbial metabolites, neurotransmitters, and neuromodulators and through neuroendocrine or neural signaling pathways. Although still emerging, this field suggests that dysbiosis caused by dietary changes, antibiotic exposure, or chronic illness may disrupt the production of compounds such as serotonin or GABA, potentially impacting appetite, food intake, mood, anxiety, or depression [91,92].
The gut–liver axis reflects the bidirectional relationship between the gut microbiota, intestinal permeability, microbial metabolites, and hepatic functionality [93]. In states of dysbiosis, increased intestinal permeability can facilitate the translocation of endotoxins into the portal circulation, thereby exacerbating liver inflammation, insulin resistance, and metabolic dysfunction and contributing to the development or progression of diseases such as fatty liver disease, dyslipidemia, or metabolic syndrome [94,95,96,97]. Although direct studies in humans are still limited, this mechanism is consistent with recent theories linking the gut microbiota, lipid metabolism, chronic inflammation, and nutritional impairment.
Dietary patterns, meal timing, sleep habits, and circadian rhythm can alter the composition and functional diversity of the gut microbiota [98]. This, in turn, affects metabolic regulation, microbial metabolite production, and inflammation, potentially predisposing individuals to metabolic, liver, and inflammatory disorders [99]. Therefore, for a comprehensive ecological assessment, it is essential to consider not only “what is eaten” but also “when and how” it is consumed. Incorporating chrononutritional variables, meal timing, sleep patterns, and lifestyle behaviors provides a more accurate understanding of microbiota-mediated influences on nutritional health [100,101,102,103].
In clinical and community settings, the ecological dimension supports multiple applications, including screening for dysbiosis, guiding the use of prebiotic and probiotic strategies, tailoring fiber intake to optimize gut microbial balance, and managing treatment-related gastrointestinal toxicity, particularly in oncology and other high-risk populations. Additionally, this field informs community-level dietary interventions aimed at promoting microbial diversity and improving long-term digestive and metabolic health.
Within the ABCDEFG framework, alterations in gut microbiota composition modify the clinical interpretation of dietary intake, biochemical markers, and anthropometric indicators. Similar nutritional profiles may therefore reflect distinct metabolic or inflammatory states when dysbiosis, recent antibiotic exposure, or impaired gastrointestinal function are present, leading to different diagnostic priorities and targeted interventions focused on microbiota modulation rather than solely on nutrient quantity or caloric intake.
3.7. Functional Assessment
Functional assessment refers to the evaluation of muscle strength, physical performance, mobility, and functional reserve as indicators of nutritional status.
Functional assessment is a key component in the evaluation of nutritional status and in the follow-up of nutritional interventions, since loss of muscle function is an essential feature in malnutrition, and its recovery is an indicator of nutritional improvement [104]. It has been reported that functional status on admission to intensive care units (ICU) is an independent predictor of mortality, especially in cancer patients [105,106].
Within the functional dimension, relevant indicators include HGS measured by dynamometry, habitual gait speed, the Short Physical Performance Battery (SPPB), the Timed Up and Go (TUG) test, knee extension strength assessments, and tongue strength as a marker of oral and swallowing function [107].
3.7.1. Techniques to Measure Muscle Strength and Function
- Muscle Strength
Muscle strength is defined as the ability of a muscle or group of muscles to exert tension against a resistance in a given movement and at a given execution speed [108,109].
The most commonly used test is HGS dynamometry. HGS is a useful indicator of general health status and, specifically, of early mortality from any cardiovascular cause, as well as disability [110,111]. The Academy of Nutrition and Dietetics and the American Society for Parenteral and Enteral Nutrition recommend the use of HGS to document impaired physical function, depending on the patient’s circumstances [112].
Other muscle strength indicators include knee flexion/extension and tongue strength, which are described in Table 11.
Table 11.
Indicators of muscle strength and their clinical use.
- Muscle Function
Muscle function tests are sensitive indicators of nutritional status and effective tools for monitoring nutritional interventions [126]. Muscle functional capacity in the context of nutritional assessment can be assessed by physical tests and structured questionnaires.
Gait velocity (GV) is a valid, reliable, and sensitive measure of functional capacity, commonly used to assess general health in various populations. Research has shown that older adults with overweight or obesity and slower gait speed are more likely to have nutritional risks, such as inadequate dietary intake [128]. A common variant of this measure is the four-meter gait speed test, which has established protocols and normative values for adults [129].
3.7.2. Physical Performance
Physical performance is a key component in the assessment of nutritional status due to its ability to capture the integrated effects of nutrition, metabolism, and overall health on an individual’s capacity to perform daily activities. Evaluating physical performance therefore provides a dynamic understanding of how nutrition influences functional independence, recovery potential, and quality of life, particularly in aging or clinically compromised populations [130,131].
- Short Physical Performance Battery
The SPPB (Figure 7) is an objective tool to assess three domains (balance, repeated rising from a chair, and gait speed) of lower-extremity physical function [132]. Scores on this tool are associated with several adverse health outcomes, including mortality [133].
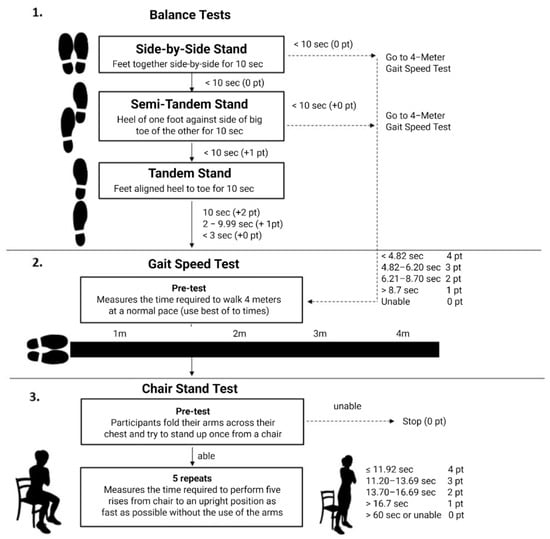
Figure 7.
Short Physical Performance Battery (SPPB). The figure depicts the standardized assessment of physical performance through three components: (1) balance tests (side-by-side, semi-tandem, and tandem stands), (2) gait speed over 4 m, and (3) the chair stand test. Each component is scored from 0 to 4 points, yielding a total score of 0–12 points that reflects lower-extremity function, frailty, and mobility status in older adults [132].
3.7.3. Timed up and Go Test
The Timed Up and Go (TUG) test evaluates mobility in older adults [134]. Also, TUG has been used to assess functional mobility [135] and as a predictor of falls and mortality. The test requires the participant to stand up from a chair, walk three meters around an obstacle, return, and sit down again. A completion time greater than 13.5 s has been proposed as a threshold for predicting fall risk in community-dwelling older adults, though this predictive value depends on the individual’s physical condition and is more relevant for those with lower functional capacity [136].
In clinical and community contexts, the functional dimension (F) plays a central role in frailty screening, the diagnosis and longitudinal monitoring of sarcopenia, and the planning of targeted rehabilitation strategies aimed at restoring or preserving functional capacity. Moreover, functional indicators are essential for community-based fall-risk surveillance, supporting early identification of mobility decline and guiding preventive interventions to maintain independence and quality of life.
Within the ABCDEFG framework, functional impairment modifies the clinical relevance of anthropometric or biochemical findings, prioritizing interventions aimed at restoring physical performance, muscle strength, and functional reserve rather than focusing exclusively on body composition correction or isolated nutrient deficits.
3.8. Genetics
- Genetic Tests and Their Influence on Nutritional Status
Genetics component assesses the genetic variations influencing nutrient metabolism, dietary response, disease susceptibility, and personalized nutrition strategies.
Nutrigenetics influences health and can condition the nutritional status of an individual [137], which is why it is essential to adhere to this parameter in nutritional assessment; knowledge of genetic variants allows the personalization of a food plan [138]. In the genetic dimension, key indicators include SNP panels involving genes such as MTHFR, APOE, FTO, and VDR; variants associated with food intolerances, such as those determining lactose persistence; and metabolic gene variants that influence nutrient utilization and dietary response. Table 12 details the genetic tests and their influence on nutritional status.
Table 12.
Genetic Tests and Their Influence on Nutritional Status.
The incorporation of genetic testing into nutritional practice has shown mixed results [139]. Some studies indicate that genetic information can motivate dietary changes, such as reducing sodium and alcohol consumption in individuals with high-risk genetic variants. However, overall evidence on the effectiveness of integrating genotyping into nutritional counseling remains limited and of variable quality [141].
A recent systematic review of randomized controlled trials evaluated the impact of personalized nutrition (including genetic information) on diet, physical activity, and health outcomes [142]. Despite the good methodological quality of the trials, consistent benefits were scarce. Positive effects were observed in reducing salt intake and, in some cases, improvements in fat consumption patterns. However, changes in parameters such as weight, lipid markers, or quality of life were generally inconsistent or not significant. In addition, the trials were mainly conducted in North American and European populations, which limits their global applicability.
On the other hand, nutrigenetics and nutrigenomics offer promising conceptual frameworks for understanding how genetic variants affect nutrient response and how diet can modulate gene expression [143,144]. Some studies identify variants related to lipid, caffeine, and sodium metabolism [145,146].
Within clinical and community settings, the genetic assessment supports personalized dietary recommendations by identifying genetic variants that influence nutrient metabolism, food tolerances, and individual dietary responses. This information helps uncover metabolic susceptibilities, guide specific nutrient requirements, and tailor interventions to optimize health outcomes. Additionally, genomic insights contribute to long-term risk reduction strategies by informing preventive nutrition approaches that account for inherited predispositions to chronic diseases.
4. Discussion
The findings of this narrative review demonstrate that the ABCDEFG framework represents a significant conceptual evolution in nutritional assessment, providing a multidimensional perspective that bridges classical and emerging methodologies. This expanded model addresses several limitations of the traditional ABCD approach, which, despite its extensive use in clinical and public health contexts, often fails to capture the complexity of nutritional alterations influenced by environmental, functional, and molecular factors. Similar perspectives have been highlighted in the recent literature, emphasizing the transition from descriptive to integrative nutritional evaluation models [147,148].
Anthropometry remains the cornerstone of nutritional assessment due to its accessibility, cost-effectiveness, and validated clinical value [149]. However, new approaches such as kinanthropometry have refined its analytical capacity, enabling the estimation of five-component body composition models (adipose, muscular, skeletal, skin, and residual mass) with standardized ISAK protocols [150]. Recent evidence also supports the complementary use of BIA and MU as precise, non-invasive methods to assess muscle quality and detect sarcopenia [17]. Şengül Ayçiçek et al. (2025) have demonstrated strong correlations between rectus femoris thickness and functional parameters such as HGS and gait velocity [151]. Together, these findings underscore the need to jointly assess structural and physiological parameters when predicting clinical outcomes and monitoring recovery.
Biochemical assessment provides objective insights into metabolic and nutritional states. Current research supports the integration of inflammatory and protein markers—such as CRP, albumin, and prealbumin—to improve sensitivity in detecting protein-energy malnutrition and systemic inflammation [21,152]. The inclusion of renal function and micronutrient biomarkers aligns with current European Society of Clinical Nutrition and Metabolism (ESPEN) [153] and American Society for Parenteral and Enteral Nutrition (ASPEN) [154] recommendations that advocate for multidimensional biochemical panels in clinical nutrition practice.
Similarly, the identification of clinical signs associated with nutrient deficiencies remains essential. This synthesis converges with the evidence presented by Milbar et al. [155], who noted that physical signs, though nonspecific, gain diagnostic value when correlated with biochemical and dietary data [30].
The integration of NDIs within the dietary assessment dimension substantially expands the interpretive capacity of the ABCDEFG framework. NDIs represent a clinically relevant interface in which medications may alter nutrient absorption, metabolism, distribution, and excretion, while nutrients may influence drug pharmacokinetics and therapeutic efficacy [60]. These bidirectional effects are particularly relevant in individuals with chronic diseases, multimorbidity, or polypharmacy, where NDIs can distort the apparent dietary adequacy, mask nutrient deficiencies, precipitate metabolic imbalances, or modify the expected response to nutritional interventions. Consequently, dietary data cannot be fully interpreted without accounting for concurrent pharmacological exposures. By incorporating NDIs into routine assessment, the ABCDEFG model strengthens the link between dietary behavior, biochemical and functional markers, therapeutic effectiveness, and patient safety, thereby enhancing its clinical relevance and rigor.
According to the ecological component, it represents one of the most innovative contributions of the ABCDEFG model. Gut microbiota composition is now recognized as a determinant of energy homeostasis, immune modulation, and nutrient bioavailability [156]. This review highlights the utility of combining sequencing techniques (16S rRNA and shotgun metagenomics) with screening tools such as the Dys-R questionnaire for the identification of dysbiosis risk. Nevertheless, as other authors note [157], the lack of standardized bioinformatic pipelines and reference values continues to hinder the translation of microbiome analysis into routine nutritional practice.
Functional assessment through HGS, gait speed, and the SPPB provides a dynamic evaluation of nutritional and physiological integrity. Consistent with previous studies, our synthesis supports that muscle strength and physical performance are independent predictors of frailty, morbidity, and mortality [158]. The integration of these measures within the nutritional assessment process enhances the capacity to identify early functional impairment and evaluate the efficacy of interventions.
Finally, the genomic and nutrigenomic component introduces a precision-oriented perspective, acknowledging genetic variability as a determinant of nutrient metabolism and dietary response. Genetic polymorphisms in FTO, MTHFR, APOE, and VDR genes have been associated with differential responses to lipid intake, folate metabolism, and vitamin D utilization. However, despite the theoretical appeal, systematic reviews report inconsistent findings regarding the clinical utility of nutrigenetic testing [159]. The present review agrees with those authors in recommending further multicenter research to validate the predictive power and ethical applicability of genetic tests in routine nutritional care [140]. Additionally, ethical considerations must be considered to guarantee the right of access and user protection in direct-to-consumer genetic testing (DTC-GT) to avoid ethical issues such as professional training, consumers/recipients’ dilemmas, and DTC-GT positions [160]. Altogether, the genomic–nutrigenomic dimension adds explanatory power to nutritional variability but still requires methodological standardization and robust clinical validation before routine incorporation into nutritional care.
Although the individual components of the ABCDEFG model are well established in clinical nutrition practice, the expanded framework itself would require staged evaluation prior to implementation as an integrated assessment tool. Future validation should include: (1) feasibility studies assessing workflow, time requirements, cost, and acceptability in clinical and community settings; (2) internal validation examining reproducibility, coherence between components, and agreement with established clinical outcomes; and (3) external validation across diverse populations, age groups, and epidemiological contexts [161,162,163,164]. These refinements provide a clear foundation for potential empirical testing while maintaining the purpose of this review as a conceptual synthesis rather than a predictive or statistical instrument.
In contrast to traditional ABCD or ABCD-plus approaches, the ABCDEFG framework is conceived as an integrative decision-making model rather than a checklist of parallel assessment components. Instead of treating ecological–microbiota (E), functional (F), and genomic/nutrigenomic (G) domains as additive extensions, this framework positions them as interacting dimensions that actively modify the interpretation, prioritization, and clinical relevance of anthropometric, biochemical, clinical, and dietary findings [165]. As a result, similar anthropometric or biochemical profiles may correspond to distinct metabolic, functional, or biological phenotypes when contextualized by functional impairment, microbiota-related alterations, or genetic susceptibility.
This systems-oriented perspective enables more nuanced diagnostic reasoning and supports personalized nutritional decision-making, particularly in complex scenarios such as aging, chronic disease, and metabolically heterogeneous populations. By explicitly integrating body composition, functional capacity, microbial ecology, and biological individuality within a unified assessment logic [166]. The ABCDEFG framework represents a conceptual evolution beyond traditional assessment models and aligns with contemporary advances in precision nutrition and integrative health.
5. Limitations
This narrative review has several limitations that should be acknowledged. First, although a comprehensive literature search was conducted across major databases, the study design did not follow a systematic review protocol; therefore, the selection of articles may have been influenced by publication bias and the authors’ judgment. Second, the heterogeneity among studies in terms of population characteristics, assessment tools, and outcome indicators limited the possibility of quantitative synthesis and direct comparison between findings.
Additionally, the proposed ABCDEFG model has not yet undergone full validation in diverse clinical and community contexts. Some of its components—particularly the ecological (microbiota) and genomic–nutrigenomic dimensions—still require standardized methodologies, reference values, and cost-effective tools to facilitate their routine use in professional practice. Future research should focus on multicenter validation studies, integration of digital technologies, and development of standardized protocols to strengthen the reliability and applicability of this comprehensive nutritional assessment framework.
6. Conclusions
Nutritional assessment remains the foundation of the Nutrition Care Process, directing diagnosis, intervention, and monitoring across clinical and community settings. Although the classical ABCD model has long been applied, it presents limitations when addressing contemporary challenges such as the double burden of malnutrition, aging populations, and the rise in chronic diseases. The expanded ABCDEFG model incorporates additional dimensions that allow for a more comprehensive and integrative evaluation, linking traditional indicators with environmental, physiological, and molecular domains. This broader framework has the potential to support more individualized and context-specific approaches to care.
Nevertheless, the evidence supporting improvements in prevention, early diagnosis, and management remains preliminary and should be interpreted with caution. Current findings highlight promising opportunities but are not yet sufficient to draw firm conclusions about its clinical effectiveness. Further validation, standardization, and testing across diverse populations and health systems are essential to strengthen its applicability and determine its true impact on clinical practice.
Supplementary Materials
The following supporting information can be downloaded at: https://www.mdpi.com/article/10.3390/app16020845/s1.
Author Contributions
R.Z.-V.: Conceptualization, research, writing—original draft, revising and editing. C.A.-P.: Research, writing, editing and revision. W.D.G.C.: Research, writing. L.D.D.B.: Research, writing. M.E.H.-F.: Research, writing. L.M.B.G.: Research, writing. P.E.R.-O. and V.B.: Research, writing. D.R.-V.: Research, writing, editing. D.A.-M.: Research, writing, E.F.-T. and S.D.-A.: Research, writing, revising and editing. All authors have read and agreed to the published version of the manuscript.
Funding
This study was funded by ECOTEC University.
Data Availability Statement
No new data were created or analyzed in this study. Data sharing is not applicable to this article.
Acknowledgments
The authors acknowledge ECOTEC University for covering the article processing charge.
Conflicts of Interest
Author Paulo E. Recoba-Obregón was employed by Grupo Especializado de Nutrición del Perú (GENUP). The remaining authors declare that the research was conducted in the absence of any commercial or financial relationships that could be construed as a potential conflict of interest.
Abbreviations
The following abbreviations are used in this manuscript:
| R24hrs | 24-hour recall |
| ABCD | Anthropometry, Biochemical, Clinical, Dietary approaches |
| ABCDEFG | Anthropometry, Biochemical, Clinical, Dietary, Ecological–microbiota, Functional and Genomic–nutrigenomic approaches. |
| ADIME | Assessment, Diagnosis, Intervention, Monitoring and Evaluation |
| BIA | Bioelectrical impedance analysis |
| BMI | Body Mass Index |
| CANS Score | Clinical Assessment of Nutritional Status Score |
| CRP | C-Reactive Protein |
| DC | Consumption diaries |
| DYS/FQM | Dysbiosis Frequently Asked Questions Management semi-structured questionnaire |
| FC | Frequency of consumption |
| GV | Gait velocity |
| HGS | Handgrip strength |
| ISAK | International Society for the Advancement of Kinanthropometry |
| MU | Muscle ultrasound |
| NCP | Nutrition Care Process |
| NDIs | Nutrient–Drug Interactions |
| PES | Problem, Etiology, Signs and symptoms |
| SPPB | The Short Physical Performance Battery |
References
- Carbajal, Á.; Sierra, J.L.; López-Lora, L.; Ruperto, M. Nutrition Care Process: Elements for its implementation and use by Nutrition and Dietetics Professionals. Rev. Esp. Nutr. Hum. Diet. 2020, 24, 172–186. [Google Scholar] [CrossRef]
- Pérez, A.; Díaz-Muñoz, G.; Maza Moscoso, C.P.; Castro Muñoz, M.G.; Canicoba, M.; González, M.C.; Barbosa Barbosa, J.; Calvo Higuera, I.G.; Baptista, G.; Ferraresi, E.M.; et al. Nutritional care process model: Consensus for Latin America. Rev. Nutr. Clin. Metab. 2022, 5, 38–50. [Google Scholar] [CrossRef]
- Ferrand, S.; Onfray, M.P.; Medina, M.G.; Ferrand, S.; Onfray, M.P.; Medina, M.G. Update of the Clinical Nutritionist Role: Standards of Practice. Rev. Chil. Nutr. 2021, 48, 437–446. [Google Scholar] [CrossRef]
- Kiosia, A.; Dagbasi, A.; Berkley, J.; Wilding, J.; Prendergast, A.; Li, J.; Swann, J.; Mathers, J.; Kerac, M.; Morrison, D.; et al. The Double Burden of Malnutrition in Individuals: Identifying Key Challenges and Re-Thinking Research Focus. Nutr. Bull. 2024, 49, 132–145. [Google Scholar] [CrossRef]
- Phillips, M.E.; Robertson, M.D.; Bennett-Eastley, K.; Rowe, L.; Frampton, A.E.; Hart, K.H. Standard Nutritional Assessment Tools Are Unable to Predict Loss of Muscle Mass in Patients Due to Undergo Pancreatico-Duodenectomy: Highlighting the Need for Detailed Nutritional Assessment. Nutrients 2024, 16, 1269. [Google Scholar] [CrossRef]
- Almeida, J.M.G.; García, C.G.; Aguilar, I.M.V.; Castañeda, V.B.; Guerrero, D.B. Morphofunctional Assessment of Patient’s Nutritional Status: A Global Approach. Nutr. Hosp. 2021, 38, 592–600. [Google Scholar] [CrossRef]
- Hoover-Fong, J.; Semler, O.; Barron, B.; Collett-Solberg, P.F.; Fung, E.; Irving, M.; Kitaoka, T.; Koerner, C.; Okada, K.; Palm, K.; et al. Considerations for Anthropometry Specific to People with Disproportionate Short Stature. Adv. Ther. 2025, 42, 1291–1311. [Google Scholar] [CrossRef]
- Stewart, A.D. Kinanthropometry and Body Composition: A Natural Home for Three-Dimensional Photonic Scanning. J. Sports Sci. 2010, 28, 455–457. [Google Scholar] [CrossRef] [PubMed]
- Ros, F.E.; Vaquero-Cristóbal, R.; Marfell-Jones, M. Protocolo Internacional Para la Valoración Antropométrica, 2019; Sociedad Internacional para el Avance de la Cineantropometría; ISAK: Murcia, Spain, 2019; ISBN 978-84-92986-17-0. [Google Scholar]
- Marfell-Jones, M.; Vaquero-Cristóbal, R.; Ros, F.E. ISAK Accreditation Handbook (2024); International Society for the Advancement of Kinanthropometry (ISAK): Murcia, Spain, 2024; ISBN 978-84-16045-25-9. [Google Scholar]
- Zambrano-Villacres, R.; Frias-Toral, E.; Maldonado-Ponce, E.; Poveda-Loor, C.; Leal, P.; Velarde-Sotres, A.; Leonardi, A.; Trovato, B.; Roggio, F.; Castorina, A.; et al. Exploring Body Composition and Somatotype Profiles among Youth Professional Soccer Players. Mediterr. J. Nutr. Metab. 2024, 17, 241–254. [Google Scholar] [CrossRef]
- Esparza, M.; Vaquero, R.; Castillo, A.; Ponce, F.; Mecherques, M.; Baglietto, N. ISAK Metry 2025. Available online: https://isakmetry.com/ (accessed on 8 June 2025).
- Martínez-Mireles, X.; Nava-González, E.J.; López-Cabanillas Lomelí, M.; Puente-Hernández, D.S.; Gutiérrez-López, M.; Lagunes-Carrasco, J.O.; López-García, R.; Ramírez, E. The Shape of Success: A Scoping Review of Somatotype in Modern Elite Athletes Across Various Sports. Sports 2025, 13, 38. [Google Scholar] [CrossRef]
- Cintoni, M.; Rinninella, E.; Ainora, M.E.; Raoul, P.C.; Strippoli, A.; Pozzo, C.; Trovato, G.; Graziano, R.; Palombaro, M.; Pulcini, G.; et al. Concordance between Muscle Ultrasound and Bioelectrical Impedance Analysis for Muscle Assessment in Gastric Cancer Patients: A Prospective Study. Clin. Nutr. ESPEN 2025, 69, 1022. [Google Scholar] [CrossRef]
- Ozturk, Y.; Koca, M.; Burkuk, S.; Unsal, P.; Dikmeer, A.; Oytun, M.; Bas, A.O.; Kahyaoglu, Z.; Deniz, O.; Coteli, S.; et al. The Role of Muscle Ultrasound to Predict Sarcopenia. Nutrition 2022, 101, 111692. [Google Scholar] [CrossRef]
- Ogawa, M.; Matsumoto, T.; Harada, R.; Yoshikawa, R.; Ueda, Y.; Takamiya, D.; Sakai, Y. Reliability and Validity of Quadriceps Muscle Thickness Measurements in Ultrasonography: A Comparison with Muscle Mass and Strength. Prog. Rehabil. Med. 2023, 8, 20230008. [Google Scholar] [CrossRef]
- Zanotelli, A.; Rossi, A.P.; Del Monte, L.; Vantini, G.; Stabile, G.; Urbani, S.; Giani, A.; Zoico, E.; Babbanini, A.; Fantin, F.; et al. The Role of Combined Muscle Ultrasound and Bioimpedentiometry Parameters for Sarcopenia Diagnosis in a Population of Hospitalized Older Adults. Nutrients 2024, 16, 2429. [Google Scholar] [CrossRef]
- Costa Goes, A.; Santos, M.A.; Oliveira, R.S.; Oliveira, J.S.; Carneiro Roriz, A.; De Oliveira, C. The Use of Bioelectrical Impedance Vector Analysis for a Nutritional Evaluation of Older Adults in the Community. Exp. Gerontol. 2021, 147, 111276. [Google Scholar] [CrossRef] [PubMed]
- Brunani, A.; Perna, S.; Soranna, D.; Rondanelli, M.; Zambon, A.; Bertoli, S.; Vinci, C.; Capodaglio, P.; Lukaski, H.; Cancello, R. Body Composition Assessment Using Bioelectrical Impedance Analysis (BIA) in a Wide Cohort of Patients Affected with Mild to Severe Obesity. Clin. Nutr. 2021, 40, 3973–3981. [Google Scholar] [CrossRef] [PubMed]
- Keller, U. Nutritional Laboratory Markers in Malnutrition. J. Clin. Med. 2019, 8, 775. [Google Scholar] [CrossRef]
- Wunderle, C.; Stumpf, F.; Schuetz, P. Inflammation and Response to Nutrition Interventions. JPEN J. Parenter. Enteral Nutr. 2024, 48, 27–36. [Google Scholar] [CrossRef]
- Jarvis, P.R.E.; Cardin, J.L.; Nisevich-Bede, P.M.; McCarter, J.P. Continuous Glucose Monitoring in a Healthy Population: Understanding the Post-Prandial Glycemic Response in Individuals without Diabetes Mellitus. Metabolism 2023, 146, 155640. [Google Scholar] [CrossRef] [PubMed]
- Picó, C.; Serra, F.; Rodríguez, A.M.; Keijer, J.; Palou, A. Biomarkers of Nutrition and Health: New Tools for New Approaches. Nutrients 2019, 11, 1092. [Google Scholar] [CrossRef]
- Kamel, K.S.; Halperin, M.L. Use of Urine Electrolytes and Urine Osmolality in the Clinical Diagnosis of Fluid, Electrolytes, and Acid-Base Disorders. Kidney Int. Rep. 2021, 6, 1211–1224. [Google Scholar] [CrossRef]
- Powers, H. Approaches to Setting Dietary Reference Values for Micronutrients, and Translation into Recommendations. Proc. Nutr. Soc. 2021, 80, 365–372. [Google Scholar] [CrossRef] [PubMed]
- Jenab, M.; Slimani, N.; Bictash, M.; Ferrari, P.; Bingham, S. Biomarkers in Nutritional Epidemiology: Applications, Needs and New Horizons. Hum. Genet. 2009, 125, 507–525. [Google Scholar] [CrossRef]
- Urdampilleta, A.; López-Grueso, R.; Martínez-Sanz, J.M.; Mielgo-Ayuso, J. Parámetros bioquímicos básicos, hematológicos y hormonales para el control de la salud y el estado nutricional en los deportistas. Rev. Esp. Nutr. Hum. Diet. 2014, 18, 155–171. [Google Scholar] [CrossRef]
- Hummell, A.C.; Cummings, M. Role of the Nutrition-focused Physical Examination in Identifying Malnutrition and Its Effectiveness. Nutr. Clin. Pract. 2022, 37, 41–49. [Google Scholar] [CrossRef]
- Cáceres-Vinueza, S.; Frias-Toral, E.; Suárez, R.; Daher-Nader, J.; Flor-Muñoz, E.; Márquez-Vinueza, M.; Guevara-Flores, L.V.; Duarte-Vera, Y. Anthropometric indexes and cardiovascular risk in Ecuadorian university students: A comparison with international references. Revis Bionatura 2023, 8, 89. [Google Scholar]
- Reber, E.; Gomes, F.; Vasiloglou, M.F.; Schuetz, P.; Stanga, Z. Nutritional Risk Screening and Assessment. J. Clin. Med. 2019, 8, 1065. [Google Scholar] [CrossRef]
- Park, S.E.; Williams, M.; Crew, A.B.; Hsiao, J.L. Cutaneous Signs of Nutritional Deficiencies. Curr. Geriatr. Rep. 2024, 13, 189–199. [Google Scholar] [CrossRef]
- Singh, P.; Seth, A. From Kwashiorkor to Edematous Malnutrition. Indian Pediatr. 2018, 54, 763–764. [Google Scholar] [CrossRef] [PubMed]
- Kolarš, B.; Mijatović Jovin, V.; Živanović, N.; Minaković, I.; Gvozdenović, N.; Dickov Kokeza, I.; Lesjak, M. Iron Deficiency and Iron Deficiency Anemia: A Comprehensive Overview of Established and Emerging Concepts. Pharmaceuticals 2025, 18, 1104. [Google Scholar] [CrossRef]
- East, P.; Doom, J.R.; Blanco, E.; Burrows, R.; Lozoff, B.; Gahagan, S. Iron Deficiency in Infancy and Neurocognitive and Educational Outcomes in Young Adulthood. Dev. Psychol. 2021, 57, 962–975. [Google Scholar] [CrossRef]
- West, K. Vitamin A Deficiency Disorders in Children and Women. Food Nutr. Bull. 2003, 24, S78–S90. [Google Scholar] [CrossRef]
- Imdad, A.; Mayo-Wilson, E.; Herzer, K.; Bhutta, Z. Vitamin A Supplementation for Preventing Morbidity and Mortality in Children from Six Months to Five Years of Age. Cochrane Database Syst. Rev. 2017, 3, CD008524. [Google Scholar] [CrossRef]
- Alberts, A.; Moldoveanu, E.-T.; Niculescu, A.-G.; Grumezescu, A.M. Vitamin C: A Comprehensive Review of Its Role in Health, Disease Prevention, and Therapeutic Potential. Molecules 2025, 30, 748. [Google Scholar] [CrossRef]
- Granger, M.; Eck, P. Dietary Vitamin C in Human Health. Adv. Food Nutr. Res. 2018, 83, 281–310. [Google Scholar] [CrossRef] [PubMed]
- Li, K.; Wang, X.-F.; Li, D.-Y.; Chen, Y.-C.; Zhao, L.-J.; Liu, X.-G.; Guo, Y.-F.; Shen, J.; Lin, X.; Deng, J.; et al. The Good, the Bad, and the Ugly of Calcium Supplementation: A Review of Calcium Intake on Human Health. Clin. Interv. Aging 2018, 13, 2443–2452. [Google Scholar] [CrossRef] [PubMed]
- Shertukde, S.; Cahoon, D.; Prado, B.; Cara, K.; Chung, M. Calcium Intake and Metabolism in Infants and Young Children: A Systematic Review of Balance Studies for Supporting the Development of Calcium Requirements. Adv. Nutr. 2022, 13, 1529–1553. [Google Scholar] [CrossRef] [PubMed]
- Fleet, J. Vitamin D-Mediated Regulation of Intestinal Calcium Absorption. Nutrients 2022, 14, 3351. [Google Scholar] [CrossRef]
- Eidelberg, A.; Newberry, C. Dietary Composition and Nutritional Deficiencies. In Nutrition, Weight, and Digestive Health, The Clinician’s Desk Reference; Springer: Cham, Switzerland, 2022; pp. 29–41. ISBN 978-3-030-94953-2. [Google Scholar]
- Esper, D. Utilization of Nutrition-Focused Physical Assessment in Identifying Micronutrient Deficiencies. Nutr. Clin. Pract. 2015, 30, 194–202. [Google Scholar] [CrossRef]
- Hamilton, C.; Jevenn, A.; Hipskind, P.; Galand, M.; Pogatschnik, C. Nutrition-Focused Physical Exam for Adults: An Illustrated Handbook, 2nd ed.; American Society for Parenteral and Enteral Nutrition (ASPEN): Silver Spring, MD, USA, 2022; ISBN 978-1-889622-50-7. [Google Scholar]
- Armaza Cespedes, A.; Medina, B.M.; Gareca, E.; Dorado R, C.; Mamani Ortiz, Y.; Romero Marca, D.J. Utilidad del CANs SCORE para valoración clínica del estado nutricional del recién nacido. Gac. Médica Boliv. 2021, 44, 6–13. [Google Scholar] [CrossRef]
- Bates, C.; Bogin, B.; Holmes, B. Nutritional Assessment Methods. In Human Nutrition; Oxford University Press: Oxford, UK, 2017; pp. 613–646. ISBN 978-0-19-876802-9. [Google Scholar]
- Dao, M.; Subar, A.; Warthon-Medina, M.; Cade, J.; Burrows, T.; Golley, R.; Forouhi, N.; Pearce, M.; Holmes, B. Dietary Assessment Toolkits: An Overview. Public Health Nutr. 2018, 22, 404–418. [Google Scholar] [CrossRef] [PubMed]
- Ortega, R.M.; Pérez-Rodrigo, C.; López-Sobaler, A.M. Métodos de evaluación de la ingesta actual: Registro o diario diétetico. Rev. Esp. Nutr. Comunitaria 2015, 21, 34–41. [Google Scholar] [CrossRef]
- FAO. Dietary Assessment: A Resource Guide to Method Selection and Application in Low Resource Settings; Food and Agriculture Organization of the United Nations: Rome, Italy, 2018; Available online: https://www.fao.org/4/i0351e/i0351e12.pdf (accessed on 3 June 2025).
- Pérez Rodrigo, C.; Aranceta, J.; Salvador, G.; Varela-Moreiras, G. Food Frequency Questionnaires. Nutr. Hosp. 2015, 31, 49–56. [Google Scholar] [CrossRef]
- Burke, B.S. The Dietary History as a Tool in Research. J. Am. Diet. Assoc. 1947, 23, 1041–1046. [Google Scholar] [CrossRef]
- Salvador Castell, G.; Serra-Majem, L.; Ribas-Barba, L. What and How Much Do We Eat? 24-Hour Dietary Recall Method. Nutr. Hosp. 2015, 31, 46–48. [Google Scholar] [CrossRef]
- Ovaskainen, M.; Paturi, M.; Reinivuo, H.; Hannila, M.; Sinkko, H.; Lehtisalo, J.; Pynnönen-Polari, O.; Männistö, S. Accuracy in the Estimation of Food Servings against the Portions in Food Photographs. Eur. J. Clin. Nutr. 2008, 62, 674–681. [Google Scholar] [CrossRef]
- Amoutzopoulos, B.; Page, P.; Roberts, C.; Roe, M.; Cade, J.; Steer, T.; Baker, R.; Hawes, T.; Galloway, C.; Yu, D.; et al. Portion Size Estimation in Dietary Assessment: A Systematic Review of Existing Tools, Their Strengths and Limitations. Nutr. Rev. 2020, 78, 885–900. [Google Scholar] [CrossRef] [PubMed]
- Herrera, M.; Chisaguano, M.; Vayas-Rodriguez, G.; Crsipim, S. Manual Fotografico de Porciones Para Cuantificacion Alimentaria—Ecuador; Primera, Ed.; USFQ-Press: Quito, Ecuador, 2019; ISBN 978-9978-68-142-8. [Google Scholar]
- Herrera, M.E.; Chisaguano, M.; Rodríguez, G.V.; Crispim, S.P. Manual Fotográfico de Porciones Para Cuantificación Alimentaria del Ecuador, 2nd ed.; USFQ Press: Quito, Ecuador, 2022; ISBN 978-9978-68-205-0. [Google Scholar]
- Ortiz, J.; Rubio, G.; Donoso, S.; Ochoa-Avilés, A. Tabla de Composición de Alimentos, Cuenca—Ecuador 2018; Universidad de Cuenca: Cuenca, Ecuador, 2018; ISBN 978-9978-14-383-4. [Google Scholar]
- Herrera-Fontana, M.; Chisaguano, A.; Jumbo, J.; Castro, N.; Anchundia, A. Tabla de Composición Química de los Alimentos: Basada en Nutrientes de Interés Para la Población Ecuatoriana; Primera, Ed.; USFQ Press: Quito, Ecuador, 2021. [Google Scholar]
- D’Alessandro, C.; Benedetti, A.; Di Paolo, A.; Giannese, D.; Cupisti, A. Interactions between Food and Drugs, and Nutritional Status in Renal Patients: A Narrative Review. Nutrients 2022, 14, 212. [Google Scholar] [CrossRef]
- Boullata, J.I.; Hudson, L.M. Drug–Nutrient Interactions: A Broad View with Implications for Practice. J. Acad. Nutr. Diet. 2012, 112, 506–517. [Google Scholar] [CrossRef] [PubMed]
- Sajedah Yassin Al-Shbeeb, A.A.A.; Fatimah Hussein Alhajji, A.S.M.A. Impact of Drug Nutrient Interaction on Chronic Disease: Roles of Pharmacy, Nursing, Nutrition|Migration Letters. Migr. Lett. 2022, 19, 319–324. [Google Scholar] [CrossRef]
- Dragan, S.; Man, D.; Kundnani, N.R. Nutrient-Drug Interactions and Cardiotoxicity in Oncologic Patients. In Cardiovascular Toxicity; Springer: Cham, Switzerland, 2025; pp. 361–383. ISBN 978-3-031-90598-8. [Google Scholar]
- Okunji, P.; Johnson, A. Food-Drug Interactions: Implications for Nursing Practice. Nurs. Healthc. Int. J. 2017, 1, 000102. [Google Scholar] [CrossRef]
- Matthewman, C.; Narin, A.; Huston, H.; Hopkins, C.E. Systems to Model the Personalized Aspects of Microbiome Health and Gut Dysbiosis. Mol. Asp. Med. 2023, 91, 101115. [Google Scholar] [CrossRef]
- Fox, J.D.; Sims, A.; Ross, M.; Bettag, J.; Wilder, A.; Natrop, D.; Borsotti, A.; Kolli, S.; Mehta, S.; Verma, H.; et al. Bioinformatic Methodologies in Assessing Gut Microbiota. Microbiol. Res. 2024, 15, 2554–2574. [Google Scholar] [CrossRef] [PubMed]
- Babraham Bioinformatics. FastQC. Available online: https://www.bioinformatics.babraham.ac.uk/projects/fastqc/ (accessed on 23 October 2025).
- Bolger, A.M.; Lohse, M.; Usadel, B. Trimmomatic: A Flexible Trimmer for Illumina Sequence Data. Bioinformatics 2014, 30, 2114–2120. [Google Scholar] [CrossRef]
- Quast, C.; Pruesse, E.; Yilmaz, P.; Gerken, J.; Schweer, T.; Yarza, P.; Peplies, J.; Glöckner, F.O. The SILVA Ribosomal RNA Gene Database Project: Improved Data Processing and Web-Based Tools. Nucleic Acids Res. 2013, 41, D590–D596. [Google Scholar] [CrossRef]
- McDonald, D.; Price, M.; Goodrich, J.; Nawrocki, E.; DeSantis, T.; Probst, A.; Andersen, G.; Knight, R.; Hugenholtz, P. An Improved Greengenes Taxonomy with Explicit Ranks for Ecological and Evolutionary Analyses of Bacteria and Archaea. ISME J. 2012, 6, 610–618. [Google Scholar] [CrossRef] [PubMed]
- Parks, D.H.; Chuvochina, M.; Rinke, C.; Mussig, A.J.; Chaumeil, P.-A.; Hugenholtz, P. GTDB: An Ongoing Census of Bacterial and Archaeal Diversity through a Phylogenetically Consistent, Rank Normalized and Complete Genome-Based Taxonomy. Nucleic Acids Res. 2022, 50, D785–D794. [Google Scholar] [CrossRef] [PubMed]
- Prodan, A.; Tremaroli, V.; Brolin, H.; Zwinderman, A.H.; Nieuwdorp, M.; Levin, E. Comparing Bioinformatic Pipelines for Microbial 16S rRNA Amplicon Sequencing. PLoS ONE 2020, 15, e0227434. [Google Scholar] [CrossRef]
- Milani, C.; Lugli, G.A.; Fontana, F.; Mancabelli, L.; Alessandri, G.; Longhi, G.; Anzalone, R.; Viappiani, A.; Turroni, F.; van Sinderen, D.; et al. METAnnotatorX2: A Comprehensive Tool for Deep and Shallow Metagenomic Data Set Analyses. mSystems 2021, 6, 10–1128. [Google Scholar] [CrossRef]
- Galloway-Peña, J.; Hanson, B. Tools for Analysis of the Microbiome. Dig. Dis. Sci. 2020, 65, 674–685. [Google Scholar] [CrossRef]
- Beghini, F.; McIver, L.J.; Blanco-Míguez, A.; Dubois, L.; Asnicar, F.; Maharjan, S.; Mailyan, A.; Manghi, P.; Scholz, M.; Thomas, A.M.; et al. Integrating Taxonomic, Functional, and Strain-Level Profiling of Diverse Microbial Communities with bioBakery 3. eLife 2021, 10, e65088. [Google Scholar] [CrossRef]
- Langille, M.G.I.; Zaneveld, J.; Caporaso, J.G.; McDonald, D.; Knights, D.; Reyes, J.A.; Clemente, J.C.; Burkepile, D.E.; Vega Thurber, R.L.; Knight, R.; et al. Predictive Functional Profiling of Microbial Communities Using 16S rRNA Marker Gene Sequences. Nat. Biotechnol. 2013, 31, 814–821. [Google Scholar] [CrossRef]
- Kers, J.G.; Saccenti, E. The Power of Microbiome Studies: Some Considerations on Which Alpha and Beta Metrics to Use and How to Report Results. Front. Microbiol. 2022, 12, 796025. [Google Scholar] [CrossRef] [PubMed]
- Mensah, G.; Maseng, M.; Allard, S.; Gilbert, J. The Microbiome, Metabolism, and Networks in Precision Nutrition. In Precision Nutrition; Academic Press: Cambridge, MA, USA, 2024; pp. 91–142. ISBN 978-0-443-15315-0. [Google Scholar]
- Nayman, E.; Schwartz, B.; Polanco, F.; Firek, A.; Gumabong, A.; Hofstee, N.; Narasimhan, G.; Cickovski, T.; Mathee, K. Microbiome Depiction through User-Adapted Bioinformatic Pipelines and Parameters. J. Med. Microbiol. 2023, 72. [Google Scholar] [CrossRef] [PubMed]
- Balmant, B.D.; Fonseca, D.C.; Rocha, I.M.; Callado, L.; Torrinhas, R.S.M.d.M.; Waitzberg, D.L. Dys-R Questionnaire: A Novel Screening Tool for Dysbiosis Linked to Impaired Gut Microbiota Richness. Nutrients 2023, 15, 4261. [Google Scholar] [CrossRef]
- Lloyd-Price, J.; Abu-Ali, G.; Huttenhower, C. The Healthy Human Microbiome. Genome Med. 2016, 8, 51. [Google Scholar] [CrossRef] [PubMed]
- Willing, B.; Russell, S.; Finlay, B. Shifting the Balance: Antibiotic Effects on Host-Microbiota Mutualism. Nat. Rev. Microbiol. 2011, 9, 233–243. [Google Scholar] [CrossRef]
- Kase, B.E.; Liese, A.D.; Zhang, J.; Murphy, E.A.; Zhao, L.; Steck, S.E. The Development and Evaluation of a Literature-Based Dietary Index for Gut Microbiota. Nutrients 2024, 16, 1045. [Google Scholar] [CrossRef]
- Cháidez, Y.L.B.; Guadarrama, R.G.; Hernández, G.A.; Merino, M.V.F.; Alpizar, E.J.; Barretero, D.Y.R.; García, M.V.D. Construcción y validación de un cuestionario para medir función gastrointestinal en adultos. Nutr. Clin. Diet. Hosp. 2020, 40, 26–35. [Google Scholar] [CrossRef]
- Mariños Cotrina, B.W. Prevalencia del riesgo de desnutrición y situación de la terapia nutricional en pacientes adultos hospitalizados en Perú. Rev. Nutr. Clin. Metab. 2020, 3, 13–19. [Google Scholar] [CrossRef]
- Wang, L.; Wang, X.; Zhang, G.; Ma, Y.; Zhang, Q.; Li, Z.; Ran, J.; Hou, X.; Geng, Y.; Yang, Z.; et al. The Impact of Pelvic Radiotherapy on the Gut Microbiome and Its Role in Radiation-Induced Diarrhoea: A Systematic Review. Radiat. Oncol. 2021, 16, 187. [Google Scholar] [CrossRef]
- National Cancer Institute. National Cancer Institute’s Common Terminology Criteria for Adverse Events: Diarrheaa. Available online: https://www.ncbi.nlm.nih.gov/books/NBK65768.4/table/CDR0000062736__287/?report=objectonly (accessed on 23 October 2025).
- Barry, D.J.; Wu, S.S.X.; Cooke, M.B. The Relationship Between Gut Microbiota, Muscle Mass and Physical Function in Older Individuals: A Systematic Review. Nutrients 2024, 17, 81. [Google Scholar] [CrossRef]
- Liu, C.; Cheung, W.; Li, J.; Chow, S.; Yu, J.; Wong, S.; Ip, M.; Sung, J.; Wong, R. Understanding the Gut Microbiota and Sarcopenia: A Systematic Review. J. Cachexia Sarcopenia Muscle 2021, 12, 1393–1407. [Google Scholar] [CrossRef] [PubMed]
- Terry, S.; Barnett, J.; Gibson, D. A Critical Analysis of Eating Disorders and the Gut Microbiome. J. Eat. Disord. 2022, 10, 154. [Google Scholar] [CrossRef]
- Agus, A.; Clément, K.; Sokol, H. Gut Microbiota-Derived Metabolites as Central Regulators in Metabolic Disorders. Gut 2021, 70, 1174–1182. [Google Scholar] [CrossRef]
- Chen, Y.; Xu, J.; Chen, Y. Regulation of Neurotransmitters by the Gut Microbiota and Effects on Cognition in Neurological Disorders. Nutrients 2021, 13, 2099. [Google Scholar] [CrossRef]
- Ruiz-Pozo, V.; Tamayo-Trujillo, R.; Cadena-Ullauri, S.; Frias-Toral, E.; Guevara-Ramírez, P.; Paz-Cruz, E.; Chapela, S.; Montalván, M.; Morales-López, T.; Simancas-Racines, D.; et al. The Molecular Mechanisms of the Relationship between Insulin Resistance and Parkinson’s Disease Pathogenesis. Nutrients 2023, 15, 3585. [Google Scholar] [CrossRef] [PubMed]
- Hsu, C.; Schnabl, B. The Gut-Liver Axis and Gut Microbiota in Health and Liver Disease. Nat. Rev. Microbiol. 2023, 21, 719–733. [Google Scholar] [CrossRef]
- Muscogiuri, G.; Barrea, L.; Caprio, M.; Ceriani, F.; Chavez, A.; El Ghoch, M.; Frias-Toral, E.; Mehta, R.; Mendez, V.; Paschou, S.; et al. Nutritional Guidelines for the Management of Insulin Resistance. Crit. Rev. Food Sci. Nutr. 2022, 62, 6947–6960. [Google Scholar] [CrossRef]
- Reytor-González, C.; Annunziata, G.; Campuzano-Donoso, M.; Morales-López, T.; Basantes-Tituaña, C.; Fascì-Spurio, F.; Verde, L.; Muscogiuri, G.; Barrea, L.; Frias-Toral, E.; et al. Endocrinologist’s Crucial Role in Metabolic Dysfunction-Associated Steatotic Liver Disease: A Comprehensive Review. Minerva Endocrinol. 2025, 50, 209–226. [Google Scholar] [CrossRef] [PubMed]
- Simancas-Racines, D.; Annunziata, G.; Verde, L.; Fascì-Spurio, F.; Reytor-González, C.; Muscogiuri, G.; Frias-Toral, E.; Barrea, L. Nutritional Strategies for Battling Obesity-Linked Liver Disease: The Role of Medical Nutritional Therapy in Metabolic Dysfunction-Associated Steatotic Liver Disease (MASLD) Management. Curr. Obes. Rep. 2025, 14, 7. [Google Scholar] [CrossRef]
- Buchynskyi, M.; Kamyshna, I.; Halabitska, I.; Petakh, P.; Kunduzova, O.; Oksenych, V.; Kamyshnyi, O. Unlocking the Gut-Liver Axis: Microbial Contributions to the Pathogenesis of Metabolic-Associated Fatty Liver Disease. Front. Microbiol. 2025, 16, 1577724. [Google Scholar] [CrossRef] [PubMed]
- Choi, H.; Rao, M.; Chang, E. Gut Microbiota as a Transducer of Dietary Cues to Regulate Host Circadian Rhythms and Metabolism. Nat. Rev. Gastroenterol. Hepatol. 2021, 18, 679–689. [Google Scholar] [CrossRef] [PubMed]
- Moreira Gobis, M.d.L.; Goulart de Souza-Silva, T.; de Almeida Paula, H.A. The Impact of a Western Diet on Gut Microbiota and Circadian Rhythm: A Comprehensive Systematic Review of in Vivo Preclinical Evidence. Life Sci. 2024, 349, 122741. [Google Scholar] [CrossRef]
- Reytor-González, C.; Simancas-Racines, D.; Román-Galeano, N.M.; Annunziata, G.; Galasso, M.; Zambrano-Villacres, R.; Verde, L.; Muscogiuri, G.; Frias-Toral, E.; Barrea, L. Chrononutrition and Energy Balance: How Meal Timing and Circadian Rhythms Shape Weight Regulation and Metabolic Health. Nutrients 2025, 17, 2135. [Google Scholar] [CrossRef]
- Fuad, S.A.; Ginting, R.P.; Lee, M.-W. Chrononutrition: Potential, Challenges, and Application in Managing Obesity. Int. J. Mol. Sci. 2025, 26, 5116. [Google Scholar] [CrossRef]
- Godos, J.; Currenti, W.; Ferri, R.; Lanza, G.; Caraci, F.; Frias-Toral, E.; Guglielmetti, M.; Ferraris, C.; Lipari, V.; Carvajal Altamiranda, S.; et al. Chronotype and Cancer: Emerging Relation Between Chrononutrition and Oncology from Human Studies. Nutrients 2025, 17, 529. [Google Scholar] [CrossRef]
- Godos, J.; Rosi, A.; Scazzina, F.; Touriz Bonifaz, M.; Giampieri, F.; Abdelkarim, O.; Ammar, A.; Aly, M.; Frias-Toral, E.; Pons, J.; et al. Diet, Eating Habits, and Lifestyle Factors Associated with Adequate Sleep Duration in Children and Adolescents Living in 5 Mediterranean Countries: The DELICIOUS Project. Nutrients 2025, 17, 1242. [Google Scholar] [CrossRef]
- Serón-Arbeloa, C.; Labarta-Monzón, L.; Puzo-Foncillas, J.; Mallor-Bonet, T.; Lafita-López, A.; Bueno-Vidales, N.; Montoro-Huguet, M. Malnutrition Screening and Assessment. Nutrients 2022, 14, 2392. [Google Scholar] [CrossRef] [PubMed]
- Vigneron, C.; Laousy, O.; Chassagnon, G.; Vakalopoulou, M.; Charpentier, J.; Alexandre, J.; Jamme, M.; Pène, F. Assessment of Functional and Nutritional Status and Skeletal Muscle Mass for the Prognosis of Critically Ill Solid Cancer Patients. Cancers 2022, 14, 5870. [Google Scholar] [CrossRef]
- Fuchs-Tarlovsky, V.; Castillo Pineda, J.; Rodríguez Veintimilla, D.; Calvo Higuera, I.; Grijalva Guerrero, P.; Gómez García, A.; Frias-Toral, E.; Santana Porbén, S. Cancer-Related Malnutrition: Epidemiological Results from the Latin American Study of Malnutrition in the Oncology Practice. Nutr. Cancer 2022, 74, 2479–2488. [Google Scholar] [CrossRef]
- Russell, M.K. Functional Assessment of Nutrition Status. Nutr. Clin. Pract. 2015, 30, 211–218. [Google Scholar] [CrossRef]
- Concha-Cisternas, Y.; Petermann-Rocha, F.; Castro-Piñero, J.; Parra, S.; Albala, C.; Wyngard, V.; Vásquez, J.; Cigarroa, I.; Celis-Morales, C. Handgrip Strength as a Predictor of Adverse Health Outcomes. Rev. Med. Chile 2022, 150, 1075–1086. [Google Scholar] [CrossRef]
- Arteaga-Pazmiño, C.; Guzmán-Gurrola, A.L.; Fonseca-Pérez, D.; Galvez-Celi, J.; Aycart, D.F.; Álvarez-Córdova, L.; Frias-Toral, E. Waist–Calf Circumference Ratio Is Associated with Body Composition, Physical Performance, and Muscle Strength in Older Women. Geriatrics 2025, 10, 103. [Google Scholar] [CrossRef]
- Soysal, P.; Hurst, C.; Demurtas, J.; Firth, J.; Howden, R.; Yang, L.; Tully, M.; Koyanagi, A.; Ilie, P.; López-Sánchez, G.; et al. Handgrip Strength and Health Outcomes: Umbrella Review of Systematic Reviews with Meta-Analyses of Observational Studies. J. Sport Health Sci. 2021, 10, 290–295. [Google Scholar] [CrossRef] [PubMed]
- Kaegi-Braun, N.; Tribolet, P.; Baumgartner, A.; Fehr, R.; Baechli, V.; Geiser, M.; Deiss, M.; Gomes, F.; Kutz, A.; Hoess, C.; et al. Value of Handgrip Strength to Predict Clinical Outcomes and Therapeutic Response in Malnourished Medical Inpatients: Secondary Analysis of a Randomized Controlled Trial. Am. J. Clin. Nutr. 2021, 114, 731–740. [Google Scholar] [CrossRef]
- White, J.; Guenter, P.; Jensen, G.; Malone, A.; Schofield, M. Consensus Statement: Academy of Nutrition and Dietetics and American Society for Parenteral and Enteral Nutrition: Characteristics Recommended for the Identification and Documentation of Adult Malnutrition (Undernutrition). JPEN J. Parenter. Enteral Nutr. 2012, 36, 275–283. [Google Scholar] [CrossRef]
- Cruz-Jentoft, A.J.; Bahat, G.; Bauer, J.; Boirie, Y.; Bruyère, O.; Cederholm, T.; Cooper, C.; Landi, F.; Rolland, Y.; Sayer, A.A.; et al. Sarcopenia: Revised European Consensus on Definition and Diagnosis. Age Ageing 2019, 48, 16–31. [Google Scholar] [CrossRef] [PubMed]
- Spruit, M.; Sillen, M.; Groenen, M.; Wouters, E.; Franssen, F. New Normative Values for Handgrip Strength: Results from the UK Biobank. J. Am. Med. Dir. Assoc. 2013, 14, 775.e5–775.e11. [Google Scholar] [CrossRef]
- Baldwin, C.; Paratz, J.; Bersten, A. Muscle Strength Assessment in Critically Ill Patients with Handheld Dynamometry: An Investigation of Reliability, Minimal Detectable Change, and Time to Peak Force Generation. J. Crit. Care 2013, 28, 77–86. [Google Scholar] [CrossRef]
- Maza Moscoso, C.P.; Calvo Higuera, I.; Gómez Carrillo, A.; Abril, T.; Frías-Toral, E. Estado nutricional y disminución de fuerza muscular en pacientes hospitalizados. Rev. Bionatura 2023, 8, 1–10. [Google Scholar] [CrossRef]
- Compher, C.W.; Jensen, G.L.; Aloupis, M.; Steiber, A. Perspectives in Practice: Updates on Diagnosing Malnutrition in Adults in Clinical Settings. J. Acad. Nutr. Diet. 2025, 125, S69–S73. [Google Scholar] [CrossRef]
- Pérez-Ros, P.; Barrachina-Igual, J.; Pablos, A.; Fonfria-Vivas, R.; Cauli, O.; Martínez-Arnau, F.M. Diagnostic Accuracy of Isometric Knee Extension Strength as a Sarcopenia Criteria in Older Women. BMC Geriatr. 2024, 24, 988. [Google Scholar] [CrossRef]
- Buendía-Romero, Á.; Hernández-Belmonte, A.; Martínez-Cava, A.; García-Conesa, S.; Franco-López, F.; Conesa-Ros, E.; Courel-Ibáñez, J. Isometric Knee Extension Test: A Practical, Repeatable, and Suitable Tool for Lower-Limb Screening among Institutionalized Older Adults. Exp. Gerontol. 2021, 155, 111575. [Google Scholar] [CrossRef]
- Šarabon, N.; Kozinc, Ž.; Perman, M. Establishing Reference Values for Isometric Knee Extension and Flexion Strength. Front. Physiol. 2021, 12, 767941. [Google Scholar] [CrossRef]
- Zhang, Y.; Chen, K.; Liu, K.; Wang, Q.; Ma, Y.; Pang, B.; Huang, L.; Ma, Y. New Prediction Equations for Knee Isokinetic Strength in Young and Middle-Aged Non-Athletes. BMC Public Health 2023, 23, 2558. [Google Scholar] [CrossRef] [PubMed]
- Alonso, A.; Ribeiro, S.; Luna, N.; Peterson, M.; Bocalini, D.; Serra, M.; Brech, G.; Greve, J.; Garcez-Leme, L. Association between Handgrip Strength, Balance, and Knee Flexion/Extension Strength in Older Adults. PLoS ONE 2018, 13, e0198185. [Google Scholar] [CrossRef]
- Nagano, A.; Ueshima, J.; Tsutsumiuchi, K.; Inoue, T.; Shimizu, A.; Mori, N.; Maeda, K. Effect of Tongue Strength on Clinical Outcomes of Patients: A Systematic Review. Arch. Gerontol. Geriatr. 2022, 102, 104749. [Google Scholar] [CrossRef] [PubMed]
- Pitts, L.; Morales, S.; Stierwalt, J. Lingual Pressure as a Clinical Indicator of Swallowing Function in Parkinson’s Disease. J. Speech Lang. Hear. Res. 2018, 61, 257–265. [Google Scholar] [CrossRef]
- Marín-Bernard, E.; Ruiz-López, M.; Gómez-Pozo, B.; Artacho, R. Maximum Anterior Tongue Strength and Maximum Lip Strength in Healthy Spanish Adults: A Proposal of Reference Values. Dysphagia 2024, 39, 881–888. [Google Scholar] [CrossRef]
- Cruz-Jentoft, A.; Dawson Hughes, B.; Scott, D.; Sanders, K.; Rizzoli, R. Nutritional Strategies for Maintaining Muscle Mass and Strength from Middle Age to Later Life: A Narrative Review. Maturitas 2020, 132, 57–64. [Google Scholar] [CrossRef]
- Sakai, K.; Nakayama, E.; Tohara, H.; Maeda, T.; Sugimoto, M.; Takehisa, T.; Takehisa, Y.; Ueda, K. Tongue Strength Is Associated with Grip Strength and Nutritional Status in Older Adult Inpatients of a Rehabilitation Hospital. Dysphagia 2017, 32, 241–249. [Google Scholar] [CrossRef] [PubMed]
- Itani, L.; Pellegrini, M.; Saadeddine, D.; Samouda, H.; Kreidieh, D.; Tannir, H.; El Ghoch, M. Association between Dietary Practice and Gait Speed in Community-Dwelling Older Adults with Overweight and Obesity: A Cross-Sectional Study. Diseases 2024, 12, 54. [Google Scholar] [CrossRef]
- Bohannon, R.; Wang, Y. Four-Meter Gait Speed: Normative Values and Reliability Determined for Adults Participating in the NIH Toolbox Study. Arch. Phys. Med. Rehabil. 2019, 100, 509–513. [Google Scholar] [CrossRef] [PubMed]
- Festa, R.; Jofré-Saldía, E.; Garrido-Osorio, V.; Jannas-Vela, S. Physical Performance in the Health Environment: An Undervalued Practical and Inexpensive Tool. Perspect. Public Health 2024, 144, 342–343. [Google Scholar] [CrossRef] [PubMed]
- Álvarez Córdova, L.R.; Artacho Martín-Lagos, R.; Arteaga Pazmiño, C.; Fonseca Pérez, D.M.; Sierra Nieto, V.H.; Ruiz-López, M.D. Comprehensive geriatric assessment in a marginal community of Ecuador. Nutr. Hosp. 2020, 37, 926–932. [Google Scholar] [CrossRef]
- Guralnik, J.; Simonsick, E.; Ferrucci, L.; Glynn, R.; Berkman, L.; Blazer, D.; Scherr, P.; Wallace, R. A Short Physical Performance Battery Assessing Lower Extremity Function: Association with Self-Reported Disability and Prediction of Mortality and Nursing Home Admission. J. Gerontol. 1994, 49, M85–M94. [Google Scholar] [CrossRef]
- Western, M.; Malkowski, O. Associations of the Short Physical Performance Battery (SPPB) with Adverse Health Outcomes in Older Adults: A 14-Year Follow-Up from the English Longitudinal Study of Ageing (ELSA). Int. J. Environ. Res. Public Health 2022, 19, 16319. [Google Scholar] [CrossRef]
- Podsiadlo, D.; Richardson, S. The Timed “Up & Go”: A Test of Basic Functional Mobility for Frail Elderly Persons. J. Am. Geriatr. Soc. 1991, 39, 142–148. [Google Scholar] [CrossRef]
- Ascencio, E.; Cieza-Gómez, G.; Carrillo-Larco, R.; Ortiz, P. Timed up and Go Test Predicts Mortality in Older Adults in Peru: A Population-Based Cohort Study. BMC Geriatr. 2022, 22, 61. [Google Scholar] [CrossRef]
- Ugarte LL, J.; Vargas R, F. Sensibilidad y Especificidad de La Prueba Timed Up and Go. Tiempos de Corte y Edad En Adultos Mayores. Rev. Med. Chile 2021, 149, 1302–1310. [Google Scholar] [CrossRef]
- Defagó, M.; Eynard, A. Nutrigenetics: Potentials and Applications in Cardiovascular Diseases and Associated Risk Factors. Rev. Fac. Cien. Med. Univ. Nac. Cordoba 2022, 79, 168–180. [Google Scholar] [CrossRef]
- Espinosa-Salinas, I.; Fernández-Cabezas, J.; Fernández-Díaz, C.M.; Reglero, G.; Martínez, J.A.; Molina, A.R. de Test nutrigenéticos como herramienta para una alimentación de precisión. Rev. Esp. Nutr. Hum. Diet. 2021, 25, 18–19. [Google Scholar]
- Robinson, K.; Rozga, M.; Braakhuis, A.; Ellis, A.; Monnard, C.R.; Sinley, R.; Wanner, A.; Vargas, A.J. Effect of Incorporating Genetic Testing Results into Nutrition Counseling and Care on Dietary Intake: An Evidence Analysis Center Systematic Review—Part I. J. Acad. Nutr. Diet. 2021, 121, 553–581.e3. [Google Scholar] [CrossRef]
- Braakhuis, A.; Monnard, C.R.; Ellis, A.; Rozga, M. Consensus Report of the Academy of Nutrition and Dietetics: Incorporating Genetic Testing into Nutrition Care. J. Acad. Nutr. Diet. 2021, 121, 545–552. [Google Scholar] [CrossRef] [PubMed]
- Ellis, A.; Rozga, M.; Braakhuis, A.; Monnard, C.; Robinson, K.; Sinley, R.; Wanner, A.; Vargas, A. Effect of Incorporating Genetic Testing Results into Nutrition Counseling and Care on Health Outcomes: An Evidence Analysis Center Systematic Review-Part II. J. Acad. Nutr. Diet. 2021, 121, 582–605. [Google Scholar] [CrossRef]
- Shyam, S.; Lee, K.; Tan, A.; Khoo, T.; Harikrishnan, S.; Lalani, S.; Ramadas, A. Effect of Personalized Nutrition on Dietary, Physical Activity, and Health Outcomes: A Systematic Review of Randomized Trials. Nutrients 2022, 14, 4104. [Google Scholar] [CrossRef]
- Lagoumintzis, G.; Patrinos, G.P. Triangulating Nutrigenomics, Metabolomics and Microbiomics toward Personalized Nutrition and Healthy Living. Hum. Genom. 2023, 17, 109. [Google Scholar] [CrossRef] [PubMed]
- Grosso, G.; Laudisio, D.; Frias-Toral, E.; Barrea, L.; Muscogiuri, G.; Savastano, S.; Colao, A. Anti-Inflammatory Nutrients and Obesity-Associated Metabolic-Inflammation: State of the Art and Future Direction. Nutrients 2022, 14, 1137. [Google Scholar] [CrossRef]
- Nielsen, D.E.; El-Sohemy, A. Disclosure of Genetic Information and Change in Dietary Intake: A Randomized Controlled Trial. PLoS ONE 2014, 9, e112665. [Google Scholar] [CrossRef]
- Pérez-Beltrán, Y.E.; Rivera-Iñiguez, I.; Gonzalez-Becerra, K.; Pérez-Naitoh, N.; Tovar, J.; Sáyago-Ayerdi, S.G.; Mendivil, E.J. Personalized Dietary Recommendations Based on Lipid-Related Genetic Variants: A Systematic Review. Front. Nutr. 2022, 9, 830283. [Google Scholar] [CrossRef] [PubMed]
- Orsso, C.; Ghomashchi, H.; Caretero, A.; Atkins, M.; Barbosa-Silva, T.; Basualdo-Hammond, C.; Cardenas, D.; Chevalier, S.; Gonzalez, M.; Gramlich, L.; et al. Pathways for Integration of Body Composition and Energy Metabolism Assessments throughout the Nutrition Care Process: Protocol for Implementation Planning. Clin. Nutr. ESPEN 2025, 69, 234–240. [Google Scholar] [CrossRef] [PubMed]
- Dulal, S.; Prost, A.; Karki, S.; Saville, N.; Merom, D. Characteristics and Effects of Integrated Nutrition and Stimulation Interventions to Improve the Nutritional Status and Development of Children under 5 Years of Age: A Systematic Review and Meta-Analysis. BMJ Glob. Health 2021, 6, e003872. [Google Scholar] [CrossRef]
- Álvarez-Córdova, L.R.; Artacho, R.; Chedraui, P.; Arteaga-Pazmiño, C.; Sánchez-Briones, M.; Ruiz-López, M.D. Arm Muscle Area Is Correlated to Handgrip Strength in Postmenopausal Women. Gynecol. Endocrinol. 2024, 40, 2420937. [Google Scholar] [CrossRef]
- González-Martin, A.M.; Limón-Villegas, E.S.; Reyes-Castillo, Z.; Esparza-Ros, F.; Hernández-Palma, L.A.; Santillán-Rivera, M.S.; Herrera-Amante, C.A.; Ramos-García, C.O.; Righini, N. Anthropometric Measurements for Predicting Low Appendicular Lean Mass Index for the Diagnosis of Sarcopenia: A Machine Learning Model. J. Funct. Morphol. Kinesiol. 2025, 10, 276. [Google Scholar] [CrossRef] [PubMed]
- Şengül Ayçiçek, G.; Caran Karabacak, E.; Gökçe, B.; Oktay Oğuz, E.; Koca, M.; Ünsal, P. Muscle-Specific Strength and Its Functional Correlates in Patients with Osteosarcopenia. Eur. Geriatr. Med. 2025, 16, 1753–1758. [Google Scholar] [CrossRef]
- García-Moreno, R.M.; Mola Reyes, L.; López-Plaza, B.; Palma Milla, S. C-Reactive Protein-to-Prealbumin and C-Reactive Protein-to-Albumin Ratios as Nutritional and Prognostic Markers in Hospitalized Patients—An Observational Study. Nutrients 2024, 16, 2610. [Google Scholar] [CrossRef]
- Berger, M.M.; Shenkin, A.; Schweinlin, A.; Amrein, K.; Augsburger, M.; Biesalski, H.-K.; Bischoff, S.C.; Casaer, M.P.; Gundogan, K.; Lepp, H.-L.; et al. ESPEN Micronutrient Guideline. Clin. Nutr. 2022, 41, 1357–1424. [Google Scholar] [CrossRef]
- Stoppe, C.; Elke, G.; Silvstre, S.C.d.M.; Kappus, M. Highlights in the Clinical Nutrition Literature: A Critical Appraisal of Current Research. JPEN J. Parenter. Enteral Nutr. 2024, 48, 377–388. [Google Scholar] [CrossRef]
- Milbar, H.C.; Caplan, A.; Schwab, R.D.; Coromilas, A.J.; Baumrin, E.; Forrestel, A.; Steele, K.T.; Micheletti, R.G.; Perl, A.; Rosenbach, M. Vitamin C Deficiency in Patients with Acute Myeloid Leukemia: A Case Series and Review of the Literature. Blood Adv. 2023, 7, 5780–5783. [Google Scholar] [CrossRef]
- Liu, J.; Tan, Y.; Cheng, H.; Zhang, D.; Feng, W.; Peng, C. Functions of Gut Microbiota Metabolites, Current Status and Future Perspectives. Aging Dis. 2022, 13, 1106–1126. [Google Scholar] [CrossRef] [PubMed]
- Bautista, J.; Echeverría, C.E.; Maldonado-Noboa, I.; Ojeda-Mosquera, S.; Hidalgo-Tinoco, C.; López-Cortés, A. The Human Microbiome in Clinical Translation: From Bench to Bedside. Front. Microbiol. 2025, 16, 1632435. [Google Scholar] [CrossRef]
- Wang, D.X.M.; Yao, J.; Zirek, Y.; Reijnierse, E.M.; Maier, A.B. Muscle Mass, Strength, and Physical Performance Predicting Activities of Daily Living: A Meta-analysis. J. Cachexia Sarcopenia Muscle 2020, 11, 3–25. [Google Scholar] [CrossRef] [PubMed]
- Azuelos, C.; Marquis, M.; Laberge, A. A Systematic Review of the Assessment of the Clinical Utility of Genomic Sequencing: Implications of the Lack of Standard Definitions and Measures of Clinical Utility. Eur. J. Med. Genet. 2024, 68, 104925. [Google Scholar] [CrossRef]
- Ceriani, F.; Montalvan, M.; Quintero, B.; Suárez, R.; Bautista-Valarezo, E.; Frias-Toral, E. Ethics of the Clinical Practice of Nutrigenetics and Nutrigenomics. Clin. Nutr. Open Sci. 2023, 49, 58–66. [Google Scholar] [CrossRef]
- Cederholm, T.; Jensen, G.; Correia, M.; Gonzalez, M.; Fukushima, R.; Pisprasert, V.; Blaauw, R.; Braz, D.; Carrasco, F.; Cruz Jentoft, A.; et al. The GLIM Consensus Approach to Diagnosis of Malnutrition: A 5-Year Update. Clin. Nutr. 2025, 49, 11–20. [Google Scholar] [CrossRef] [PubMed]
- Cederholm, T.; Jensen, G.L.; Correia, M.I.T.D.; Gonzalez, M.C.; Fukushima, R.; Higashiguchi, T.; Baptista, G.; Barazzoni, R.; Blaauw, R.; Coats, A.; et al. GLIM Criteria for the Diagnosis of Malnutrition—A Consensus Report from the Global Clinical Nutrition Community. Clin. Nutr. 2019, 38, 1–9. [Google Scholar] [CrossRef]
- Guastaferro, K.; Moucheraud, C.; Purtle, J.; Collins, L.; Shelley, D. Integrating Implementation Science and Intervention Optimization. Implement. Sci. 2025, 20, 41. [Google Scholar] [CrossRef]
- Keller, H.H.; McCullough, J.; Davidson, B.; Vesnaver, E.; Laporte, M.; Gramlich, L.; Allard, J.; Bernier, P.; Duerksen, D.; Jeejeebhoy, K. The Integrated Nutrition Pathway for Acute Care (INPAC): Building Consensus with a Modified Delphi. Nutr. J. 2015, 14, 63. [Google Scholar] [CrossRef]
- Carvalho, B.; Ribeiro, A.; da Mota, J.; Carvalho, L.; Nicoletti, C. Integrating Biological Age, Epigenetic Clocks, and Telomere Length in Precision Nutrition Strategies for Chronic Disease Management: Potential Frameworks and Ongoing Challenges. Nutr. Res. 2025, 140, 135–160. [Google Scholar] [CrossRef]
- Raiten, D.J.; Steiber, A.L.; Bremer, A.A. The Value of Integrating the Nutritional Ecology into the Nutrition Care Continuum—A Conceptual and Systems Approach. Adv. Nutr. 2025, 16, 100385. [Google Scholar] [CrossRef]


Disclaimer/Publisher’s Note: The statements, opinions and data contained in all publications are solely those of the individual author(s) and contributor(s) and not of MDPI and/or the editor(s). MDPI and/or the editor(s) disclaim responsibility for any injury to people or property resulting from any ideas, methods, instructions or products referred to in the content. |
© 2026 by the authors. Licensee MDPI, Basel, Switzerland. This article is an open access article distributed under the terms and conditions of the Creative Commons Attribution (CC BY) license.