Abstract
The construction of undersea tunnels involves multiple potential hazards, among which water-related risks are particularly critical during the construction phase. Tunnel water inrush can trigger serious safety incidents and increase maintenance costs during operation. Therefore, accurately predicting water inflow is essential to ensure construction safety and long-term operational reliability. This study calculated the water inflow per meter of an undersea tunnel using the built-in FISH programming language in FLAC3D 7.0 finite difference software. A series of numerical models was established to examine the effects of eight influencing factors, including seawater depth, permeability of the surrounding rock, overburden thickness, and the thickness and permeability coefficients of both the grouting ring and the lining. The results indicate that water inflow generally increases linearly with greater seawater depth and overburden thickness. Although higher permeability of the surrounding rock leads to increased inflow, the growth rate gradually decreases. When the thickness of the grouting ring exceeds 6 m, the marginal benefit of its effect gradually decreases. The inflow was found to decrease as the lining permeability declined, with a more evident reduction under higher grouting ring permeability. Sensitivity analysis further revealed that seawater depth exerts the most significant influence on water inflow, whereas the thickness of the grouting ring has the least effect.
1. Introduction
With the rapid development of marine engineering, subsea tunnels have become an essential form of cross-sea transportation due to their shorter routes, higher safety, and superior overall economic benefits [1,2,3,4]. However, under complex hydrogeological conditions, tunnel construction is easily affected by high water pressure and seepage, making accurate prediction of water inflow a key issue for ensuring construction safety [5,6].
In recent years, extensive research has been conducted worldwide on predicting water inflow in subsea tunnels, primarily using analytical and numerical methods. Zhang et al. [7] proposed a prediction approach based on the superposition principle and validated it using FLAC3D 7.0 simulations. Pan et al. [8] analyzed the seepage characteristics of deep, symmetrically buried tunnels and developed an analytical model considering the excavation-damaged zone (EDZ), which showed good agreement with numerical results. Li et al. [9] derived a seepage prediction formula for grouted tunnels from Darcy’s law and verified its applicability with field data. Han et al. [10] established a new method for analyzing the seepage field of triple-parallel tunnels and investigated the hydraulic interaction between adjacent bores. Wang et al. [11] applied a non-Darcy flow energy method to dynamically predict inflow under complex geological conditions, providing a new theoretical basis for tunnel design. Guo et al. [12] proposed an accurate analytical solution for the seepage field of twin underwater tunnels, improving computational precision and efficiency. Han et al. [13] used an equivalent-area approach to examine the pressure-relief effects among parallel tunnels. Chen et al. [14] studied shield tunnels’ stability and seepage characteristics under high water pressure, offering essential insights for engineering design.
As subsea tunnel projects expand in scale, understanding the seepage behavior and water-pressure distribution has become critical for structural safety and construction risk control [15,16,17]. Long-term exposure to high water pressure and complex stress conditions often leads to sudden inflow increases, rock permeability variations, and uneven lining pressures [18,19,20,21]. Conventional empirical models can no longer meet the required accuracy. Li et al. [22] studied the seepage behavior of water-rich tunnels and found that the grouting circle effectively reduces water inflow and stabilizes pressure distribution, whereas hydrodynamic pressure disrupts this balance and affects structural stability. Field validation demonstrated the model’s reliability in complex hydrogeological environments, providing new insight into seepage mechanisms and waterproof design [23,24].
Because tunnel inflow is governed by the coupled effects of permeability, stress state, and hydraulic gradient, its evolution exhibits strong nonlinearity and uncertainty. Traditional analytical approaches struggle to capture these behaviors accurately. With advances in numerical modeling, fluid–solid coupling methods have become an effective means of analyzing subsea tunnel seepage [25]. In this study, the FLAC3D 7.0 program is employed to conduct coupled hydro-mechanical simulations. The built-in FISH scripting language is used to automate the calculation of tunnel inflow along its alignment, and the numerical results are validated against analytical solutions. Based on the equivalent continuous medium theory, the fractured rock mass intersected by the tunnel is simplified as a homogeneous and isotropic medium. A large number of numerical simulations were conducted by considering eight influencing factors, including boundary conditions, seawater depth, surrounding rock permeability, overburden thickness, grouting ring thickness, grouting ring permeability, lining permeability, and lateral pressure coefficient. The influence mechanisms of these parameters on tunnel water inflow were systematically analyzed. It should be noted that the applicability of the conclusions is premised on homogeneous geological conditions. The findings provide a scientific basis and engineering reference for improving prediction accuracy and optimizing waterproof design.
2. Prediction Methods for Water Inflow in Subsea Tunnels at Home and Abroad
2.1. Empirical Analytical Method
The calculation model of water inflow in subsea tunnels is shown in Figure 1 [7].
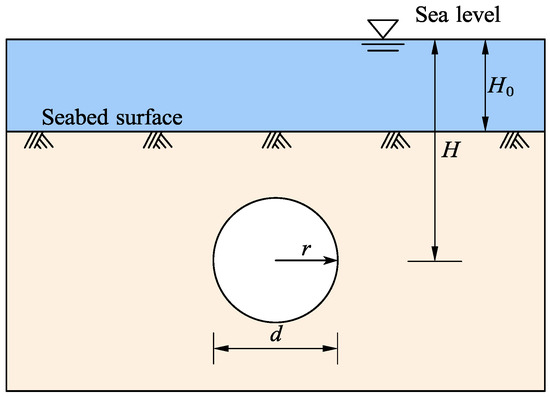
Figure 1.
Calculation model of water inflow for undersea tunnels.
- (1)
- Goodman’s formula:
In Equation (1), is the water inflow per meter of the subsea tunnel, ; is the permeability coefficient of the surrounding rock, ; is the distance from the static water level to the tunnel center, ; is the equivalent circle diameter, .
- (2)
- The railway specification empirical formula:
In Equation (2), is the seawater depth, and is the effective excavation radius. The other parameters are the same as in Equation (1).
- (3)
- Hirishi Oshima’s empirical equation:
In Equation (3), is the conversion coefficient, generally 0.86; other parameters are the same as in Equation (1).
The empirical analytical method has the following limitations in calculating the water inflow of subsea tunnels: (1) single geometric model, and the solution range is limited to circular chambers; (2) the effectiveness of this method depends on the assumption that the permeability coefficient of the surrounding rock is isotropic; (3) it does not consider the coupling process of surrounding rock fracture expansion-seepage channel evolution induced by changes in the stress field during excavation; (4) most empirical formulas take unsupported rough holes as the research object and do not consider the influence of grouting reinforcement, lining structure, etc., on the seepage field [26].
2.2. Numerical Simulation Method
2.2.1. Overview of FLAC3D 7.0 Fluid-Solid Coupling Analysis
Based on the basic view of seepage mechanics, soil and rock can be regarded as pore or fractured media. Given that the numerical simulation tools for seepage processes in pore media are mature, the FLAC3D 7.0 software is used for modeling and analysis [27,28,29]. The specific calculation process is as follows: (1) When the tunnel is excavated under the combined action of the initial geostress field and pore water pressure, the deformation of the surrounding rock around the tunnel can be regarded as a transient elastoplastic deformation process caused by excavation unloading, and the deformation characteristics can be analyzed through simple mechanical calculations at this stage; (2) Tunnel excavation causes the surrounding rock surface to become a free water outlet boundary, and the seepage of water and the deformation of the surrounding rock are fluid-solid coupling processes that interact with each other [30,31].
2.2.2. Selection of Calculation Scheme
FLAC3D 7.0 can accurately simulate the interaction between solid and fluid through a fully coupled fluid-solid algorithm, but it increases the calculation cost (significantly longer time consumption). Therefore, in most working conditions, a non-coupled simplified algorithm can be used to accelerate the solution, and the method selection needs to comprehensively consider the time scale difference, disturbance type, and fluid-solid stiffness ratio [32,33].
The characteristic time of the mechanical process is:
In Equation (4), is the characteristic length, is the shear modulus, is the undrained bulk modulus, and is the density.
The characteristic time of fluid seepage is:
In Equation (5), is the characteristic length and is the diffusion rate. The calculation method of the diffusion rate varies with different seepage models, and its expression is related to the permeability and water storage coefficients.
Under a saturated seepage state, the fluid diffusivity is calculated as follows:
In Equation (6), is the biot modulus, and is the permeability coefficient.
In fluid-solid coupling problems, the fluid diffusion rate is calculated by the following formula:
In Equation (7), is the biot’s coefficient.
In the analysis framework of fluid-solid coupling problems, disturbance refers to the external excitation conditions that break the initial equilibrium state of the system, specifically including fluid and mechanical boundary disturbances.
The fluid-solid stiffness ratio is the ratio of the fluid bulk modulus to the solid modulus. According to the value range of this dimensionless parameter, fluid-solid coupling problems can be divided into two categories: flexible skeleton problems and rigid skeleton problems.
The key indicators involved in this problem are listed in Table 1 to achieve a reasonable selection of the calculation model. It can be seen from Table 1 that the model calculation time is much longer than the seepage diffusion time, the calculation belongs to stable seepage analysis, and the disturbance type is fluid boundary disturbance. Currently, the pore water pressure calculation can be solved independently of the stress field, and a step-by-step coupling calculation method is adopted. That is, first, carry out single-field seepage analysis to obtain a steady-state pore pressure field (model fluid active on, model mechanical active off), and then carry out single-mechanical analysis to achieve the balance of the stress field through iterative calculations (model fluid active off, model mechanical active on). When solving the single-mechanical field, the fluid modulus must be set to zero to avoid the pore pressure regeneration effect caused by the volume strain of the solid skeleton during the calculation process. In single-seepage analysis, to maintain the system’s real diffusivity and time scale characteristics, the fluid modulus must be adjusted according to the following formula, and the adjusted fluid modulus is 0.55 GPa.

Table 1.
Indicators related to numerical calculation.
In Equation (9), is the volumetric modulus of the fluid.
3. Numerical Simulation Calculation of Water Inflow in Subsea Tunnels
3.1. Numerical Model Establishment and Parameter Selection
The numerical model is based on the engineering practice of a particular subsea tunnel. Since fluid-solid coupling calculations in FLAC3D 7.0 are very time-consuming, and considering calculation accuracy, a unit length is taken longitudinally in the simulation [34]. The grid near the tunnel is divided with high density, and the grid density gradually decreases as the distance from the tunnel increases, expanding in a radial shape (as shown in Figure 2). The model calculation size is 200 m × 150 m × 1 m (X × Z × Y), including 6844 units and 10,551 nodes. Solid units simulate the surrounding rock; the yield condition is the M-C criterion. The tunnel is excavated in a complete section, considering the mutual coupling effect of the surrounding rock-lining-seawater. The fluid calculation adopts a homogeneous seepage model; the particles are incompressible, and Biot’s coefficient is 1. The selection of surrounding rock mechanical and fluid parameters is shown in Table 2.
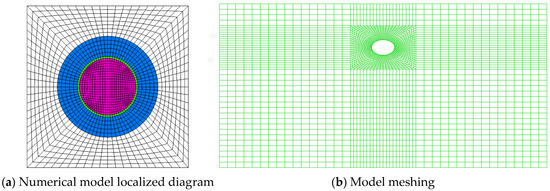
Figure 2.
Numerical calculation model.
Table 2.
Surrounding rock mechanics and fluid parameters, mechanical parameters.
During mechanical calculation, a stress boundary condition equivalent to the gravity of seawater is applied to the top surface, and usual displacement constraints are applied to the side and bottom surfaces. In the seepage mode, the top surface of the model is a permeable boundary, the left and right boundaries are permeable boundaries, and the bottom surface is an impermeable boundary. When the seawater depth is 20 m, the seawater level is defined as 20 m above the boundary, and the pore water pressure on the seabed surface is fixed at 0.2 MPa. The initial pore water pressure distribution is shown in Figure 3.
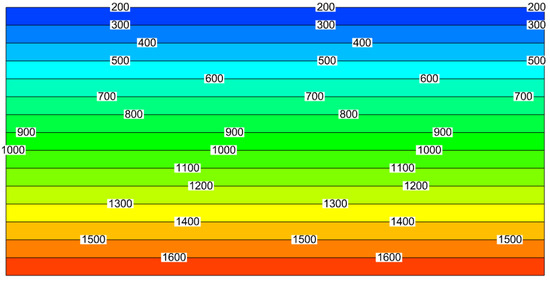
Figure 3.
Initial pore water pressure (Unit: kPa).
It can be seen from Figure 3 that before the tunnel excavation disturbance occurs, the pore water pressure is distributed according to the hydrostatic pressure gradient law, and the bottom pore water pressure is 1.7 MPa. During tunnel excavation, the balance of the original pore water pressure is broken, causing the seepage field to show a dynamic change process from stability to instability and then to stability. Finally, the tunnel water inflow when the seepage field reaches a stable state again is calculated.
3.2. Verification of FLAC Numerical Simulation Accuracy
For a particular subsea tunnel, the permeability coefficient of the surrounding rock is 0.432 m·d−1, the inner radius of the tunnel is 7 m, the outer radius of the lining is 7.5 m, and the permeability coefficient of the lining is 1 × 10⁻⁸ m·s−1; the radius of the grouting ring is 12.5 m, and the permeability coefficient of the grouting ring is 1 × 10⁻⁷ m·s−1; the distance from the tunnel center to the sea level is 60 m.
Tunnel excavation breaks the balance of pore water pressure in the original rock mass, resulting in the surrounding rock surface becoming an air-facing surface, and the pore water pressure at each node on this surface is set to zero. The pore water pressure around the tunnel decays in a gradient, and under the pore pressure difference, the pore water pressure contour lines finally show a funnel-shaped distribution centered on the tunnel. The pore water pressure distribution in a stable state is shown in Figure 4. The pore water seepage vector diagram is shown in Figure 5. To confirm the rationality of the numerical simulation method, the numerical calculation result of the tunnel water inflow obtained by the FISH language built into FLAC3D 7.0 is 2.64 m3·d−1·m−1, which is in high agreement with the analytical solution of 2.63 m3·d−1·m−1, indicating that this numerical model can effectively simulate the seepage behavior of water in the actual surrounding rock pore media.
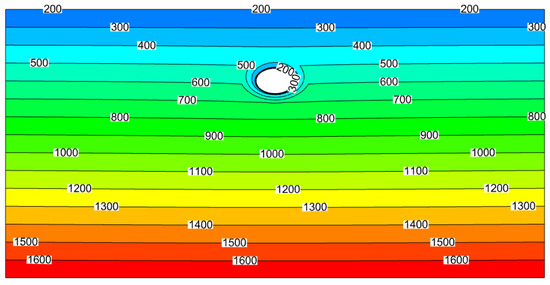
Figure 4.
The pore water pressure distribution in a stable state (Unit: kPa).
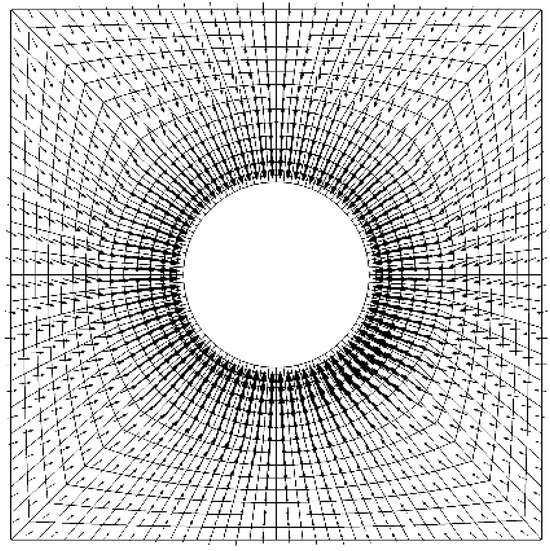
Figure 5.
Pore water seepage vector diagram.
3.3. Numerical Simulation Scheme
To analyze the variation law of tunnel water inflow under different influencing factors, eight factors, including boundary conditions, seawater depth, surrounding rock permeability coefficient, overburden thickness, grouting ring thickness, grouting ring permeability coefficient, lining permeability coefficient, and lateral pressure coefficient, were selected, and different variables were set, respectively. The specific calculation conditions are shown in Table 3.
Table 3.
Calculate the working condition table.
3.4. Analysis of Numerical Simulation Results
3.4.1. Boundary Conditions
The water inflow of the subsea tunnel was calculated for 5 working conditions with the upper, lower, left, and right boundaries set as permeable and impermeable boundaries, and the calculation results are shown in Table 4. It can be seen from Table 4 that when only the upper part is a permeable boundary condition, the water inflow of the subsea tunnel is 2.62 m3·d−1·m−1, and the water inflow under the other 4 working conditions is 2.64 m3·d−1·m−1, with a relative error of only 0.8%. Taking the water inflow when the fluid calculation is balanced, the influence of fluid boundary conditions on the water inflow is small. However, the convergence time when the calculation reaches equilibrium varies greatly under different fluid boundary conditions. Through a large number of calculation results, it is found that the calculation time when only the upper boundary is permeable is the longest.
Table 4.
The water inflow of submarine tunnels under different boundary conditions.
3.4.2. Seawater Depth
Figure 6 is a relationship curve between the water inflow of the subsea tunnel and the seawater depth. It can be seen from Figure 6 that the tunnel water inflow increases almost linearly with the increase in seawater depth. When the seawater depth increases from 20 m to 70 m, the water inflow increases from 2.64 m3·d−1·m−1 to 4.84 m3·d−1·m−1, an increase of 83.35%.
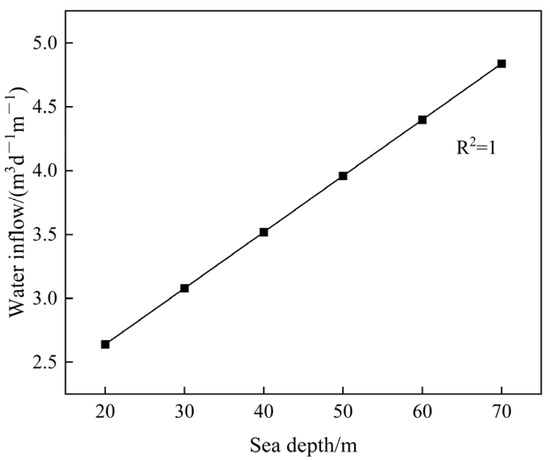
Figure 6.
The relationship curve between tunnel water inflow and seawater depth.
3.4.3. Surrounding Rock Permeability Coefficient
The relationship curve between the water inflow of the subsea tunnel and the surrounding rock permeability coefficient is shown in Figure 7. It can be seen from Figure 7 that as the surrounding rock permeability coefficient increases, the water inflow gradually increases, but the rate of growth in water inflow gradually decreases. The water inflow rises sharply when the surrounding rock permeability coefficient is less than 3 × 10⁻⁶ m·s−1 and slows down when it is greater than 3 × 10⁻⁶ m·s−1.
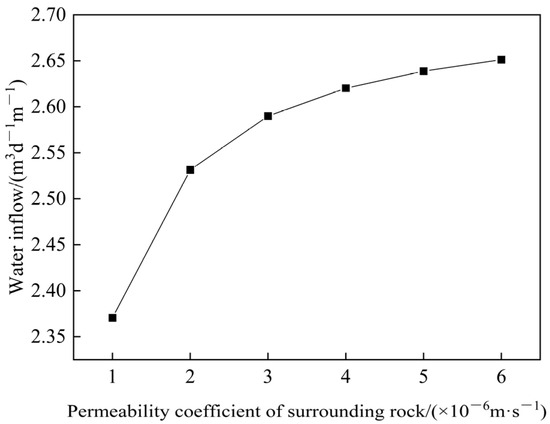
Figure 7.
The relationship curve between tunnel water inflow and the surrounding rock permeability coefficient.
3.4.4. Overburden Thickness
Figure 8 is a relationship curve between the water inflow of the subsea tunnel and the overburden thickness. It can be seen from Figure 8 that the water inflow increases approximately linearly with the increase in overburden thickness. When the overburden thickness increases from 10 m to 60 m, the water inflow increases from 1.67 m3·d−1·m−1 to 3.82 m3·d−1·m−1, an increase of 128.74%.
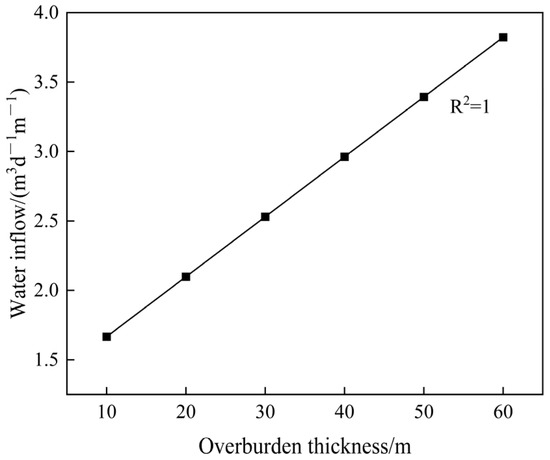
Figure 8.
The relationship curve between tunnel water inflow and overburden.
3.4.5. Grouting Ring Parameters
Let the ratio of the permeability coefficient of the surrounding rock to that of the grouting ring be n. The relationship between the water inflow and the change in the thickness of the grouting ring is shown in Figure 9. When the lining of the subsea tunnel has a specific permeability, the relationship between the tunnel water inflow and the permeability coefficient of the grouting ring is shown in Figure 10. It can be seen from Figure 9 and Figure 10 that when no grouting ring is set in the subsea tunnel, the tunnel water inflow is 4.4 m3·d−1·m−1. When the thickness of the grouting ring is constant, the water inflow gradually decreases with the increase in the n value (lower permeability coefficient of the grouting ring).
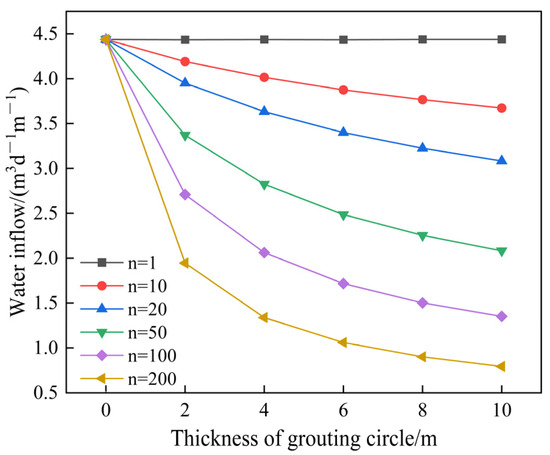
Figure 9.
Relationship curve between tunnel water inflow and grouting ring thickness.
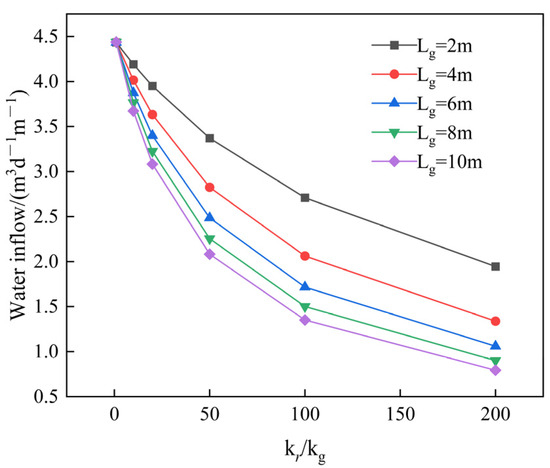
Figure 10.
The relationship curve between the tunnel water inflow and the permeability coefficient of the grouting ring.
As the thickness of the grouting ring gradually increases, the water inflow decreases. Therefore, constructing a grouting ring around the lining effectively reduces the tunnel water inflow. However, when the thickness and permeability coefficient of the grouting ring exceed a particular critical value, continuing to increase the thickness of the grouting ring or reduce the permeability coefficient, the reduction range of the tunnel water inflow tends to be gentle, and its control effect is no longer significant.
Therefore, the control effect of tunnel water inflow does not continue to improve with the infinite decrease in the permeability coefficient or the continuous increase in the grouting ring thickness. Therefore, in actual design and construction, grouting materials and reinforcement ring parameters should be selected according to specific conditions.
3.4.6. Lining Permeability Coefficient
Let the ratio of the permeability coefficient of the surrounding rock to that of the lining be m. The relationship curve between the tunnel water inflow and the lining permeability coefficient is shown in Figure 11. When grouting and lining are not considered, the water inflow of the subsea tunnel is 70.44 m3·d−1·m−1; when grouting is not considered and only the lining is considered, when m = 1000, the water inflow is 2.29 m3·d−1·m−1; if only the role of the lining is considered, when the permeability coefficient of the lining is reduced below 2.17 × 10⁻⁹ m·s−1, the water inflow can meet the control standard of 1 m3·d−1·m−1. Therefore, if only the permeability of the lining is reduced to control the water inflow in the weathered trough section of the subsea tunnel, it is difficult to achieve the expected effect, and a systematic design combined with the water blocking effect of the grouting ring is required.
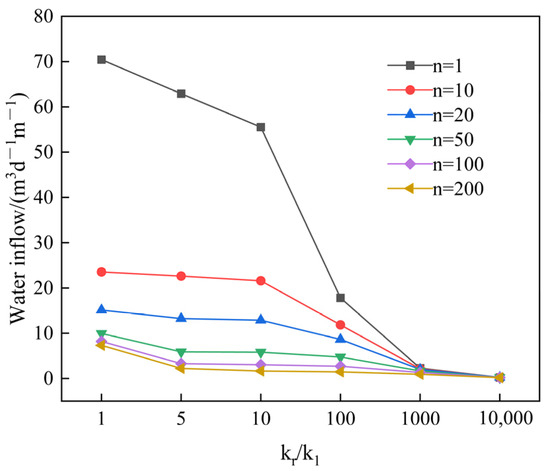
Figure 11.
The relationship curve between tunnel water inflow and lining permeability coefficient.
When n is a fixed value, the water inflow gradually decreases with the decrease in the lining permeability coefficient; when the permeability coefficient of the grouting ring is larger, the decreasing trend of the water inflow is more obvious.
3.4.7. Influence of Side Pressure Coefficient on Water Inflow
The water inflow of subsea tunnels with side pressure coefficients of 0.3, 0.6, 0.9, 1.2, 1.5, and 1.8 was calculated to be 2.64 m3·d−1·m−1, respectively. The results show that the side pressure coefficient has almost no influence on the water inflow of subsea tunnels, so the influence of this coefficient can be ignored. It should be pointed out that the conclusion regarding the influence of the lateral pressure coefficient on water inflow depends on the stepwise coupled numerical simulation method adopted.
4. Sensitivity Analysis of Parameters by the Grey Correlation Method
4.1. Establishment of Comparison Matrix and Reference Matrix
To reveal the sensitivity of each parameter, the control variable method was used to calculate the seawater depth H0, surrounding rock permeability coefficient kr, overburden thickness H1, grouting ring thickness Lg, grouting ring permeability coefficient kg, and lining permeability coefficient kl, respectively, to obtain the maximum water inflow Q of the subsea tunnel corresponding to the change value of each parameter. The maximum water inflow was obtained by writing the FISH language, traversing the nodes in the excavation area, and using the built-in variable gp. Flow to record the maximum value of the node unbalanced flow as the simulation value to calculate the maximum water inflow per meter of the tunnel. The above 6 factors were used as the comparison matrix X, and the maximum water inflow of the subsea tunnel was used as the reference matrix Y.
4.2. Dimensionless Processing
The range method was used to carry out normalization operations to obtain the normalized matrix:
4.3. Calculation of Correlation Coefficients
According to the calculation formula:
The difference sequence matrix was obtained from Formulas (1) and (2):
The correlation coefficient calculation formula:
In the formula, is the resolution coefficient. The smaller its value is, the greater the difference between the corresponding correlation coefficients and the stronger the discrimination ability will be. Generally, it is taken as 0.5.
The correlation coefficient matrix was obtained through calculation:
4.4. Calculation of Correlation Degree
The correlation degree calculation formula is:
In the formula: represents the degree of correlation. If the calculation result is closer to 1, the factor is more sensitive to the impact on the water inflow.
The final correlation degree matrix R is obtained:
4.5. Sensitivity Evaluation
For the maximum water inflow of subsea tunnels, it can be seen from the correlation degree calculation results that the sensitivity of each influencing factor from large to small is: seawater depth > overburden thickness > lining permeability coefficient > surrounding rock permeability coefficient > grouting ring permeability coefficient > grouting ring thickness. Seawater depth has the most significant influence on the maximum water inflow of subsea tunnels, and the thickness of the grouting ring has the least influence.
5. Conclusions
- (1)
- The water inflow of subsea tunnels has an approximately linear increasing relationship with seawater depth and overburden thickness; the water inflow of subsea tunnels is almost unaffected by the lateral pressure coefficient.
- (2)
- As the surrounding rock permeability coefficient increases, the water inflow gradually increases, but the rate of growth in water inflow gradually decreases.
- (3)
- Increasing the thickness of the grouting ring and reducing its permeability coefficient can both reduce the water inflow; the control effect of tunnel water inflow does not continue to improve with the infinite decrease in the permeability coefficient or the continuous increase in the grouting ring thickness. When the thickness of the grouting ring exceeds 6 m, the marginal benefit of its effect gradually decreases.
- (4)
- When the permeability of the grouting ring is constant, the tunnel water inflow decreases continuously with the decrease in lining permeability; the larger the permeability coefficient of the grouting ring, the more obvious the decreasing trend.
- (5)
- The influencing factors of the maximum water inflow in subsea tunnels, ranked by sensitivity from high to low, are seawater depth > overburden thickness > lining permeability coefficient > surrounding rock permeability coefficient > grouting ring permeability coefficient > grouting ring thickness. Seawater depth has the most significant influence on subsea tunnels’ water inflow, and the grouting ring’s thickness has the least influence.
Author Contributions
Writing—Original Draft, L.B.; Software, L.B. and H.G.; Conceptualization, L.B.; Visualization, L.B.; Data Curation, L.B.; Funding Acquisition, G.Y.; Methodology, G.Y.; Supervision, G.Y.; Formal Analysis, H.G. All authors have read and agreed to the published version of the manuscript.
Funding
This research was funded by the National Natural Science Foundation of China, grant number 52171264.
Data Availability Statement
The data presented in this study are available upon request from the corresponding author. The data is not publicly available due to the implementation nature of the project.
Acknowledgments
The authors would like to extend their sincere gratitude to the National Natural Science Foundation of China (Grant Number 52171264) for the financial support. The authors also thank all the participants for their help and friendship.
Conflicts of Interest
The authors declare no conflict of interest.
References
- Cheng, X.; Zhang, X.; Chen, W.; Xu, W.; Du, X. Stability analysis of a cross-sea tunnel structure under seepage and a bidirectional earthquake. Int. J. Geomech. 2017, 17, 06017008. [Google Scholar] [CrossRef]
- Wu, H.; Zhou, W.; Bao, Z.; Long, W.; Chen, K.; Liu, K. Life cycle assessment of carbon emissions for cross-sea tunnel: A case study of Shenzhen-Zhongshan Bridge and Tunnel in China. Case Stud. Constr. Mater. 2024, 21, e03502. [Google Scholar] [CrossRef]
- Xue, Y.; Zhou, B.; Li, S.; Qiu, D.; Zhang, K.; Gong, H. Deformation rule and mechanical characteristic analysis of subsea tunnel crossing weathered trough. Tunn. Undergr. Space Technol. 2021, 114, 103989. [Google Scholar] [CrossRef]
- Xue, Y.; Qu, C.; Su, M.; Qiu, D.; Li, Z.; Zhang, X.; Ma, X. Subsea tunnel site selection evaluation: A new evaluation model. Mar. Georesour. Geotechnol. 2020, 38, 1187–1198. [Google Scholar] [CrossRef]
- Chen, H.-Y.; Vojinovic, Z.; Lo, W.; Lee, J.-W. Groundwater level prediction with deep learning methods. Water 2023, 15, 3118. [Google Scholar] [CrossRef]
- Hussein, E.A.; Thron, C.; Ghaziasgar, M.; Bagula, A.; Vaccari, M. Groundwater prediction using machine-learning tools. Algorithms 2020, 13, 300. [Google Scholar] [CrossRef]
- Zhang, L.; Zhao, D.; Wu, J.; Yang, W.; Wang, W.; Xin, D. Prediction of water inflow in Tsingtao subsea tunnel based on the superposition principle. Tunn. Undergr. Space Technol. 2020, 97, 103243. [Google Scholar] [CrossRef]
- Pan, Y.; Qi, J.; Zhang, J.; Xia, P.; Peng, Y. Analytical Solution for Water Inflow into Deeply Buried Symmetrical Subsea Tunnels with Excavation Damage Zones. Water 2023, 15, 3556. [Google Scholar] [CrossRef]
- Li, P.; Wang, F.; Long, Y.; Zhao, X. Investigation of steady water inflow into a subsea grouted tunnel. Tunn. Undergr. Space Technol. 2018, 80, 92–102. [Google Scholar] [CrossRef]
- Han, Z.; Yan, K.; Zhu, Z.; Cui, H. Research on a grading evaluation system for water inflow in three-hole parallel subsea tunnels considering inter-tunnel influence. Appl. Sci. 2023, 13, 12761. [Google Scholar] [CrossRef]
- Wang, G.; Luo, J.; Zhang, Z.; Wang, D.; Song, Y.; Li, F. Research on dynamic prediction method of the water inflow in tunnels under complex geological conditions based on the non-darcy flow-energy method. Bull. Eng. Geol. Environ. 2025, 84, 151. [Google Scholar] [CrossRef]
- Guo, Y.; Wang, H.; Jiang, M. An exact analytical approach for determining the seepage field around underwater twin tunnels with linings. Transp. Geotech. 2023, 42, 101050. [Google Scholar] [CrossRef]
- Han, Z.-M.; Yan, K.-Y.; Cui, H.-M.; Liu, Q.-K. Analytical Study on Seepage Field of Three Parallel Submarine Tunnels Based on Equivalent Area Method. Eng. Mech. 2024, 41, 112–116+149. [Google Scholar]
- Chen, L.; Xi, B.; Dong, Y.; He, S.; Shi, Y.; Gao, Q.; Liu, K.; Zhao, N. Study on the stability and seepage characteristics of underwater shield tunnels under high water pressure seepage. Sustainability 2023, 15, 15581. [Google Scholar] [CrossRef]
- Niu, F.; Cai, Y.; Liao, H.; Li, J.; Tang, K.; Wang, Q.; Wang, Z.; Liu, D.; Liu, T.; Liu, C. Unfavorable geology and mitigation measures for water inrush hazard during subsea tunnel construction: A global review. Water 2022, 14, 1592. [Google Scholar] [CrossRef]
- Chen, Z.; Li, Z.; He, C.; Ma, C.; Li, X.; Chen, K.; Zhang, H.; Liu, M. Investigation on seepage field distribution and structural safety performance of small interval tunnel in water-rich region. Tunn. Undergr. Space Technol. 2023, 138, 105172. [Google Scholar] [CrossRef]
- Fan, H.; Zhu, Z.; Song, Y.; Zhang, S.; Zhu, Y.; Gao, X.; Hu, Z.; Guo, J.; Han, Z. Water pressure evolution and structural failure characteristics of tunnel lining under hydrodynamic pressure. Eng. Fail. Anal. 2021, 130, 105747. [Google Scholar] [CrossRef]
- Neuzil, C.E. Groundwater flow in low-permeability environments. Water Resour. Res. 1986, 22, 1163–1195. [Google Scholar] [CrossRef]
- He, X.; Shi, W.; Zhu, Y.; Yan, L.; Zhao, Y.; Wang, S. Coupled effects of fault-related groundwater flow and pore water pressure: Unraveling the mechanisms of deformation and failure in gentle slopes. Arab. J. Sci. Eng. 2025, 50, 15015–15032. [Google Scholar] [CrossRef]
- Zhang, Y.; Tan, F.; Liu, R.; Zhu, H.; Wang, X.; Jiao, Y. Water pressure relief treatment for protecting the initial support of inclined shafts at high water pressures. J. Rock Mech. Geotech. Eng. 2025, 17, 6468–6481. [Google Scholar] [CrossRef]
- Alonso, E.; Berdugo, I.; Ramon, A. Extreme expansive phenomena in anhydritic-gypsiferous claystone: The case of Lilla tunnel. Géotechnique 2013, 63, 584–612. [Google Scholar] [CrossRef]
- Li, Z.; Chen, Z.-Q.; He, C.; Ma, C.-C.; Duan, C.-R. Seepage field distribution and water inflow laws of tunnels in water-rich regions. J. Mt. Sci. 2022, 19, 591–605. [Google Scholar] [CrossRef]
- Peng, H.; Frenelus, W.; Zhang, J. Key factors influencing analytical solutions for predicting groundwater inflows in rock tunnels. Water Supply 2022, 22, 7982–8013. [Google Scholar] [CrossRef]
- Wang, Z.; Shi, W.; Jiang, K.; Yu, F.; Xiong, H.; Ai, X. Coupling analysis of stress field and seepage field in foundation pit dewatering and optimization design of reinjection. Therm. Sci. Eng. Prog. 2024, 54, 102778. [Google Scholar] [CrossRef]
- Gao, C.-L.; Zhou, Z.-Q.; Yang, W.-M.; Lin, C.-J.; Li, L.-P.; Wang, J. Model test and numerical simulation research of water leakage in operating tunnels passing through intersecting faults. Tunn. Undergr. Space Technol. 2019, 94, 103134. [Google Scholar] [CrossRef]
- Hwang, J.-H.; Lu, C.-C. A semi-analytical method for analyzing the tunnel water inflow. Tunn. Undergr. Space Technol. 2007, 22, 39–46. [Google Scholar] [CrossRef]
- Xu, N.; Tian, H.; Kulatilake, P.H.; Duan, Q. Building a three dimensional sealed geological model to use in numerical stress analysis software: A case study for a dam site. Comput. Geotech. 2011, 38, 1022–1030. [Google Scholar] [CrossRef]
- Lei, M.; Luo, S.; Chang, J.; Zhang, R.; Kuang, X.; Jiang, J. Fluid–Solid Coupling Numerical Analysis of Pore Water Pressure and Settlement in Vacuum-Preloaded Soft Foundation Based on FLAC3D. Sustainability 2023, 15, 7841. [Google Scholar] [CrossRef]
- Yang, H.; Wu, W.; Wu, X.; Xu, J.; Li, J.; Qi, Q.; Sun, W. Analysis of Disturbance and Safety Risk Assessment of Shallow-Buried Pressure Pipelines Utilizing the Shield Tunneling Method. Buildings 2025, 15, 2253. [Google Scholar] [CrossRef]
- Han, P.; Zhang, C.; He, X.; Wang, X.; Qiao, Y. DEM fluid–solid coupling method for progressive failure simulation of roadways in a fault structure area with water-rich roofs. Geomech. Geophys. Geo-Energy Geo-Resour. 2022, 8, 194. [Google Scholar] [CrossRef]
- Zhang, D.; Zhang, L.; Tang, H.; Yuan, S.; Wang, H.; Chen, S.N.; Zhao, Y. A novel fluid–solid coupling model for the oil–water flow in the natural fractured reservoirs. Physics of Fluids 2021, 33, 036601. [Google Scholar] [CrossRef]
- Ou, S.; Wang, L.; Wang, P.; Wang, Z.; Huang, J.; Zhou, D. Numerical analysis of seepage flow characteristic of collapse column under the influence of mining. Int. J. Min. Sci. Technol. 2013, 23, 237–244. [Google Scholar] [CrossRef]
- Yang, Z.; You, X.; Jin, H. Study on Numerical Simulation of Surrounding Rock Structure Safety of Urban Underwater Shield Tunnel: A Case in Chongqing. Shock Vib. 2024, 2024, 9285252. [Google Scholar] [CrossRef]
- Li, Y.; Yu, Y.; Li, L.; Guo, J.; Qin, B. Influence Factors and Sensitivity Analysis on Material-Stress-Induced Large Deformation of Deep Underground Engineering in Soft Rockmass. Buildings 2025, 15, 3887. [Google Scholar] [CrossRef]


Disclaimer/Publisher’s Note: The statements, opinions and data contained in all publications are solely those of the individual author(s) and contributor(s) and not of MDPI and/or the editor(s). MDPI and/or the editor(s) disclaim responsibility for any injury to people or property resulting from any ideas, methods, instructions or products referred to in the content. |
© 2026 by the authors. Licensee MDPI, Basel, Switzerland. This article is an open access article distributed under the terms and conditions of the Creative Commons Attribution (CC BY) license.