Abstract
Fingerprint recognition systems have relied on fragile workflows based on minutiae extraction, which suffer from significant performance losses under real-world conditions such as sensor diversity and low image quality. This study introduces a fully minutiae-free fingerprint recognition framework based on self-supervised Vision Transformers. A systematic evaluation of multiple DINOv2 model variants is conducted, and the proposed system ultimately adopts the DINOv2-Base Vision Transformer as the primary configuration, as it offers the best generalization performance trade-off under conditions of limited fingerprint data. Larger variants are additionally analyzed to assess scalability and capacity limits. The DINOv2 pretrained network is fine-tuned using self-supervised domain adaptation on 64,801 fingerprint images, eliminating all classical enhancement, binarization, and minutiae extraction steps. Unlike the single-sensor protocols commonly used in the literature, the proposed approach is extensively evaluated in a heterogeneous testbed with a wide range of sensors, qualities, and acquisition methods, including 1631 unique fingers from 12 datasets. The achieved EER of 5.56% under these challenging conditions demonstrates clear cross-sensor superiority over traditional systems such as VeriFinger (26.90%) and SourceAFIS (41.95%) on the same testbed. A systematic comparison of different model capacities shows that moderate-scale ViT models provide optimal generalization under limited-data conditions. Explainability analyses indicate that the attention maps of the model trained without any minutiae information exhibit meaningful overlap with classical structural regions (IoU = 0.41 ± 0.07). Openly sharing the full implementation and evaluation infrastructure makes the study reproducible and provides a standardized benchmark for future research.
Keywords:
fingerprint; recognition; vision transformer; deep learning; XAI; optical; capacitive; contactless; biometrics 1. Introduction
Biometric verification systems have been used for many years as reliable authentication mechanisms in a wide range of applications, including public safety, border crossings, forensic investigations, and personal access control. One of the most widespread and mature biometric methods in these fields is fingerprint recognition. The lifelong stability of fingerprints, their high level of distinctiveness, and their ease of collection with low-cost hardware have made this method a standard in both academic research and industrial applications. However, a look at the historical development of fingerprint recognition reveals that the fundamental assumptions behind traditional methods are increasingly being tested under real-world conditions. The growing variety of sensors, differences between contact and non-contact capture, structural distortions in low-quality fingerprint images, and the heterogeneity of data collection environments increasingly diverge from the design principles of traditional approaches and challenge existing systems.
The minutiae-based approach, which has formed the basis of fingerprint recognition for many years, exhibits significant structural weaknesses despite its clear advantages. Minutiae extraction relies on sequential and fragile stages such as image enhancement, binarization, thinning, orientation field generation, and ridge ending/bifurcation detection. A small error in any of these stages directly affects the entire pipeline, significantly degrading matching performance. Minutiae extraction frequently fails in samples with low resolution, blur, partial contact, excessive pressure, or sensor-induced contrast issues, leading to substantial performance losses and reliability problems in conventional systems. The sensor dependency of minutiae-based pipelines, their sensitivity to DPI differences, and their intolerance to distortions in ridge structures make it difficult for these methods to model real-world heterogeneity. Consequently, although these systems may produce high accuracy in controlled environments, they struggle to provide consistent performance under inter-sensor variation, quality variability, and other real-world conditions.
While deep learning-based approaches have been developed to overcome these limitations, most modern models in the literature have not completely eliminated minutiae-based assumptions. Although CNN architectures can successfully model local structures, they struggle to capture ridge flow holistically because they are limited in modeling long-range dependencies. Furthermore, many CNN-based studies incorporate implicit cues derived from minutiae structures or construct hybrid systems with minutiae-based verifiers. Almost all of these studies have been evaluated on single-sensor, controlled datasets. This leaves open the question of how well deep networks can generalize to real-world heterogeneity. A significant portion of the high accuracy reported in the literature stems from testing protocols with limited data diversity, which underrepresent real-world challenges such as cross-sensor transfer, contact/non-contact differences, low quality, aging, and physical degradation.
The rise of the Vision Transformer (ViT) architecture has introduced an important opportunity for fingerprint recognition due to its ability to interpret global context and model long-range relationships through the attention mechanism. However, an examination of existing Transformer-based fingerprint studies reveals that the vast majority of models still use minutiae guidance, either directly or indirectly. These architectures use minutiae information in various ways, such as guiding attention maps with minutiae locations, embedding graph-based minutiae relationships into ViT backbones, or applying supervised minutiae-driven losses, and therefore they cannot be considered truly minutiae-free. Furthermore, nearly all Transformer-based studies have been evaluated on single-sensor, ideally collected datasets. As a result, the behavior of Transformer architectures on large-scale, multi-sensor, heterogeneous datasets remains largely unexplored. To the best of our knowledge, no Transformer-based fingerprint model has been trained or tested on a dataset that encompasses different sensor types, diverse acquisition protocols, contact and non-contact captures, wide quality variation, and varying age distributions. This limitation creates a fundamental uncertainty regarding the stability, reliability, and cross-sensor consistency of Transformer architectures in real-world settings. Consequently, there remains systematic uncertainty about the extent to which the high performance reported in the literature can be transferred to real-world operational environments.
In this context, three key gaps in the literature clearly emerge: (i) the vast majority of existing methods fail to completely eliminate minutiae dependency either during training or inference; (ii) deep and Transformer-based models have only been evaluated on supervised, single-sensor datasets, leaving their ability to generalize to real-world heterogeneity uncertain; (iii) the adaptation of large-scale self-supervised Transformer models to the fingerprint domain, as well as their behavior on large heterogeneous data, has not been systematically investigated.
In this context, the novel contributions of this work are summarized below:
- The first fully minutiae-free large-scale ViT-based fingerprint model: The proposed architecture learns representations directly from raw images without minutiae coordinates, minutiae-guided attention mechanisms, or minutiae-centered losses. To the best of our knowledge, no fully minutiae-free ViT model has been trained on this scale and with this level of data diversity in the literature.
- Extensive training and evaluation on the largest and most heterogeneous ViT dataset in the literature: The dataset contains 64,801 images covering optical, capacitive, and non-contact sensors, rolled/plain impressions, different age groups, and a wide variety of quality levels, providing a broader real-world representation than any existing Transformer-based study.
- The first application of the self-supervised DINOv2 architecture to the fingerprint domain at this scale: The model transfers general visual information from self-supervised pretraining to large-scale fingerprint data distributions and learns discriminative structural relationships without relying on minutiae.
- The first comprehensive ablation of the Transformer capacity–performance relationship in the literature: Analysis across Small–Base–Large–Giant models shows that medium-capacity models are more stable and more generalizable than extremely large models in limited-data domains such as fingerprints.
- The first minutiae-free ViT approach to provide a quantitative attention–minutiae overlap analysis for explainability: Although the model is not trained with any minutiae information, the generated attention maps were quantitatively shown to significantly overlap with classical minutiae regions. This indicates that the model learns structurally informative ridge regions, not merely statistical patterns.
- A multi-sensor evaluation protocol that approximates real-world conditions: Unlike previous studies based on ideal single-sensor conditions, the proposed model was evaluated in a complex testbed consisting of heterogeneous sensors, making it a distinctive contribution to the Transformer-based biometric literature.
Taken together, these contributions not only introduce a minutiae-free approach that achieves high accuracy but also demonstrate that Vision Transformer architectures provide a powerful alternative for fingerprint recognition in terms of explainability and cross-sensor generalization, addressing a long-standing critical gap in the literature.
2. Related Works
Fingerprint recognition research has progressed from classical minutiae-based representations to deep learning-based approaches and, most recently, to Transformer architectures. This evolution has shifted the field from handcrafted structural descriptors toward data-driven global feature learning. Existing studies can be broadly grouped into two major categories: minutiae-guided supervised methods, which incorporate structural priors derived from minutiae points, and self-supervised or contrastive Transformer models that learn image-level representations without explicit minutiae extraction. However, as summarized in Table 1, most prior datasets and evaluation setups rely on high-quality, single-sensor fingerprint collections, limiting the generalizability of these models in heterogeneous real-world scenarios.

Table 1.
Deep Learning Methods for Fingerprint Recognition with Architecture, Task, and Performance Comparison.
2.1. Conventional and Deep Learning-Based Fingerprint Recognition
The traditional approach to fingerprint recognition has long been based on a representation paradigm built upon the extraction of the location and orientation of minutiae points. While these methods perform well in controlled environments and on high-quality images, the minutiae extraction pipeline is vulnerable to conditions such as low resolution, noise, pressure variation, finger tilt, humidity, and sensor-dependent quality differences. Therefore, minutiae-based systems exhibit significant performance degradation when exposed to data collected from different sensors or heterogeneous real-world conditions.
In the deep learning era, CNN-based methods have reduced reliance on manually designed features and succeeded in producing more discriminative representations. Models such as DeepPrint, DMD, and MRA-GNN tend to learn local texture patterns and minutiae-related structures directly from the image domain. However, CNN architectures remain limited by their inherently restricted receptive fields, their difficulty in capturing long-range dependencies, and their inability to model global contextual relationships due to being optimized on single-sensor datasets. Furthermore, because these approaches are typically trained on specific datasets and tested on the same distribution, their inter-sensor transferability and generalizability to large-scale heterogeneous datasets are limited.
An examination of the studies summarized in Table 1 indicates that a substantial portion of existing methods in the literature incorporate minutiae information either explicitly or implicitly during the training or inference stages [1,2,3,4,5,6,7]. From an architectural and learning perspective, these approaches can therefore be categorized as minutiae-guided methods. In contrast, the primary objective of this study is to investigate whether competitive fingerprint verification performance can be achieved using global representations learned directly from raw fingerprint images, without relying on any form of minutiae extraction or minutiae-based guidance. Owing to this fundamental difference in problem formulation and methodological focus, the results reported by minutiae-guided approaches do not provide a directly comparable experimental basis for the objectives of the present study.
Among the limited number of methods that do not explicitly employ minutiae guidance, RIDGEFORMER focuses on cross-domain matching between contactless and contact-based fingerprint images [8], while another line of work addresses joint representation learning across different biometric modalities, such as fingerprint and iris [9]. Based on a thorough review of the literature, it is observed that existing minutiae-free approaches are generally evaluated on relatively constrained, homogeneous, or domain-specific datasets. In contrast, the dataset employed in this study comprises a large-scale and heterogeneous collection, encompassing multiple sensor types, contact-based and non-contact acquisitions, varying image quality levels, and diverse acquisition conditions. To date, no minutiae-free fingerprint recognition model has been evaluated on a dataset that simultaneously exhibits this level of scale, heterogeneity, and multi-sensor diversity. As a result, conducting a direct, fair, and methodologically consistent experimental comparison with existing approaches remains challenging.
Within this context, the experimental comparisons in this study are conducted against VeriFinger [10] a widely adopted commercial system with well-established performance in operational settings, and SourceAFIS [11], an open-source framework that has been extensively used as a reference baseline in academic fingerprint recognition research. The inclusion of these two systems enables the proposed approach to be positioned with respect to both practical, real-world deployments and commonly accepted academic baselines.
2.2. Transformer-Based Biometric Representation
Vision Transformer (ViT)-based models [12], built upon the self-attention mechanism introduced by Vaswani et al. [13], have gained significant momentum in biometrics in recent years due to their ability to capture long-range dependencies and global structural patterns. The capability of ViT architectures to model deep contextual relationships across different modalities such as face, iris, and palm has positioned this approach as a strong candidate for fingerprint recognition as well.
Transformer-based studies in fingerprint recognition are predominantly categorized into two main groups. The first group consists of minutiae-guided approaches. In these methods, minutiae coordinates are provided as prior information to the Transformer architecture to guide attention maps or construct regional representations. Examples include Minutiae-Guided ViT, Hybrid Graph Transformer, AFR-Net, and other hybrid architectures. Although these models enhance explainability in certain cases by combining ViT’s global attention mechanism with minutiae-based structural priors, they cannot fully eliminate the vulnerabilities of classical approaches due to their continued reliance on the minutiae pipeline.
The second group consists of self-supervised or contrastive ViT models. These approaches aim to learn image-level representations from unlabeled or weakly supervised data. Models such as RIDGEFORMER have achieved strong results with contrastive learning strategies, particularly on contactless fingerprint datasets, demonstrating a degree of robustness to sensor-level domain differences. However, most studies in this category rely on limited-scale, single-sensor datasets collected under ideal conditions. The datasets shown in Table 1 consist of controlled, low-noise images captured at high resolution using commercial sensors. As a result, existing Transformer-based models have generally been trained and evaluated on data that does not reflect the heterogeneity encountered in real-world environments.
More importantly, a fully minutiae-free representation learning approach using large-scale self-supervised Transformer models has not yet been presented in the fingerprint recognition field. All existing studies either incorporate minutiae coordinates or rely on identity-supervised training protocols. Therefore, the literature currently lacks a comprehensive study on adapting a large-scale, general-purpose self-supervised ViT model such as DINOv2 to the fingerprint domain. This gap also limits our understanding of how the inherent capabilities of the Transformer architecture manifest in fingerprint feature learning.
2.3. Limitations of Existing Transformer Approaches
While current Transformer-based fingerprint recognition approaches have introduced significant advances, three fundamental limitations persist in the literature. First, most existing methods are not truly minutiae-free. Transformer architectures often rely on minutiae coordinates, local graph structures, or minutiae-centered regional configurations, which both introduce additional preprocessing steps and restrict the model’s ability to learn end-to-end representations directly from raw images. Consequently, the literature still lacks a ViT model that performs true end-to-end image-to-embedding learning. Second, all existing Transformer-based studies are trained and tested on datasets with similar distributions and collected under ideal conditions. Most studies adopt evaluation protocols in which training and test datasets largely overlap in terms of sensor types and quality characteristics. This severely limits the generalizability of models to real-world factors such as sensor variation, defocused captures, contact/non-contact acquisition differences, low image quality, and illumination changes. The number of studies evaluating Transformer models in a comprehensive, multi-sensor, multi-protocol, and varying-quality testbed is highly limited. A third limitation is the lack of explainability. Existing ViT-based fingerprint studies report attention maps only superficially, and the extent to which learned representations overlap with ridge regions or classical minutiae locations, which are critical features for classification, has not been systematically examined. Therefore, a holistic explainability analysis that accounts for both morphological consistency and comparative decision-making has not yet been presented in the literature.
In this context, training large-scale self-supervised ViT models on raw, minutiae-free data; evaluating them on multi-sensor heterogeneous datasets; and systematically performing explainability analyses could address these three key gaps simultaneously. This study proposes a new representation learning paradigm that directly targets these shortcomings.
3. Methodology
This section presents the architecture of the proposed fully minutiae-free fingerprint recognition system, including the Transformer-based representation learning process, self-supervised DINOv2 fine-tuning, training details, representation extraction, and attention-based explainability analysis. The overall workflow of the system is summarized in Figure 1, and each component is described in detail below.
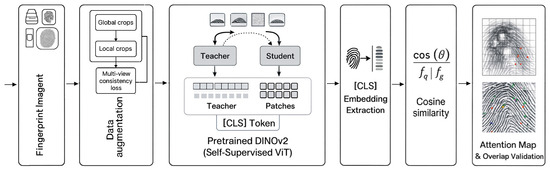
Figure 1.
Overall Workflow of the Proposed Minutiae-Free Recognition Framework.
3.1. Overview of the Proposed System
In this study, a Vision Transformer (ViT) model previously trained in a self-supervised manner on natural images using DINOv2 is retrained on a large and heterogeneous fingerprint dataset consisting of 64,801 images to build a fully minutiae-free fingerprint recognition framework. The minutiae extraction required by classical methods [1,2,3,4,5,6,7], the identity-supervised nature of CNN-based approaches, and the reliance of contrastive methods on carefully constructed positive/negative pairs [8,9] are explicitly avoided. Instead, the system learns discriminative representations directly from raw fingerprint images through self-distillation.
The proposed system consists of three main components:
- Domain-specific self-supervised fine-tuning based on the DINOv2 framework;
- Extraction of fixed-length fingerprint embeddings;
- Verification and identification using similarity-based matching.
The biometric significance of the learned representations is further evaluated through explainability analyses using classical minutiae distributions.
3.2. Transformer-Based Representation Learning
This study adopts the DINOv2-with-registers-giant configuration [14]. The model includes a 1.1B-parameter ViT encoder trained in a self-supervised manner on 142 million natural images. It contains 40 Transformer layers, 1536 hidden dimensions, and 24 attention heads. Such high capacity is important for capturing subtle ridge variations and intra-class deformations commonly observed in fingerprint biometrics. Input fingerprint images are resized to pixels and divided into 196 patches arranged in a grid. Each patch is linearly projected into a 1536-dimensional latent vector, after which 2D sinusoidal positional encodings are added. Four learnable register tokens are incorporated into the architecture to mitigate the “attention sink” problem observed in deep Transformer models. Each Transformer block consists of multi-head self-attention (MHSA) and feed-forward layers. The attention mechanism models relationships among all tokens, enabling the learning of long-range dependencies. The final [CLS] token is used as the 1536-dimensional fingerprint representation. Although the DINOv2-Giant configuration is described to present the full architectural design space, the proposed fingerprint recognition system primarily relies on the DINOv2-Base model (86 M parameters), which is used in the main experimental evaluations.
3.3. Self-Supervised Fine-Tuning with DINOv2
The fine-tuning process adheres to the teacher–student self-distillation principles of DINOv2 [15]. The pretrained encoder is re-optimized using multiple augmented views of each fingerprint image. For every input image, two global crops () and eight local crops () are generated. This multi-view strategy enables the ViT to learn identity-preserving features from both global ridge flow and local ridge topology. The teacher network processes only the global crops, while the student network processes all views. This asymmetric structure helps stabilize training and prevents model collapse.
The model generates smooth probability distributions over a 65,536-dimensional prototype space using temperature parameters (student) and (teacher). The DINO loss enforces cross-view consistency:
where denotes teacher global views, V denotes all student views, and K denotes the number of prototypes. The teacher network parameters are updated with a momentum schedule increasing from 0.994 to 1.0 throughout training. This approach allows the model to learn fingerprint-specific structural patterns while preserving general visual knowledge acquired during pretraining on natural images.
3.4. Training Details (Augmentation and Optimization)
A comprehensive data augmentation pipeline was applied during training. Geometric augmentations include rotation, translation, 0.8–1.2 scaling, and elastic deformation (, ). Photometric augmentations include brightness/contrast adjustments, Gaussian noise (), and grayscale conversion with a 10% probability. Fingerprint-specific augmentations include morphological operations simulating dry and wet finger conditions, as well as random rectangular masking (0–50% area). The multi-crop strategy provides additional implicit multi-scale augmentation. Training was performed using the AdamW optimizer [16] (, ). The learning rate was linearly warmed up over 10,000 iterations to a peak value of and then decreased to using cosine decay. A weight decay of 0.04 was applied for regularization. A batch size of 64 was distributed across two NVIDIA A6000 GPUs with mixed-precision (FP16) computation. The model was trained for approximately 50,000 iterations (100 epochs), requiring around 10 h in total.
3.5. Representation and Similarity Computation
Fingerprint embeddings are obtained from the [CLS] token in the final Transformer layer. The resulting 1536-dimensional vector is L2-normalized, yielding a unit-length representation suitable for similarity comparison. The similarity score between a query fingerprint and a gallery fingerprint is computed using cosine similarity:
A match is accepted when the similarity exceeds a threshold , which is determined based on the operating point selected on the ROC curve. The evaluation protocol employs a single decision threshold applied uniformly across all samples. Template aggregation strategies were not used, as the protocol targets single-impression verification scenarios typical of real-world deployments. Quality-aware or adaptive thresholding was also not applied, with model robustness assessed through heterogeneous data composition rather than quality-specific operating points.
3.6. Explainability via Attention Maps
Explainability analysis is conducted using the final-layer attention matrix . For visualization, the attention weights from the [CLS] token to the 196 patch tokens are extracted and reshaped into a grid, then upsampled to the original image resolution, producing attention heat maps that highlight the regions most influential in the model’s decisions. The spatial correspondence between these attention maps and minutiae points extracted using the VeriFinger SDK [10] is assessed. Intersection-over-Union (IoU) and mean distance metrics quantify the degree to which the model attends to forensically meaningful fingerprint structures.
3.7. Evaluation Protocol and Performance Metrics
The 64,801-image dataset was partitioned into 51,938 training and 12,863 testing images with no subject overlap between splits. To ensure reliable and unbiased evaluation, the test subset was filtered to include only fingerprints with at least three impressions per finger. This criterion provides a sufficient number of genuine comparisons for estimating within-identity variability while preserving diversity across sensors and subjects. After applying this constraint, the evaluation subset consisted of 1631 unique fingers. Recognition performance was quantified using standard biometric evaluation metrics computed through pairwise comparisons:
- Equal Error Rate (EER): The operating point where the False Accept Rate (FAR) equals the False Reject Rate (FRR), providing a single, interpretable summary measure of verification accuracy.
- Area Under the ROC Curve (AUC): A global measure of discriminative capability derived from the ROC curve, representing the trade-off between True Accept Rate (TAR) and FAR across all thresholds.
- TAR at Fixed FAR: TAR values were computed at commonly used operating points corresponding to FAR ≈ 10% (consumer-grade security), 1% (standard security), and 0.1% (high-security) in order to assess performance under varying security requirements.
- Score Separation (d-prime): A statistical metric quantifying the separation between genuine and impostor score distributions, computed as the difference in their means normalized by the pooled standard deviation.
All metrics were derived using complete genuine and impostor score distributions without subsampling, ensuring statistically robust and unbiased evaluation consistent with standard biometric testing protocols.
4. Experimental Results
This section presents a comprehensive evaluation of the proposed minutiae-free fingerprint recognition framework. The dataset partitioning and evaluation setup are described first (Section 4.1), followed by an analysis of dataset characteristics including image quality, sensor diversity, and finger region distribution (Section 4.2). Verification performance is then reported (Section 4.3), along with model efficiency metrics (Section 4.4) and quality distribution analysis (Section 4.5). The proposed approach is compared against baseline methods (Section 4.6), and the explainability of learned representations is analyzed through attention visualization and quantitative validation (Section 4.7). Feature space visualization is presented in Section 4.8. Finally, an ablation study examines the impact of model capacity (Section 4.9). All primary verification results are reported using the DINOv2-Base model, while the Small, Large, and Giant variants are systematically evaluated to analyze model scaling behavior.
4.1. Dataset Partitioning and Evaluation Setup
A total of 64,801 fingerprint images were compiled from multiple datasets encompassing diverse acquisition conditions. These datasets collectively cover a wide range of sensor modalities (optical, capacitive), capture methods (rolled and plain impressions), and acquisition types including both contact-based and contactless fingerprints. All samples were normalized to 500 DPI and resized to pixels to ensure cross-dataset consistency. No identity labels were used during training. A detailed dataset composition is summarized in Table 2.
Table 2.
Composition and Distribution of the Fingerprint Dataset.
The evaluation protocol leverages a multi-sensor fingerprint collection that deliberately includes varying acquisition conditions and image quality levels. Each fingerprint identity belongs to a single source dataset with a consistent sensor type and capture method, while cross-sensor heterogeneity is achieved by aggregating identities from multiple independent databases. This design ensures that sensor diversity manifests at the population level rather than within individual identities, preventing sensor-related identity leakage while maintaining realistic cross-device evaluation conditions. The resulting quality distribution spans low, medium, and high quality samples, encompassing partial prints, motion blur, and pressure artifacts alongside well-formed ridge structures. Such heterogeneity presents a substantially more challenging evaluation scenario than homogeneous single-sensor benchmarks, thereby providing a conservative assessment of model generalization and a realistic proxy for operational deployment conditions.
The complete dataset was partitioned into 51,938 training and 12,863 testing images with no subject overlap between splits. Each split maintains proportional representation from all source databases, ensuring that the test set reflects the same heterogeneous sensor distribution as the training data. To ensure statistically reliable estimation of genuine and impostor score distributions, which is required in exhaustive verification protocols, only fingers with at least three impressions in the test split were included. This filtering step removes identities with insufficient intra-class variability and prevents unstable genuine-pair statistics arising from identities represented by only one or two noisy impressions. After applying this quality-control criterion, the final evaluation subset contained 1631 distinct fingers, comprising 11,579 fingerprint images, drawn from the original 2857-finger test set population, and used for all verification experiments. Impostor comparisons were performed using a representative sampling strategy. For each pair of distinct finger identities, one randomly selected image pair was included in the evaluation, yielding a total of 1,367,031 impostor pairs. A summary of the test set and the final evaluation subset is provided in Table 3. The dataset used in this study represents the most comprehensive and heterogeneous collection among ViT-based fingerprint recognition research. It includes samples acquired with optical and capacitive sensors, captured through contact, contactless, rolled, and plain impressions, and collected from subjects of different ages and demographics. Each identity in the evaluation subset originates from a single dataset and is therefore associated with a fixed sensor and acquisition protocol, while sensor diversity is introduced across identities at the dataset level. This diversity naturally leads to substantial variation in data quality, with some images showing deformation, blur, or partial impressions while others contain clear and well-defined ridge patterns. Although this variability increases the difficulty of the evaluation setting, it significantly strengthens the model’s robustness and generalization across sensors and acquisition conditions. While smaller than natural image datasets, the dataset used here is still among the largest and most diverse fingerprint collections in ViT-based studies, providing a realistic evaluation environment and enabling effective domain-specific adaptation of pretrained DINOv2 representations. Table 4 summarizes the acquisition protocols, sensor types, and quality characteristics of the employed datasets.
Table 3.
Summary of the Test Set and the Final Evaluation Subset.
Table 4.
Acquisition settings, sensor diversity, and NFIQv2-based quality distribution of the Employed datasets.
Verification performance was assessed using a pairwise comparison protocol, in which similarity scores were computed between image pairs within the filtered test subset. This included both genuine pairs, which consist of multiple impressions of the same finger, and impostor pairs, which are formed by images originating from different fingers. For genuine comparisons, all possible pairs from the same finger were evaluated, yielding 1654 genuine pairs. For impostor comparisons, a statistically representative sample of 1,367,031 pairs was generated to ensure robust estimation of the impostor score distribution while maintaining computational feasibility. This evaluation protocol balances statistical reliability with practical efficiency, providing sufficient coverage to accurately characterize both genuine and impostor score distributions.
4.2. Dataset Characteristics: Image Quality, Sensor Type, and Finger Region
To facilitate a more accurate interpretation of the experimental results reported in this study, the employed datasets were analyzed in terms of image quality, sensor type, and finger region characteristics. During this analysis, particular attention was paid to the fact that the reported performance metrics were not derived from a specific or homogeneous data subset, but rather from a heterogeneous data composition encompassing diverse acquisition conditions, sensor technologies, and quality levels. In this context, the main characteristics of the utilized datasets are summarized below:
- Image Quality: Considering the NFIQv2 quality scores, the datasets used in this study are not composed solely of high-quality fingerprint images; instead, they exhibit a broad and natural distribution covering low-, medium-, and high-quality levels. In particular, the NIST SD301/SD302 series and the CASIA-Fingerprint-Subject-Ageing dataset include challenging scenarios with a high proportion of low- and medium-quality samples due to pressure variations, smearing effects, partial impressions, and temporal skin changes. Although datasets such as CASIA-FingerprintV5 and PolyU were acquired under relatively controlled conditions, quality variability remains present due to user-dependent pressure and finger placement differences. The FVC2000/2002/2004 series were collected using different sensors and acquisition settings, and the FVC2004 dataset in particular is widely regarded as a challenging benchmark owing to its lower average quality and higher distortion levels. This diversity enables the evaluation of the model’s overall robustness across different image quality conditions within a single experimental setting.
- Sensor Type and Acquisition Style: The employed datasets form a heterogeneous collection encompassing different sensor types and acquisition styles. The CASIA, PolyU, and FVC datasets primarily consist of flat fingerprint images acquired using optical sensors, whereas the NIST SD301 and SD302 datasets contain rolled fingerprint impressions that are characteristic of forensic and law-enforcement acquisition protocols. The Neurotechnology_D1 and Neurotechnology_D2 datasets reflect operational conditions close to commercial AFIS systems and consist of fingerprint images captured using commercial optical sensors. This diversity indicates that the evaluated model is not optimized for a single sensor type or acquisition protocol, but instead demonstrates generalizable performance across different sensing technologies and acquisition styles.
- Finger Region (Tip/Center): Explicit and reliable annotations distinguishing finger regions (e.g., tip versus center) are not available for the majority of the employed datasets. Nevertheless, rolled fingerprint images in the NIST SD301/SD302 series predominantly contain central fingerprint regions due to their acquisition procedure, whereas flat fingerprint datasets such as CASIA, FVC, and PolyU naturally include partial impressions, fingertip-dominant samples, and off-center placements. Consequently, variations related to finger regions were incorporated into the evaluation as an inherent outcome of the acquisition process rather than through explicitly defined subgroups. This approach allows the assessment of the model’s representation capability without imposing dependency on a specific finger region.
When considered collectively, these datasets bring together diverse image quality levels, sensor types, and acquisition styles within a single evaluation framework (Table 4). Accordingly, the reported overall performance metrics reflect not a success limited to a specific quality range, sensor type, or finger region, but rather a comprehensive performance obtained under heterogeneous conditions representative of real-world biometric systems.
4.3. Verification Performance
Table 5 presents verification performance metrics across critical operating points. The model achieves an EER of 5.56%, representing the optimal operating threshold where FAR equals FRR. This single-value metric facilitates direct comparison with prior work. At the EER threshold, the model demonstrates balanced performance with a TAR of 94.38%. The AUC of 0.9877 quantifies aggregate discriminative capacity across all decision thresholds, indicating strong overall separation between genuine and impostor score distributions. At practical operating points, the system achieves a TAR of 78.18% when configured to permit a FAR of approximately 1%, a threshold suitable for standard security applications requiring a balance between usability and protection. When relaxed to a 10% FAR threshold for consumer-grade access control applications where user convenience is prioritized, the model achieves a substantially higher TAR of 98.19%, demonstrating strong usability in permissive security settings (Figure 2). The achieved EER of 5.56% positions the base model competitively within the contemporary minutiae-free fingerprint recognition landscape, particularly when contextualized by the challenging evaluation framework: a deliberately heterogeneous test set spanning multiple sensor types, capture modalities, and quality levels. This mixed-sensor evaluation strategy provides a more realistic assessment of practical deployment performance compared to homogeneous single-sensor benchmarks commonly employed in prior work. For fair comparison, all baseline systems were evaluated using the same resized fingerprint images as the proposed method. No original-resolution images or method-specific preprocessing were provided to any baseline, ensuring identical input conditions across all evaluated systems.
Table 5.
Verification Performance on the Test Set.
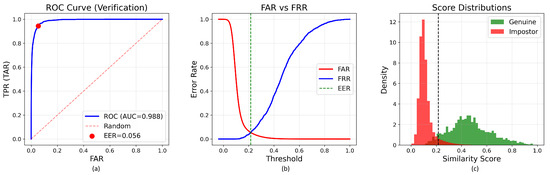
Figure 2.
Verification performance metrics for the base model (86 M parameters). (a) Receiver Operating Characteristic curve showing Area Under Curve of 0.987 with Equal Error Rate of 5.56%. (b) False Accept Rate and False Reject Rate as functions of similarity threshold. (c) Distribution of genuine and impostor similarity scores demonstrating d-prime separation of 0.354. The vertical dash line in subfigures (b,c) indicates the decision threshold corresponding to the Equal Error Rate (EER).
The score separation (d′ = 0.354) indicates substantial statistical distance between genuine and impostor distributions, validating that self-supervised DINO pretraining discovers discriminative fingerprint representations without explicit minutiae supervision or identity labels. The relatively high genuine mean score (0.467) compared to the impostor mean score (0.113) demonstrates consistent within-class similarity and between-class dissimilarity, which are fundamental requirements for reliable biometric matching. Notably, the FRR of only 1.81% at the 10% FAR operating point indicates that legitimate users experience minimal authentication failures under consumer-grade security settings. This low-friction characteristic is critical for user acceptance in commercial deployments, suggesting that the minutiae-free approach does not sacrifice usability while offering advantages such as preprocessing elimination and improved robustness under heterogeneous sensor conditions. At more stringent security levels (1% FAR), the system achieves a TAR of 78.18% (FRR: 21.82%), demonstrating a practical trade-off between security and usability that can be adjusted based on deployment requirements. For high-security applications requiring FAR ≤ 0.1%, the model achieves a TAR of 36.64%, indicating the natural performance degradation expected when operating under extremely restrictive false acceptance constraints.
4.4. Model Efficiency and Inference Cost
Although the proposed framework is based on a Vision Transformer architecture, practical deployment considerations such as inference speed and memory footprint are also critical, particularly for large-scale biometric systems. To address this aspect, we report a comprehensive efficiency analysis of the evaluated models, focusing on inference latency, throughput, memory usage, and model size.
All efficiency measurements were conducted on an NVIDIA RTX A6000 GPU using a batch size of one, which reflects a realistic fingerprint verification scenario where individual samples are processed sequentially. Inference latency was measured by averaging the forward-pass time over multiple runs after an initial warm-up phase to stabilize GPU kernels. Throughput was computed as the inverse of the average latency. GPU memory consumption was reported as the peak allocated memory during inference, and disk usage corresponds to the total size of the stored model files. The number of parameters and FLOPs were included to provide additional insight into the computational complexity of each model.
As shown in Table 6, the Base ViT model achieves a favorable balance between recognition performance and computational efficiency. Despite having 86.58 million parameters, it requires only 3.15 ms per image during inference and consumes approximately 359 MB of GPU memory, making it well suited for server-side or centralized biometric verification systems. Smaller variants offer lower memory usage and slightly higher throughput, while larger models incur substantially higher computational and memory costs without proportional practical benefits. These results indicate that the selected Base ViT configuration provides an effective trade-off between accuracy and deployment efficiency.
Table 6.
Computational Efficiency and Inference Cost of the Evaluated Models.
4.5. Image Quality Distribution of the Evaluation Set
To analyze the image quality characteristics of the evaluation data, the NFIQv2 quality scores of all test images were examined. Figure 3 illustrates the distribution of NFIQv2 scores across the evaluation set. As shown in Figure 3, the dataset spans a broad range of quality levels, including low-, medium-, and high-quality fingerprint images, rather than being dominated by high-quality samples.
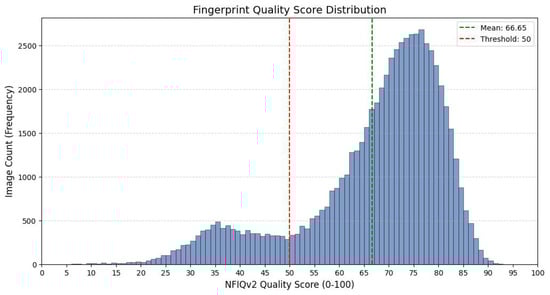
Figure 3.
Distribution of NFIQv2 fingerprint quality scores in the evaluation set. The histogram shows that the test data cover a wide range of quality levels, including low-, medium-, and high-quality samples, indicating a heterogeneous and challenging evaluation scenario.
This heterogeneous quality distribution indicates that the reported overall EER reflects model performance under diverse and challenging image quality conditions. Consequently, the overall EER is considered a meaningful measure of the model’s robustness across varying quality levels in realistic operational scenarios.
4.6. Comparison with State-of-the-Art
The comparative analysis conducted to determine the position of the proposed minutiae-free approach in the literature is limited by the large absence of reproducible implementations, particularly in Vision Transformer-based methods. The literature review (Section 2) shows that most recent works, such as Minutiae-Guided ViT [4], AFR-Net [5], IFViT [6], Hybrid Graph Transformer [7], RIDGEFORMER [8], and Bi-Encoder [9], do not offer accessible implementations. This prevents independent validation of the models under the same experimental conditions and a fair comparison. Furthermore, because these methods rely on different sensors, single-sensor homogeneous protocols, or custom multi-database structures, direct comparison of published EER values is methodologically unreliable. Therefore, this study adopted a more robust and controllable evaluation strategy by focusing only on direct experimental comparisons with systems whose implementations are accessible.
4.6.1. Evaluation of Traditional and Modern Fingerprint Recognition Approaches
To holistically assess the position of the proposed minutiae-free model in the literature, this section presents a unified comparison framework encompassing both traditional minutiae-based systems with reproducible implementations and the results reported in the literature for modern Vision Transformer-based methods. This framework positions our model alongside both systems that can be directly measured under the same conditions and approaches that are not reproducible but have reported strong results in the literature.
The first component of this unified evaluation is based on two minutiae-based systems widely used in operational practice, SourceAFIS [11] and VeriFinger [10]. SourceAFIS represents an open-source implementation of the classical minutiae pipeline, where ridgeline endings and bifurcation points are extracted using image processing algorithms and then mapped using geometric relationships. VeriFinger is one of the most mature examples of this approach, a proprietary SDK that has been optimized over many years and is considered an industry standard. Both systems were evaluated using the same representative sampling strategy on a filtered test subset of 1631 fingers, identical to the one used for the proposed model. For each pair of distinct finger identities, one randomly selected image pair was included in the evaluation. EER, AUC, and other performance metrics were calculated using the same evaluation protocol (Section 3.7) used for the proposed model. The results are summarized in Table 7.
Table 7.
Performance Comparison Between the Proposed Model and Minutiae-Based Baselines.
This evaluation was conducted on a challenging heterogeneous testbed containing a variety of optical, capacitive, and non-contact sensors from six different databases (Table 2). Such testbeds clearly expose the vulnerability of traditional minutiae-based systems, which exhibit high accuracy on single-sensor homogeneous datasets, to variations in resolution, contrast, and noise due to sensor differences. Indeed, the results demonstrate a significant difference between the systems: VeriFinger achieved a 26.90% EER and 0.8209 AUC, while SourceAFIS performed poorly with a 41.95% EER and 0.6181 AUC. In contrast, the proposed Vision Transformer model achieved only a 5.56% EER and 0.9877 AUC, demonstrating a much more effective separation of genuine and impostor score distributions. The main reason for this performance difference is that minutiae-based systems rely on fragile preprocessing steps such as ridge enhancement, binarization, direction field estimation, and thinning, which are highly sensitive to inter-sensor variance. Errors in these steps directly impact minutiae extraction and, consequently, matching; they lead to the generation of empty or incorrect minutiae templates and a sharp increase in FRR, particularly in low-quality images. In contrast, the proposed self-supervised ViT model, by fine-tuning the DINOv2 pretrained weights on fingerprint data using domain adaptation, can learn sensor-independent high-level structural and textural representations and gradually maintain its performance even when image quality degrades. Furthermore, the model’s elimination of fragile hand-crafted steps such as segmentation, enhancement, refinement, and minutiae extraction removes the error chain and provides a leaner and more sustainable recognition pipeline.
The second component of the comparison covers modern Vision Transformer-based approaches reported in the literature. Since many recent works, such as IFViT [6], MRA-GNN [3], Hybrid Graph Transformer [7], and Bi-Encoder [9], do not provide reproducible source code, it is not possible to experiment with these models directly on the same dataset. Furthermore, the majority of these studies perform their evaluations on single-sensor homogeneous datasets such as FVC2004 and therefore report very low EER values in the range of 0.26–2%. However, because these values are specific to controlled conditions that do not include different sensor types, they cannot be directly compared to results obtained on heterogeneous datasets.
At this point, the closest comparison to the proposed model is with RIDGEFORMER [8], a Vision Transformer-based model that learns a self-supervised representation without using minutiae. RIDGEFORMER results reported in the literature reveal that error rates increase significantly when the evaluation conditions include sensor diversity (Table 8). For example, while a 2.83% EER is reported on the single-sensor HKPolyU contactless fingerprint dataset, the error rate rises to 5.25% EER in the contactless-to-contact matching scenario and to 7.60% EER in the contactless-to-contactless conditions, where sensor heterogeneity is highest. This increase clearly demonstrates that heterogeneous protocols are significantly more demanding than single-sensor tests. In contrast, the proposed model achieves an EER of 5.56% in a broader heterogeneous test environment containing a variety of optical, capacitive, and contactless sensors, directly competing with the most successful minutiae-free Transformer approaches in the literature.
Table 8.
RIDGEFORMER Performance Results.
4.6.2. Methodological Differentiation
Beyond the reproducibility challenge, a critical methodological distinction exists between the proposed approach and several prior Vision Transformer methods. Works such as Minutiae-Guided ViT [4] and IFViT [6], while classified as “minutiae-free” and eliminating minutiae coordinates at inference time, incorporate minutiae point locations as attention guidance or auxiliary supervision signals during the training phase. This design choice retains partial minutiae dependency in the learning process, necessitating minutiae annotation for training data and limiting scalability. In contrast, the proposed method achieves complete minutiae independence throughout both training and inference. No minutiae annotations, coordinates, or extraction algorithms are employed during training. The model is initialized with DINOv2 weights pretrained via self-supervised learning on natural ImageNet images and then fine-tuned on fingerprint images using self-supervised DINO learning without any minutiae-based guidance or identity supervision during training. At inference, the framework operates directly from raw fingerprint images to fixed-length embeddings, without any enhancement, binarization, minutiae extraction, localization or handcrafted descriptor computation. Similarity scores are then derived from these embeddings using standard comparison functions. This streamlined workflow ensures that the entire recognition process remains fully minutiae-free in both training and deployment, offering a more complete realization of the minutiae-free paradigm than prior studies.
4.7. Explainability Analysis
To validate that the learned representations capture semantically meaningful fingerprint structures, attention patterns of the Vision Transformer were analyzed (Section 3.6). This analysis serves two purposes: (1) qualitative visualization of attended regions, and (2) quantitative validation that attention aligns with traditional minutiae locations.
4.7.1. Attention Map Visualization
Attention responses from the final transformer layer were visualized to inspect which spatial regions contribute most to the fingerprint embedding. For each image, the attention vector from the [CLS] token to all patch tokens was reshaped into a 14 × 14 grid and bilinearly upsampled to the input resolution. Representative examples are shown in Figure 4, covering both high-quality (Rolled, NIST SD302a), medium-quality (PolyU, CASIA-FingerprintV5), and degraded-quality impressions (NIST 302b/302d). Across all samples, the Vision Transformer consistently concentrates attention on ridge flow transitions, high curvature regions, and bifurcation like local patterns, despite having never been trained with any explicit minutiae supervision (Figure 4). High-quality images exhibit sharply localized responses, while low-quality or noisy images display broader but still meaningful attention clusters. Importantly, the model does not produce arbitrary or edge-dominated responses; instead, attention aligns with structural fingerprint regions such as delta areas, cores, and ridge convergence points. These qualitative findings suggest that the self-supervised ViT internally discovers spatially coherent and structurally relevant regions that resemble classical minutiae-rich areas.
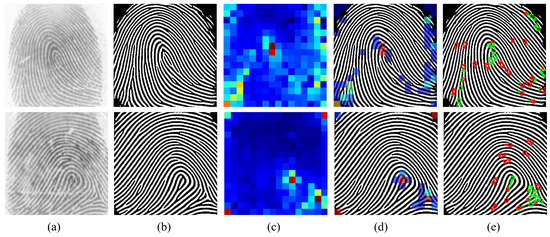
Figure 4.
Illustration of the proposed attention–minutiae alignment analysis for different fingerprint examples. (a) Original Input, (b) Restored Input, (c) Attention Map (PCA), (d) Filtered Overlay, (e) Result (>0.25).
4.7.2. Quantitative Minutiae Overlap Validation
To quantitatively examine whether the learned attention patterns align with traditional fingerprint structures, extracted minutiae points from the VeriFinger SDK were used as ground-truth structural references. For each fingerprint, a binary minutiae mask was constructed by marking a circular neighborhood (radius = 12 pixels) around each detected minutia. The attention map A was thresholded at the 90th percentile to generate a binary attention mask M, following the standard practice in transformer explainability studies.
Two metrics were computed. The Intersection-over-Union (IoU) is defined as
where A and M denote the predicted region and the ground-truth region, respectively.
The Mean Attention–Minutiae Distance is computed as
where are minutiae coordinates and p is a high-attention pixel. These metrics were averaged across 1631 fingers and 11,579 impressions. Results are reported in Table 9.
Table 9.
Quantitative Attention–Minutiae Overlap Statistics.
The choice of the 90th percentile threshold is motivated by the functional role of attention maps in this analysis, which is to isolate the most salient and semantically dominant regions contributing to the learned representation. Lower percentile thresholds tend to expand the attention mask by including weakly activated regions, thereby shifting the interpretation of the overlap metrics toward spatial coverage rather than structural relevance. Conversely, excessively high thresholds produce overly sparse masks that are sensitive to minor spatial variations and lead to unstable overlap measurements. The 90th percentile represents a balanced operating point that suppresses background noise while preserving the most informative attention responses, yielding interpretable and robust attention masks consistent with established practices in Vision Transformer explainability.
4.8. Feature Visualization and Representation Analysis
To further examine the discriminative structure of the learned feature representations, t-distributed Stochastic Neighbor Embedding (t-SNE) is employed to project the high-dimensional fingerprint embeddings into a two-dimensional space. This visualization is intended to provide an intuitive assessment of intra-class compactness and inter-class separability within the learned feature space. Figure 5 presents the t-SNE projection of embeddings corresponding to 50 randomly selected fingerprint identities. Each color denotes a distinct identity. As observed, samples belonging to the same identity are grouped into compact and well-defined clusters, whereas embeddings associated with different identities are clearly separated. This distribution indicates that identity-discriminative representations are effectively captured by the proposed model. Furthermore, the clustering behavior remains consistent despite the heterogeneity of the evaluation data, which includes fingerprints acquired under different sensor technologies and acquisition conditions. This qualitative analysis complements the quantitative verification results and provides additional evidence regarding the robustness and discriminative capability of the learned feature representations.
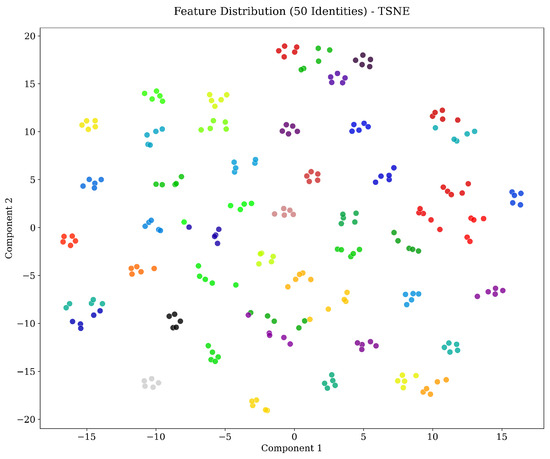
Figure 5.
t-SNE visualization of the learned fingerprint embeddings for 50 identities. Each color corresponds to a distinct finger identity. Compact intra-class clustering and clear inter-class separation are observed across heterogeneous acquisition conditions.
4.9. Ablation Study: Model Capacity
To examine how model capacity affects fingerprint recognition performance under transfer learning, four DINOv2 pretrained Vision Transformer variants (small with 22 M parameters, base with 86 M, large with 304 M, and giant with 1.1 B) were fine-tuned on the same training set of 64,801 fingerprint images. All models were initialized with ImageNet pretrained DINOv2 weights and optimized using identical configurations (Section 3.4), ensuring that capacity was the only varying factor. Evaluation was conducted on the same test partition for fair comparison (Figure 6, Figure 7 and Figure 8).
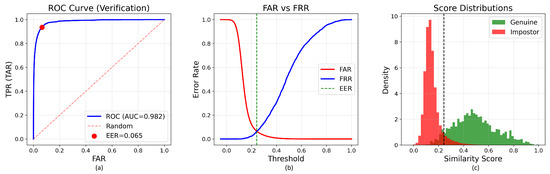
Figure 6.
Verification performance metrics for the small model. (a) ROC curve showing AUC of 0.9823 with Equal Error Rate of 6.50%. (b) FAR and FRR as functions of similarity threshold. (c) Distribution of genuine and impostor similarity scores demonstrating d-prime separation of 0.348. The vertical dash line in subfigures (b,c) indicates the decision threshold corresponding to the Equal Error Rate (EER).
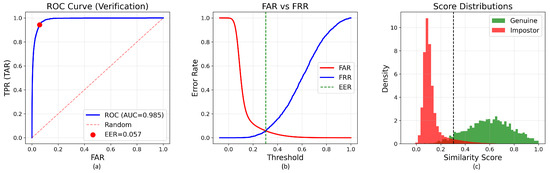
Figure 7.
Verification performance metrics for the large model. (a) ROC curve showing AUC of 0.9854 with Equal Error Rate of 5.75%. (b) FAR and FRR as functions of similarity threshold. (c) Distribution of genuine and impostor similarity scores demonstrating d-prime separation of 0.471. The vertical dash line in subfigures (b,c) indicates the decision threshold corresponding to the Equal Error Rate (EER).
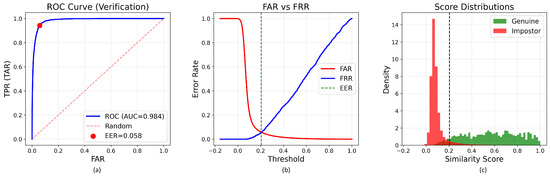
Figure 8.
Verification performance metrics for the giant model. (a) ROC curve showing AUC of 0.9843 with Equal Error Rate of 5.80%. (b) FAR and FRR as functions of similarity threshold. (c) Distribution of genuine and impostor similarity scores demonstrating d-prime separation of 0.485. The vertical dash line in subfigures (b,c) indicates the decision threshold corresponding to the Equal Error Rate (EER).
Main Results. As summarized in Table 7, the base model consistently achieves the best overall performance, obtaining an EER of 5.56% and AUC of 0.9877. This represents a 14.5% relative improvement over the small model (6.50% EER) and a 4.1% improvement over the giant model (5.80% EER). The large model achieves intermediate performance with 5.75% EER and 0.9854 AUC. These results reveal a non-monotonic relationship between model capacity and fine-tuning performance: increasing capacity from small to base yields clear improvements across all metrics (EER: 6.50% → 5.56%, AUC: 0.9823 → 0.9877), but further scaling to giant leads to performance degradation (EER: 5.56% → 5.80%, AUC: 0.9877 → 0.9843), indicating overfitting rather than effective adaptation (Table 10).
Table 10.
Verification Performance Comparison Across Model Variants.
Operating Point Analysis. The base model’s superiority is particularly pronounced at practical operating points. At the critical 1% FAR threshold, the base model achieves 78.18% TAR, substantially outperforming both the large model (69.96%) and giant model (67.60%). This advantage becomes even more dramatic under stringent security requirements: at 0.1% FAR, the base model achieves 36.64% TAR compared to 27.57% for large and only 24.55% for giant. Even at the consumer-grade 10% FAR threshold, the base model maintains strong performance (98.19% TAR), closely matching large (98.31%) while exceeding giant (97.82%) and small (96.61%). These results demonstrate that larger architectures fail to leverage their increased capacity effectively under the current data regime.
The D-prime Paradox. Interestingly, the giant model produces the highest score separation (), followed by large (), yet this greater statistical separability does not translate into better operational performance compared to the base model (). This mismatch suggests that the giant model forms overly confident but less reliable decision boundaries, capturing training-specific patterns that fail to generalize to unseen fingerprints. The elevated d-prime therefore reflects memorization rather than improved discriminative capability. This phenomenon is corroborated by the giant model’s substantially lower TAR at critical operating points despite higher score separation.
Explanation: Data-to-Parameter Ratio. The performance differences across model variants can be explained by the data-to-parameter ratio during fine-tuning. Although all models are trained on the same 64,801 fingerprint images, their parameter counts differ dramatically, resulting in vastly different supervision densities: small (∼2945 images per million parameters), base (∼754), large (∼213), and giant (∼59). In transfer learning settings, large pretrained models require substantially more domain-specific data to adapt without overfitting. The giant model’s parameters therefore receive insufficient fingerprint-specific supervision, causing memorization of training patterns instead of learning generalizable features. The large model shows intermediate overfitting behavior with 5.75% EER, also representing degradation compared to base. In contrast, the base model’s moderate capacity provides a favorable “Goldilocks zone”: it is large enough to effectively adapt the pretrained DINOv2 features (768 hidden dimensions, 12 layers, 12 attention heads), yet not so large as to overfit the limited fingerprint dataset. The small model, despite its high data-to-parameter ratio, underfits the task, lacking sufficient representational power to capture fingerprint-specific structures beyond generic ImageNet features. This progression illustrates that, under limited-data conditions, moderate-capacity models can outperform both smaller and larger architectures, even when all models benefit from strong pretrained initialization.
Model Selection and Computational Efficiency. Based on these results, the base model was selected as the primary architecture for all subsequent experiments. This choice is supported by three key factors. First, the base model delivers the strongest fine-tuning performance, achieving the lowest EER (5.56%) and highest AUC (0.9877) among all variants. Second, it offers superior generalization across all operating points, particularly at 1% FAR where it substantially outperforms alternatives despite having 3.5× fewer parameters than large and 13× fewer than giant. Third, this computational efficiency (12 layers vs. 24 vs. 40) makes it more suitable for deployment in resource-constrained environments while maintaining optimal accuracy.
Broader Implications. These results provide important insights into the use of large pretrained vision models for biometric recognition under relatively limited domain-specific data (∼65 K images). First, increasing model size does not necessarily translate into better fine-tuned performance; transfer learning effectiveness remains strongly influenced by the ratio of available training data to model capacity. Second, even with powerful pretrained representations, excessively large models can overfit during fine-tuning when domain data is insufficient. Third, moderate-capacity architectures often provide the best balance between adaptability and generalization in such settings. The base model achieves 5.56% EER and 78.18% TAR at 1% FAR in this regime, demonstrating that optimal transfer learning performance depends not only on pretraining quality, but critically on the alignment between model capacity and available fine-tuning data. While the giant model would likely realize its full potential when fine-tuned on substantially larger fingerprint datasets (hundreds of thousands of identities), the current data regime clearly favors the base model. Under these conditions, the base model offers the most favorable trade-off between accuracy, computational efficiency, and generalization capability for minutiae-free fingerprint recognition using self-supervised transfer learning.
5. Discussion and Contributions
This section provides a broader interpretation of the experimental findings and places the proposed framework in the context of existing fingerprint recognition research. Beyond reporting performance metrics, it evaluates the methodological implications of removing minutiae from the recognition pipeline and discusses how the proposed approach addresses long-standing limitations related to sensor variability and real-world heterogeneity. The key contributions of the study are summarized below.
5.1. Contributions of the Proposed Minutiae-Free ViT Framework
Existing approaches in fingerprint recognition, whether based on classical minutiae-driven pipelines or Transformer architectures, still suffer from structural dependencies, sensor-related constraints, and limited generalization capacity. This work departs significantly from prior studies by introducing a self-supervised Transformer-based framework that completely removes minutiae dependency in both the training and inference phases and is validated on a large and heterogeneous dataset spanning multiple sensor types. The original contributions of this work to the literature are summarized systematically as follows:
- 1.
- The first fully minutiae-free ViT-based fingerprint recognition framework: This study introduces the first fully minutiae-free fingerprint recognition model built upon large-scale self-supervised Vision Transformer (ViT) representations. While nearly all existing Transformer-based works rely on minutiae coordinates, minutiae-driven attention mechanisms, or minutiae-based supervision during training, this study eliminates the use of minutiae entirely in both training and inference. Consequently, all fragile preprocessing steps, such as enhancement, binarization, refinement, and minutiae extraction, are removed from the pipeline.
- 2.
- The first systematic adaptation of DINOv2 to a large and heterogeneous fingerprint dataset consisting of multiple sensors: The second major contribution is the successful adaptation of DINOv2, originally trained on 142 million natural images, to a genuinely heterogeneous fingerprint dataset of 64,801 samples, including optical, capacitive, rolled, flat contact, and contactless images. This is the first study to systematically analyze how large-scale self-supervised ViT models behave under differing sensor characteristics and real-world heterogeneity in fingerprint biometrics.
- 3.
- The first detailed analysis demonstrating the impact of ViT capacity: The third contribution is a comprehensive comparative analysis of model capacity. Four DINOv2-ViT variants—small, base, large, and giant—were evaluated under the same protocol, and the results highlight the critical balance between representation capacity and data volume. Notably, the 86 M-parameter base model outperforms both smaller and larger variants, providing the first evidence-based methodological guideline for capacity selection in minutiae-free ViT-based fingerprint recognition.
- 4.
- The first quantitative demonstration of the self-alignment of ViT attention maps with minutiae-rich regions: The final contribution presents the first quantitative analysis of the spatial correspondence between ViT attention maps and minutiae-rich regions. Although the model receives no minutiae supervision, its attention naturally concentrates on forensically meaningful structures such as ridge endings, bifurcations, and high-curvature regions. This demonstrates that self-supervised Transformers can internally learn fingerprint morphology, offering a new perspective on explainability in biometric systems and establishing a meaningful connection between deep learning and forensic expertise.
5.2. Technical Interpretations of Findings and Insights
Experimental results show that the proposed DINOv2-based ViT framework exhibits a performance profile that differs significantly from previous approaches in fingerprint recognition. The key technical insights derived from these results are presented below under thematic headings:
- Performance in a Heterogeneous Test Environment and the Misleading Nature of Single-Sensor Evaluations: The base model achieved an EER of 5.56% and an AUC of 0.9877 on a heterogeneous test set consisting of six different databases. While this performance appears numerically higher than the 1.5–3% EER values typically reported on single-sensor homogeneous datasets, such comparisons are misleading. The lower EER values in the literature are obtained under ideal conditions that eliminate sensor variation, resolution differences, and noise diversity. The real contribution of the proposed model is its clear superiority over traditional minutiae-based systems under the same heterogeneous evaluation protocol: compared to VeriFinger’s 26.90% EER and SourceAFIS’s 41.95% EER, the proposed model provides a 4.8× and 7.5× improvement, respectively. This result empirically demonstrates that self-supervised ViT models can learn highly discriminative, stable, and sensor-agnostic fingerprint features without relying on minutiae or identity-level supervision.
- Cross-Sensor Robustness and Global Representation Learning: The most critical advantage of the proposed model is its robustness to inter-sensor variability. Traditional minutiae-based systems are highly sensitive to resolution changes, ridge sharpness degradation, and contrast variations because they depend on hand-designed preprocessing steps such as enhancement, binarization, and thinning. Since these steps are optimized for specific sensor characteristics, they do not generalize well across different sensor types. In contrast, the proposed DINOv2-based model captures sensor-independent ridge topology, global ridge flow, and mesoscale textural cues through end-to-end representation learning. These representations provide inherent robustness to real-world variations such as contrast changes, partial finger contact, rotation, scale differences, and elastic deformations. As the model preserves global structural consistency even when local ridge sharpness is degraded, it maintains reliable performance on low-quality images.
- The Critical Role of Model Capacity and the Data-to-Parameter Ratio: The capacity ablation study revealed that the relationship between model size and performance in transfer learning is non-linear. Increasing the capacity from 22 M to 86 M parameters yielded a clear performance improvement (EER 6.50% → 5.56%), enabling the model to better represent fingerprint structures. However, increasing the capacity to 1.1 B parameters resulted in a slight performance drop (EER 5.80%), contrary to expectations. This paradox arises from the data-to-parameter ratio: the base model sees approximately 754 images per million parameters, whereas the giant model sees only around 59. This low ratio causes very large models to overfit during domain-specific fine-tuning, despite strong ImageNet-level pretraining. The giant model tends to memorize training-set-specific ridge patterns, noise artifacts, and sensor signatures rather than learning generalizable identity-related structures. The large model showed similar mild overfitting (EER 5.75%). These findings indicate that in biometric applications with limited domain data, medium-capacity Transformer models provide more balanced adaptation and stronger generalization than extremely large models. This result shows that optimal transfer learning performance depends not only on the quality of pretraining, but also critically on the balance between model capacity and available fine-tuning data.
- Minutiae-Independent Structural Discovery: Attention–Minutiae Alignment: Explainability analysis revealed an unexpected but important result: Despite receiving no minutiae information during training, the learned attention maps systematically align with classical minutiae regions. In high-quality images, the IoU metric reached , quantitatively showing that the model focuses on forensically meaningful structures such as ridge endings, bifurcation points, delta regions, and high-curvature transitions. This alignment reflects a key characteristic of the self-supervised learning paradigm: DINOv2’s multi-view consistency loss encourages the model to learn representations that are invariant to local texture variations but sensitive to distinctive structural features. In the context of fingerprints, this leads the model to naturally discover minutiae regions, as they are inherently high-information, geometrically distinct, and cross-view stable. This finding demonstrates that self-supervised ViT models can autonomously discover structures considered “distinctive” in classical fingerprint theory, proving that minutiae-free approaches learn representations that are not only statistically meaningful but also forensically relevant.
- Performance Characterization at Practical Operating Points: The model’s behavior at practical operating points corresponding to different security requirements provides additional insight. At FAR ≈ 10% (consumer-level security), the model achieves a TAR of 98.19%, corresponding to an FRR of only 1.81%, indicating minimal authentication failures for legitimate users. At FAR ≈ 1% (standard security), the TAR is 78.18% (FRR: 21.82%), offering a reasonable compromise between usability and protection. For high-security applications (FAR ≈ 0.1%), the TAR decreases to 36.64%, reflecting the expected performance drop under highly restrictive acceptance thresholds. This characterization shows the adaptability of the system to deployment scenarios with varying security requirements.
5.3. Comparative Discussion with the Existing Literature
This section discusses the performance and methodological features of the proposed model in comparison with the existing literature. The heterogeneity of evaluation protocols, performance comparisons with traditional minutiae-based systems, methodological differences with Transformer-based approaches, reproducibility issues, and the interpretation of performance metrics are systematically addressed:
- Limitations of Homogeneous Evaluation Protocols: Existing Transformer-based fingerprint recognition studies achieve promising results using homogeneous evaluation protocols such as FVC2004, NIST SD4/SD14, and controlled non-contact datasets. However, these datasets consist of samples collected using a single sensor type under controlled laboratory conditions; therefore, they do not fully capture the sensor diversity, quality variability, and differences in acquisition protocols encountered in operational environments. This study extends the evaluation paradigm by assessing performance in a heterogeneous test environment encompassing optical, capacitive, and non-contact sensors, rolled and plain capture methods, and a broad distribution of image qualities.
- Comparison with Traditional Minutiae-Based Systems: Under the same heterogeneous evaluation protocol, the performance of minutiae-based systems degrades as expected. While VeriFinger achieves a 26.90% EER and SourceAFIS a 41.95% EER, the proposed ViT model reaches a substantially lower 5.56% EER under these challenging conditions. This performance gap arises from the reliance of minutiae-based approaches on sequential preprocessing steps such as enhancement, segmentation, and minutiae extraction. In images with low contrast or degraded ridge sharpness, these systems may struggle to extract reliable minutiae, leading to inconsistent performance. In contrast, the proposed ViT framework demonstrates a more stable performance profile because end-to-end representation learning enables the model to process global ridge flow even when local sharpness is degraded.
- Methodological Differences from Minutiae-Free Transformer Frameworks: Compared to existing Transformer-based studies, the proposed model differs in two primary ways. First, it is evaluated on a heterogeneous multi-sensor dataset. Second, the training process does not utilize minutiae guidance, minutiae-driven attention mechanisms, or minutiae-centered auxiliary losses. While some studies in the literature are minutiae-free during inference, they still incorporate minutiae information during training. This study departs from that design choice by offering a completely minutiae-free approach in both training and inference.
- Reproducibility and Comparative Evaluation Challenges: A major factor complicating comparative analyses in the Transformer-based fingerprint recognition literature is the limited availability of implementation details. A significant portion of existing works have not yet released source code or fine-tuned model weights, making independent verification and standardized comparison difficult. Additionally, differing training protocols, hyperparameter settings, and evaluation methodologies further complicate direct comparisons across studies. This study aims to contribute to methodological transparency by planning to publicly release the source code, fine-tuned model weights, and evaluation pipeline. This effort can provide a standardized basis for future comparisons and improve reproducibility in the field.
- Interpreting Performance Metrics in Context: Lower EER values reported in some studies may be tied to differences in evaluation conditions. Some of these studies employ minutiae-guided structural components during training, which can offer advantages in certain controlled scenarios. Moreover, most are evaluated on homogeneous datasets where sensor diversity and quality heterogeneity are limited. Therefore, it is essential to interpret performance metrics within the context of the evaluation protocol used. Homogeneous evaluation settings typically yield lower error rates, whereas heterogeneous environments provide a more realistic perspective on operational performance. In this context, the 5.56% EER achieved by the proposed model under challenging heterogeneous conditions offers a complementary perspective to results obtained in other evaluation scenarios.
This study contributes to the literature in three key respects: (i) a completely minutiae-free architectural design for both training and inference; (ii) systematic evaluation in a test environment with broad sensor diversity and protocol heterogeneity; (iii) the creation of a reproducible research infrastructure through the release of source code, fine-tuned model weights, and the evaluation pipeline. Taken together, these features demonstrate that the proposed framework provides clear superiority and originality over existing literature in terms of methodological integrity and practical applicability. It appears to offer a scalable, robust, and repeatable alternative to traditional minutiae-based systems and current Transformer models.
5.4. Strengths, Innovations, and Practical Implications
The key strength of the proposed approach is its simple and robust architecture, which completely eliminates the complex preprocessing chain that has been standard in fingerprint recognition for many years. In traditional systems, performance largely depends on the accuracy of minutiae extraction, creating error chains, especially in cases of low quality, low contrast, partial contact, sensor variation, or distorted ridge structures. The proposed DINOv2-based ViT model learns an end-to-end representation without requiring optimization, segmentation, binarization, or minutiae extraction, thereby reducing algorithmic fragility and achieving more consistent results in heterogeneous data environments. This architectural choice highlights the system’s strengths in the following respects: (i) stable performance despite variations in image quality, ridge density, and sensor-specific artifacts; (ii) production of fixed-length, directly comparable representation vectors, improving computational simplicity and system integration; and (iii) a training process that does not rely on prior minutiae knowledge, enabling deployment across different protocols or new sensors without reconfiguration. This stability, validated under heterogeneous conditions, positions the model as a strong candidate for operational environments.
For practical deployment, the model’s ability to operate directly on raw images minimizes hardware dependency and facilitates integration into a wide range of biometric infrastructures. Additionally, the inherent focus of Transformer-based attention mechanisms on discriminative regions offers an alternative interpretive layer to classical minutiae-based systems in terms of explainability. In forensic contexts, this can complement minutiae-based matching explanations; observing attention distributions, particularly those overlapping ridge endings and bifurcation regions, not only provides insight into model behavior but also creates a new avenue for expert assessment.
One of the key methodological contributions of this study is its solution to the reproducibility problem. Since many Transformer-based fingerprint models in the literature do not release their source code or pretrained weights, independent verification and fair comparisons remain difficult. By openly sharing the complete experimental protocol, fine-tuned weights, and evaluation pipeline, the proposed system provides a strong reference infrastructure, increasing research transparency and establishing a standardized basis for future comparisons. In this respect, the study not only introduces a new algorithm but also provides a concrete solution to the long-standing reproducibility challenge in the field.
Overall, the strengths of the proposed framework extend beyond technical performance; they also carry practical implications for integrating biometric systems into real-world environments, supporting forensic analysis workflows, ensuring stability under heterogeneous data conditions, and providing a sustainable comparison platform for the research community.
5.5. Limitations and Future Work
Although the proposed approach demonstrates strong verification performance and methodological contributions, several limitations and extension opportunities remain. These are outlined below together with concrete technical directions for future research:
- 1.
- Scaling to Population-Level Datasets: While the 64,801-image dataset represents one of the largest heterogeneous collections currently available for Transformer-based fingerprint recognition, its scale remains modest compared to ImageNet-scale pretraining corpora. Future work will explore expanding the training corpus through the integration of additional large-scale public datasets (e.g., NIST SD300 series, FVC2006, FingerPass) and the adoption of semi-supervised learning strategies. In particular, SwAV-style cluster assignment and multi-crop self-supervised pretraining on unlabeled fingerprint data may be investigated to improve the data-to-parameter alignment and mitigate overfitting tendencies observed in very large models.
- 2.
- Extension to Latent Fingerprint Recognition: The current framework primarily targets rolled and plain fingerprint impressions and does not explicitly address heavily corrupted latent fingerprints characterized by low contrast, background clutter, and partial ridge information. Future research may investigate a two-stage adaptation pipeline consisting of latent-specific preprocessing for ridge enhancement and region-of-interest extraction, followed by domain adaptation techniques aimed at reducing the distribution gap between latent and rolled fingerprints. In addition, progressive curriculum-based training strategies, transitioning from high-quality rolled prints to synthetically degraded and real latent samples, can be explored to improve robustness in forensic application scenarios.
- 3.
- Deployment on Resource-Constrained Platforms: Although the base model achieves practical inference efficiency on modern GPUs, deployment on embedded and low-power biometric platforms remains challenging. Future work may examine model optimization strategies such as structured pruning, post-training quantization, and knowledge distillation into compact student models (e.g., ViT-Tiny variants) to facilitate deployment on resource-constrained platforms, including ARM-based edge devices and Jetson-class accelerators. These directions aim to support real-time fingerprint verification in embedded and battery-powered biometric systems.
6. Conclusions
This study introduces the first fully minutiae-free Vision Transformer framework for fingerprint recognition that operates without any enhancement, binarization, or minutiae extraction stages during both training and inference. By achieving 5.56% EER across 12 heterogeneous datasets spanning optical, capacitive, rolled, plain, and contactless sensors, the proposed DINOv2-based approach demonstrates 4.8× improvement over VeriFinger (26.90% EER) and 7.5× improvement over SourceAFIS (41.95% EER) under identical evaluation conditions. These results fundamentally challenge the long-standing assumption that minutiae extraction is essential for robust fingerprint recognition, particularly in heterogeneous operational environments where traditional systems exhibit severe performance degradation due to sensor variability, resolution differences, and quality heterogeneity.
The capacity ablation study revealed a critical, previously undocumented trade-off in biometric transfer learning: Billion-parameter models degrade rather than improve under limited domain-specific data, contradicting conventional scaling laws observed in natural image domains. The 86 M parameter base model consistently outperformed both the 22 M parameter small variant (6.50% EER) and the 1.1B-parameter giant variant (5.80% EER), achieving optimal generalization at practical operating points, particularly at the critical 1% FAR threshold where the base model reached 78.18% TAR compared to 67.60% for the giant model. This non-monotonic relationship between model capacity and fine-tuning performance demonstrates that optimal minutiae-free recognition depends not on absolute architectural scale but on the alignment between model capacity and available training data, a fundamental constraint that has received limited attention in the biometric literature. Furthermore, explainability analysis quantitatively demonstrated that self-supervised attention mechanisms naturally converge to forensically meaningful structures, achieving IoU of 0.41 ± 0.07 with classical minutiae regions despite receiving no minutiae supervision. This alignment proves that Vision Transformers learn representations that are both statistically discriminative and structurally interpretable, bridging the gap between data-driven deep learning and domain-expert knowledge.
However, three fundamental limitations constrain the generalizability and applicability of the proposed framework. First, the 64,801-image training corpus, while representing the largest heterogeneous collection in ViT-based fingerprint research, remains insufficient to fully leverage billion-parameter architectures. This data-to-parameter imbalance fundamentally shapes the capacity ablation findings: the giant model’s performance degradation reflects data insufficiency rather than architectural weakness, leaving open the question of whether ViT scaling laws observed in computer vision apply to fingerprint biometrics at population scale. Second, the evaluation deliberately excludes heavily corrupted latent fingerprints, the most forensically critical yet technically challenging scenario, limiting the framework’s immediate applicability to law enforcement and criminal investigation contexts where latent print matching remains the dominant operational requirement. The observed 5.56% EER on controlled and semi-controlled acquisitions cannot be extrapolated to latent scenarios, which typically exhibit 3–5× higher error rates even for well-performing systems. Third, although the base model achieves practical GPU inference speeds (∼50 ms per image on RTX A6000), deployment on ARM-based edge devices and battery-powered biometric terminals remains computationally prohibitive, requiring substantial model compression that may compromise the core advantages of the minutiae-free paradigm.
Future research should prioritize three concrete directions to address these constraints. First, expansion to population-scale datasets through integration of additional public collections (NIST SD300 series, FVC2006, FingerPass) targeting 500 K+ training images would enable rigorous validation of ViT capacity scaling in fingerprint domains. Semi-supervised learning techniques, including SwAV-style cluster assignment and multi-crop self-supervised pretraining on unlabeled fingerprint data, could improve data efficiency and reduce dependency on labeled identity information. Second, extension to latent fingerprint recognition requires a two-stage adaptation strategy: (i) integration of latent-specific preprocessing pipelines for ridge enhancement and region-of-interest extraction, followed by (ii) domain adaptation techniques such as gradient reversal to minimize distribution shift between latent and rolled fingerprints. Progressive curriculum-based training strategies, transitioning from high-quality rolled prints through synthetically degraded samples to real latent impressions, represent a promising approach to building incremental robustness for forensic scenarios. Third, deployment on resource-constrained platforms necessitates systematic investigation of model compression strategies, including structured channel pruning, INT8 post-training quantization, and knowledge distillation into compact student architectures. These optimization approaches must be carefully balanced against the risk of degrading the global representation learning capabilities that constitute the core advantage of the Transformer-based minutiae-free paradigm.
By publicly releasing the complete implementation, fine-tuned model weights, and evaluation protocols, this work establishes a reproducible foundation for future minutiae-free biometric research, addressing a critical transparency gap in a field where most Vision Transformer studies remain closed-source and evaluated exclusively on homogeneous single-sensor benchmarks. The demonstrated viability of fully minutiae-free recognition under realistic heterogeneous conditions opens new research directions not only in fingerprint biometrics but also in other pattern recognition domains where traditional systems rely on fragile feature extraction pipelines. As self-supervised vision models continue to advance, the principled adaptation strategies and capacity selection guidelines presented in this work provide a methodological framework for transferring large-scale pretrained representations to specialized biometric applications while maintaining robustness, interpretability, and operational practicality.
Funding
This research received no external funding.
Institutional Review Board Statement
Not applicable.
Informed Consent Statement
Not applicable. This study did not involve the collection of new data from human participants. All fingerprint data used in this work were obtained from publicly available datasets that were previously collected with informed consent by the original data providers.
Data Availability Statement
This study uses multiple publicly accessible fingerprint datasets obtained from their official repositories, including NIST Special Database 302 (https://nigos.nist.gov/datasets/sd302/request, accessed on 1 October 2025), NIST Special Database 301 (https://nigos.nist.gov/datasets/sd301/request, accessed on 1 October 2025), the UareU Sample Fingerprint Database from Neurotechnology (https://www.neurotechnology.com, accessed on 1 October 2025), the CrossMatch Sample Fingerprint Database from Neurotechnology (https://www.neurotechnology.com, accessed on 1 October 2025), the PolyU Contactless Fingerprint Images Database (http://www4.comp.polyu.edu.hk/~csajaykr/myhome/database_request/ContactlessFP/, accessed on 1 October 2025), the FVC2000 (http://bias.csr.unibo.it/fvc2000/download.asp, accessed on 1 October 2025), FVC2002 (http://bias.csr.unibo.it/fvc2002/download.asp, accessed on 1 October 2025), and FVC2004 (http://bias.csr.unibo.it/fvc2004/download.asp, accessed on 1 October 2025) fingerprint verification competition datasets, as well as the CASIA-FingerprintV5 and CASIA Fingerprint Ageing datasets (both available at https://english.ia.cas.cn/db/201611/t20161101_169922.html, accessed on 1 October 2025). No new datasets were generated in this study. Due to licensing restrictions, the fingerprint datasets cannot be redistributed; however, all datasets remain publicly accessible for academic research through their respective official repositories. This study makes use of publicly available implementations of self-supervised Vision Transformers. The DINOv2 models and training framework were obtained from the official Meta AI repository (https://github.com/facebookresearch/dinov2, accessed on 1 October 2025) and the project page (https://ai.meta.com/research/publications/dinov2/, accessed on 1 October 2025). The Vision Transformer (ViT) architecture is based on the original implementation released by Google Research (https://github.com/google-research/vision_transformer, accessed on 1 October 2025). Configuration files corresponding to the DINOv2 giant model were accessed from the HuggingFace model hub (https://huggingface.co/facebook/dinov2-with-registers-giant, accessed on 1 October 2025). No proprietary or custom code was used beyond these publicly available resources. The complete implementation developed for this study will be released publicly on GitHub upon publication.
Acknowledgments
During the preparation of this manuscript, AI-based language models were used solely for English language refinement and manuscript formatting. The author reviewed and edited all outputs and takes full responsibility for the content of this publication. All scientific analyses, experimental design, and interpretations were conducted exclusively by the author.
Conflicts of Interest
The author declares no conflicts of interest.
References
- Engelsma, J.J.; Cao, K.; Jain, A.K. Learning a fixed-length fingerprint representation. IEEE Trans. Pattern Anal. Mach. Intell. 2019, 43, 1981–1997. [Google Scholar] [CrossRef] [PubMed]
- Pan, Z.; Duan, Y.; Guan, X.; Feng, J.; Zhou, J. Latent fingerprint matching via dense minutia descriptor. In Proceedings of the 2024 IEEE International Joint Conference on Biometrics (IJCB), Buffalo, NY, USA, 15–18 September 2024; pp. 1–10. [Google Scholar] [CrossRef]
- Su, Y.; Zhao, T.; Zhang, Z. MRA-GNN: Minutiae relation-aware model over graph neural network for fingerprint embedding. In Proceedings of the 2023 IEEE International Joint Conference on Biometrics (IJCB), Ljubljana, Slovenia, 25–28 September 2023; pp. 1–10. [Google Scholar] [CrossRef]
- Grosz, S.A.; Engelsma, J.J.; Ranjan, R.; Ramakrishnan, N.; Aggarwal, M.; Medioni, G.G.; Jain, A.K. Minutiae-guided fingerprint embeddings via Vision Transformers. arXiv 2022, arXiv:2210.13994. [Google Scholar] [CrossRef]
- Grosz, S.A.; Jain, A.K. AFR-Net: Attention-driven fingerprint recognition network. IEEE Trans. Biom. Behav. Identity Sci. 2023, 6, 30–42. [Google Scholar] [CrossRef]
- Qiu, Y.; Chen, H.; Dong, X.; Lin, Z.; Liao, I.Y.; Tistarelli, M.; Jin, Z. IFViT: Interpretable fixed-length representation for fingerprint matching via Vision Transformer. IEEE Trans. Inf. Forensics Secur. 2024, 20, 559–573. [Google Scholar] [CrossRef]
- Liu, A.; Shi, Y.; Kumar, A.; Chen, X.; Liu, M. A hybrid graph transformer network for fingerprint and palmprint minutiae matching of young children. Neurocomputing 2025, 619, 129180. [Google Scholar] [CrossRef]
- Pandey, S.; Jawade, B.; Setlur, S. Ridgeformer: Multi-stage contrastive training for fine-grained cross-domain fingerprint recognition. arXiv 2025, arXiv:2506.01806. Available online: https://arxiv.org/abs/2506.01806 (accessed on 1 December 2025).
- So, M.; Goldfeder, J.; Lis, M.; Lipson, H. Bi-encoder contrastive learning for fingerprint and iris biometrics. arXiv 2024, arXiv:2401.19519. [Google Scholar]
- Neurotechnology. VeriFinger 12.4 SDK: Fingerprint Identification Technology. 2024. Available online: https://www.neurotechnology.com/verifinger.html (accessed on 1 October 2025).
- Ziga, R. SourceAFIS: Algorithm and Performance Evaluation. 2024. Available online: https://sourceafis.machinezoo.com/ (accessed on 1 December 2025).
- Dosovitskiy, A.; Beyer, L.; Kolesnikov, A.; Weissenborn, D.; Zhai, X.; Unterthiner, T.; Dehghani, M.; Minderer, M.; Heigold, G.; Gelly, S.; et al. An image is worth 16x16 words: Transformers for image recognition at scale. In Proceedings of the International Conference on Learning Representations (ICLR), Addis Ababa, Ethiopia, 26–30 April 2020. [Google Scholar]
- Vaswani, A.; Shazeer, N.; Parmar, N.; Uszkoreit, J.; Jones, L.; Gomez, A.N.; Kaiser, Ł.; Polosukhin, I. Attention is all you need. In Advances in Neural Information Processing Systems; Guyon, I., Von Luxburg, U., Bengio, S., Wallach, H., Fergus, R., Vishwanathan, S., Garnett, R., Eds.; Curran Associates, Inc.: Red Hook, NY, USA, 2017; Volume 30, pp. 5998–6008. Available online: https://proceedings.neurips.cc/paper_files/paper/2017/file/3f5ee243547dee91fbd053c1c4a845aa-Paper.pdf (accessed on 1 December 2025).
- Oquab, M.; Darcet, T.; Moutakanni, T.; Vo, H.; Szafraniec, M.; Khalidov, V.; Fernandez, P.; Haziza, D.; Massa, F.; El-Nouby, A.; et al. DINOv2: Learning robust visual features without supervision. arXiv 2023, arXiv:2304.07193. [Google Scholar]
- Caron, M.; Touvron, H.; Misra, I.; Jégou, H.; Mairal, J.; Bojanowski, P.; Joulin, A. Emerging properties in self-supervised vision transformers. In Proceedings of the IEEE/CVF International Conference on Computer Vision (ICCV), Montreal, QC, Canada, 11–17 October 2021; pp. 9650–9660. [Google Scholar]
- Loshchilov, I.; Hutter, F. Decoupled weight decay regularization. In Proceedings of the International Conference on Learning Representations (ICLR), New Orleans, LA, USA, 6–9 May 2019; Available online: https://arxiv.org/abs/1711.05101 (accessed on 1 December 2025).
- CASIA. CASIA Fingerprint Image Database Version 5.0; CASIA: Beijing, China, 2010. [Google Scholar]
- NIST302a. NIST Special Database 302: Supplemental Fingerprint Card Data—Subset 302a; NIST: Gaithersburg, MD, USA, 2020. [Google Scholar]
- NIST302b. NIST Special Database 302: Supplemental Fingerprint Card Data—Subset 302b; NIST: Gaithersburg, MD, USA, 2020. [Google Scholar]
- CASIAsa. CASIA Fingerprint Image Database Version 5.0—Subject Ageing; CASIA: Beijing, China, 2011. [Google Scholar]
- NIST302d. NIST Special Database 302: Supplemental Fingerprint Card Data—Subset 302d; NIST: Gaithersburg, MD, USA, 2020. [Google Scholar]
- NIST301a. NIST Special Database 301: Nail to Nail Fingerprint Challenge—Subset 301a; NIST: Gaithersburg, MD, USA, 2019. [Google Scholar]
- Kumar, A.; Zhou, Y. Human identification using finger images. IEEE Trans. Image Process. 2011, 21, 2228–2244. [Google Scholar] [CrossRef] [PubMed]
- Neurotechnology. VeriFinger SDK Sample Database D2. 2019. Available online: https://www.neurotechnology.com/verifinger.html (accessed on 1 October 2025).
- Neurotechnology. VeriFinger SDK Sample Database D1. 2019. Available online: https://www.neurotechnology.com/verifinger.html (accessed on 1 October 2025).
- Maio, D.; Maltoni, D.; Cappelli, R.; Wayman, J.L.; Jain, A.K. FVC2000: Fingerprint verification competition. IEEE Trans. Pattern Anal. Mach. Intell. 2002, 24, 402–412. [Google Scholar] [CrossRef]
- Maio, D.; Maltoni, D.; Cappelli, R.; Wayman, J.L.; Jain, A.K. FVC2002: Second fingerprint verification competition. In Proceedings of the 16th International Conference on Pattern Recognition, Montreal, QC, Canada, 21–25 August 2002; Volume 3, pp. 811–814. [Google Scholar] [CrossRef]
- Maio, D.; Maltoni, D.; Cappelli, R.; Wayman, J.L.; Jain, A.K. FVC2004: Third fingerprint verification competition. In Proceedings of the International Conference on Biometric Authentication, Hong Kong, China, 15–17 July 2004; pp. 1–7. [Google Scholar] [CrossRef]


Disclaimer/Publisher’s Note: The statements, opinions and data contained in all publications are solely those of the individual author(s) and contributor(s) and not of MDPI and/or the editor(s). MDPI and/or the editor(s) disclaim responsibility for any injury to people or property resulting from any ideas, methods, instructions or products referred to in the content. |
© 2026 by the author. Licensee MDPI, Basel, Switzerland. This article is an open access article distributed under the terms and conditions of the Creative Commons Attribution (CC BY) license.