Abstract
Precision agriculture will continue to heavily rely on data-driven models to enable more intensive crop monitoring and data-driven decisions. The available remote sensing techniques, particularly those based on multispectral Sentinel-2 data, still have major shortcomings due to cloud cover, low temporal resolution, and time lags in data availability. To address these shortcomings, this paper proposes a hybrid approach that combines Sentinel-2 satellite data with real-time data generated by low-cost ground-based single-pixel detectors (SPDs), such as the AS7263. This hybrid approach addresses key shortcomings in existing agricultural monitoring systems and offers a cost-effective, scalable solution for real-time monitoring and prediction of end-of-season yield, moisture, and plant height using simple PLRS models implemented directly in SPDs with an energy-efficient algorithm for deployment on the STM32G030 microcontroller.
1. Introduction
The amount of information in farming is not enough to help make decisions based on data [1]. Multispectral data from Copernicus services, as Sentinel-2A (https://www.spiedigitallibrary.org/conference-proceedings-of-spie/9218/92181E/Copernicus-Sentinel-2-mission-products-algorithms-and-CalVal/10.1117/12.2062260 (accessed on 15 March 2025); https://www.mdpi.com/2072-4292/9/6/584 (accessed on 15 March 2025)), is easy for the public to access. However, there are a few services that use this data, and they often do not collect data frequently enough; data is collected every three to five days or even longer, depending on the weather and clouds. A possible way to improve information in agriculture is to adopt the Agriculture 4.0 model by using more Internet of Things (IoT) devices [2,3,4].
In agricultural optical remote sensing, vegetation indices (VIs) have also been proposed to align the data with the target property better. This is mainly because the VIs can provide an apparent measure of the vegetation cover and can be correlated with critical physical measurements [5]. Other data acquired within the other parts of the optical band can be merged to get different VIs. One of the most used and the oldest indices is the Normalised Difference Vegetation Index (NDVI) [6].
Sentinel-2 for precision agriculture has various roles, including monitoring plant health, soil moisture, and nutrient levels. Sentinel-2 also assists with crop rotation and pest control. All these help to monitor various growth phases of plants carefully and make informed interventions to maintain healthy plants and boost agricultural production [7]. Sentinel-2 has the ability to take imagery in 13 various spectral bands (Table 1), which are used to calculate various vegetation indices (VIs) [8].

Table 1.
Spectral bands of Sentinel-2.
Given the large number of papers mentioning Sentinel-2, only a small and limited number of studies use the AS7263 sensor. In these studies, authors employ this sensor for non-destructive quality assessment of Siamese oranges by measuring acidity, total soluble solids, and vitamin C [9] for measuring spectral reflectance of plant leaves and soilless substrates under greenhouse conditions [10], for developing a low-cost ground-based NDVI sensor for manual and automated monitoring of crop conditions [11] and for estimating chlorophyll levels in different types of leaves, such as banana, jasmine, mango, rice, and sugarcane [12]. Unlike other works, which typically use only one sensor node, often with several integrated sensors of the same or different types (such as a combination of AS7262, AS7263, and AS7265x) to optimize measurements at a single point, we advanced by using five, or effectively four, separate sensor SPD nodes as shown in Figure 1a deployed at different locations as shown in Figure 1b,c. Despite the limited data set size (), this approach provided an important spatial distribution of samples for the development and validation of the PLSR model.
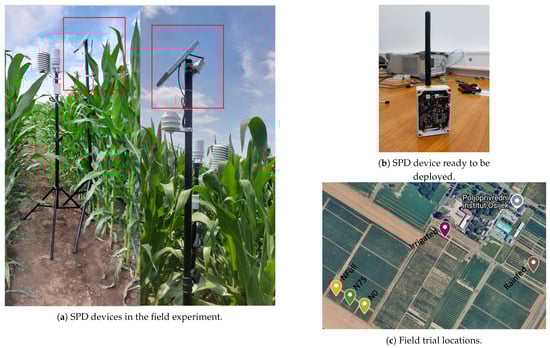
Figure 1.
The figure shows the following: (a) SPD devices in the field experiment, highlighted in red boxes, (b) a fully assembled SPD unit ready for field implementation, (c) the geographical layout of the field-trial sites.
Sentinel-2 is successful in a wide range of precision agriculture applications. Studies have shown that Sentinel-2 data can be integrated with multispectral imagery from unmanned aerial vehicles (UAVs) to accurately predict the Green Area Index (GAI) in winter wheat. GAI predictability is highly useful for crop condition monitoring and yield estimation. Despite the potential of Sentinel-2 data for describing average GAI trends, limitations due to the low red-edge band and temporal resolution lag caused by cloud cover hinder the correlation of site-specific variability with single-image datasets [13].
The development of applications such as AgroShadow [14], improves the quality of Sentinel-2 data through enhanced shadow detection.
Although Sentinel-2 plays an important role in precision agriculture, its effectiveness is limited by critical constraints, primarily cloud cover and data acquisition delays. Cloud cover significantly reduces the satellite’s ability to collect timely and accurate data on crop conditions [15], resulting in information gaps needed for agricultural decision-making. Given these challenges, research into alternative technologies that enable faster data acquisition and are less susceptible to environmental influences, such as cloud cover, is underway. One such tool is the use of SPDs, which are cost-effective and offer faster response times than traditional satellite imagery [16]. SPDs are small spectral sensors that can be mounted directly in fields to detect specific wavelengths of light reflected by vegetation. This approach enables real-time ground monitoring that is not interrupted by clouds. Because they are small and affordable, they can be deployed in large numbers, providing precise and continuous monitoring at the field level.
The introduction of Sentinel-2 imagery has significantly advanced precision agriculture through its multispectral, high-spatial-resolution data. However, the application of Sentinel-2 remains limited due to unpredictable cloud cover and data latency [7]. Research on new detectors, such as the AMS AS7263 (https://cdn.sparkfun.com/assets/1/b/7/3/b/AS7263.pdf (accessed on 24 March 2025)), provides an alternative method for extending real-time sensing capabilities in agriculture.
SPDs offer low cost and fast response capability. Limited spatial coverage of SPDs means they can’t provide the full view of big agricultural fields that satellites can. Effective utilization may require a hybrid approach that combines the broad coverage of Sentinel-2 with the cloud coverage, independent real-time data of SPDs. This hybrid technology can enhance the performance of both individual systems, delivering broad-area coverage and high-resolution detail while minimizing the effects of cloud cover and data latency. Our work demonstrates the value of incorporating SPDs into precision agriculture systems to complement Sentinel-2 satellite data. While SPDs lack broad spatial coverage, they offer high temporal resolution and real-time detection independent of environmental conditions. SPDs are useful for the immediate detection of plant spectral responses and for providing instantaneous feedback that satellites can’t offer due to data delays and atmospheric limitations. With a network of such SPDs, we can gather accurate, continuous data that achieves similar spatial coverage as satellites while supplementing their limitations in temporal and environmental fields. In this paper, we are proposing and developing such a network of SPDs that complements satellite data using a hybrid system, where the strengths of both technologies are combined. The integration of these technologies enables an active and better understanding of plant health and environmental conditions, leading to timely and efficient decision-making in agriculture.
Related Work
In the era of remote sensing using satellite data, challenges remain, such as timely data acquisition and cloud cover interference during satellite overpasses. Although previous studies have significantly advanced precision agriculture and vegetation monitoring, limitations connected to temporal resolution and environmental conditions remain. Our research addresses these gaps by proposing a hybrid approach that combines satellite imagery with a low-cost, high-quality SPD featuring six spectral channels. This method enables faster and more reliable data collection, even under bad weather conditions, and is expected to have results comparable to those from satellite-based observations alone. In the following section, we will provide an overview of related research that is similar to ours.
In [17] different chlorophyll-related VIs from simulated Sentinel-2 images are presented to estimate the fraction of absorbed photosynthetically active radiation (FPAR) of wheat and maize. The study identifies the modified Simple Ratio-2 (mSR2) and the Red-Edge Normalised Difference Vegetation Index (ND705) as the most effective VIs, as they exhibit strong linear correlations with FPAR. Results suggest that high-resolution FPAR mapping can be improved in agriculture, highlighting the advantage of VI that utilise near-infrared and red-edge reflectance. The study contributes to the development of crop-independent FPAR estimation methods, but is limited by not accounting for atmospheric effects in the simulations.
The model proposed in [18] uses Sentinel-2 VIs in combination with apparent electrical conductivity (ECa) to predict barley yields in spring 2017 in north-east Spain. The results show that the Sentinel-2 and ECa data much improve yield estimates, with the imagery taken in early April showing maximum predictive power with an of 0.75. The results suggest that such techniques could be applied in agriculture to improve yield estimates and enable more targeted nutrient application.
The paper [19], proposes a hybrid learning model that uses Random Forests (RF) and Support Vector Machines (SVM) to classify plants from Sentinel-2 imagery. After evaluating 82 VIs, this model outperforms individual RF and SVM models in identifying six distinct plants.
The paper [20] introduces NDVIRE, a new vegetation index constructed from Sentinel-2 bands. The random forest model is used to develop NDVIRE for predicting forest stand volume (FSV) in the Helan Mountains region of China. NDVIRE is positively correlated with FSV and outperforms traditional vegetation indices.
The authors in [21] compare the correlations between NDVI and the Soil Adjusted Vegetation Index (SAVI) from Sentinel-2 for vegetation monitoring in Shrirampur, classifying vegetation as dead, stressed, or healthy based on data from November and December 2019.
The study [22] demonstrates how NDVI relates to nine SAR characteristics, including backscatter coefficients and VI. The results indicate that the strongest association with NDVI is found in VH backscatter, suggesting that SAR data can complement conventional multispectral techniques for crop monitoring.
Monitoring crop growth using NDVI time series from Sentinel-2 and Landsat Operational Land Imager (OLI) [23] demonstrates how satellite remote sensing techniques, combined with ground data verification, can produce accurate data on plant life phases. Applying NDVI helps determine plant growth and its relationship to climatic factors.
A Deep Neural Network (DNN) is used to predict maize biomass using Sentinel-2 vegetation indices (VIs) and Leaf Area Index (LAI) data [24]. This study aims to identify the optimal VIs for biomass prediction, clarify the relationship between biomass and LAI, and validate the biomass model using these techniques.
The authors in [25] examined the land cover patterns of Vellore district using NDVI, multispectral remote sensing, and digital elevation models (DEMs) derived from Landsat TM images. NDVI was used to identify changes in land-cover characteristics over five years, showing significant shifts in land cover, including the conversion of forest and uncultivated areas to other uses.
In this paper [26] describe how satellite-based vegetation indices (VIs) are implemented in the Agricolus platform to support agriculture. They highlight the use of VIs, such as NDVI, G-NDVI, and SAVI, to monitor crops, mitigate pollution, and optimize crop management.
NDVI and NDMI data analysis in Kyiv, 2017–2021 [27] examines the relationship between plant health and moisture levels using NDVI and NDMI vegetation indices from Sentinel-2 images. Over five years, the study finds a strong correlation (r = 0.73, r2 = 0.55) between these indices in urban areas.
The research [28] introduces two new measures: the cotton Boll Area Ratio Index (BARI) and the cotton Boll Opening Rate Index (BORI). These indices were developed using Sentinel-2 data to improve the estimation of cotton boll opening. The BARI index, in particular, is more accurate than previous methods, enabling more effective and timely resource allocation.
As proposed by [29], vegetation indices from Sentinel-2 and GPS data on sheep movements can be used to control overgrazing. The study demonstrates how vegetation condition is linked to sheep grazing behavior at different stocking densities and explains how selective grazing leads to increased overgrazing.
The work in [30] uses vegetation index-derived texture features from Sentinel-2 satellite images to map and estimate growing stock volume (GSV).
The authors work in [31] suggests an assimilation system validating the decision by using biophysical parameters from Sentinel-2, fAPAR, to irrigate vineyards automatically. Such an assimilation system uses the regulated deficit irrigation (RDI) technique to irrigate efficiently.
As shown in the previous section, and summarized in Table 2, the use of Sentinel-2 and vegetation indices is a widely researched topic, but none of the existing works address a low-temporal and energy-efficient method for predicting end-of-season crop state.
Table 2.
Summary of reviewed studies.
2. Materials and Methods
The field trials were conducted in 2023 using the same hybrid maize variety, OS Semper, from the FAO maturity group 400 (PIO, Osijek, Croatia). In the trial fields around the Agricultural Institute in Osijek, Croatia, five different maize cultivation scenarios were tested. Each scenario represents growing conditions commonly encountered in agricultural production systems. During the vegetation period, maize in the irrigation trials was irrigated five times using a pivot system, while no irrigation was applied in the Rainfed and NFull trials. The application of 136 kg of nitrogen was identical in the NFull, Watered, and Rainfed treatments. In the N0 and N75 trials, no nitrogen fertilization or only 75 kg of nitrogen in N75 was applied, as visible in Table 3. In all trials, maize was cultivated using high-yielding agronomic technology based on relevant guidelines. A single SPD node was assigned to each trial, facing north. All trial plots were sown from east to south. The locations of the sensors were chosen so that they extended at least one meter into the crop, as described in Table 3.
Table 3.
Environmental data and coordinates.
2.1. Single Pixel Detector
The next section provides an overview of the system components and the sensor node configuration. The overall node system architecture is shown in Figure 2a, which illustrates the connections among the power supply, microcontroller unit (MCU), AS7263 multispectral sensor, and LoRa transceiver module. The system was powered by a 3 V DC source, and the STM32G030 MCU controlled the AS7263 sensor via an I2C communication interface.
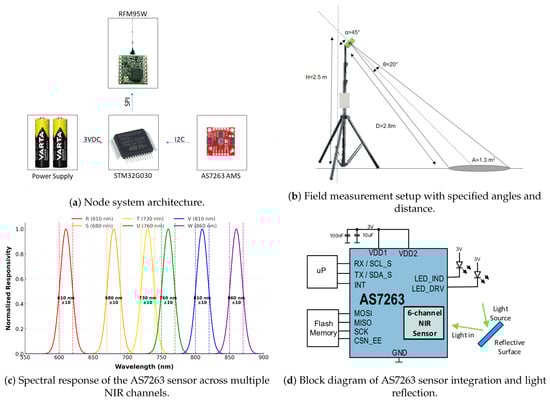
Figure 2.
Overview of the system components and the sensor configuration: (a) The architecture of the SPD shows the connections between power supply, MCU, sensor, and transceiver. (b) Structure of the field insert with indication of height, angles and measuring range. (c) Normalised sensitivity curves for each NIR channel of the AS7263. (d) The block diagram of the sensor shows the internal modules and the light path from the source to the reflecting surface.
The sensor was mounted on a 3D-printed bracket and placed on a tripod at a height of 2.5 m, as shown in Figure 2b. The measurement setup was defined by a sensor angle of incidence of 20° and a mounting height of 2.5 m from the ground. The sensor lens opening was 1 mm, as specified in the AS7263 product datasheet. To estimate the area covered by the sensor on the ground, the circular area was calculated using the formula in Equation (1):
Based on these parameters, the ground area covered was approximately 1.30 m2. The orientation and position of the sensor were setup to capture as much as possible portion of maize leaves compared to the configuration in the previous study [32], where the sensor was mounted perpendicular to the ground.
The spectral response of the AS7263 sensor is visible in Figure 2c. The SPD was designed around the AMS AS7263 red/near-infrared multispectral sensor (6 channels, ams-OSRAM AG, Premstätten, Austria). The six channels had central wavelengths of 610 nm, 680 nm, 730 nm, 760 nm, 810 nm, and 860 nm, each with a full width at half maximum (FWHM) of 20 nm, as shown in Table 4. The CMOS sensor operated without additional optical components, ensuring direct exposure to incident light.
Table 4.
Overview of the wavelengths of the channels used, marked with the letters R–W, with the corresponding bandwidths (FWHM).
Figure 2d presents the block diagram of the AS7263 sensor integration and light reflection path. The diagram illustrates the internal structure of the six-channel NIR sensor, its interface with the microcontroller, and the interaction of incident light with the reflective surface.
2.2. Data Analysis
In this study, five SPD devices were deployed to monitor five different scenarios. Each device continuously collected data from 8 July to 11 September 2023, with measurements taken at one-hour intervals from dawn to dusk. refers to the vegetation index values obtained by the SPD system developed in this research, while denotes values obtained from Sentinel-2 satellite observations. These names are used to distinguish between satellite and field measurements of the vegetation index. This sampling schedule yielded a total of 2781 vegetation index data points.
For Sentinel-2, NDVI is calculated using the near-infrared (NIR) and red spectral bands: Band 8 (B8, 842 nm) for the NIR region and Band 4 (B4, 665 nm) for the red region Equation (2):
The SPD system based on the AS7263 sensor uses the closest available spectral channels: 680 nm as the red band and 810 nm as the near-infrared band Equation (3):
This establishes a direct functional relationship between Sentinel-2 NDVI and SPD NDVI, as both indices are computed as the ratio of the difference to the sum of reflectances in the red and NIR regions. Differences in central wavelengths and spectral bandwidths partly explain the discrepancy between the two datasets, while the spectral proximity of the channels enables meaningful comparison and correlation analyses.
The number of samples per device shown in Table 5 varies slightly because some data were excluded due to invalid readings caused by weather conditions or errors in the communication channel. This approach ensured high data quality and representativeness of the measurements for each observed scenario.
Table 5.
Statistics data for the NDVI_SPD values recorded by SPD.
Similarly, the different number of data points shown in Table 6, which refers to values obtained from Sentinel-2 satellite observations, is due to changing atmospheric conditions and cloud cover during the data collection period. In such cases, some satellite imagery was excluded because it did not allow for reliable VI readings.
Table 6.
Summary statistics of measurements.
We also paired the SPD data with 82 samples collected using the Sentinel-2 sensor. Measurements were paired by matching each available Sentinel-2 observation with the temporally closest SPD record obtained within the same observation period. This approach linked ground-based and satellite-based NDVI values to create a coherent dataset for comparative analysis.
In the following section, we discuss the data collected and the specific characteristics of the data selected for creating our models. Figure 3 shows the complete raw dataset collected with five different SPD sensors. The plots show temporal variations in reflectance measurements for six bands (R, S, T, U, V, W) and the corresponding NDVI for each SPD during the field trial. These plots illustrate the behavior of vegetation and surface reflectance. The 15 normalized VIs were derived from all possible unordered pairs of the six spectral bands, resulting in exactly fifteen combinations. These indices were then analyzed to create PLRS models for predicting yield, kernel moisture, and plant height.
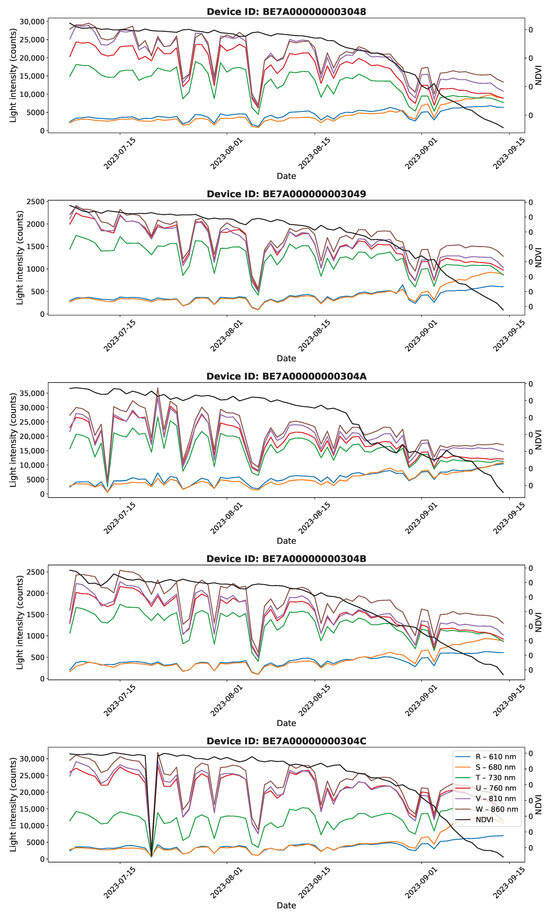
Figure 3.
Collected data set from five SPD sensors, and multispectral response (R, S, T, U, V, W) with calculated (black line) value during field trials.
Equation (4) defines a mathematical relationship used to quantify the variation in reflectance between two spectral bands. The variables in Equation (4) are collected directly from SPD measurements, where and represent reflectance measurements in two user-selected spectral bands. The available channels were combined to create a set of VIs to observe different aspects of vegetation’s spectral response. This approach was used to determine whether any additional unordered pair of measured reflectance values shows a strong correlation with the NDVI, enabling the development of new indices that effectively capture vegetation characteristics.
Figure 4 shows scatter plots comparing the values obtained with SPD with the corresponding values obtained from Sentinel-2 observations. Each individual sub-image corresponds to a different sensor system, and the corresponding correlation coefficient is indicated in the caption. The blue regression lines show the best linear fit and confirm a strong linear relationship between ground-based and satellite-based indices, which has implications for verifying the reliability of SPD sensors for vegetation monitoring. The equation y = ax + b shows how well the SPD match the satellite indices , thus allowing a quantitative assessment of the agreement between measurements obtained by the SPD method.
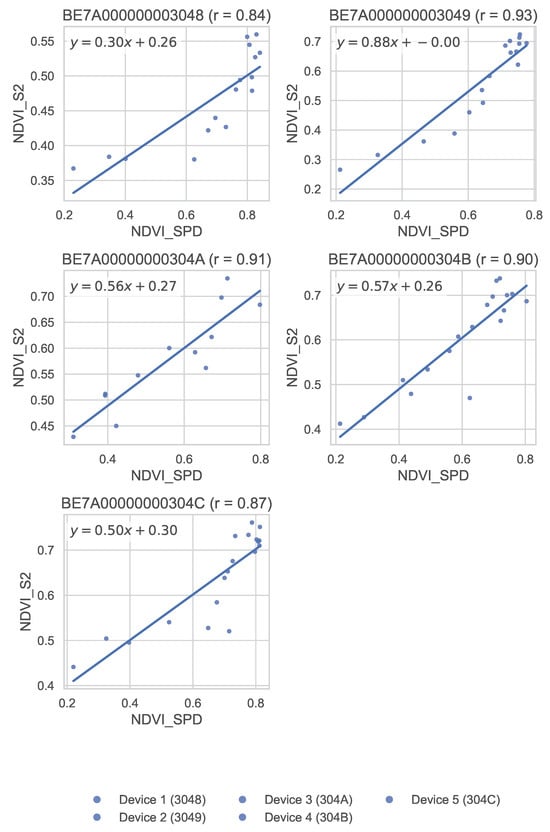
Figure 4.
Scatter plots of and .
3. Results
The research integrates remote sensing and IoT-based multispectral SPDs to enhance agricultural monitoring using Sentinel-2 data to derive vegetation indices, particularly NDVI. Field data were collected using customized, low-cost SPDs deployed at multiple locations, as shown in Table 3, to capture site-specific changes in real time, while Sentinel-2 data were used to validate the field data. Sentinel-2 MSI data are delivered as atmospherically corrected surface reflectance bottom-of-atmosphere products [33,34]. This ensures that Sentinel-2 MSI data are not affected by atmospheric conditions and can be directly compared with ground values. SPD measurements were performed directly above crop canopies, without the influence of atmospheric absorption or scattering. Non-additional atmospheric or BRDF correction was necessary for SPD data. Absolute consistency between Sentinel-2 NDVI data and SPD measurements was achieved for comparison purposes by using standard reference targets during SPD data acquisition, following methods described in the literature [33,34,35].
The research examined the correlation between Sentinel-2 vegetation indices and multispectral sensor measurements to assess the effectiveness of these indices in assessing plant health across diverse environmental conditions. The results showed a high correlation (r > 0.85) between the NDVI values from the AS7263 sensor and those from Sentinel-2 imagery, demonstrating the effectiveness of the sensor in closing temporal gaps in the satellite imagery caused by cloud cover, as shown in Figure 5.
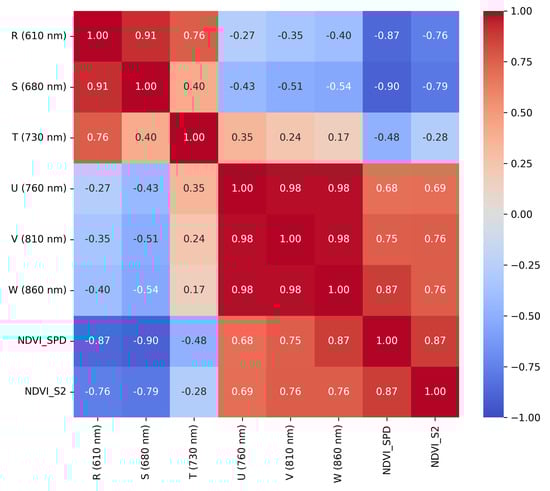
Figure 5.
Correlation heatmap of AS7263 spectral channels and NDVI values.
After the field trial concluded, harvesting was completed, and actual agronomic attributes such as yield, grain moisture, and plant height were measured Table 7. Using these records, along with reflectance attributes and VI extracted by the SPD sensors during the field trial, predictive relationships were established to assess the potential of using ground-based spectral data for non-destructive estimation of major crop attributes. The initiative aimed to assess the potential of SPD-extracted information for accurate forecasting of yield and plant attributes under various growth conditions. The method significantly reduced monitoring latency and provided better spatial and temporal resolution, emphasising the benefits of the hybrid system for precision agriculture. The SPD BE7A00000000304A has been excluded from model training and testing because the data were found to be unreliable during the satellite overpass instances.
Table 7.
Field metadata.
Prediction models were developed using partial least squares regression (PLSR) [36] and validated by five-fold cross-validation, selecting the model with the lowest root mean square error of prediction (RMSEP) [37]. Predictions were computed as the dot product of the measurement indices and the model coefficients, including an intercept [38], as shown in Equation (5). In this equation, is the intercept term, and are the regression coefficients from the PLSR model for each predictor variable. The values are the input variables measured on the SPDs. Six variables are the directly measured spectral bands from AS7263, and the remaining fifteen are normalized vegetation indices calculated according to Equation (4). The summation thus extends to twenty-one, creating predictions for yield, kernel moisture, and plant height.
Due to the dynamic nature of moisture content in corn kernels, predictions are most useful as relative deviations rather than absolute values, especially during the harvest period when kernel moisture content is below 20%. Predictions outside the realistic moisture content range of 5% to 15% were adjusted by limiting them to these values. The measurements used for model calibration were limited to data collected between 10 a.m. and 12 a.m. to enhance the quality of the predictions.
The data set, consisting of six directly measured spectral variables and fifteen sensor-based predictor variables, was first preprocessed for modeling using linear methods. Each predictor was normalized and filtered to remove outliers caused by false readings or uneven lighting. The analysis focused on three target variables as follows: yield, kernel moisture, and plant height, which were evaluated separately using partial least squares regression (PLSR).
The top four vegetation index coefficients derived from visible and near-infrared wavelengths are shown in Figure 6. These represent the four new VI-based vegetation indices with the strongest correlation to NDVI_S2. The newly proposed VIs, T (730 nm)/R (610 nm), V (810 nm)/R (610 nm), U (760 nm)/R (610 nm), and W (860 nm)/R (610 nm) can be directly computed from the SPD sensor node data.
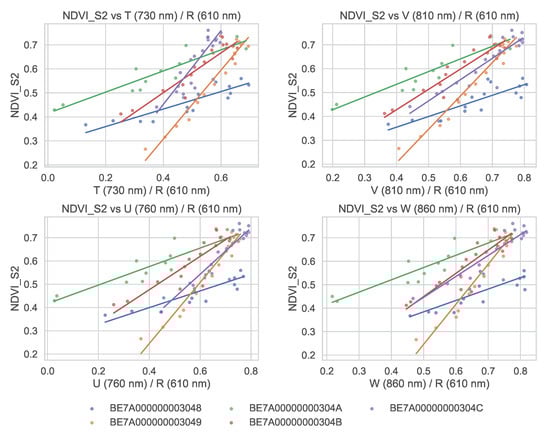
Figure 6.
Top 4 VIS-based indices correlated with .
The optimal number of components for each target variable was determined using cross-validation (CV), using the six wavelengths measured by the SPD sensor node and the fifteen calculated VIs mentioned in Equation (4). Model performance was assessed by comparing the true and estimated values of yield, moisture, and height, along with the calculation of Pearson’s correlation coefficient (Figure 5).
The correlation analysis between and across the individual measurement devices showed strong positive relationships with Pearson correlation coefficients, indicating consistent and reliable agreement of NDVI measurements across the sensor network. The resulting regression coefficients for each optimal model were exported for further analysis.
This difference in the number of data points occurred because satellite overpasses are rare and highly dependent on weather conditions, as mentioned earlier. Regression models were trained on the full dataset of 2781 NDVI-SPD measurements collected using four SPD devices. However, the number of days when Sentinel-2 overpasses coincided with field measurements was very limited, resulting in a low ratio of valid NDVI-SPD to NDVI-S2 pairs. Only measurements that were fully spatially and temporally aligned and passed all quality-control filters were used for independent validation. Despite the limited number of valid, the correlation analysis showed that the aligned data yielded promising relationships. Algorithm 1 presents the implementation of the 5k-fold cross-validation procedure applied to the training dataset, ensuring transparent documentation of the internal validation process for the PLSR models.
| Algorithm 1 PLSR Model Training and Cross-Validation |
|
Table 8 presents the intercepts and regression coefficients of the developed PLSR models for plant height, moisture, and yield. These are the final predictive equations used to estimate each trait from the spectral input data. Each model in Table 8 was individually optimized for a specific plant attribute height, moisture content, and yield before being implemented in the SPD devices.
Table 8.
Intercepts and regression coefficients of the three PLSR models for plant height, moisture, and the yield modeled trait.
The analysis shows that the predictions for the yield and kernel moisture closely matched the measured data, as indicated by the relatively low MAE and RMSE values in Table 9. Predictions for the final plant height were less accurate, with higher error values and lower model accuracy than for the other traits. This is likely due to the small sample size and the limited spectral response to end-of-season variations in canopy height.
Table 9.
Comparison of predicted and measured values at harvest (Empirical results, 7–20 July 2023).
MAE and RMSE in Table 10 describe the average magnitude of deviation between the model predictions and the measured values, with RMSE placing greater weight on larger errors and therefore being more sensitive to extreme deviations. R2 was not calculated because individual treatments and populations contain only a single observation, which prevents a statistically valid assessment of the variance required for determining the coefficient of determination.
Table 10.
PLSR performance indicators (MAE, RMSE) per treatment and population for yield, moisture, and plant height.
Figure 7, Figure 8 and Figure 9, and Table 7 present an application of PLSR to predict yield, moisture content, and canopy height using spectral and sensor data.
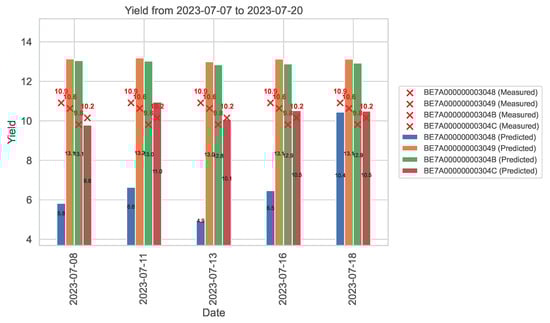
Figure 7.
Predicted yield (t/ha) between 7 July and 20 July 2023.
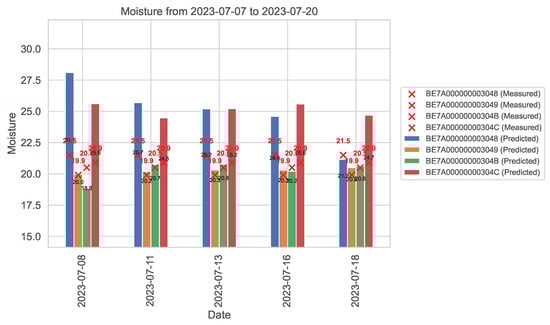
Figure 8.
Predicted moisture content (percent) for the period from 7 July to 20 July 2023.
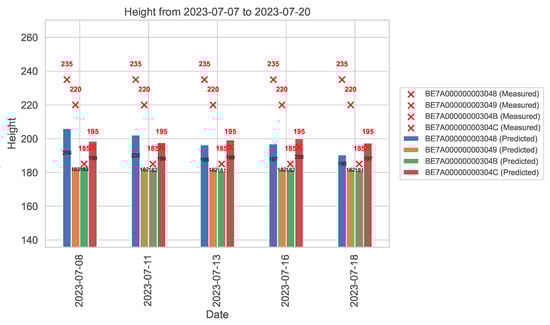
Figure 9.
Predicted plant height (cm) from 7 July to 20 July 2023.
Comparative analysis between the anticipated values and actual measurements in Table 9 indicates that the PLSR models effectively identified the primary patterns in yield, kernel moisture, and plant height across various treatments. Although there were slight variations, more pronounced when plant heights from irrigated and rainfed trials were considered, the individual models performed well in generating predictions within the constraints of time and sample size. Such outcomes indicate that the modeling technique is viable for monitoring crops during the vegetative season and predicting yields.
For the yield shown in Figure 7, overall model performance was good MAE = 2.52 t ha; RMSE = 2.64 t ha. The worst performance occurred in the Irrigated trial, where the model underestimated the final yield, but estimates under Rainfed conditions and for the nitrogen treatments N75 and NFull closely matched the measured end-of-season values. This indicates that the model accurately captured management-induced variations in yield but may require further calibration under high water availability.
Model predictions for moisture (Figure 8) generally agreed well with measurements showing MAE = 2.17% and RMSE = 2.39% under rainfed and moderate nitrogen conditions. Overpredictions for the irrigation and NFull treatments showed that the model slightly overresponded to the effects of water and nitrogen input, likely due to the relatively small training sample size used for model calibration.
For plant height (Figure 9), the model consistently underestimated measurements in both irrigated and rainfed plots; however, predictions for nitrogen treatments (N75 and NFull) closely matched observed values. The relatively high overall error (MAE = 20.35 cm; RMSE = 20.51 cm) may be due to the limited number of calibration samples and the spectral insensitivity observed during late-season canopy development in response to further vegetative growth.
The results of this study show that individual PLSR models were very effective at distinguishing treatment-specific patterns as described in Table 7. However, the findings also suggest that future studies could benefit from incorporating conservative or regularized models to reduce the risk of overfitting and improve robustness under changing environmental conditions. The PLSR was successful in making reliable end-of-season predictions with high consistency for yield and moisture and moderate precision for plant height. These outcomes validate the model’s ability to track maize growth and to predict key agronomic characteristics across diverse environmental settings.
These field devices are responsible for real-time pre-processing of the raw spectrometric data received via the SPD and apply the preset coefficients to provide real-time predictions. The implementation protocol for these models and the computational tasks performed through the devices are captured in Algorithm 2.
| Algorithm 2 Processing of the SPD data in the field |
|
The energy analysis in Table 11 provides a detailed assessment of current consumption, power, and energy in each phase of system operation, shown in Figure 10. Measurements were taken at a nominal voltage of 3 V, with each phase defined by its duration and current consumption. Based on these data, power values (P = I × U) and energy values (E = P × t) were calculated. During the total active time of 10.141 s, the system consumed approximately 0.8208 W/s of energy, while in the idle state of 600 s, only 0.0046 W/s was consumed, which is less than 0.6% of the total consumption. The average power during the entire period is 0.00023 W, and the average current, calculated from the active phase, is 69.6 µA.
Table 11.
Analysis of power consumption during the SPD operating cycle.
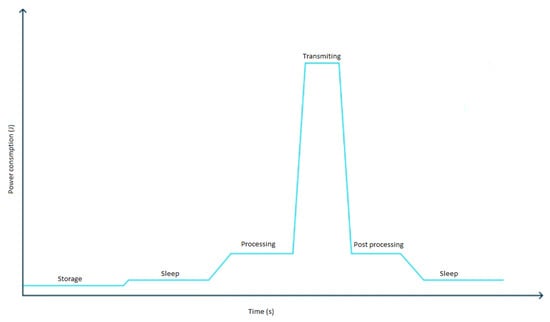
Figure 10.
Device energy profile for one cycle of measurements.
The results confirm that the SPDs have excellent energy efficiency due to minimal consumption in sleep mode and short active intervals of higher energy consumtion during evaluating measured data and running proposed Algorithm 2 every 10 min during daytime. The ratio of idle time to total duration is approximately 98.4%, indicating a dominant influence of the low-power phase on the overall energy balance. This consumption profile is suitable for the proposed SPDs, where long-term operation with minimal energy loss is expected.
The energy analysis indicates the expected lifetime of a system powered by two VARTA Industrial Pro AA batteries connected in series. Under ideal conditions, without significant losses, the system can operate for approximately 4.8 years, as shown in Figure 11. In real-world situations, accounting for 20% losses and occasional increases in consumption, the expected lifetime ranges from 3 to 4 years. A conservative estimate for a cold environment with increased current consumption gives a minimum duration of about 2 years, which still ensures long-term autonomy for typical IoT and sensor applications. With this life expectancy, the proposed system provides a real-time, cost-effective, and scalable solution for crop monitoring during the vegetation season.
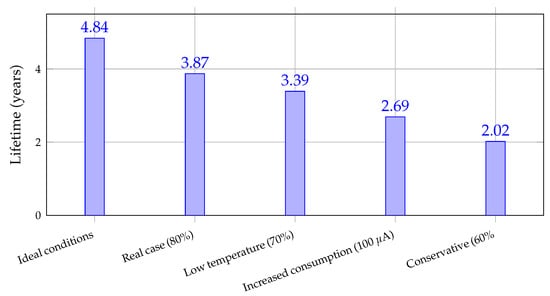
Figure 11.
Comparison of the estimated system lifetime under different operating conditions.
4. Discussion
Conducting this type of field experiment is challenging due to the long vegetation period and the practical impossibility of performing multiple full experimental cycles within a single year. Additionally, satellite overpasses are infrequent and sometimes affected by unfavorable atmospheric conditions, further limiting the likelihood of obtaining replicated measurements within the same season. Additional experiments with proper replication are already planned and will be carried out in the next growing season. The observed differences between the regression equations in Figure 4, arise from the fact that multiple independent experiments were conducted, as described in Table 3. Additionally, variations in device locations contributed to discrepancies in the results.
5. Conclusions
A combined system using Sentinel-2 imagery and affordable ground-based energy-efficiency SPDs was designed to measure NDVI, thereby enabling dense time-series monitoring of crop health by overcoming the limitations of satellite revisit intervals and cloud cover. A low-cost hybrid acquisition framework that combines Sentinel-2 and SPD measurements provided temporally dense NDVI measurements at the field level, matching satellite-based NDVI after a simple regression correction was proposed in this paper.
Prediction models were created using PLSR and validated using five-fold cross-validation, and the model with the lowest root-mean-square error of prediction (RMSEP) was selected. The projections were calculated using the dot product between the measurement indices and the model coefficients, including an intercept. Due to the dynamic nature of moisture content in maize kernels, predictions are most meaningful as relative deviations rather than absolute values, especially during the optimal harvest period, when kernel moisture is below 20%. Predictions outside the realistic moisture content range of 5% to 15% were adjusted by trimming to these limits. In addition, measurements used for model calibration were limited to data collected between 10 a.m. and 12 p.m. to increase prediction accuracy and relevance, from 8–18 July.
In general, the modeling strategy adequately accounted for variability due to irrigation and nitrogen management. The combination of high correlation coefficients, consistent regression results, and good agreement with field observations indicates that PLSR is a strong predictive method for agronomic attributes in crop monitoring. The graphical representations provide a temporal insight into the prediction results, while the tabular data confirm these results with conducted measurements. It is a cost-effective and scalable approach for high-precision agricultural measurements that supports crop management decision-making and yield estimation.
Author Contributions
Conceptualization, V.G. and J.S.; methodology, V.G. and I.P.Ž.; software, V.G. and J.S.; validation, D.V., I.P.Ž. and V.G.; formal analysis, J.S. and V.G.; field experiments, J.S. and V.G.; investigation, V.G. and J.S.; resources, I.P.Ž. and D.V.; data curation, V.G.; writing—original draft preparation, J.S. and V.G.; writing—review and editing, D.V. and I.P.Ž.; visualization, V.G.; funding acquisition, I.P.Ž. All authors have read and agreed to the published version of the manuscript.
Funding
This work is supported by the project “IoT-field: An Ecosystem of Networked Devices and Services for IoT Solutions Applied in Agriculture”, co-financed by the European Union from the European Regional Development Fund within the Operational Programme Competitiveness and Cohesion 2014–2020 of the Republic of Croatia.
Institutional Review Board Statement
Not applicable.
Informed Consent Statement
Not applicable.
Data Availability Statement
Data is available from the corresponding author upon request.
Conflicts of Interest
The authors declare no conflicts of interest.
Abbreviations
The following abbreviations are used in this manuscript:
| IoT | Internet of Things |
| SPD | Single-Pixel Detectors |
| VI | Vegetation Index |
| NDVI | Normalised Difference Vegetation Index |
| UAVs | Unmanned Aerial Vehicles |
| GAI | Green Area Index |
| FPAR | Fraction of Absorbed Photosynthetically Active Radiation |
| mSR2 | Simple Ratio-2 |
| ND705 | Red-Edge Normalised Difference Vegetation Index |
| ECa | Apparent Electrical Conductivity |
| RF | Random Forest |
| SVM | Support Vector Machines |
| FSV | Forest Stand Volume |
| SAVI | Soil-Adjusted Vegetation Index |
| SAR | Synthetic Aperture Radar |
| VH | Vertical–Horizontal Polarization |
| TM | Thematic Mapper |
| OLI | Operational Land Imager |
| GNDVI | Green Normalized Difference Vegetation Index |
| NDMI | Normalized Difference Moisture Index |
| fAPAR | Fraction of Absorbed Photosynthetically Active Radiation |
| GSV | Growing Stock Volume |
| FWHM | Full Width at Half Maximum |
| LAI | Leaf Area Index |
| DEMs | Digital Elevation Models |
| BARI | Boll Area Ratio Index |
| BORI | Boll Opening Rate Index |
| LR | Linear Regression |
| DSS | Decision Support System |
| RDI | Regulated Deficit Irrigation |
| PLSR | Partial Least Squares Regression |
| CNN | Convolutional Neural Network |
| DNN | Deep Neural Network |
| BRDF | Bidirectional Reflectance Distribution Function |
References
- Tantalaki, N.; Souravlas, S.; Roumeliotis, M. Data-Driven Decision Making in Precision Agriculture: The Rise of Big Data in Agricultural Systems. J. Agric. Food Inf. 2019, 20, 344–380. [Google Scholar] [CrossRef]
- Abbasi, R.; Martinez, P.; Ahmad, R. The digitization of agricultural industry—A systematic literature review on agriculture 4.0. Smart Agric. Technol. 2022, 2, 100042. [Google Scholar] [CrossRef]
- Rejeb, A.; Rejeb, K.; Abdollahi, A.; Al-Turjman, F.; Treiblmaier, H. The Interplay between the Internet of Things and agriculture: A bibliometric analysis and research agenda. Internet Things 2022, 19, 100580. [Google Scholar] [CrossRef]
- Mihret, Y.C.; Takele, M.M.; Mintesinot, S.M. Advancements in Agriculture 4.0 and the Needs for Introduction and Adoption in Ethiopia: A Review. Adv. Agric. 2025, 2025, 8828400. [Google Scholar] [CrossRef]
- Xue, J.; Su, B. Significant remote sensing vegetation indices: A review of developments and applications. J. Sens. 2017, 2017, 1353691. [Google Scholar] [CrossRef]
- Spadoni, G.L.; Cavalli, A.; Congedo, L.; Munafò, M. Analysis of normalized difference vegetation index (NDVI) multi-temporal series for the production of forest cartography. Remote Sens. Appl. Soc. Environ. 2020, 20, 100419. [Google Scholar] [CrossRef]
- Segarra, J.; Buchaillot, M.L.; Araus, J.L.; Kefauver, S.C. Remote Sensing for precision agriculture: Sentinel-2 improved features and applications. Agronomy 2020, 10, 641. [Google Scholar] [CrossRef]
- Darra, N.; Espejo-Garcia, B.; Psiroukis, V.; Psomiadis, E.; Fountas, S. Spectral bands vs. vegetation indices: An AutoML approach for processing tomato yield predictions based on Sentinel-2 imagery. Smart Agric. Technol. 2025, 10, 100805. [Google Scholar] [CrossRef]
- Sulistyo, S.B.; Siswantoro; Margiwiyatno, A.; Masrukhi; Mustofa, A.; Sudarmaji, A.; Ediati, R.; Listanti, R.; Hidayat, H.H. Handheld arduino-based near infrared spectrometer for non-destructive quality evaluation of siamese oranges. IOP Conf. Ser. Earth Environ. Sci. 2021, 653, 012119. [Google Scholar] [CrossRef]
- Fletcher, R.S.; Fisher, D.K. A Miniature Sensor for Measuring Reflectance, Relative Humidity, and Temperature: A Greenhouse Example. Agric. Sci. 2018, 9, 1516–1527. [Google Scholar] [CrossRef]
- Macagga, R.; Sossa, G.; Ayaribil, Y.; Bayot, R.; Sanchez, P.; Augustin, J.; Bellingrath-Kimura, S.D.; Hoffmann, M. A new, low-cost ground-based NDVI sensor for manual and automated crop monitoring. Smart Agric. Technol. 2025, 11, 100892. [Google Scholar] [CrossRef]
- Lopin, P.; Nawsang, P.; Laywisadkul, S.; Lopin, K.V. Evaluation of Low-Cost Multi-Spectral Sensors for Measuring Chlorophyll Levels Across Diverse Leaf Types. Sensors 2025, 25, 2198. [Google Scholar] [CrossRef] [PubMed]
- Bollas, N.; Kokinou, E.; Polychronos, V. Comparison of sentinel-2 and UAV multispectral data for use in precision agriculture: An application from Northern Greece. Drones 2021, 5, 35. [Google Scholar] [CrossRef]
- Magno, R.; Rocchi, L.; Dainelli, R.; Matese, A.; Di Gennaro, S.F.; Chen, C.-F.; Son, N.-T.; Toscano, P. Agroshadow: A new sentinel-2 cloud shadow detection tool for precision agriculture. Remote Sens. 2021, 13, 1219. [Google Scholar] [CrossRef]
- Bukowiecki, J.; Rose, T.; Kage, H. Sentinel-2 data for precision agriculture?—A UAV-based assessment. Sensors 2021, 21, 2861. [Google Scholar] [CrossRef]
- Meier, J.; Mauser, W.; Hank, T.; Bach, H. Assessments on the impact of high-resolution-sensor pixel sizes for Common Agricultural Policy and Smart Farming Services in European regions. Comput. Electron. Agric. 2020, 169, 105205. [Google Scholar] [CrossRef]
- Dong, T.; Meng, J.; Shang, J.; Liu, J.; Wu, B. Evaluation of Chlorophyll-Related Vegetation Indices Using Simulated Sentinel-2 Data for Estimation of Crop Fraction of Absorbed Photosynthetically Active Radiation. IEEE J. Sel. Top. Appl. Earth Obs. Remote Sens. 2015, 8, 4049–4059. [Google Scholar] [CrossRef]
- Martínez-Casasnovas, J.A.; Uribeetxebarría, A.; Escolà, A.; Arnó, J. Sentinel-2 vegetation indices and apparent electrical conductivity to predict barley (Hordeum vulgare L.) yield. In Precision Agriculture ’19; Wageningen Academic Publishers: Wageningen, The Netherlands, 2019. [Google Scholar] [CrossRef]
- Sonobe, R.; Yamaya, Y.; Tani, H.; Wang, X.; Kobayashi, N.; Mochizuki, K. Crop classification from Sentinel-2-derived vegetation indices using ensemble learning. J. Appl. Remote Sens. 2018, 12, 026019. [Google Scholar] [CrossRef]
- Ma, T.; Hu, Y.; Wang, J.; Beckline, M.; Pang, D.; Chen, L.; Ni, X.; Li, X. A Novel Vegetation Index Approach Using Sentinel-2 Data and Random Forest Algorithm for Estimating Forest Stock Volume in the Helan Mountains, Ningxia, China. Remote Sens. 2023, 15, 1853. [Google Scholar] [CrossRef]
- Ubale, S.P.; Prasanna, J.; Atre, A.A.; Pande, C.; Gorantiwar, S.D. Application of NDVI in Vegetation Monitoring using Sentinel-2 Data for Shrirampur Region of Maharashtra. Int. J. Curr. Microbiol. Appl. Sci. 2021, 10, 799–806. [Google Scholar] [CrossRef]
- Alvarez-Mozos, J.; Villanueva, J.; Arias, M.; Gonzalez-Audicana, M. Correlation between NDVI and Sentinel-1 Derived Features for Maize. In Proceedings of the 2021 IEEE International Geoscience and Remote Sensing Symposium (IGARSS), Brussels, Belgium, 11–16 July 2021; pp. 6773–6776. [Google Scholar] [CrossRef]
- Boori, M.S.; Choudhary, K.; Kupriyanov, A.V. Crop growth monitoring through Sentinel and Landsat data based NDVI time-series. Comput. Opt. 2020, 44, 409–419. [Google Scholar] [CrossRef]
- Jin, X.; Li, Z.; Feng, H.; Ren, Z.; Li, S. Deep neural network algorithm for estimating maize biomass based on simulated Sentinel 2A vegetation indices and leaf area index. Crop J. 2020, 8, 87–97. [Google Scholar] [CrossRef]
- D’Odorico, P.; Gonsamo, A.; Damm, A.; Schaepman, M.E. Experimental Evaluation of Sentinel-2 Spectral Response Functions for NDVI Time-Series Continuity. IEEE Trans. Geosci. Remote Sens. 2013, 51, 1336–1348. [Google Scholar] [CrossRef]
- Antognelli, S. The Great Value of Vegetation Indices from Satellite for Farmers. 2020. Available online: https://www.copernicus.eu/system/files/2020-12/NT%2025nov%20-%20The%20great%20value%20of%20vegetation%20indices%20from%20satellite%20for%20farmers.pdf (accessed on 22 April 2024).
- Strashok, O.; Ziemiańska, M.; Strashok, V. Evaluation and Correlation of Sentinel-2 NDVI and NDMI in Kyiv (2017–2021). J. Ecol. Eng. 2022, 23, 212–218. [Google Scholar] [CrossRef]
- Ren, Y.; Zhou, J.; Chen, J.; Tao, S.; Qin, L.; Li, G.; Lin, Z.; Luo, H. Novel Vegetation Indices for Cotton Boll Opening Status Estimation Using Sentinel-2 Data. Remote Sens. 2020, 12, 1712. [Google Scholar] [CrossRef]
- Harmse, C.J.; Gerber, H.; van Niekerk, A. Evaluating Several Vegetation Indices Derived from Sentinel-2 Imagery for Quantifying Localized Overgrazing in a Semi-Arid Region of South Africa. Remote Sens. 2022, 14, 1720. [Google Scholar] [CrossRef]
- Fang, G.; He, X.; Weng, Y.; Fang, L. Texture Features Derived from Sentinel-2 Vegetation Indices for Estimating and Mapping Forest Growing Stock Volume. Remote Sens. 2023, 15, 2821. [Google Scholar] [CrossRef]
- Bellvert, J.; Pelechá, A.; Pamies-Sans, M.; Virgili, J.; Torres, M.; Casadesús, J. Assimilation of Sentinel-2 Biophysical Variables into a Digital Twin for the Automated Irrigation Scheduling of a Vineyard. Water 2023, 15, 2506. [Google Scholar] [CrossRef]
- Spišić, J.; Šimić, D.; Balen, J.; Jambrović, A.; Galić, V. Machine Learning in the Analysis of Multispectral Reads in Maize Canopies Responding to Increased Temperatures and Water Deficit. Remote Sens. 2022, 14, 2596. [Google Scholar] [CrossRef]
- Roy, D.P.; Zhang, H.K.; Ju, J.; Gomez-Dans, J.L.; Lewis, P.E.; Schaaf, C.B.; Sun, Q.; Li, J.; Huang, H.; Kovalskyy, V. A general method to normalize Landsat reflectance data to nadir BRDF adjusted reflectance. Remote Sens. Environ. 2016, 176, 255–271. [Google Scholar] [CrossRef]
- Roy, D.P.; Li, J.; Zhang, H.K.; Yan, L.; Huang, H.; Li, Z. Examination of Sentinel-2A multi-spectral instrument (MSI) reflectance anisotropy and the suitability of a general method to normalize MSI reflectance to nadir BRDF adjusted reflectance. Remote Sens. Environ. 2017, 199, 25–38. [Google Scholar] [CrossRef]
- Lucht, W.; Schaaf, C.B.; Strahler, A.H. An algorithm for the retrieval of albedo from space using semiempirical BRDF models. IEEE Trans. Geosci. Remote Sens. 2000, 38, 977–998. [Google Scholar] [CrossRef]
- Mevik, B.H.; Wehrens, R. The pls Package: Principal Component and Partial Least Squares Regression in R. J. Stat. Softw. 2007, 18, 1–23. [Google Scholar] [CrossRef]
- Wang, F.; Zhao, C.; Guijun, Y. Development of a Non-Destructive Method for Detection of the Juiciness of Pear via VIS/NIR Spectroscopy Combined with Chemometric Methods. Foods 2020, 9, 1778. [Google Scholar] [CrossRef]
- Izadkhah, H. Chapter 2—A review of machine learning. In Deep Learning in Bioinformatics; Izadkhah, H., Ed.; Academic Press: Cambridge, MA, USA, 2022; pp. 9–30. [Google Scholar] [CrossRef]
Disclaimer/Publisher’s Note: The statements, opinions and data contained in all publications are solely those of the individual author(s) and contributor(s) and not of MDPI and/or the editor(s). MDPI and/or the editor(s) disclaim responsibility for any injury to people or property resulting from any ideas, methods, instructions or products referred to in the content. |
© 2025 by the authors. Licensee MDPI, Basel, Switzerland. This article is an open access article distributed under the terms and conditions of the Creative Commons Attribution (CC BY) license (https://creativecommons.org/licenses/by/4.0/).