Communication

Evaluating the Performance of NIR Spectroscopy in Predicting Soil Properties: A Comparative Study

1
National Institute of Agricultural Sciences, Rural Development Administration, Wanju 55365, Republic of Korea
2
School of Life and Environmental Sciences, The University of Sydney, Sydney 2006, Australia
*
Author to whom correspondence should be addressed.
Appl. Sci. 2025, 15(24), 13240; https://doi.org/10.3390/app152413240
Submission received: 19 November 2025 / Revised: 11 December 2025 / Accepted: 12 December 2025 / Published: 17 December 2025
(This article belongs to the Special Issue Automation and Smart Technologies in Agriculture)

Abstract

Soil analysis is fundamental to sustainable agriculture; however, traditional laboratory methods are time-consuming, expensive, and environmentally hazardous. Spectroscopy techniques, particularly Near-Infrared (NIR), have gained considerable attention because they require minimal sample preparation, no chemicals, and predict multiple soil properties with a single scan. However, selecting appropriate equipment remains critical, as previous studies have reported inconsistent performance between conventional Near-Infrared (NIR) spectroscopy and advanced Fourier-Transform Near-Infrared (FT-NIR) spectroscopy. Therefore, this study aimed to compare the predictive performance of conventional NIR and advanced FT-NIR spectroscopy for sixteen soil properties. Soil samples (n = 567) were collected from different land-use types across South Korea at a depth of 0–20 cm and analyzed using laboratory methods and spectroscopy techniques. Five models, including partial least squares regression (PLSR), Cubist, support vector machine (SVM), random forest (RF), and memory-based learning (MBL), were evaluated using 15-fold cross-validation to assess prediction accuracy. Overall, conventional NIR spectroscopy yielded consistently higher accuracy for all soil properties than FT-NIR. Strong predictive accuracy was achieved for EC (R2 = 0.84), OM (R2 = 0.84), avl. P (R2 = 0.77), TN (R2 = 0.84), and CEC (R2 = 0.76). In contrast, FT-NIR provided good prediction accuracy only for Ex. K (R2 = 0.72) and TN (R2 = 0.84). The average performance of NIR (R2 = 0.67) outperformed FT-NIR spectroscopy (R2 = 0.63) across all soil properties. These findings demonstrate that, despite their lower spectral resolution, NIR spectra provide robust predictive capability across a wide range of soil properties, which can significantly reduce the investment cost of advanced equipment such as FT-NIR for routine soil analysis.

1. Introduction

Agriculture is supporting the growing population and makes a substantial contribution to the global economy. It plays a pivotal role in ensuring food security by supporting crop productivity and human well-being [1,2]. However, soil quality is increasingly deteriorating due to intensive anthropogenic activities, particularly the excessive and unregulated use of chemical fertilizers and pesticides without routine soil monitoring. Such improper agrochemical practices pose significant challenges not only to food security but also to long-term agricultural sustainability.
In Korea, farmers extensively applied chemical fertilizers to improve crop yields, resulting in greater nitrogen (N) (147 kg ha−1) and phosphorus (P) (23 kg ha−1) balances that exceed crop requirements. These N and P values are also higher than those reported for many other OECD countries [3,4,5], underscoring the urgent need for rapid, reliable soil health monitoring methods. Monitoring soil health is essential for optimizing key agronomic practices, including tillage, irrigation, fertilization, and crop selection, thereby promoting sustainable agriculture. However, effective soil health monitoring depends on comprehensive soil analysis of nutrient levels, texture, soil organic matter (SOM), pH, and other physicochemical parameters. By obtaining this data, growers can make informed decisions about soil amendments and management strategies [6,7,8]. Although conventional wet-chemistry methods provide accurate assessments of soil properties, they are labor-intensive, costly, and require specialized laboratory facilities, and involve chemical reagents that can generate environmental pollution [9,10,11]. Addressing the interconnected challenges of environmental protection and food production thus necessitates rapid, cost-effective, and sustainable analytical tools that can be supported by spectroscopy-assisted precision agriculture.
Near-infrared (NIR) spectroscopy is a nondestructive technique increasingly used in agriculture to quickly and accurately analyze soil physical and chemical characteristics [12]. It relies on diffuse reflectance measurements in the 780 to 2500 nm wavelength range [13]. Within this spectral range, vibrations in chemical bonds such as C–H, O–H, and N–H produce reflectance signals that reveal the relative proportions of each element in the sample [14]. NIR spectroscopy is particularly favored in soil science due to its minimal sample preparation requirements, ease of use, and portability [15]. Numerous studies have demonstrated the ability of NIR spectroscopy in predicting various soil characteristics, including total nitrogen (TN), total carbon (TC), electrical conductivity (EC), pH, distribution of C and N in particle size fractions, organic carbon (OC), salinity, and moisture content [16,17,18,19,20,21,22,23].
Previous comparative studies have highlighted differences in prediction accuracy between spectral techniques. For example, Ramírez et al. [24] used NIR and MIR spectroscopy to predict various soil properties, reporting that MIR spectroscopy achieved higher prediction accuracy across all properties, whereas NIR yielded comparable accuracy for total organic carbon (TOC), TN, cation exchange capacity (CEC), and clay content. Carvalho et al. [25] successfully predicted soil organic matter (SOM) with 85% accuracy using NIR spectroscopy relative to the modified Walkley-Black method. Nonetheless, NIR prediction performance varies among studies. Some reported high accuracy for soil organic carbon (SOC; R2 = 0.85) using Vis–NIR spectroscopy [26], while others observed lower accuracy (R2 = 0.73) for the same property [27]. Such discrepancies may arise from differences in calibration and validation datasets, soil texture variability, inherent soil heterogeneity, spectral pre-processing techniques, and the modeling algorithms employed [28]. Instrumentation type is another critical factor affecting NIR prediction accuracy. For example, Knadel et al. [29] compared three Vis–NIR spectrometers with differing spectral ranges and resolutions and reported substantial variation in the prediction accuracy of clay (R2 = 0.71–0.77) and SOC (R2 = 0.42–0.59), largely attributable to differences in spectral range. Similarly, Cabassi et al. [30] reported that the benchtop spectrometer achieved higher accuracy in predicting dry matter and ash content in cattle slurry than the portable spectrometer, primarily due to differences in resolution.
An NIR spectrometer requires different hardware to capture spectral information. However, FT-NIR is a technique that offers high resolution, advanced detectors, and complex hardware, enabling it to perform the entire process [15]. This enables the accurate identification of narrow spectral features, potentially enhancing prediction accuracy for complex samples [31]. Despite these advantages, FT-NIR instruments are substantially more expensive due to their sophisticated hardware, which limits their widespread adoption in routine soil analysis compared to NIR [32]. Furthermore, comparative evaluations of NIR and FT-NIR performance for predicting a wide range of soil properties remain limited, particularly for Korean soils. Here, our hypotheses are that (i) traditional NIR spectroscopy can perform equally to FT-NIR spectroscopy for the prediction of a wide range of soil properties, (ii) prediction accuracy will vary across soil properties depending on their spectral response, and (iii) the choice of machine learning algorithm can significantly influence predictive performance. Therefore, the present study primarily focused on evaluating the performance of NIR and FT-NIR spectroscopy in predicting sixteen soil properties, with special emphasis on their accuracy. To the best of our knowledge, this study represents the first comprehensive assessment in Korea comparing the predictive performance of conventional NIR and FT-NIR spectroscopy for soil analysis. This work offers novel insights into the applicability of spectroscopy under Korean soil conditions, making it unique.

2. Materials and Methods

2.1. Soil Sampling

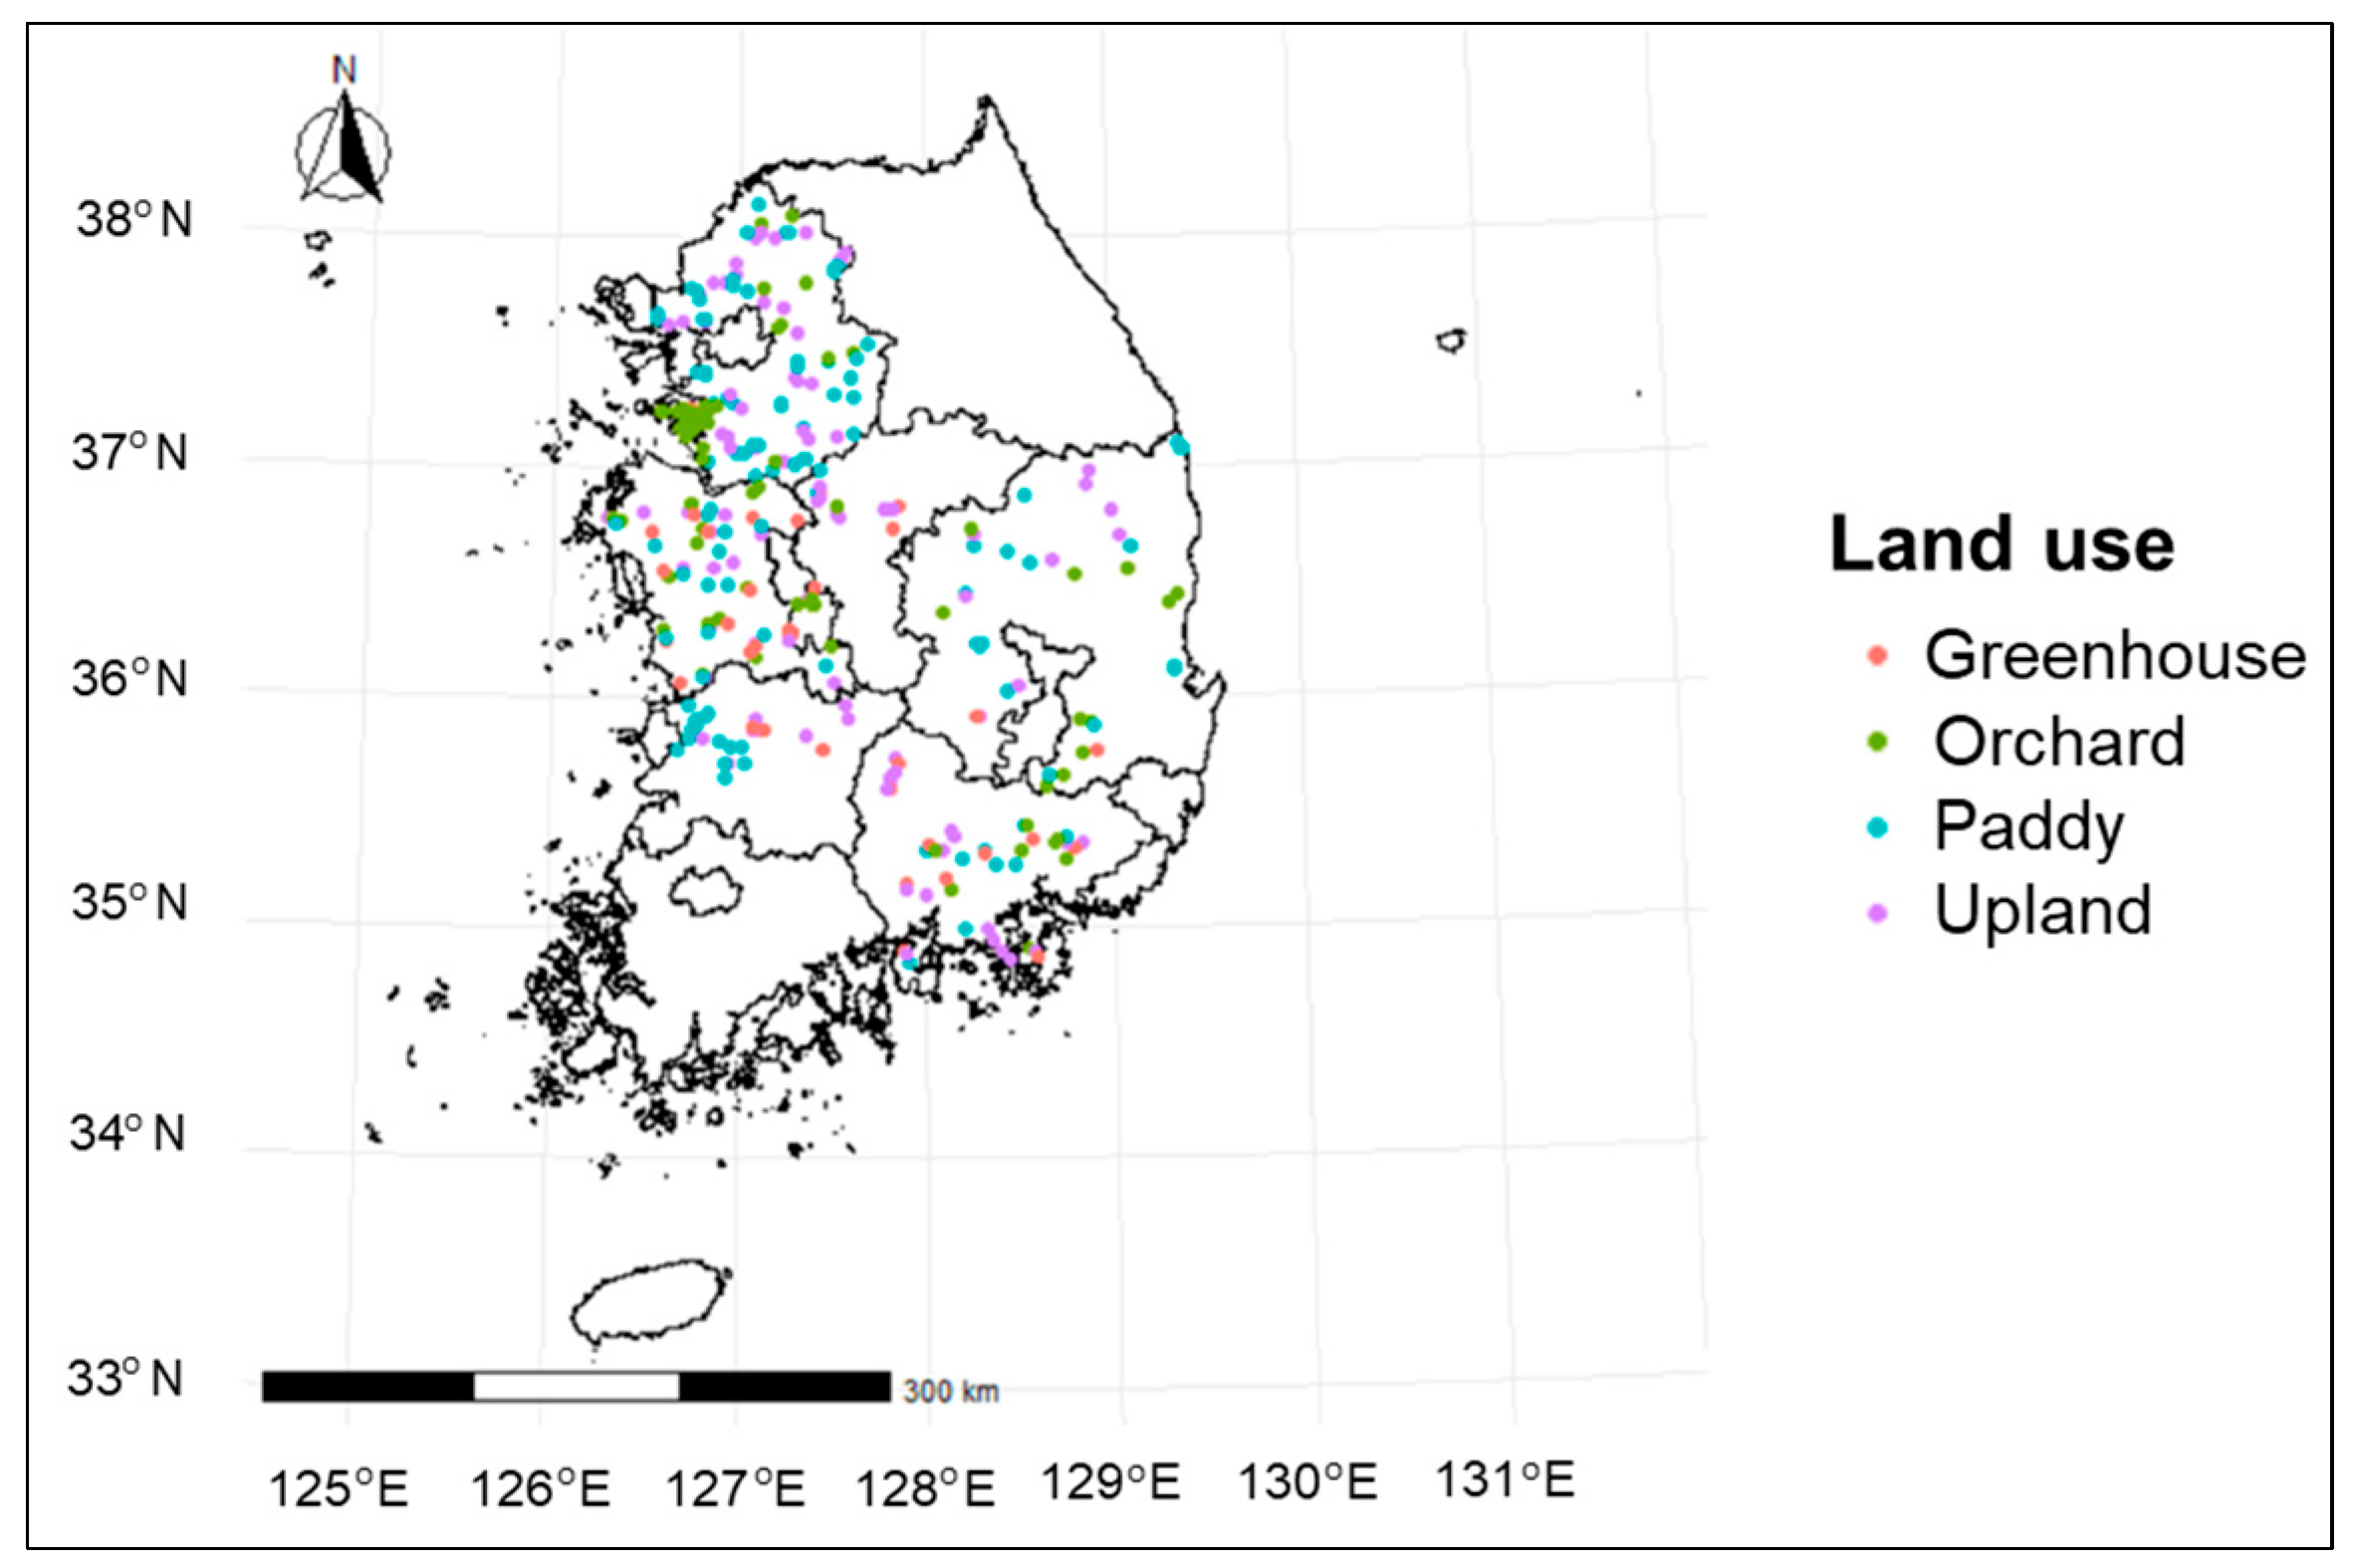
For the experimental work, considering the geographical location and land use types, including upland, paddy, orchard, and greenhouse fields, 567 soil samples were collected from 567 various points across South Korea, as illustrated in Figure 1. In South Korea, two soil types, Inceptisol (74%) and Entisol (14%), are dominant [11]. Sample collection followed the standard method mentioned by the National Academy of Agricultural Science [33]. At each sampling point, a sample was collected in triplicate from a 1 m2 area at a depth of 0–20 cm within the plow layer in March and May in 2021 and 2022, prior to crop planting. The plow layer was used to predict soil properties via spectroscopy because it reflects the active zone where fertilizers and amendments are applied and plays a crucial role in agricultural practices. The collected samples were air-dried, ground to reduce particle-size effects on NIR and FT-NIR analysis, and sieved through a 2 mm sieve to obtain a homogeneous sample. The prepared samples were subsequently subjected to spectral and chemical analysis.

2.2. Determination of Chemical Soil Properties

All reagents and chemicals were analytical grade. Potassium dichromate was purchased from Junsei Chemical Co., Ltd. (Tokyo, Japan). Ferrous ammonium sulphate was obtained from Acros Organic (Geel, Belgium). Ammonium acetate was acquired from Duksan Pure Chemical Co., Ltd. (Ansan, Republic of Korea). Sodium acetate was purchased from Daejung Chemical & Metals Co., Ltd. (Siheung, Republic of Korea). Soil pH was determined by equilibrating the sample with deionized water at a 1:5 (w/w) ratio in a conical centrifuge tube and agitating at 120 rpm for 30 min. The solution pH was then measured using a pH meter (Orion, Thermo Scientific, Waltham, MA, USA). To determine organic matter (OM) content, Tyurin method was adopted, and sample was titrated with potassium dichromate (K2Cr2O7). The oxidized soil solution was then titrated with ferrous ammonium sulphate ((NH4)2SO4FeSO4) solution. The soil organic matter content was then estimated by multiplying the measured organic carbon by the conversion factor of 1.724. To analyze OM to measure the total C (OM-CN), an elemental analyser (Elementar Vario MAX, Elementar Analysensysteme GmbH, Hanau, Germany) was employed with same conversion factor of 1.724. The total nitrogen (TN-CN) and available phosphorus (avl. P2O5) were determined using the elemental analyser (Elementar Vario MAX, Elementar Analysensysteme GmbH, Hanau, Germany) and Lancaster method [34], National Academy of Agricultural Science [33], respectively. Exchangeable cations (Mg, Ca, and K) were extracted with 1 M ammonium acetate (NH4OAc, pH 7) solution and analyzed using inductively coupled plasma (ICP) analysis (GBC Scientific, Melbourne, VIC, Australia). The sodium acetate solution (pH 4) was used to extract silicic acid (SiO2), and its concentration was measured by colorimetric analysis. Detailed analytical procedures are provided by the National Academy of Agricultural Science [33].

2.3. Spectral Measurement

The spectral measurement study was performed using two instruments: benchtop NIR-SpectraStar XT (Unity Scientific, Milford, MA, USA) and FT-NIR-MPA-II (Bruker, Ettlingen, Germany) spectroscopy. Prior to spectral acquisition, soil samples were air-dried for 5 days to minimize moisture’s influence on spectral response. For the NIR-SpectraStar XT (Unity Scientific, Milford, MA, USA), samples were scanned over 680–2600 nm wavelengths at 2 nm intervals. Each sample was measured 30 times using an automated sample rotator, and the average spectrum was used for subsequent analysis. To enhance spectral linearity, reflectance data were converted to absorbance using log10 (1/Reflectance). For the FT-NIR-MPA-II (Bruker, Ettlingen, Germany) spectrometer, soil samples were placed in an aluminum quartz rotating sample cup (9 cm height, 5 cm diameter), lightly tapped to ensure settling, and reflectance was measured over the range of 11,500–4000 cm−1 with a resolution of 16 cm−1 and a measurement time of 60 s. The analysis was performed under laboratory-controlled conditions at 25 °C.

2.4. Spectra Pre-Processing

Pre-processing is an essential step in spectroscopy, as raw spectra often contain noise arising from factors such as sample heterogeneity, particle-size effects, and fluctuations in light intensity, which can reduce the model’s robustness. Several pre-processing methods, such as detrending, multiplicative scatter correction (MSC), normalization, standard normal variate (SNV), Savitzky–Golay (SG), and Norris-Williams (NW) derivatives, have been developed to address these issues [35]. Among these, SNV and SG are widely adopted pre-processing methods in spectroscopy [36]. In this study, unprocessed spectra were pre-processed using spectral trimming, standard normal variate (SNV), and Savitzky–Golay (SG) smoothing in R software version 4.1.1. The R codes were executed as described by Wadoux et al. [37]. These pre-processing steps were applied to reduce spectral noise and enhance chemically relevant spectral features prior to model development.

2.5. Chemometrics Models

A chemometric modeling approach is essential in soil spectroscopy, as it enables the extraction of meaningful information from complex spectral signatures [38]. In this study, five calibration models, including partial least squares regression (PLSR), Cubist, support vector machine (SVM), random forest (RF), and memory-based learning (MBL), were evaluated for predicting soil properties. Model performance was assessed using 15-fold cross-validation.

2.5.1. Partial Least Squares Regression (PLSR)

PLSR is a linear regression model commonly used in spectroscopy that transforms spectra into latent variables, explaining the variances within both the spectra and response variables [39]. In the present study, cross-validation was used to determine the optimal number of latent variables based on lower root mean square errors (RMSEs) for predicting soil attributes. PLSR was performed in statistical software R version 4.1.1 using the pls package.

2.5.2. Cubist

The Cubist is a rule-based regression model that combines trees with linear regression, enabling the handling of large and high-dimensional datasets [40]. Its effectiveness in spectroscopic applications has been reported in several studies [41,42]. In this study, the Cubist model was applied using the Cubist package in R version 4.1.1 [43].

2.5.3. Support Vector Machine (SVM)

Support vector machine (SVM), introduced by Cortes and Vapnik [44], is a kernel-based machine learning technique capable of performing both classification and regression tasks. SVM can effectively handle nonlinear and complex problems by leveraging kernel tricks [45]. In regression applications, SVM seeks to capture a better relationship between input variables (reflectance) and desired soil attributes (cost) while minimizing errors in the defined margin (epsilon). In this study, an SVM model was implemented in R using e1071 package [46] with a linear kernel. The cost and epsilon parameters were optimized to 5 and 0.1, respectively.

2.5.4. Random Forest (RF)

RF is an ensemble of decision tree models that augments prediction accuracy by combining multiple decision trees [47]. Each tree is trained via bootstrapping on calibration data and employs the random subspace approach at every node split. The RF model was executed using the randomForest package in R version 4.1.1 [48]. The 500 and 10 were selected as the default values for trees and mtry, respectively.

2.5.5. Memory-Based Learning (MBL)

MBL is a data-driven technique analogous to case-based reasoning (CBR) [49]. Similar to CBR, MBL emulates the human reasoning process [49,50] by learning from prior data instances and integrating them to resolve new problems based on spectral similarities. Different spectral similarity measurement methods, such as Mahalanobis distance in the principal component (PC) space and Pearson’s correlation coefficient, have been used to identify spectrally similar samples. The PLSR, weighted-average PLSR [51], and Gaussian process [49] are common methods for fitting local target functions. In this study, the Mahalanobis distance in PC space was used for neighbor search, and PLSR was applied for local target functions. MBL was implemented in R using the resemble package.

2.6. Model Validation and Evaluation

Model validation was performed using k-fold cross-validation, a widely adopted statistical approach for evaluating predictive performance. However, this method can yield biased results if the data is poorly distributed. Although 10-fold cross-validation is commonly applied in previous studies, the choice of k-fold can substantially influence validation accuracy. In the present study, we systematically evaluated the influence of different k-folds (5–50) on model validation accuracy. For each K-fold, we computed the average performance metrics across all soil properties and compared the resulting R2 values. Based on this analysis, 15-fold cross-validation consistently yielded higher and more stable R2 values than 5- and 10-fold cross-validation and was comparable to other folds (Supplementary Figure S1). Accordingly, 15-fold cross-validation was selected as an optimal strategy. A previous Korean study also demonstrated 15-fold cross-validation suitability for soil spectroscopy applications [11]. Furthermore, model accuracy was evaluated using multiple statistical metrics, including the coefficient of determination (R2), root mean squared error (RMSE), ratio of performance to deviation (RPD), and bias. To evaluate the model’s systematic bias within the range of soil characteristics, residual plot analysis was performed by stratifying each soil property into low, medium, and high categories.

3. Results and Discussions

3.1. Soil Characteristics

The descriptive statistics of the soil properties used for model development are presented in Table 1. Soil pH ranged from 3.7 to 8.8, with most samples exhibiting acidic conditions. Electrical conductivity (EC) varied between 0.1 and 23.2 dS m−1 (Table 1).
Organic matter was measured using both Tyurin and elemental combustion method, with concentrations observed ranging from 1.2 to 115.3 g kg−1 and 1.8 to 130.2 g kg−1, respectively. The higher OM content measured by the elemental analyzer compared to Tyurin method may be attributed to the presence of calcareous soil [52]. Available phosphorus (avl. P2O5), measured according to the Lancaster method, ranged from 9.3 to 4031.9 mg kg−1. Exchangeable cations were found in the following ranges: K, 0.1 to 9.8 cmol kg−1; Ca, 0.8 to 31.3 cmol kg−1; and Mg, 0.2 to 15.6 cmol kg−1. Sodium (Na) and total nitrogen (TN-CN) values were found between 0.0 and 7.5 cmol kg−1 and 0.0 to 0.9%, respectively. Soil texture analysis revealed considerable variability, with sand, silt, and clay contents ranging from 2.3 to 81.5%, 0.9 to 79.6%, and 3.3 to 41.7%, respectively. Cation exchange capacity (CEC), lime requirement (LR), and plant available silica (SiO2) were observed within ranges of 2.6 to 34.5 cmol kg−1, 0.0 to 1247.5 (10 t ha−1), and 30.2 to 1147.1 mg kg−1, respectively.

3.2. Spectroscopy Performance for Predicting Soil Properties

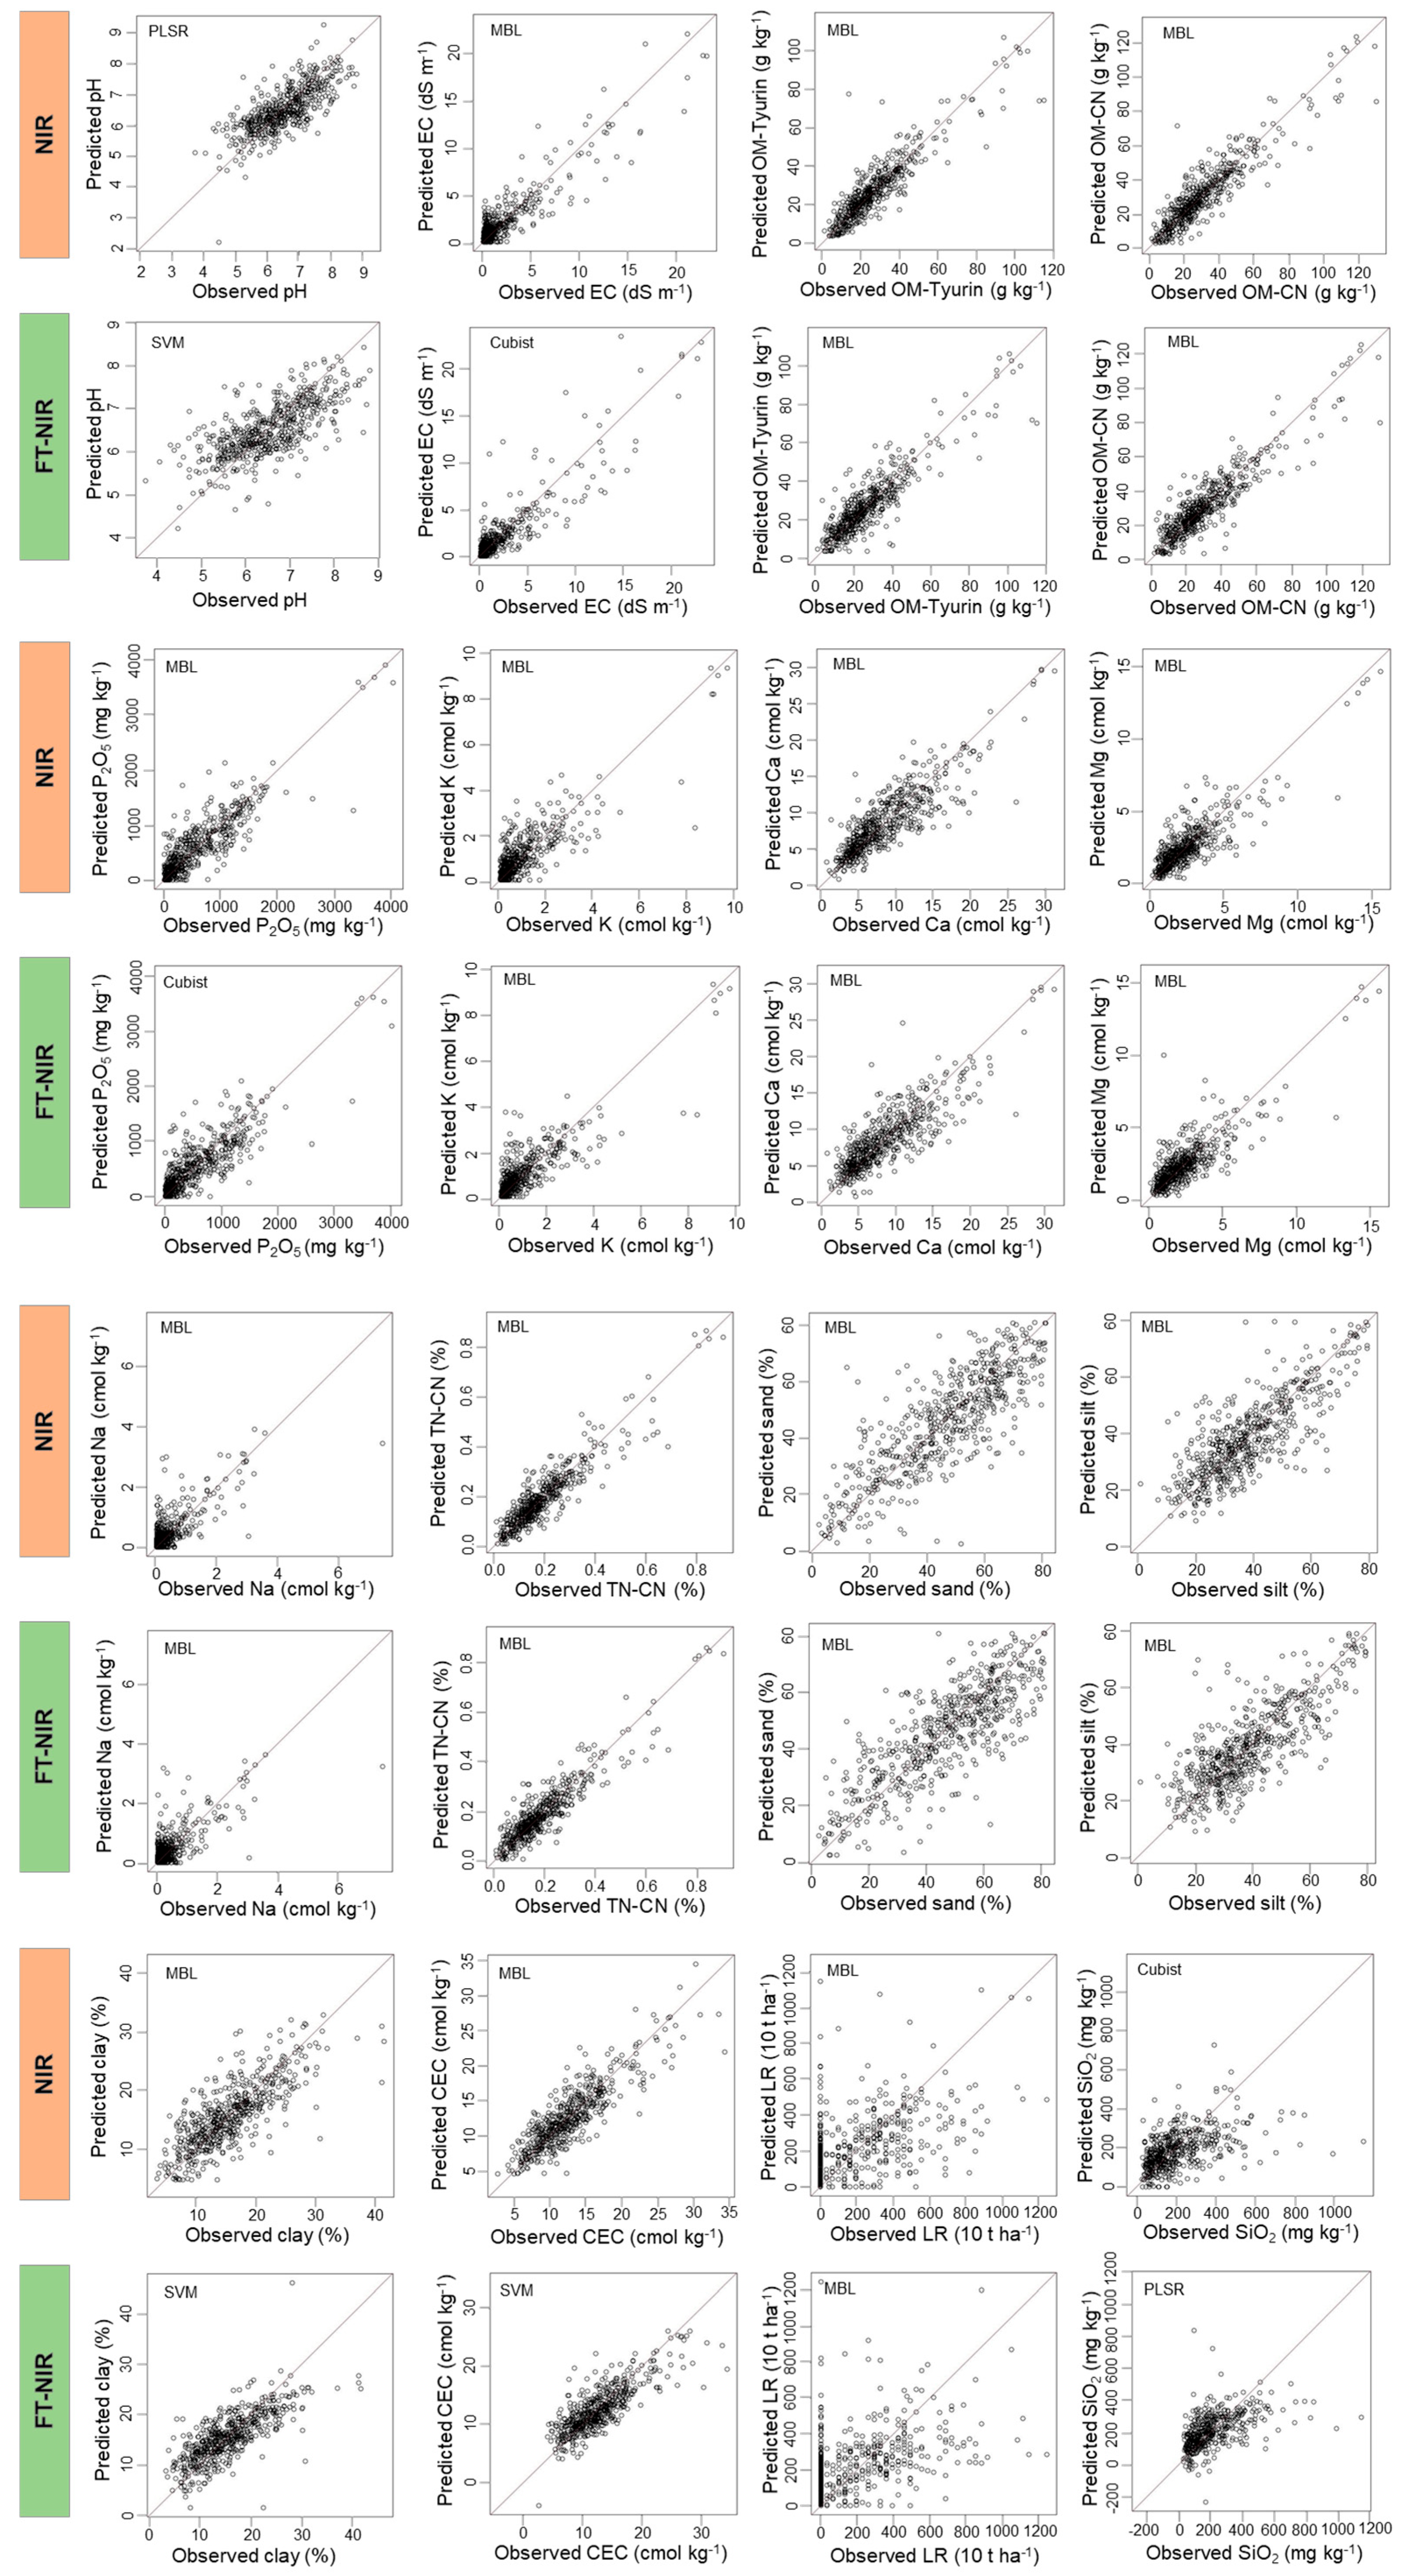
The sixteen soil properties were estimated using the NIR and FT-NIR spectroscopy, coupled with five calibration models: PLSR, Cubist, SVM, RF, and MBL, which exhibited varying predictive performances. The predicted results from both spectroscopies are summarized in Table 2 and illustrated in Figure 2. The data presented in Table 2 exhibited 15-fold cross-validation results of the optimized model for each soil property and instrument, while full dataset for all models is provided in Supplementary Table S1. Values highlighted in bold in Table 2 indicate the best-performing model and spectroscopic method for each soil property. On average, NIR spectroscopy showed better performance (R2 = 0.67) in predicting a complete set of soil properties than FT-NIR spectroscopy (R2 = 0.63). However, predictive performance for individual soil attributes varied across instruments and calibration models. For instance, OM prediction was slightly more accurate (R2 = 0.84) using MBL-coupled NIR spectroscopy than the MBL-coupled FT-NIR spectroscopy (R2 = 0.83). In contrast, FT-NIR coupled MBL yielded marginally greater prediction accuracy for Ex. K (R2 = 0.72) compared to MBL-coupled NIR spectroscopy (R2 = 0.71). These differences in prediction accuracy are likely attributable to several factors, including spectral range, resolution, optical configurations, and sensitivity to specific soil characteristics.
A similar study by Pudełko et al. [53] evaluated the prediction of two soil properties: soil organic carbon and total nitrogen using NIR and FT-NIR spectroscopy. They observed that the FT-NIR-coupled ANN and PLSR models achieved higher prediction accuracy for TN (R2 = 0.90) than the NIR-HSI-coupled ANN (R2 = 0.88) and PLSR (R2 = 0.89) models, while an opposite trend was observed for OC (R2 = 0.96).
The soil properties, including EC, OM, avl. P, Ex. K, Ca, Mg, TN, and CEC, predicted using NIR, exhibited higher R2 values, ranging from 0.71 to 0.84, whereas pH, Ex. Na, texture, LR, and SiO2 had lower to moderate prediction accuracies (R2 = 0.24 to 0.67). The higher prediction accuracy for OM (R2 = 0.82–0.84) and TN (R2 = 0.84) may be attributed to the strong NIR spectral reflectance arising from overtone and combination vibrations of functional groups such as C-H, N-H, and O-H. These results are consistent with Santasup et al. [54], who reported R2 values greater than 0.80 for OM and TN using NIR spectroscopy. Soil properties, such as CEC, do not exhibit a direct spectral response in the NIR spectral region. Nevertheless, moderate prediction accuracy for CEC (R2 = 0.76) was achieved, likely due to its correlation with OM and clay content, which strongly influence NIR response [55]. Across all models, medium prediction accuracies for P (R2 = 0.77) and K (R2 = 0.71) with NIR may be due to the absence of direct spectral absorption features in the NIR region for these nutrients [56]. McBride [56] and several other studies [57,58] have also noted the challenges of predicting exchangeable cations using NIR due to weak spectral responses or lack of direct absorption features. A weak spectral response and/or a lack of direct NIR absorption features may be possible reasons for the reduction in the prediction accuracy of other soil properties.
FT-NIR spectroscopy showed good prediction accuracy for EC, OM, and avl. P, Ex. K, Ca, and TN (R2 = 0.71 to 0.84), but poor prediction accuracy for pH, Ex. Mg, Na, texture, CEC, LR, and SiO2 (R2 = 0.25 to 0.69). Notably, FT-NIR with MBL yielded slightly higher accuracy for Ex. K (R2 = 0.72) compared to NIR (R2 = 0.71), although the difference was negligible. The findings of this study demonstrated that NIR spectroscopy outperformed advanced FT-NIR spectroscopy in predicting 16 soil properties, despite their lower spectral resolution, suggesting its potential for routine soil analysis. These findings are consistent with those of Pudełko et al. [53], who reported that NIR hyperspectral imaging yielded better predictive performance for OC than FT-NIR, whereas differences in nitrogen content were negligible. Similarly, NIR and FT-NIR spectroscopy were used to analyze soil samples from a durian orchard, and Micro-NIR showed greater repeatability and reproducibility than FT-NIR [59]. Pandey et al. [60] also conducted a comparative experiment using NIR and FT-NIR spectroscopy to determine the physical and chemical characteristics of stored wheat grains. The author reported that both spectroscopic methods predicted physicochemical properties with reasonable accuracy (R2 = 82.04% to 97.15% for FT-NIR and 81.61% to 98.07% for NIR), with minimal differences between methods.

3.3. Model Performance

Among the five calibration models evaluated, the MBL model performed best in predicting soil properties (Table 2). Although MBL was identified as the best-performing model in this study, this conclusion holds only for the characteristics of the current soil dataset. These results are consistent with Ramirez-Lopez et al. [49], who reported improved predictive performance of soil spectral models when using MBL compared with other commonly applied machine learning algorithms. Similar conclusions have been drawn in other studies. For example, Wang et al. [61] reported that nonlinear memory-based learning and memory-based learning models achieved higher predictive performance for pH, SOM, TN, TP, and TK compared to PLSR, Cubist, RF, SVM, and CNN models when using a regional Vis-NIR spectral library. In another study, the accuracy of soil texture prediction was improved with MBL-coupled reflectance spectroscopy compared to PLSR, SVM, and boosted regression trees (BRT) [62]. Dai et al. [63] also observed that Vis-NIR spectroscopy coupled with MBL outperformed Cubist, PLSR, and RF models for predicting soil organic carbon in wheat-rice rotation fields. Additionally, temporal changes in the soil organic carbon were successfully determined using Vis-NIR spectroscopy coupled with the MBL model [64]. However, SVM and Cubist models outperformed other models for predicting certain soil properties, including pH, EC, and avl. P, clay, and CEC, particularly when using FT-NIR spectroscopy. This superior performance is likely due to their ability to capture complex and nonlinear relationships between soil spectral features and target variables, which a simpler linear model may fail to detect [65]. Similarly, Clingensmith et al. [65] reported that Cubist outperformed PLSR for SOC, pH, CEC, and texture because PLSR could not capture the complex relationships between soil properties and spectra. These findings demonstrate that soil properties exhibiting non-linear spectral relationships, such as CEC arising from mineral-soil interactions, can be better predicted by SVM and Cubist than by simple linear models.
Furthermore, as illustrated in Supplementary Figure S2, residual-versus-predicted scatter plots showed distinct patterns across soil property groups. The residuals were evenly distributed around zero for most soil properties in the medium-class group, indicating unbiased performance within the central range of datasets. However, dispersion and directional bias were observed in the lower and higher classes for certain soil properties, including OM, P2O5, and texture, indicating that model accuracy reduces when predicting soil properties with extremely low or high values. Overall, stratified residual analysis indicated that both NIR and FT-NIR predict soil properties with better performance; however, their prediction accuracy decreased at low and high values, which are not clearly evident in observed-versus-predicted scatter plots.

3.4. Cost Comparison of Spectroscopy

The purchase prices of NIR and FT-NIR spectroscopy instruments may vary across countries due to differences in tax structures and import-export regulations. Cost also varies with spectrometer’s features; however, the instruments purchase cost is not publicly disclosed. In general, FT-NIR spectrometers are more expensive than NIR due to their advanced optical features. For instance, the overall cost of benchtop NIR spectrometers ranges from 15,000 to 60,000 USD, whereas an FT-NIR spectrometer may cost up to 80,000 USD [66]. In the present study, NIR-predicted soil properties achieved higher prediction accuracy across all properties than FT-NIR, suggesting that NIR may be a more cost-effective and suitable option for soil analysis.

3.5. Limitations

The present study compared the performance of NIR and FT-NIR spectroscopy under controlled laboratory conditions for predicting various soil properties. The study indicated that NIR outperformed FT-NIR in laboratory settings. Nevertheless, this study has limitations, including a laboratory-based experiment with a sample size of 567 and a limited range of soil types, which may affect predictive accuracy under field conditions. In a field study, several factors, such as moisture content, temperature, humidity, surface roughness, soil type, crop residues, and particle size, affect the predictive performance of spectroscopy [67,68,69]. Previous work has demonstrated that soil moisture can significantly alter the NIR spectral signature, thereby reducing the accuracy of soil property predictions [70]. Similarly, sample temperature has been shown to affect the accuracy of NIR soil nitrogen predictions, highlighting spectroscopy’s sensitivity to environmental conditions [71]. Consequently, current laboratory results may differ from field conditions. Further research in realistic field settings, accounting for variations in soil moisture, ambient temperature, and humidity, is necessary to assess the robustness and reliability of portable NIR instruments for in situ prediction of soil properties. Moreover, although this study was supported by laboratory analysis, the extent to which spectral signatures alone can reliably predict soil properties remains to be evaluated.

4. Conclusions

This study evaluated the predictive performance of NIR and FT-NIR spectroscopy for sixteen soil properties using Korean soil samples. Among the five models, the MBL consistently achieved the best predictive performance across soil attributes. A study showed that both spectroscopies are effective in predicting soil properties; however, NIR spectroscopy outperformed FT-NIR spectroscopy. Considering individual performance, each instrument showed different predictive performance, with NIR performing best overall. FT-NIR showed slightly better performance for K and TN; the differences compared to NIR were negligible. Despite their limited spectral range and resolution, NIR spectroscopy demonstrated strong predictive potential for various soil properties, offering a cost-effective alternative to advanced technologies, such as FT-NIR, especially in developing countries. However, it is essential to note that the present comparative NIR and FT-NIR performances are limited to the studied dataset. The model’s performance across different soil types, geographical regions, and datasets has not yet been tested and requires confirmation. A future study will compare laboratory and field-based performance and evaluate model transfer approaches across diverse soil types to assess the robustness and generalization of NIR- and FT-NIR-based models.

Supplementary Materials

The following supporting information can be downloaded at https://www.mdpi.com/article/10.3390/app152413240/s1. Table S1: Results of 15-fold cross-validation for predicting soil properties using NIR and FT-NIR spectroscopy. Figure S1: Effect of different K-fold numbers on average coefficient of determination (R2) values of sixteen soil properties. Figure S2: Scatter plots of residual vs. predicted values for sixteen soil properties for NIR and FT-NIR spectroscopy, with each soil characteristic stratified into low, medium, and high categories.

Author Contributions

G.D.V.: conceptualization, methodology, investigation, data curation, writing—original draft. J.-J.Y., J.-H.P., K.K., and H.J.J.: formal analysis, validation, visualization. J.-H.S., S.H.K., A.R., and S.J.: investigation, formal analysis, validation, data curation, visualization, writing—review and editing. S.J.: conceptualization, supervision. All authors have read and agreed to the published version of the manuscript.

Funding

This research was funded by the Rural Development Administration (RDA), South Korea, project number PJ017283.

Institutional Review Board Statement

Not applicable.

Informed Consent Statement

Not applicable.

Data Availability Statement

The data analyzed during this study are available from the corresponding author on reasonable request.

Acknowledgments

The authors greatly acknowledge the Rural Development Administration (RDA) for providing the research facilities.

Conflicts of Interest

The authors declare no conflicts of interest.

References

  1. Otsuka, K. Food Insecurity, Income Inequality, and the Changing Comparative Advantage in World Agriculture. Agric. Econ. 2013, 44, 7–18. [Google Scholar] [CrossRef]
  2. Wegren, S.K.; Elvestad, C. Russia’s Food Self-Sufficiency and Food Security: An Assessment. Post-Communist Econ. 2018, 30, 565–587. [Google Scholar] [CrossRef]
  3. OECD. Agri-Environmental Indicators. Nutrients; Organization for Economic Cooperation and Development: Paris, France, 2020. [Google Scholar]
  4. Lim, J.Y.; Islam Bhuiyan, M.S.; Lee, S.B.; Lee, J.G.; Kim, P.J. Agricultural Nitrogen and Phosphorus Balances of Korea and Japan: Highest Nutrient Surplus among OECD Member Countries. Environ. Pollut. 2021, 286, 117353. [Google Scholar] [CrossRef]
  5. Jeon, S.; Jang, H.J.; Hyun, B.-K.; Jung, K.; Kim, M.S.; Lee, T.-G.; Jung, H.-I.; Lee, J.G.; Ko, B.-G.; Hong, S.-Y.; et al. Soil Management Priorities in Korea. Geoderma Reg. 2022, 29, e00516. [Google Scholar] [CrossRef]
  6. Khan, H.; Farooque, A.A.; Acharya, B.; Abbas, F.; Esau, T.J.; Zaman, Q.U. Delineation of Management Zones for Site-Specific Information about Soil Fertility Characteristics through Proximal Sensing of Potato Fields. Agronomy 2020, 10, 1854. [Google Scholar] [CrossRef]
  7. Roberton, S.D.; Bennett, J.M.; Lobsey, C.R.; Bishop, T.F. Assessing the Sensitivity of Site-Specific Lime and Gypsum Recommendations to Soil Sampling Techniques and Spatial Density of Data Collection in Australian Agriculture: A Pedometric Approach. Agronomy 2020, 10, 1676. [Google Scholar] [CrossRef]
  8. Gioria, M.; Carta, A.; Baskin, C.C.; Dawson, W.; Essl, F.; Kreft, H.; Pergl, J.; van Kleunen, M.; Weigelt, P.; Winter, M.; et al. Persistent Soil Seed Banks Promote Naturalisation and Invasiveness in Flowering Plants. Ecol. Lett. 2021, 24, 1655–1667. [Google Scholar] [CrossRef]
  9. McCarty, G.W.; Reeves, J.B.; Reeves, V.B.; Follett, R.F.; Kimble, J.M. Mid-Infrared and Near-Infrared Diffuse Reflectance Spectroscopy for Soil Carbon Measurement. Soil Sci. Soc. Am. J. 2002, 66, 640–646. [Google Scholar] [CrossRef]
  10. Cozzolino, D.; Morón, A. Potential of Near-Infrared Reflectance Spectroscopy and Chemometrics to Predict Soil Organic Carbon Fractions. Soil Tillage Res. 2006, 85, 78–85. [Google Scholar] [CrossRef]
  11. Jeon, S.H.; Jang, H.J.; Ng, W.; Minasny, B.; Kim, S.H.; Shim, J.H.; Roh, A.; ik Kwon, S.; Yun, J.J. Predicting Soil Properties for Fertiliser Recommendation in South Korea Using MIR Spectroscopy. Geoderma Reg. 2024, 39, e00901. [Google Scholar] [CrossRef]
  12. Piccini, C.; Metzger, K.; Debaene, G.; Stenberg, B.; Götzinger, S.; Borůvka, L.; Sandén, T.; Bragazza, L.; Liebisch, F. In-Field Soil Spectroscopy in Vis-NIR Range for Fast and Reliable Soil Analysis: A Review. Eur. J. Soil Sci. 2024, 75, e13481. [Google Scholar] [CrossRef]
  13. Viscarra Rossel, R.A.; Behrens, T.; Ben-Dor, E.; Chabrillat, S.; Alexandre, J.; Demattê, M.; Ge, Y.; Gomez, C.; Guerrero, C.; Peng, Y.; et al. Diffuse Reflectance Spectroscopy for Estimating Soil Properties: A Technology for the 21st Century. Eur. J. Soil Sci. 2022, 73, e13271. [Google Scholar] [CrossRef]
  14. Ciurczak, E.W. Principles of near-infrared spectroscopy. Pract. Spectrosc. Ser. 2001, 27, 7–18. [Google Scholar]
  15. Gullifa, G.; Barone, L.; Papa, E.; Giuffrida, A.; Materazzi, S.; Risoluti, R. Portable NIR Spectroscopy: The Route to Green Analytical Chemistry. Front. Chem. 2023, 11, 1214825. [Google Scholar] [CrossRef]
  16. Rossel, R.A.; Walvoort, D.J.J.; McBratney, A.B.; Janik, L.J.; Skjemstad, J.O. Visible, near Infrared, Mid Infrared or Combined Diffuse Reflectance Spectroscopy for Simultaneous Assessment of Various Soil Properties. Geoderma 2006, 131, 59–75. [Google Scholar] [CrossRef]
  17. He, Y.; Song, H.Y.; Pereira, A.G.; Gómez, A.H. Measurement and Analysis of Soil Nitrogen and Organic Matter Content Using Near-Infrared Spectroscopy Techniques. J. Zhejiang Univ. Sci. B 2005, 6, 1081. [Google Scholar] [CrossRef]
  18. Barthès, B.G.; Brunet, D.; Ferrer, H.; Chotte, J.L.; Feller, C. Determination of Total Carbon and Nitrogen Content in a Range of Tropical Soils Using near Infrared Spectroscopy: Influence of Replication and Sample Grinding and Drying. J. Near Infrared Spectrosc. 2006, 14, 341–348. [Google Scholar] [CrossRef]
  19. Kawamura, S.; Arakawa, M.; Funatsu, K. Development of Genetic Algorithm-Based Wavelength Regional Selection Technique. J. Comput. Aided Chem. 2006, 7, 10–17. [Google Scholar] [CrossRef][Green Version]
  20. Brunet, D.; Barthès, B.G.; Chotte, J.L.; Feller, C. Determination of Carbon and Nitrogen Contents in Alfisols, Oxisols and Ultisols from Africa and Brazil Using NIRS Analysis: Effects of Sample Grinding and Set Heterogeneity. Geoderma 2007, 139, 106–117. [Google Scholar] [CrossRef]
  21. Barthès, B.G.; Brunet, D.; Hien, E.; Enjalric, F.; Conche, S.; Freschet, G.T.; d’Annunzio, R.; Toucet-Louri, J. Determining the Distributions of Soil Carbon and Nitrogen in Particle Size Fractions Using Near-Infrared Reflectance Spectrum of Bulk Soil Samples. Soil Biol. Biochem. 2008, 40, 1533–1537. [Google Scholar] [CrossRef]
  22. Ando, M.; Arakawa, M.; Funatsu, K. Prediction Models for Soil Properties Using VIS-NIR Spectroscopy. J. Comput. Aided Chem. 2009, 10, 53–62. [Google Scholar] [CrossRef]
  23. Mohamed, E.S.; Saleh, A.M.; Belal, A.B.; Gad, A.A. Application of Near-Infrared Reflectance for Quantitative Assessment of Soil Properties. Egypt. J. Remote Sens. Space Sci. 2018, 21, 1–14. [Google Scholar] [CrossRef]
  24. Ramírez, P.B.; Calderón, F.J.; Jastrow, J.D.; Ping, C.L.; Matamala, R. Applying NIR and MIR Spectroscopy for C and Soil Property Prediction in Northern Cold-Region Ecosystems. Which Approach Works Better? Geoderma Reg. 2023, 32, e00617. [Google Scholar] [CrossRef]
  25. Carvalho, J.K.; Moura-Bueno, J.M.; Ramon, R.; Almeida, T.F.; Naibo, G.; Martins, A.P.; Santos, L.S.; Gianello, C.; Tiecher, T. Combining Different Pre-Processing and Multivariate Methods for Prediction of Soil Organic Matter by near Infrared Spectroscopy (NIRS) in Southern Brazil. Geoderma Reg. 2022, 29, e00530. [Google Scholar] [CrossRef]
  26. Amin, I.; Fikrat, F.; Mammadov, E.; Babayev, M. Soil Organic Carbon Prediction by Vis-NIR Spectroscopy: Case Study the Kur-Aras Plain, Azerbaijan. Commun. Soil Sci. Plant Anal. 2020, 51, 726–734. [Google Scholar] [CrossRef]
  27. Seema; Ghosh, A.K.; Das, B.S.; Reddy, N. Application of VIS-NIR Spectroscopy for Estimation of Soil Organic Carbon Using Different Spectral Preprocessing Techniques and Multivariate Methods in the Middle Indo-Gangetic Plains of India. Geoderma Reg. 2020, 23, e00349. [Google Scholar] [CrossRef]
  28. Ludwig, B.; Murugan, R.; Parama, V.R.R.; Vohland, M. Use of Different Chemometric Approaches for an Estimation of Soil Properties at Field Scale with near Infrared Spectroscopy. J. Plant Nutr. Soil Sci. 2018, 181, 704–713. [Google Scholar] [CrossRef]
  29. Knadel, M.; Stenberg, B.; Deng, F.; Thomsen, A.; Greve, M.H. Comparing Predictive Abilities of Three Visible-Near Infrared Spectrophotometers for Soil Organic Carbon and Clay Determination. J. Near Infrared Spectrosc. 2013, 21, 67–80. [Google Scholar] [CrossRef]
  30. Cabassi, G.; Cavalli, D.; Fuccella, R.; Marino Gallina, P. Evaluation of Four NIR Spectrometers in the Analysis of Cattle Slurry. Biosyst. Eng. 2015, 133, 1–13. [Google Scholar] [CrossRef]
  31. Armstrong, P.R.; Maghirang, E.B.; Xie, F.; Dowell, F.E. Comparison of dispersive and fourier-transform nir instruments for measuring grain and flour attributes. Appl. Eng. Agric. 2006, 22, 453–457. [Google Scholar] [CrossRef]
  32. Shen, Z.; D’Agui, H.; Walden, L.; Zhang, M.; Yiu, T.M.; Dixon, K.; Nevill, P.; Cross, A.; Matangulu, M.; Hu, Y.; et al. Miniaturised Visible and Near-Infrared Spectrometers for Assessing Soil Health Indicators in Mine Site Rehabilitation. Soil 2022, 8, 467–486. [Google Scholar] [CrossRef]
  33. National Academy of Agricultural Science. Methods of Soil Analysis; RDA: Suwon, Republic of Korea, 2010. [Google Scholar]
  34. Cox, M.S. The Lancaster Soil Test Method as an Alternative to the Mehlich 3 Soil Test Method. Soil Sci. 2001, 166, 484–489. [Google Scholar] [CrossRef]
  35. Rinnan, Å.; van den Berg, F.; Engelsen, S.B. Review of the Most Common Pre-Processing Techniques for near-Infrared Spectra. TrAC Trends Anal. Chem. 2009, 28, 1201–1222. [Google Scholar] [CrossRef]
  36. Ng, W.; Husnain; Anggria, L.; Siregar, A.F.; Hartatik, W.; Sulaeman, Y.; Jones, E.; Minasny, B. Developing a Soil Spectral Library Using a Low-Cost NIR Spectrometer for Precision Fertilization in Indonesia. Geoderma Reg. 2020, 22, e00319. [Google Scholar] [CrossRef]
  37. Wadoux, A.M.J.-C.; Malone, B.; Minasny, B.; Fajardo, M.; McBratney, A.B. Soil Spectral Inference with R; Springer: Cham, Switzerland, 2021. [Google Scholar] [CrossRef]
  38. Shin, S.K.; Lee, S.J.; Park, J.H. Prediction of Soil Properties Using Vis-NIR Spectroscopy Combined with Machine Learning: A Review. Sensors 2025, 25, 5045. [Google Scholar] [CrossRef]
  39. Zhu, J.; Jin, Y.; Zhu, W.; Lee, D.K. VIS-NIR Spectroscopy and Environmental Factors Coupled with PLSR Models to Predict Soil Organic Carbon and Nitrogen. Int. Soil Water Conserv. Res. 2024, 12, 844–854. [Google Scholar] [CrossRef]
  40. Ding, Z.D.; Sun, Z.; Xie, Y.H.; Qiao, J.J.; Liang, R.T.; Chen, X.; Hussain, K.; Sun, Y.J. Optimizing Crown Density and Volume Estimation across Two Coniferous Forest Types in Southern China via Boruta and Cubist Methods. J. Plant Ecol. 2024, 17, rtae039. [Google Scholar] [CrossRef]
  41. Wang, Y.; Yan, X.; Huo, R.; Zhao, L.; Peng, J.; Hong, Y.; Liu, J. Predicting Soil Organic Matter Using Corrected Field Spectra and Stacking Ensemble Learning. Geoderma 2025, 460, 117417. [Google Scholar] [CrossRef]
  42. Purushothaman, N.K.; Swan, T.; Singh, K.; Fidelis, C.; Majeed, I.; Yinil, D.; Minasny, B.; Das, B.S.; Field, D.J. Diffuse Reflectance Spectroscopy for Soil Testing Under Different Soil Nutrient Management in Cocoa Production Systems. Soil Use Manag. 2025, 41, e70094. [Google Scholar] [CrossRef]
  43. Kuhn, M.; Weston, S.; Keefer, C.; Kuhn, M.M. Package ‘Cubist’: Rule- and Instance-Based Regression Modeling; R Package Version 0.4.1; R Foundation for Statistical Computing: Vienna, Austria, 2023. [Google Scholar]
  44. Cortes, C.; Vapnik, V. Support-Vector Networks. Mach. Learn. 1995, 20, 273–297. [Google Scholar] [CrossRef]
  45. Huang, Y.; Jiang, H.; Wang, W.F.; Wang, W.; Sun, D. Soil Moisture Content Prediction Model for Tea Plantations Based on SVM Optimised by the Bald Eagle Search Algorithm. Cogn. Comput. Syst. 2021, 3, 351–360. [Google Scholar] [CrossRef]
  46. Meyer, D.; Dimitriadou, E.; Hornik, K.; Weingessel, A.; Leisch, F.; Chang, C.C.; Lin, C.C. e1071: Misc Functions of the Department of Statistics, Probability Theory Group (Formerly: E1071), TU Wien; R Package Version 1.7-1; R Foundation for Statistical Computing: Vienna, Austria, 2019. [Google Scholar]
  47. Chen, J.H.; Wang, X.L.; Lei, F. Data-Driven Multinomial Random Forest: A New Random Forest Variant with Strong Consistency. J. Big Data 2024, 11, 34. [Google Scholar] [CrossRef]
  48. Breiman, L. Random Forests. Mach. Learn. 2001, 45, 5–32. [Google Scholar] [CrossRef]
  49. Ramirez-Lopez, L.; Behrens, T.; Schmidt, K.; Stevens, A.; Demattê, J.A.M.; Scholten, T. The Spectrum-Based Learner: A New Local Approach for Modeling Soil Vis–NIR Spectra of Complex Datasets. Geoderma 2013, 195–196, 268–279. [Google Scholar] [CrossRef]
  50. An, A. Classification Methods. In Encyclopedia of Data Warehousing and Mining; Wang, J., Ed.; IGI Global Scientific Publishing: Hershey, PA, USA, 2005; pp. 144–149. [Google Scholar] [CrossRef]
  51. Ramirez-Lopez, L.; Wadoux, A.M.J.C.; Franceschini, M.H.D.; Terra, F.S.; Marques, K.P.P.; Sayão, V.M.; Demattê, J.A.M. Robust Soil Mapping at the Farm Scale with Vis–NIR Spectroscopy. Eur. J. Soil Sci. 2019, 70, 378–393. [Google Scholar] [CrossRef]
  52. Kim, A.-R.; Ku, H.-H. Comparative Evaluation of Soil Organic Matter Determination Using Tyurin and Dry Combustion Methods in Three Soil Types in Korea. J. Humanimal Sci. 2025, 1, 77–83. [Google Scholar] [CrossRef]
  53. Pudełko, A.; Chodak, M.; Roemer, J.; Uhl, T. Application of FT-NIR Spectroscopy and NIR Hyperspectral Imaging to Predict Nitrogen and Organic Carbon Contents in Mine Soils. Meas. J. Int. Meas. Confed. 2020, 164, 108117. [Google Scholar] [CrossRef]
  54. Santasup, N.; Theanjumpol, P.; Santasup, C.; Kittiwachana, S.; Mawan, N.; Prantong, L.; Khongdee, N. Development of Near-Infrared Spectroscopy (NIRS) for Estimating Organic Matter, Total Carbon, and Total Nitrogen in Agricultural Soil. MethodsX 2024, 13, 102798. [Google Scholar] [CrossRef] [PubMed]
  55. Chang, C.-W.; Laird, D.A.; Mausbach, M.J.; Hurburgh, C.R. Near-Infrared Reflectance Spectroscopy–Principal Components Regression Analyses of Soil Properties. Soil Sci. Soc. Am. J. 2001, 65, 480–490. [Google Scholar] [CrossRef]
  56. McBride, M.B. Estimating Soil Chemical Properties by Diffuse Reflectance Spectroscopy: Promise versus Reality. Eur. J. Soil Sci. 2022, 73, e13192. [Google Scholar] [CrossRef]
  57. Pirie, A.; Singh, B.; Islam, K. Ultra-Violet, Visible, near-Infrared, and Mid-Infrared Diffuse Reflectance Spectroscopic Techniques to Predict Several Soil Properties. Soil Res. 2005, 43, 713–721. [Google Scholar] [CrossRef]
  58. Pinheiro, É.F.M.; Ceddia, M.B.; Clingensmith, C.M.; Grunwald, S.; Vasques, G.M. Prediction of Soil Physical and Chemical Properties by Visible and Near-Infrared Diffuse Reflectance Spectroscopy in the Central Amazon. Remote Sens. 2017, 9, 293. [Google Scholar] [CrossRef]
  59. Phanomsophon, T.; Sirisomboon, P. Precision Test for Scanning of Soil in Durian Orchard Using Near-Infrared Spectroscopy. IOP Conf. Ser. Earth Environ. Sci. 2019, 301, 012070. [Google Scholar] [CrossRef]
  60. Pandey, P.; Srivastava, S.; Mishra, H.N. Comparison of FT-NIR and NIR for Evaluation of Phyisco-Chemical Properties of Stored Wheat Grains. Food Qual. Saf. 2018, 2, 165–172. [Google Scholar] [CrossRef]
  61. Wang, Z.; Chen, S.; Lu, R.; Zhang, X.; Ma, Y.; Shi, Z. Non-Linear Memory-Based Learning for Predicting Soil Properties Using a Regional Vis-NIR Spectral Library. Geoderma 2024, 441, 116752. [Google Scholar] [CrossRef]
  62. Gholizadeh, A.; Borůvka, L.; Borůvka, B.; Saberioon, M.; Vašát, R.; Alexandre, J.; Demattê, M.; Baghdadi, N.; Thenkabail, P.S. A Memory-Based Learning Approach as Compared to Other Data Mining Algorithms for the Prediction of Soil Texture Using Diffuse Reflectance Spectra. Remote Sens. 2016, 8, 341. [Google Scholar] [CrossRef]
  63. Dai, L.; Xue, J.; Lu, R.; Wang, Z.; Chen, Z.; Yu, Q.; Shi, Z.; Chen, S. In-Situ Prediction of Soil Organic Carbon Contents in Wheat-Rice Rotation Fields via Visible near-Infrared Spectroscopy. Soil Environ. Health 2024, 2, 100113. [Google Scholar] [CrossRef]
  64. Barbetti, R.; Palazzi, F.; Chiarabaglio, P.M.; Fondon, C.L.; Rizza, D.; Rocci, A.; Grignani, C.; Zavattaro, L.; Moretti, B.; Fantappiè, M.; et al. Can Soil Organic Carbon in Long-Term Experiments Be Detected Using Vis-NIR Spectroscopy? IEEE Trans. AgriFood Electron. 2024, 3, 43–48. [Google Scholar] [CrossRef]
  65. Clingensmith, C.M.; Grunwald, S. Predicting Soil Properties and Interpreting Vis-NIR Models from across Continental United States. Sensors 2022, 22, 3187. [Google Scholar] [CrossRef]
  66. The Best NIR Systems: A Buyer’s Guide to Price and Features. Available online: https://www.labx.com/resources/the-best-nir-systems-a-buyers-guide-to-price-and-features/4960?utm (accessed on 18 September 2025).
  67. Metzger, K.; Liebisch, F.; Herrera, J.M.; Guillaume, T.; Bragazza, L. Prediction Accuracy of Soil Chemical Parameters by Field- and Laboratory-Obtained Vis-NIR Spectra after External Parameter Orthogonalization. Sensors 2024, 24, 3556. [Google Scholar] [CrossRef]
  68. Park, S.; Jeon, S.; Kwon, N.H.; Kwon, M.; Shin, J.H.; Kim, W.C.; Lee, J.G. Application of Near-Infrared Spectroscopy to Predict Chemical Properties in Clay Rich Soil: A Review. Eur. J. Agron. 2024, 159, 127228. [Google Scholar] [CrossRef]
  69. Kok, M.; Sarjant, S.; Verweij, S.; Vaessen, S.F.C.; Ros, G.H. On-Site Soil Analysis: A Novel Approach Combining NIR Spectroscopy, Remote Sensing and Deep Learning. Geoderma 2024, 446, 116903. [Google Scholar] [CrossRef]
  70. Xie, A.; Wu, W. Evaluating the Impact of Soil Moisture Variation on the Performance of Visible and Near-Infrared (Vis-NIR) Spectroscopy for Predicting Soil Organic Carbon Content. Environ. Monit. Assess. 2025, 197, 1221. [Google Scholar] [CrossRef]
  71. Zhou, L.; Yao, J.; Xu, H.; Zhang, Y.; Nie, P. Research on the Effects of Drying Temperature for the Detection of Soil Nitrogen by Near-Infrared Spectroscopy. Molecules 2023, 28, 6507. [Google Scholar] [CrossRef]
Figure 1. Location of soil samples collected with different land use. Figure adopted from Jeon et al. [11], Geoderma Regional, licensed under a Creative Commons (CC) BY 4.0.
Applsci 15 13240 g001
Figure 2. Scatter plots of measured vs. predicted values for sixteen soil properties using NIR and FT-NIR spectroscopy. In each scatter plot, the line presented is referred to as the 1:1 line.
Applsci 15 13240 g002
Table 1. Descriptive statistical summary of soil properties. Table modified from Jeon et al. [11], Geoderma Regional, licensed under a Creative Commons (CC) BY 4.0.
Soil ParametersSample NumberMin.MeanMedianMax
pH5673.76.56.58.8
EC (dS m−1)5670.12.00.723.2
OM-Tyurin (g kg−1)5671.227.623.6115.3
OM-CN (g kg−1)5611.831.225.5130.2
P2O5 (mg kg−1)5679.3554.1376.34031.9
Ex. K (cmol kg−1)5670.12.00.59.8
Ex. Ca (cmol kg−1)5670.89.47.231.3
Ex. Mg (cmol kg−1)5670.23.42.015.6
Na (cmol kg−1)5670.00.40.27.5
TN-CN (%)5610.01.20.20.9
Sand (%)5672.346.248.481.5
Silt (%)5670.938.335.779.6
Clay (%)5673.315.614.941.7
CEC (cmol kg−1)5532.612.611.934.5
LR (10 t ha−1)5670.0175.90.01247.5
SiO2 (mg kg−1)51130.2203.4164.71147.1
Table 2. The results of 15-fold cross-validation for soil properties prediction.
Soil PropertiesSpectrometerUnitsR2RMSERPDBiasBest Model
pHNIR 0.560.591.490.00PLSR
FT-NIR0.490.631.410.00SVM
ECNIRdS m−10.841.342.500.09MBL
FT-NIR0.801.492.24−0.01Cubist
OM-TyurinNIRg kg−10.827.312.320.30MBL
FT-NIR0.807.682.210.19MBL
OM-CNNIRg kg−10.848.072.500.13MBL
FT-NIR0.838.402.400.40MBL
P2O5NIRmg kg−10.77274.512.0923.47MBL
FT-NIR0.73300.061.91−0.44Cubist
Ex. KNIRcmol kg−10.710.681.820.09MBL
FT-NIR0.720.661.900.07MBL
Ex. CaNIRcmol kg−10.752.431.990.08MBL
FT-NIR0.712.601.860.07MBL
Ex. MgNIRcmol kg−10.721.011.880.03MBL
FT-NIR0.691.071.770.07MBL
NaNIRcmol kg−10.570.441.450.08MBL
FT-NIR0.540.451.430.05MBL
TN-CNNIR%0.840.052.490.00MBL
FT-NIR0.840.052.490.00MBL
SandNIR%0.6711.291.70−0.62MBL
FT-NIR0.6511.581.66−0.61MBL
SiltNIR%0.649.501.630.15MBL
FT-NIR0.619.811.570.33MBL
ClayNIR%0.633.801.63−0.12Cubist
FT-NIR0.564.081.52−0.01SVM
CECNIRcmol kg−10.762.372.020.03MBL
FT-NIR0.652.811.70−0.08SVM
LRNIR10 t ha−10.31207.081.1616.64MBL
FT-NIR0.25217.511.1129.01MBL
SiO2NIRmg kg−10.24133.341.12−19.46Cubist
FT-NIR0.27131.141.143.25PLSR
Note: R2—coefficient of determination, RMSE—root mean square error, RPD—residual predictive deviation. Values highlighted in bold indicate the best-performing model and spectroscopic method for each soil property.
Disclaimer/Publisher’s Note: The statements, opinions and data contained in all publications are solely those of the individual author(s) and contributor(s) and not of MDPI and/or the editor(s). MDPI and/or the editor(s) disclaim responsibility for any injury to people or property resulting from any ideas, methods, instructions or products referred to in the content.