Abstract
Packed granular materials absorb sound. In previous studies, granular materials sized a few millimeters and samples of grain size as a powder were studied; however, the grain sizes in between have not been addressed. In this study, the sound absorption coefficients of materials ranging from granular materials with a grain size d = 4 mm to powder materials with d = 0.05 mm were analyzed theoretically and experimentally. In addition, five packing types were studied: four types of regular packing and random packing. For these packing structures, the propagation constants and characteristic impedances were substituted within a one-dimensional transfer matrix for sound wave propagation, from which the normal-incidence sound absorption coefficient was calculated. Furthermore, our analysis accounted for particle longitudinal vibrations due to sound pressure. According to analyses of cross-sectional CT images considering tortuosity, the theoretical values for random packing tended to be close to the experimental values for d = 0.8 mm and smaller. For random packing structures with d = 0.3 mm or smaller, the experimental values were closer to the theoretical values for simple cubic lattice than the theoretical values for random packing.
1. Introduction
Packed granular materials absorb sound. For example, low-noise pavements [1,2], ballasted tracks [3], zeolite-packed sound-absorbing structures [4], and mats packed with silica gel granular material for acoustic equipment [5] are used to reduce noise. The primary mechanism of sound absorption in these materials involves the attenuation of acoustic energy through viscous friction within the velocity boundary layer near the walls of the granular material when sound waves are incident to the packed structure. Packed granular materials with continuous pores exhibit acoustic properties based on the same principle as those of porous sound-absorbing materials. These properties are strongly influenced by the packing structure, grain size, grain shape, and associated void volume. Therefore, from an engineering perspective, the computational prediction of the acoustic properties of packed granular materials is useful.
Extensive research has explored the sound absorption properties of packed granular structures. Previous works include experimental studies on the sound absorption properties of various granular materials [6], the sound absorption properties of recycled rubber powder [7,8,9] and granular cork [10], and the acoustic properties of loosely packed granular structures [11,12]; prediction of the acoustic properties of face-centered cubic structures [13]; numerical analysis of regular packing structures using commercial software [14]; and studies on the sound absorption properties of random close packing [15]. Moreover, research has explored metamaterial absorbers with structures where the cross-sectional shape of the voids varies periodically [16,17,18,19].
Previous studies related to the current research include theoretical analyses of the sound absorption coefficients of powder layers [20], fundamental studies on sound absorption by gaps in hexagonal close-packed and face-centered cubic lattices [21], and theoretical analyses of random packing using microcomputed tomography (CT) images [22]. In previous studies, granular materials sized a few millimeters were studied for viscous sound absorption in boundary layers [21,22]. On the other hand, powders with a grain size of d = 120 µm or smaller were studied for sound absorption via longitudinal vibration [20]. However, the grain sizes in between have not been addressed. Therefore, it is valuable to verify whether the same theoretical estimation is generalizable over a wide range of particle sizes to determine its applicability and validity.
In this study, the sound absorption coefficients of materials spanning from coarse granules (d = 4 mm) to fine powders (d = 0.05 mm) were analyzed theoretically and experimentally. In addition, five packing types were explored: four types of regular packing (hexagonal close-packed, face-centered cubic lattice, hexagonal lattice, and simple cubic lattice structures) and random packing.
Sound absorption coefficients were measured for the hexagonal and simple cubic lattices with grain sizes of 8 and 4 mm. For the 4 mm granules to the 0.05 mm powders, the sound absorption coefficient was measured for random packing. A two-microphone impedance tube was used to determine the normal-incidence sound absorption coefficient.
The theoretical analysis covered the regular and random packing structures. The model of each regular packing structure was divided into the smallest analysis units, which were then divided into 100 units in the direction of the sound waves. For random packing, micro-CT cross-sectional images were used as analysis units. In each unit, the surface area of the wall and the volume of the void were approximated as the clearance between two parallel planes, enabling the calculation of the propagation constant and characteristic impedance in the void. These parameters, determined using the effective density with the measured tortuosity applied, were then substituted into a one-dimensional transfer matrix for sound wave propagation, and the normal-incidence sound absorption coefficient was calculated using the transfer matrix method. Furthermore, the longitudinal vibration of the particles due to sound pressure was accounted for by particles with diameters of 0.3 mm or smaller, where sound absorption due to the longitudinal vibration of the granular material was observed.
The theoretical values for the regular and random packing structures were compared with experimental values.
2. Sound Absorption Coefficient Samples
The sound absorption coefficients were measured for the hexagonal lattice, simple cubic lattice, and random packing structures. The measurement samples are shown in Figure 1, Figure 2 and Figure 3, and their specifications are in Table 1. Stainless steel spheres with grain sizes of 8 and 4 mm, respectively, were utilized as the hexagonal and simple cubic lattice samples (Figure 1 and Figure 2, respectively). For random packing, glass beads with grain sizes of 4, 2, 1, 0.8, 0.6, 0.5, 0.4, 0.3, 0.2, 0.1, and 0.05 mm were used. Three random packing samples with grain sizes of 4, 1, and 0.05 mm are shown in Figure 3.
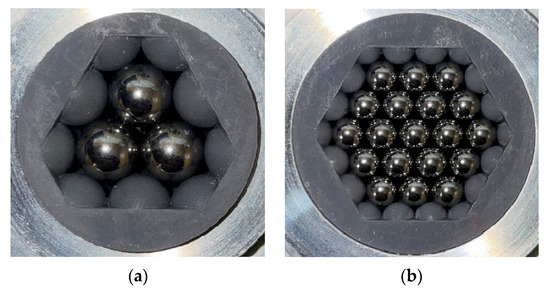
Figure 1.
Test sample (hexagonal lattice) with different grain sizes d: (a) d = 8 mm; (b) d = 4 mm.
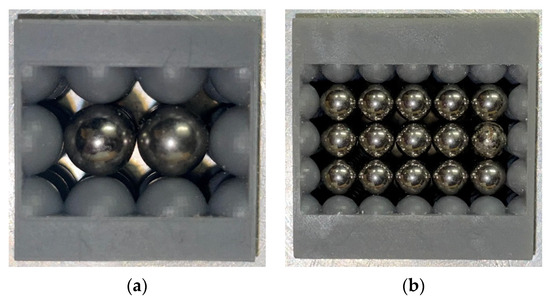
Figure 2.
Test sample (simple cubic lattice): (a) d = 8 mm; (b) d = 4 mm.
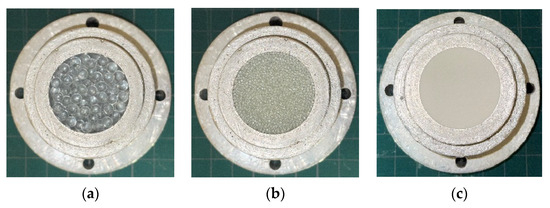
Figure 3.
Test sample (random packing): (a) d = 4 mm; (b) d = 1 mm; (c) d = 0.05 mm.

Table 1.
Specifications of test samples.
For the regular packing structures, the granules were regularly arranged using a special specimen holder. The wall surface of this sample holder had regularly arranged hemispherical convexities, and the regular packing structures were formed by placing the granular material in the corresponding positions. The specimen holder was made using light-cured resin and a Formlabs Form2 optical 3D printer. For the random packing tests, an aluminum alloy sample tube with a 29 mm inner diameter was packed with glass beads. The normal-incidence sound absorption coefficient was then measured using a Brüel & Kjær, Narum, Denmark, Type 4206 two-microphone impedance tube.
3. Tortuosity Measurement Results
The tortuosities of the hexagonal lattice, simple cubic lattice, and random packing structures were measured experimentally using ultrasonic sensors. The tortuosity derivation method and measurement apparatus are detailed in previous reports [21,22]. Tortuosity α∞ was determined from the sound velocity c0 in air and the apparent sound velocity c in the packing structure, as expressed by Equation (1) [23].
Figure 4a–g show the tortuosity measurements for a hexagonal lattice sample, a simple cubic lattice sample, and random packing samples of several grain sizes. The y-intercept of an approximate straight line is the tortuosity α∞ of each packing structure. As reported previously [21,22], α∞ = 1.44 for a hexagonal close-packed structure with d = 4 mm, α∞ = 1.43 for a face-centered cubic lattice with d = 4 mm, and α∞ = 1.45 for a random packing structure with d = 2 mm. Accounting for these tortuosities brings the theoretical values closer to the experimental values.
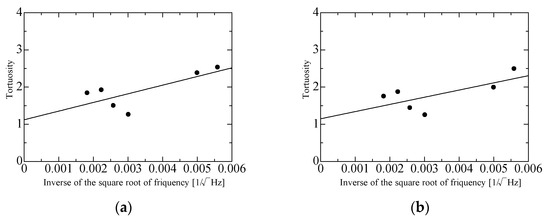
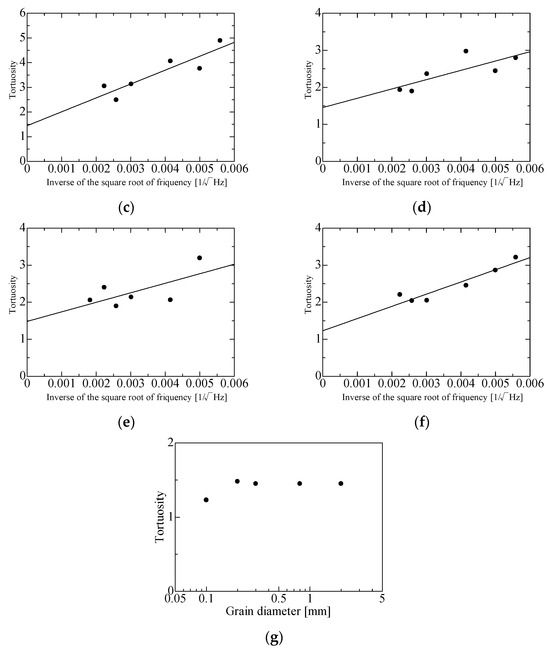
Figure 4.
Measured tortuosity α∞: (a) α∞ = 1.12, hexagonal lattice; (b) α∞ = 1.14, simple cubic lattice; (c) α∞ = 1.45, random packing, d = 0.8 mm; (d) α∞ = 1.45, random packing, d = 0.3 mm; (e) α∞ = 1.48, random packing, d = 0.2 mm; (f) α∞ = 1.23, random packing, d = 0.1 mm; (g) result summary for random packing.
Figure 4g is a summary of the tortuosity results for the random packing samples with d = 2, 0.8, 0.3, 0.2, 0.1 mm. According to a previous study [15], “all the tortuosities are constant with the particle diameter. The average values for these constant tortuosities are α∞ = 1.437” [15]. In Figure 4g, the tortuosities of the random packing samples of varying grain sizes are concentrated around α∞ = 1.45, which is close to the previously reported value of 1.437 [15]. Therefore, α∞ = 1.45 at d = 2 mm [22] was used in this paper. (In Figure 4f, α∞ = 1.23 at d = 0.1 mm, but the low signal-to-noise [S/N] ratio of the measurement made it unreliable. Furthermore, the α∞ value for random packing with d = 0.05 mm was not measurable due to the low S/N ratio.)
4. Overview of Theoretical Analysis
The theoretical analysis procedure for the regular packing structure is detailed in previous reports [21,24,25]. This analysis was conducted using the transfer matrix method based on the one-dimensional wave equation for the gaps in the granular packing structure. The analysis units for the regular packing structures are shown in Figure 5. The cross-sectional shape of each regular packing structure changed periodically in the plane perpendicular to the x-axis direction (direction of sound wave incidence). The analysis unit was the range where the cross-sectional shape changed in a single period. Similarly, in the y- and z-axis directions, the analysis unit was the area where the cross-sectional shape changed for one cycle.
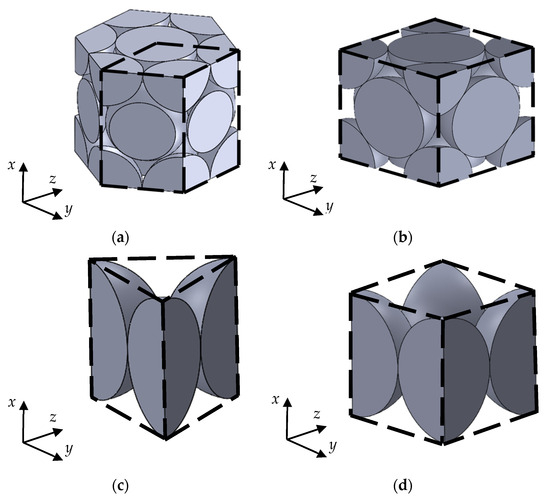
Figure 5.
Analysis unit per regular packing structure: (a) hexagonal close-packed; (b) face-centered cubic; (c) hexagonal lattice; (d) simple cubic lattice.
Figure 6a,b show the outlines of the approximation used in the theoretical analysis [21,24,25]. The analysis unit was divided into 100 units perpendicular to the incident sound waves, as shown in Figure 6a. Each divided unit was approximated as the clearance between two planes having the same length l in the x-direction, the same void volume Vn, and the same wall surface area Sn, as shown in Figure 6b. The clearance bn between the two planes was calculated using Equation (2). The sound absorption coefficient was then evaluated assuming the sound waves propagate through the clearance.
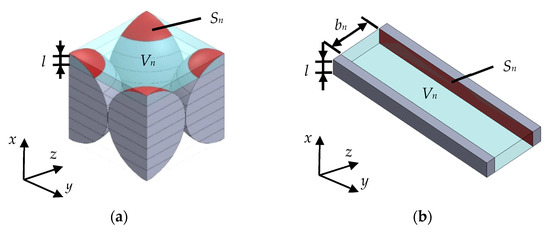
Figure 6.
(a) Divided analysis unit; (b) approximation of the clearance between two planes.
The theoretical analysis procedure for random packing is detailed in a previous report [22]. In random packing, a mathematical model is difficult to construct because of the irregular arrangement of the granular material. Therefore, the theoretical analysis of the random packing samples was performed using CT images of a range of rectangular bodies. These bodies were imaged such that they were sliced in a plane perpendicular to the direction of sound wave incidence (x direction). The number of images used was 4000 for d = 0.5 mm, 10,000 for d = 0.2 mm, and 40,000 for d = 0.05 mm for an x direction of 20 mm, for example. Pitch l in the x direction of the images was 5 µm for d = 0.5 mm, 2 µm for d = 0.2 mm, and 0.5 µm for d = 0.05 mm. Therefore, the diameter at each grain size was divided by n = 100, as in the case of regular packing.
In addition to the abovementioned analysis, which considered sound wave attenuation due to boundary layer viscosity, this study considered sound absorption due to longitudinal vibrations of the particles for d = 0.3 mm and smaller. The analysis method is also detailed in previous reports [20].
5. Comparison of Experimental and Theoretical Values
5.1. Comparison of Experimental and Theoretical Values for Regular Packing Structures
In this section, the experimental and theoretical values of the normal-incident sound absorption coefficient are compared for samples with different packing structures and grain sizes. First, the validity of the experimentally determined tortuosity was examined for the case of regular packing structures. Figure 7a,b and Figure 8a,b show the comparisons for the hexagonal lattice and the simple cubic lattice, respectively, for d = 8 mm and d = 4 mm.

Figure 7.
Comparison of theoretical and experimental values for hexagonal lattice with sample length l = 24 mm: (a) d = 8 mm, aperture ratio: 0.54; (b) d = 4 mm, aperture ratio: 0.57.

Figure 8.
Comparison of theoretical and experimental values for simple cubic lattice with sample length l = 24 mm: (a) d = 8 mm, aperture ratio: 0.58; (b) d = 4 mm, aperture ratio: 0.58.
First, the experimental values are compared with the theoretical values without considering tortuosity. In all cases in Figure 7 and Figure 8, the theoretical values consistently shifted toward higher frequencies compared with the peak frequencies of the experimental values. In all cases, the theoretical values had lower peak sound absorption values than the experimental values.
As for the theoretical values considering tortuosity, in all cases in Figure 7 and Figure 8, the peak frequencies decrease and the peak sound absorption values increase as tortuosity increases. The decrease in the peak frequencies in the theoretical values may be because an increase in tortuosity corresponds to an increase in the apparent sample length. The peak frequency and peak value of the sound absorption coefficient vary with sample thickness, apparent sound velocity, and tortuosity. As per the relationship [26] first absorption peak frequency = sound velocity/(4 × sample length), for a sample thickness of 24 mm and sound velocity of 340 m/s, the first absorption peak frequency is approximately 3550 Hz. In practice, the absorption peak appears at a lower frequency because the apparent sound velocity decreases owing to tortuosity and the viscosity of the boundary layer near the solid wall surface. The difference between the theoretical and experimental values decrease when tortuosity is taken into account. Therefore, the measured tortuosity values of 1.12 and 1.14 for the hexagonal and simple cubic lattices, respectively, are reasonable.
5.2. Comparison of Experimental Values for Random Packing and Theoretical Values for Each Packing Structure
In this section, the experimental values of the normal-incident sound absorption coefficient for random packing with varying grain sizes are compared with the theoretical values for each packing structure. Figure 9a–k show a comparison of the experimental and theoretical values for d = 4–0.05 mm.
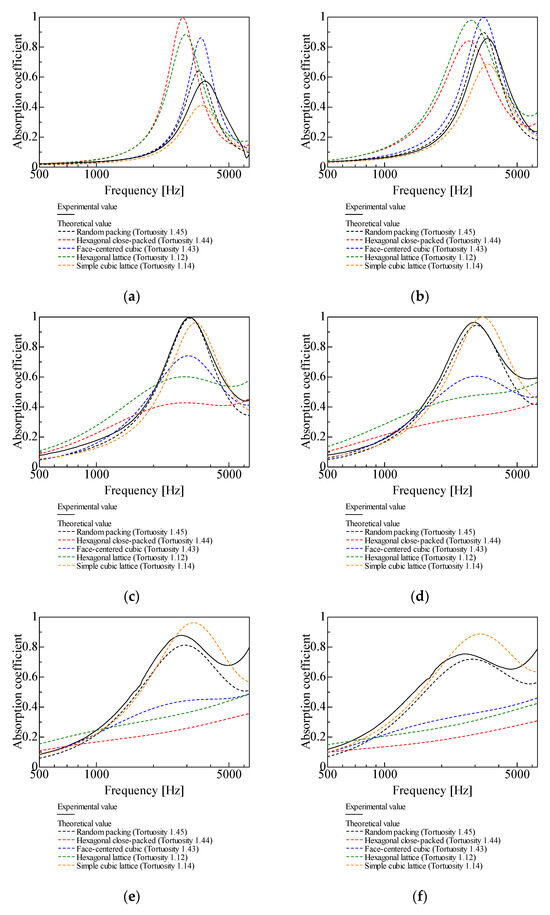
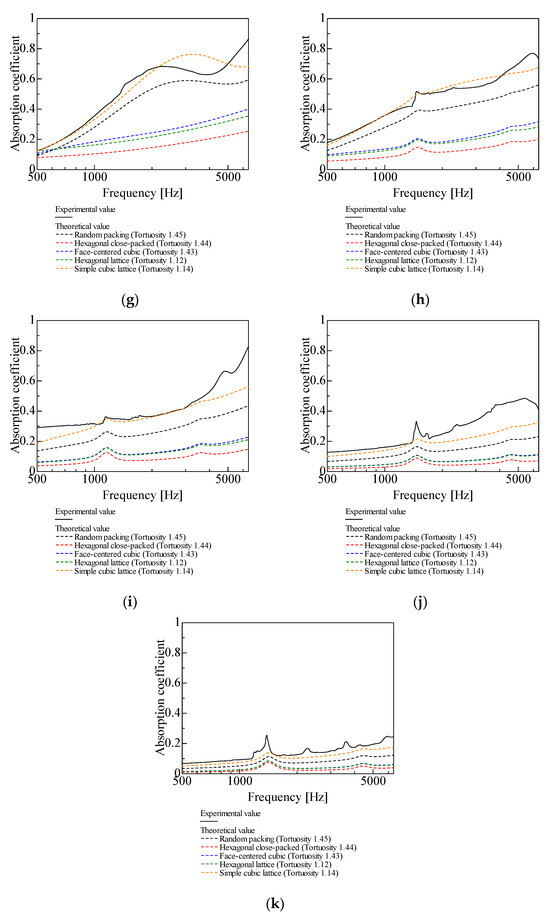
Figure 9.
Comparison of theoretical and experimental values for random packing, l = 20 mm: (a) d = 4 mm; (b) d = 2 mm; (c) d = 1 mm; (d) d = 0.8 mm; (e) d = 0.6 mm; (f) d = 0.5 mm; (g) d = 0.4 mm; (h) d = 0.3 mm; (i) d = 0.2 mm; (j) d = 0.1 mm; (k) d = 0.05 mm.
For d = 4, 2, 1 mm, the theoretical values for random packing are close to the experimental values, with the difference between the experimental and theoretical values increasing with d (Figure 9a–c). This trend, which is observed for gaps larger than the millimeter scale, was also observed in a basic study [27] on the theoretical analysis and measurement of gaps between two planes.
For d = 0.8, 0.6, 0.5, 0.4 mm, similar trends are observed for the theoretical values for random packing and the simple cubic lattice and the experimental values (Figure 9d–g).
For d = 0.3, 0.2, 0.1, 0.05 mm, the smaller the grain sizes are, the theoretical values for the simple cubic lattice are closer to the experimental values than the theoretical values for random packing (Figure 9h–k). This trend, which is observed for gaps smaller than a few tens of micrometers, was also observed in the basic study [27].
For the grain sizes of 4 and 2 mm, the theoretical values for random packing have higher sound absorption peaks and lower peak frequencies than the experimental values (Figure 9a and Figure 9b, respectively). This may be due to a problem in the experiment, possibly an error in the packing of the granular material in the sample. Regarding the measurements of the glass beads, a sliding cut was made 20 mm from the rigid wall at the bottom of the measurement tube after the granular material was packed into the tube, and the experiment was performed using a 20 mm layer thickness. The grain diameter accounts for more than 10% of the sample thickness, particularly for d = 2, 4 mm, so the actual layer thickness is less than 20 mm in many regions of the sample, which may have caused the difference between the theoretical and experimental values.
In Figure 9c–g (d = 1, 0.8, 0.6, 0.5, 0.4 mm), the theoretical values for random packing have lower sound absorption peaks and higher peak frequencies than the experimental values. The two possible causes for this discrepancy are as follows.
The first possible cause is an error in the theoretical values due to the CT image. The edge of the CT image used in this study shows a portion of the particle (Figure 10a). On the contrary, the sound absorption coefficient was measured experimentally using random packing with perfect spheres. Thus, the difference between the theoretical model and the actual one for corner particles may have caused the difference between the theoretical and experimental values. Moreover, the glass beads in the CT image should be circular, but at the top and at the bottom where the diameter of cross-section is small, the circles are distorted. The spheres in some areas are close, sometimes seemingly attached, to each other. In X-ray CT measurements, the smaller the diameter, the larger the image appears relative to the actual dimensions [28]. These errors between the CT images and the actual dimensions may have caused the difference between the experimental and theoretical values of the sound absorption coefficient.
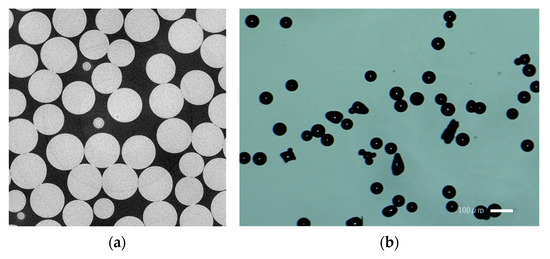
Figure 10.
Images of glass beads: (a) CT image (d = 2 mm); (b) microscopic image (d = 0.05 mm).
A second possible cause is error due to the approximation of the entire structure as the uniform clearance between two planes. The grain gaps in random packing can be narrow or wide, but the approximation averages them to a uniform gap. Because of this approximation, the viscosity of the boundary layer in narrow gaps is difficult to consider, possibly causing the theoretical sound absorption peak to shift to a higher frequency relative to the experimental value. Similar trends have been observed in previous reports [27].
In Figure 9d–k (d = 0.8 mm and smaller), the difference between the theoretical and experimental values for random packing increases as the grain size decreases, possibly due to the difference between the actual glass beads and the CT images used for the theoretical analysis. Figure 10a shows a CT image of the d = 2 mm glass beads used in the theoretical analysis for random packing, and Figure 10b shows a microscopic image of d = 0.05 mm glass beads separated by gaps, captured at 40× magnification. Each cross-section of a d = 2 mm glass bead is almost a perfect circle in the CT image (Figure 10a), indicating that the particles are spherical. However, in Figure 10b, many of the d = 0.05 mm glass beads have distorted shapes and different sizes. (Visual observation confirmed the presence of fewer distorted glass beads at d = 1 mm or larger.) Therefore, the proportion of distorted glass beads increases as the grain size decreases. However, the distorted particles were difficult to isolate visually or remove by sieving because of their large number at small grain sizes. This may be one of the reasons for the difference between the theoretical and experimental values for random packing with a decrease in grain size.
From Figure 9a–k, the particle sizes yielding sound absorption peak values closest to 1 are d = 1 mm for random packing, d = 4 mm for hexagonal close-packed structures, d = 2 mm for face-centered cubic and hexagonal lattices, and d = 0.8 mm for simple cubic lattices. In all cases, the peak frequencies were observed around 3000 Hz. Considering the bandwidth, random packing, hexagonal lattice, and simple cubic lattice demonstrated relatively better sound absorption characteristics. However, because small particles are difficult to arrange regularly, random packing is considered the more practical option. Furthermore, for random packing, reducing the particle size below d = 1 mm lowers the peak sound absorption value but shifts the peak absorption frequency toward lower frequencies and widens the bandwidth. Consequently, random packing with particle sizes of d = 0.8, 0.6, or 0.5 mm may also be advantageous, depending on the application.
5.3. Comparison of with and Without Considering Tortuosity
In Figure 11a–k, the theoretical results for random packing and the simple cubic lattice (Figure 9a–k) are compared with experimental values, with and without considering tortuosity.
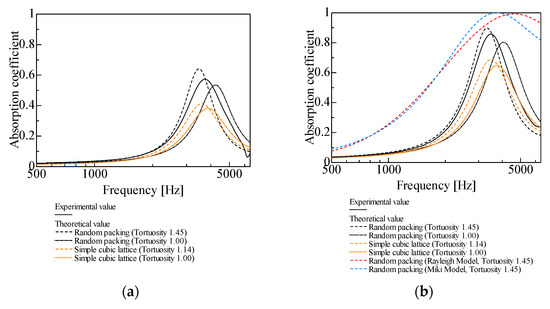
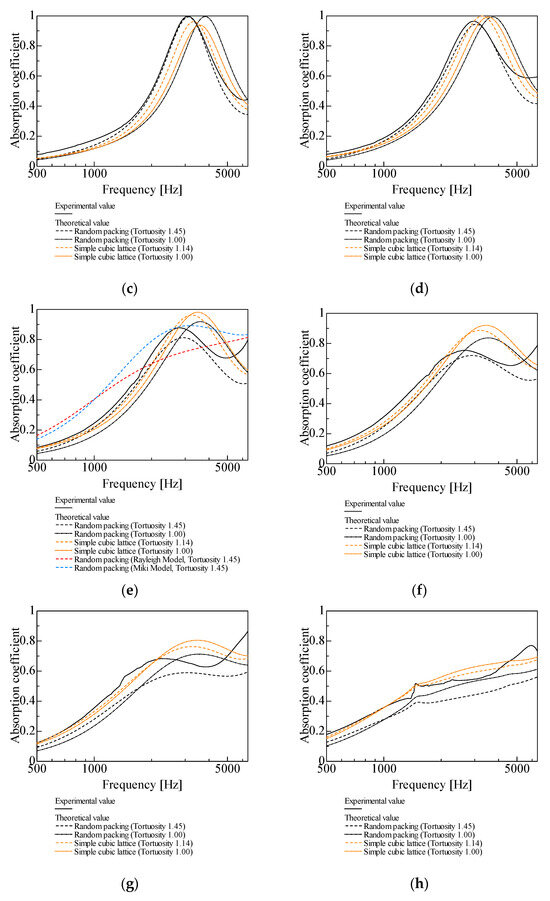
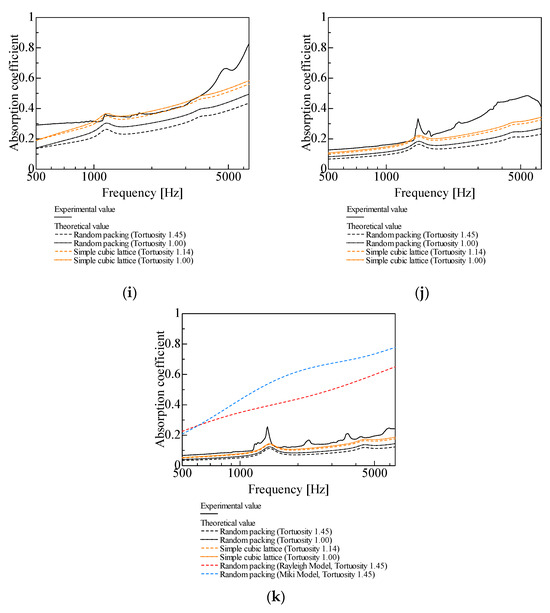
Figure 11.
Comparison between theoretical and experimental values for random packing, l = 20 mm: (a) d = 4 mm; (b) d = 2 mm; (c) d = 1 mm; (d) d = 0.8 mm; (e) d = 0.6 mm; (f) d = 0.5 mm; (g) d = 0.4 mm; (h) d = 0.3 mm; (i) d = 0.2 mm; (j) d = 0.1 mm; (k) d = 0.05 mm. (In Figure 11b,e,k, estimations of sound absorption coefficients based on the Rayleigh and Miki models are presented.).
With tortuosity considered for the theoretical values in Figure 11a–c (d = 1 mm and larger), the peak sound absorption frequency decreases and the peak sound absorption value increases relative to those without considering tortuosity. When tortuosity is considered for the theoretical values in Figure 11d–k (d = 0.8 mm and smaller), both the peak sound absorption frequency and the peak sound absorption value decrease.
The theoretical values for random packing for d = 0.5 mm and larger tend to be closer to the experimental values when tortuosity is taken into account (Figure 11a–f). However, for d = 0.4 mm and smaller, the theoretical values are closer to the experimental values when tortuosity is not considered (Figure 11g–k).
As shown in Figure 11h–k, for d = 0.3 mm and smaller, the theoretical values for the simple cubic lattice are closer to the experimental values than the theoretical values for random packing.
The sound absorption performance changes with grain size. As the grain size gradually reduces from 4 mm to 1 mm, the experimental sound absorption coefficient increases as the grain size approaches 1 mm. However, the peak sound absorption value starts decreasing when d = 0.8 mm and smaller. As shown in Section 4, the sound absorption properties of the granular packed structure vary depending on the void volume of the structure and the surface area of the spheres. This can be simplified as the clearance between two planes having the same geometric parameters. If the packing structure remains unchanged, the packing fraction is constant even when the particle diameter decreases; therefore, the void volume within the packing structure does not change. However, the surface area of the spheres increases as the particle diameter decreases. Due to this relationship and according to Equation (2), the calculated clearance bn between the two planes decreases as the particle diameter decreases. In other words, a smaller particle diameter can be considered equivalent to a narrower clearance between two planes through which the sound waves propagate. For d = 0.8 and smaller, the gap thickness in the void area becomes smaller than the boundary layer thickness, which increases the incident impedance due to excessive viscous resistance, preventing the sound waves from being incident [27].
An increase in the estimated boundary layer thickness is also a reason for the lower theoretical peak sound absorption values considering tortuosity for d = 0.8 mm and smaller (Figure 11d–k). Considering tortuosity produces an effect similar to an increase in the sample thickness. This seeming increase reflects on the calculated sound absorption value, causing the calculated sound absorption peak to shift to a lower frequency. In general, the boundary layer thickness increases as the sound absorption peak decreases in frequency [29]. In other words, if tortuosity is considered for d = 0.8 mm or smaller, the calculated sound absorption peak shifts to a lower frequency and a larger boundary layer thickness is assumed in the calculation. Consequently, the viscous resistance and incident impedance of the boundary layer of the calculated gap are overestimated with respect to sound absorption, which may result in a lower peak sound absorption value in the theoretical analysis.
Prediction models and methods for the sound absorption coefficient of porous materials include the Delany–Bazley model [30], empirical formula proposed by Allard et al. [31], Rayleigh model [32], Miki model [33], and Komatsu model [34]. Unlike the method employed in this study, which employs geometric parameters such as void volume and spherical surface area, these prediction models calculate the sound absorption coefficient using the flow resistivity of the porous medium. Therefore, the theoretical values for random packing derived from CT images in this study were compared with those estimated using other models. Figure 11b,e,k show the theoretical values obtained from the Rayleigh and Miki models for particle sizes d = 2, 0.6, and 0.05 mm (the Komatsu model was inapplicable for most frequencies set in our study). The results indicated that the theoretical values for random packing derived from CT images were generally closer to the experimental values than those determined using conventional methods. The measured flow resistivity values used to calculate the sound absorption coefficients in the Rayleigh and Miki models were 1.75 × 10⁴ Ns/m4 for d = 2 mm, 5.37 × 10⁴ Ns/m4 for d = 0.6 mm, and 1.32 × 10⁵ Ns/m4 for d = 0.05 mm.
5.4. Comparison of with and Without Considering Vibration
Small absorption peaks due to longitudinal vibration are observed in the experimental sound absorption coefficients of the glass beads with d = 0.3–0.05 mm. Therefore, similar to the analysis considering the boundary layer, sound absorption due to the longitudinal vibration of the particles is taken into account [20], as described in Section 4.
Figure 12a–d are comparisons of the theoretical values with and without considering vibrations and the experimental values for all packing structures with d = 0.3–0.05 mm. Tortuosity is taken into account for all theoretical values.
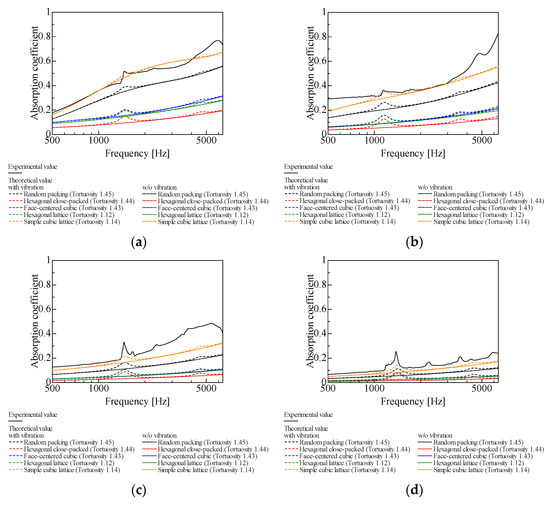
Figure 12.
Comparison between theoretical and experimental values for random packing, l = 20 mm: (a) d = 0.3 mm; (b) d = 0.2 mm; (c) d = 0.1 mm; (d) d = 0.05 mm.
Due to the high density of the glass beads, no sound absorption due to longitudinal vibration occurs in the experimental values throughout the frequency range. However, a small peak of sound absorption due to longitudinal vibration occurs at a frequency corresponding to the sample thickness.
With longitudinal vibration considered in the theoretical analysis, around the abovementioned small peaks, the sound absorption curves show a tendency closer to the experimental values relative to the case where longitudinal vibration is not considered.
6. Conclusions
Theoretical sound absorption coefficients were estimated for the aforementioned typical packing structures of granular materials. The normal-incidence sound absorption coefficient was measured for the hexagonal lattice, simple cubic lattice, and random packing. For the regular packing structures, the actual surface area of the curved surface of the granular material and the actual void volume were determined using a mathematical model. For random packing, the area of the sphere surface and the void volume were determined from cross-sectional CT images and analyzed theoretically. Furthermore, tortuosity was measured for each packing structure. The normal-incident sound absorption coefficient considering tortuosity was calculated and compared with experimental values, and the following results were obtained:
- For the hexagonal and simple cubic lattices, the theoretical analysis was performed using exact values for the granular surface area and void volume. For both packing structures, the theoretical peak frequency considering tortuosity was lower than in the case where tortuosity was not considered, consistent with the experimental values. The measured tortuosity values were therefore reasonable.
- For the experimental results under random packing, sound absorption peaks due to boundary layer viscosity were observed for d = 0.4 mm or larger, whereas sound absorption peaks due to the longitudinal vibration of the particles appeared for d = 0.3 mm or smaller. At d = 0.3 mm, both boundary layer viscosity and longitudinal vibration produced sound absorption peaks. As the particle diameter decreases, the weight of each particle decreases; therefore, it is considered that the absorption effect due to longitudinal vibration gradually begins to emerge as a result [35].
- According to analyses of cross-sectional CT images considering tortuosity, the theoretical values for random packing tended to be close to the experimental values for d = 0.8 mm and smaller—a size range that has not been examined in the literature. By performing an analysis that accounts for the difference between the actual particle dimensions and the CT-image-determined dimensions and separately evaluates the sound absorption arising from small and large interparticle gaps instead of averaging them, the accuracy of the theoretical values may be further improved.
- For random packing structures with d = 0.3 mm or smaller, the experimental values were closer to the theoretical values for simple cubic lattice than the theoretical values for random packing. This finding suggests that the sound absorption coefficient due to boundary layer viscosity in the random packing structures of small-diameter particles may be efficiently estimated by substituting an analysis based on the simple cubic lattice model.
- Comparing the theoretical values with and without considering tortuosity, the theoretical values obtained without considering tortuosity were closer to the experimental values for d = 0.3 mm or smaller. This may be due to the shifting of the absorption peak frequency to a lower value, due to tortuosity, which increases the calculated boundary layer thickness. This results in an underestimation of the absorption peak values in the theoretical results for d = 0.8 mm and smaller.
Author Contributions
Conceptualization, S.S.; Software, K.H. and Y.K.; Formal analysis, K.H., Y.K. and K.S.; Data curation, K.S.; Supervision, S.S.; Project administration, S.S. All authors have read and agreed to the published version of the manuscript.
Funding
This work was supported by the Japan Society for the Promotion of Science (JSPS) KAKENHI Grant No. 24K07374.
Institutional Review Board Statement
Not applicable.
Informed Consent Statement
Not applicable.
Data Availability Statement
The original contributions presented in the study are included in the article, further inquiries can be directed to the corresponding author.
Conflicts of Interest
The authors declare no conflicts of interest.
References
- Sandberg, U. Low noise road surfaces—A state-of-the-art review. J. Acoust. Soc. Jpn. 1999, 20, 1–17. [Google Scholar] [CrossRef]
- Freitas, E.; Oliveira, J.; Machado, P.; Pereira, S. Innovatiove low noise road pavement materials studied in Portugal. In Proceedings of the Acoustics 2012, Hong Kong, China, 13–18 May 2012; Available online: https://www.researchgate.net/publication/261216128_Innovative_low_noise_road_pavement_materials_studied_in_Portugal (accessed on 10 July 2025).
- Zhang, X.; Thompson, D.; Jeong, H.; Squicciarini, G. The effects of ballast on the sound radiation from railway track. J. Sound Vib. 2017, 399, 137–150. [Google Scholar] [CrossRef]
- Tomitaka, T. Sound Absorbing Structure. JP Patent 6381759 B2, 29 August 2018. Available online: https://patents.google.com/patent/JP6381759B2/ja (accessed on 10 July 2025).
- Uejima, K. Audio Equipment Mat. JP Patent 3664724 B1, 29 June 2005. Available online: https://patents.google.com/patent/JP3664724B1/ja?oq=3664724 (accessed on 10 July 2025).
- Sikora, J.; Turkiewicz, J. Sound absorption coefficients of granular materials. Mech. Control 2010, 29, 149–157. Available online: https://journals.agh.edu.pl/mech/article/view/1725 (accessed on 10 July 2025).
- Asdrubali, F.; D’Alessandro, F.; Schiavoni, S. Sound absorbing properties of materials made of rubber crumbs. J. Acoust. Soc. Am. 2008, 123, 3037. [Google Scholar] [CrossRef]
- Swift, M.J.; Bris, P.; Horoshenkov, K.V. Acoustic absorption in re-cycled rubber granulate. Appl. Acoust. 1999, 57, 203–212. [Google Scholar] [CrossRef]
- Horoshenkov, K.V.; Swift, M.J. The effect of consolidation on the acoustic properties of loose rubber granulates. Appl. Acoust. 2001, 62, 665–690. [Google Scholar] [CrossRef]
- Maderuelo-Sanz, R.; Morillas, J.M.B.; Escobar, V.G. Acoustical performance of loose cork granulates. Eur. J. Wood Prod. 2014, 72, 321–330. [Google Scholar] [CrossRef]
- Voronina, N.N.; Horoshenkov, K.V. A new empirical model for the acoustic properties of loose granular media. Appl. Acoust. 2003, 64, 415–432. [Google Scholar] [CrossRef]
- Boubel, A.; Bousshine, S.; Garoum, M.; Ammar, A. Experimental Sound Absorption of Several Loose Uncooked Granular Materials. Int. J. Innov. Technol. Explor. Eng. 2019, 9, 4578–4583. [Google Scholar] [CrossRef]
- Gasser, S.; Paun, F.; Bréchet, Y. Absorptive properties of rigid porous media: Application to face centered cubic sphere packing. J. Acoust. Soc. Am. 2005, 117, 2090–2099. [Google Scholar] [CrossRef]
- Lee, C.-Y.; Leamy, M.J.; Nadler, J.H. Acoustic absorption calculation in irreducible porous media: A unified computational approach. J. Acoust. Soc. Am. 2009, 126, 1862–1870. [Google Scholar] [CrossRef] [PubMed]
- Dung, V.V.; Panneton, R.; Gagné, R. Prediction of effective properties and sound absorption of random close packings of monodisperse spherical particles: Multiscale approach. J. Acoust. Soc. Am. 2019, 145, 3606–3624. [Google Scholar] [CrossRef] [PubMed]
- Li, X.; Yu, X.; Chua, J.W.; Lee, H.P.; Ding, J.; Zhai, W. Microlattice Metamaterials with Simultaneous Superior Acoustic and Mechanical Energy Absorption. Small 2021, 17, 2100336. [Google Scholar] [CrossRef] [PubMed]
- Li, L.; Guo, Z.; Yang, F.; Li, P.; Zhao, M.; Zhong, Z. Additively manufactured acoustic–mechanical multifunctional hybrid lattice structures. Int. J. Mech. Sci. 2024, 269, 109071. [Google Scholar] [CrossRef]
- Li, L.; Yang, F.; Jin, Y.; Li, P.; Zhang, S.; Xue, K.; Lu, G.; Fan, H. Multifunctional hybrid plate lattice structure with high energy absorption and excellent sound absorption. Mater. Des. 2024, 241, 112946. [Google Scholar] [CrossRef]
- Wang, H.; Wang, K.; Ma, P.; Fan, X. The energy absorption characteristics and sound absorption behavior of in situ integrated aluminum lattice structure filled tubes. Adv. Eng. Mater. 2024, 26, 2401686. [Google Scholar] [CrossRef]
- Sakamoto, S.; Takakura, R.; Suzuki, R.; Katayama, I.; Saito, R.; Suzuki, K. Theoretical and experimental analyses of acoustic characteristics of fine-grain powder considering longitudinal vibration and boundary layer viscosity. J. Acoust. Soc. Am. 2021, 149, 1030–1040. [Google Scholar] [CrossRef]
- Sakamoto, S.; Suzuki, K.; Toda, K.; Seino, S. Mathematical Models and Experiments on the Acoustic Properties of Granular Packing Structures (Measurement of Tortuosity in Hexagonal Close-Packed and Face-Centered Cubic Lattices). Materials 2022, 15, 7393. [Google Scholar] [CrossRef]
- Sakamoto, S.; Suzuki, K.; Toda, K.; Seino, S. Estimation of the Acoustic Properties of the Random Packing Structures of Granular Materials: Estimation of the Sound Absorption Coefficient Based on Micro-CT Scan Data. Materials 2023, 16, 337. [Google Scholar] [CrossRef]
- Allard, J.F.; Castagnede, B.; Henry, M. Evaluation of tortuosity in acoustic porous materials saturated by air. Rev. Sci. Instrum. 1994, 65, 754–755. [Google Scholar] [CrossRef]
- Stinson, M.R.; Champoux, Y. Propagation of sound and the assignment of shape factors in model porous materials having simple pore geometries. J. Acoust. Soc. Am. 1992, 91, 685–695. [Google Scholar] [CrossRef]
- Allard, J.F.; Atalla, N. Propagation of Sound in Porous Media: Modelling Sound Absorbing Materials, 2nd ed.; John Wiley & Sons, Ltd.: Hoboken, NJ, USA, 2009. [Google Scholar] [CrossRef]
- Attenborough, K. Microstructures for lowering the quarter wavelength resonance frequency of a hard-backed rigid-porous layer. Appl. Acoust. 2018, 130, 54–62. [Google Scholar] [CrossRef]
- Sakamoto, S.; Higuchi, K.; Saito, K.; Koseki, S. Theoretical analysis for sound-absorbing materials using layered narrow clearances between two planes. J. Adv. Mech. Des. Syst. Manuf. 2014, 8. [Google Scholar] [CrossRef]
- Aizawa, J. Evaluation of Errors of Length Measurement Using Microfocus X-Ray Computed Tomography; Research Reports of Nagano Prefecture General Industrial Technology Center: Nagano, Japan, 2012; Volume 7, pp. 39–41. Available online: https://www.gitc.pref.nagano.lg.jp/reports/pdf/H24/01Zairyo/H24M10_39-41.pdf (accessed on 10 July 2025).
- Yazaki, T. Sound Propagation in Narrow Tubes and Thermoacoustic Phenomena. J. Jpn. Soc. Fluid Mech. Nagare 2005, 24, 395–404. [Google Scholar] [CrossRef]
- Cox, T.J.; D’Antonio, P. Acoustic Absorbers and Diffusers: Theory, Design and Application; Taylor & Francis Group: London, UK, 2004; pp. 129–155. [Google Scholar]
- Allard, J.F.; Champoux, Y. New empirical equations for sound propagation in rigid frame fibrous materials. J. Acoust. Soc. Am. 1992, 91, 3346–3353. [Google Scholar] [CrossRef]
- Rayleigh, J.W.S. The Theory of Sound, 2nd ed.; Dover: New York, NY, USA, 1945. [Google Scholar]
- Miki, Y. Acoustical properties of porous materials-modifications of Delany-Bazley models. J. Acoust. Soc. Jpn. 1990, 11, 19–24. [Google Scholar] [CrossRef]
- Komatsu, T. Improvement of the Delany-Bazley and Miki models for fibrous sound-absorbing materials. Acoust. Sci. Technol. 2008, 29, 121–129. [Google Scholar] [CrossRef]
- Sakamoto, S.; Saito, R.; Jindai, K.; Ikeda, K. Conditions for sound absorption caused by longitudinal vibration of lightweight powder. Noise Control Eng. J. 2024, 72, 402–411. [Google Scholar] [CrossRef]


Disclaimer/Publisher’s Note: The statements, opinions and data contained in all publications are solely those of the individual author(s) and contributor(s) and not of MDPI and/or the editor(s). MDPI and/or the editor(s) disclaim responsibility for any injury to people or property resulting from any ideas, methods, instructions or products referred to in the content. |
© 2025 by the authors. Licensee MDPI, Basel, Switzerland. This article is an open access article distributed under the terms and conditions of the Creative Commons Attribution (CC BY) license (https://creativecommons.org/licenses/by/4.0/).