


Abstract
The COVID-19 pandemic highlighted the need for a scientific framework that enables quantitative assessment and control of airborne infection risks in indoor environments. This study identifies limitations in the traditional Wells–Riley model—specifically its assumptions of perfect mixing and steady-state conditions—and addresses these shortcomings by adopting the REHVA (Federation of European Heating, Ventilation and Air Conditioning Associations) infection risk assessment model. We propose a five-tier risk classification system (Monitor, Caution, Alert, High Risk, Critical) based on two key metrics: the probability of infection (Pₙ) and the event reproduction number (R_event). Unlike the classical model, our approach integrates airborne virus removal mechanisms—such as natural decay, gravitational settling, and filtration—with occupant dynamics to reflect realistic contagion scenarios. Simulations were conducted across 10 representative indoor settings—such as classrooms, hospital waiting rooms, public transit, and restaurants—considering ventilation rates and activity-specific viral emission patterns. The results quantify how environmental variables (ventilation, occupancy, time) impact each setting’s infection risk level. Our findings indicate that static mitigation measures such as mask-wearing or physical distancing are insufficient without dynamic, model-based risk evaluation. We emphasize the importance of incorporating real-time crowd density, occupancy duration, and movement trajectories into risk scoring. To support this, we propose integrating computer vision (CCTV-based crowd detection) and entry/exit counting sensors within a live airborne risk assessment framework. This integrated system would enable proactive, science-driven epidemic control strategies, supporting real-time adaptive interventions in indoor spaces. The proposed platform could serve as a practical tool for early warning and management during future airborne disease outbreaks.
1. Introduction
The COVID-19 pandemic significantly heightened awareness and concern regarding the risks of airborne transmission in indoor environments. Numerous cluster infection cases have been reported in enclosed spaces, providing empirical evidence that airflow and ventilation play a critical role in the spread of infection. For example, in the well-known cluster outbreak at a call center in Guro-gu, Seoul, 166 individuals were infected after prolonged exposure in a densely populated and poorly ventilated office setting. This case clearly demonstrates the high risk of infection in crowded indoor environments [1]. Such cases underscore the need for analytical tools capable of quantitatively predicting the risk of airborne transmission and evaluating the effectiveness of mitigation measures—such as ventilation rates, spatial configurations, and occupancy duration [2]. One of the most widely used approaches for analyzing and evaluating airborne infectious disease transmission is the Wells–Riley model. This model estimates the concentration of pathogens dispersed by an infectious individual in an indoor space using the concept of “quanta,” and predicts an individual’s probability of infection based on ventilation rate and exposure duration. A quantum refers to the average infectious dose that results in a 63.2% probability of infection when a person inhales one quantum [3]. Equation (1) represents the Wells–Riley model, where denotes the probability of infection, I is the number of infectious individuals, q is the quanta generation rate (quanta/hour), Q is the ventilation rate (m3/hour), p is the breathing rate (m3/hour), and t is the exposure time (hours).
However, the Wells–Riley model has notable limitations in that it assumes homogeneous well-mixed air and steady-state conditions, while ignoring inter-individual behavioral differences and temporal variations. Furthermore, the model considers only ventilation as a removal mechanism and does not account for other important processes, such as natural inactivation, surface deposition, filtration, or ultraviolet germicidal irradiation (UVGI). As a result, it only estimates individual infection probability and falls short in supporting realistic control strategy development [4]. To address these limitations, this study adopts the infection risk model proposed in the REHVA (Federation of European Heating, Ventilation and Air Conditioning Associations) COVID-19 guidelines. While maintaining the foundational structure of the Wells–Riley model, the REHVA model incorporates additional factors such as air purification, virus inactivation, and gravitational settling by expressing them as an equivalent ventilation rate. Furthermore, it extends the framework by introducing the concept of the event reproduction number (R_event), which quantifies the transmission potential in a given space in addition to individual infection probability [5]. The primary objectives of this study are as follows:
- A quantitative risk assessment framework is developed based on the REHVA model by calculating the probability of infection (PoI) and the event reproduction number (R_event) within indoor environments.
- The risk is categorized into a five-tier classification system—“Monitor”, “Caution”, “Alert”, “High Risk”, “Critical”—with threshold values for each tier clearly defined based on the existing literature.
- The model is applied to 10 representative indoor environments (e.g., classrooms, restaurants, public transportation, call centers), enabling scenario-based quantitative risk analysis and proposing appropriate mitigation strategies under realistic conditions.
This study suggests that static interventions—such as social distancing and mask-wearing—are insufficient for systematically managing airborne transmission in indoor environments, highlighting the need for dynamic infection control strategies. Existing guidelines primarily focus on epidemic phases (e.g., Alert, Warning, Severe) or population-level risk classifications, and therefore do not provide detailed quantitative indicators at the level of specific indoor spaces. In contrast, the five-tier system proposed in this study utilizes the probability of infection and R_event values, offering a distinctive approach in quantitatively assessing indoor risk. Moreover, the proposed model explores the potential for integrating real-time data on crowd density and occupancy duration by linking CCTV-based crowd analysis and entry/exit counting systems. These capabilities indicate that the model could serve as a quantitative, practice-oriented framework for future public health guidelines.
2. Related Works
Various mathematical models have been developed to quantify the risk of infectious disease transmission through aerosols in indoor air. Among them, the Wells–Riley model, introduced in 1978, has become one of the most widely used frameworks to describe the relationship between building ventilation and the probability of airborne infection. This model has also been adopted in practical guidelines by REHVA (the Federation of European Heating, Ventilation and Air Conditioning Associations) [6]. The Wells–Riley model is widely used due to its relatively simple input parameters, which make it easily applicable by ventilation engineers and public health officials. It has been empirically validated through retrospective analyses of airborne disease outbreaks such as tuberculosis and measles, and was also extensively used during the COVID-19 pandemic to estimate infection risks in various indoor settings. The model effectively illustrates the exponential reduction in infection probability as ventilation rates increase, thus quantitatively emphasizing the importance of ventilation. However, it has notable limitations in reflecting real-world conditions. Specifically, its assumptions of perfect air mixing and steady-state conditions, along with its omission of removal mechanisms such as natural decay, surface deposition, filtration, and ultraviolet germicidal irradiation (UVGI), restrict its applicability. Moreover, it only estimates the probability of infection for a single event and does not support broader assessments needed for realistic infection control strategies. [7] proposed the Turbulent Jet Wells–Riley (TJWR) model, which integrates turbulent jet theory to simultaneously assess both short-range and long-range transmission within a single indoor space. The TJWR model produced results that were more closely aligned with observed attack rates compared to the classical Wells–Riley model, thereby demonstrating the utility of extending the Wells–Riley framework for indoor air quality design and risk prediction.
However, Wells–Riley-based models still face significant limitations, including high uncertainty in estimating input parameters and a tendency toward retrospective rather than real-time assessments. Moreover, these models typically yield infection probability as a single scalar value, making it difficult to classify risk levels into multiple tiers or translate them into practical, actionable categories for implementation. The SIR model is a compartmental epidemiological model that divides the total population into three states—Susceptible, Infectious, and Recovered—and describes the transitions between these states using a system of differential equations [8]. Since its introduction by [9], the SIR model has become one of the most fundamental mathematical models in epidemiology. It has been effective in explaining the epidemic patterns of many diseases that spread through human-to-human transmission and confer immunity after infection, such as measles and rubella.
The model allows for the derivation of key epidemiological indicators through analytical solutions, making it relatively straightforward to assess disease transmissibility. Its computational efficiency enables rapid simulation of large populations, and it is well-suited for sensitivity analyses and scenario comparisons based on parameter variations. However, as a compartmental model that does not explicitly incorporate individual contact behavior or spatial dynamics, it is limited in its ability to assess airborne transmission risk in specific indoor environments. Furthermore, critical transmission factors such as ventilation are not clearly defined or directly represented within the parameter structure of the SIR framework.
The SEIR model is an extension of the SIR framework that introduces an additional compartment, Exposed, to account for the incubation period. It divides the population into four states—Susceptible, Exposed, Infectious, and Recovered. This model is particularly useful for simulating the transmission dynamics of infectious diseases in which individuals do not become immediately infectious upon exposure but instead undergo a latent period before becoming contagious [10]. The SEIR model has been widely used for policy simulations involving respiratory diseases with long incubation periods, such as MERS and SARS. It retains most of the advantages of the SIR model while offering improved realism in capturing the latent dynamics of disease progression.
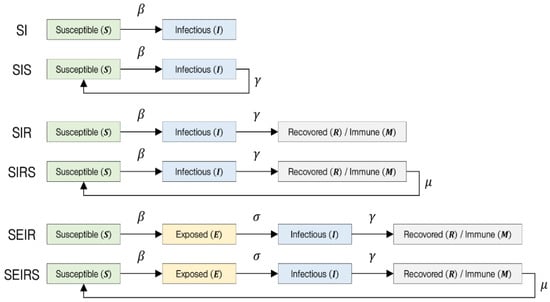
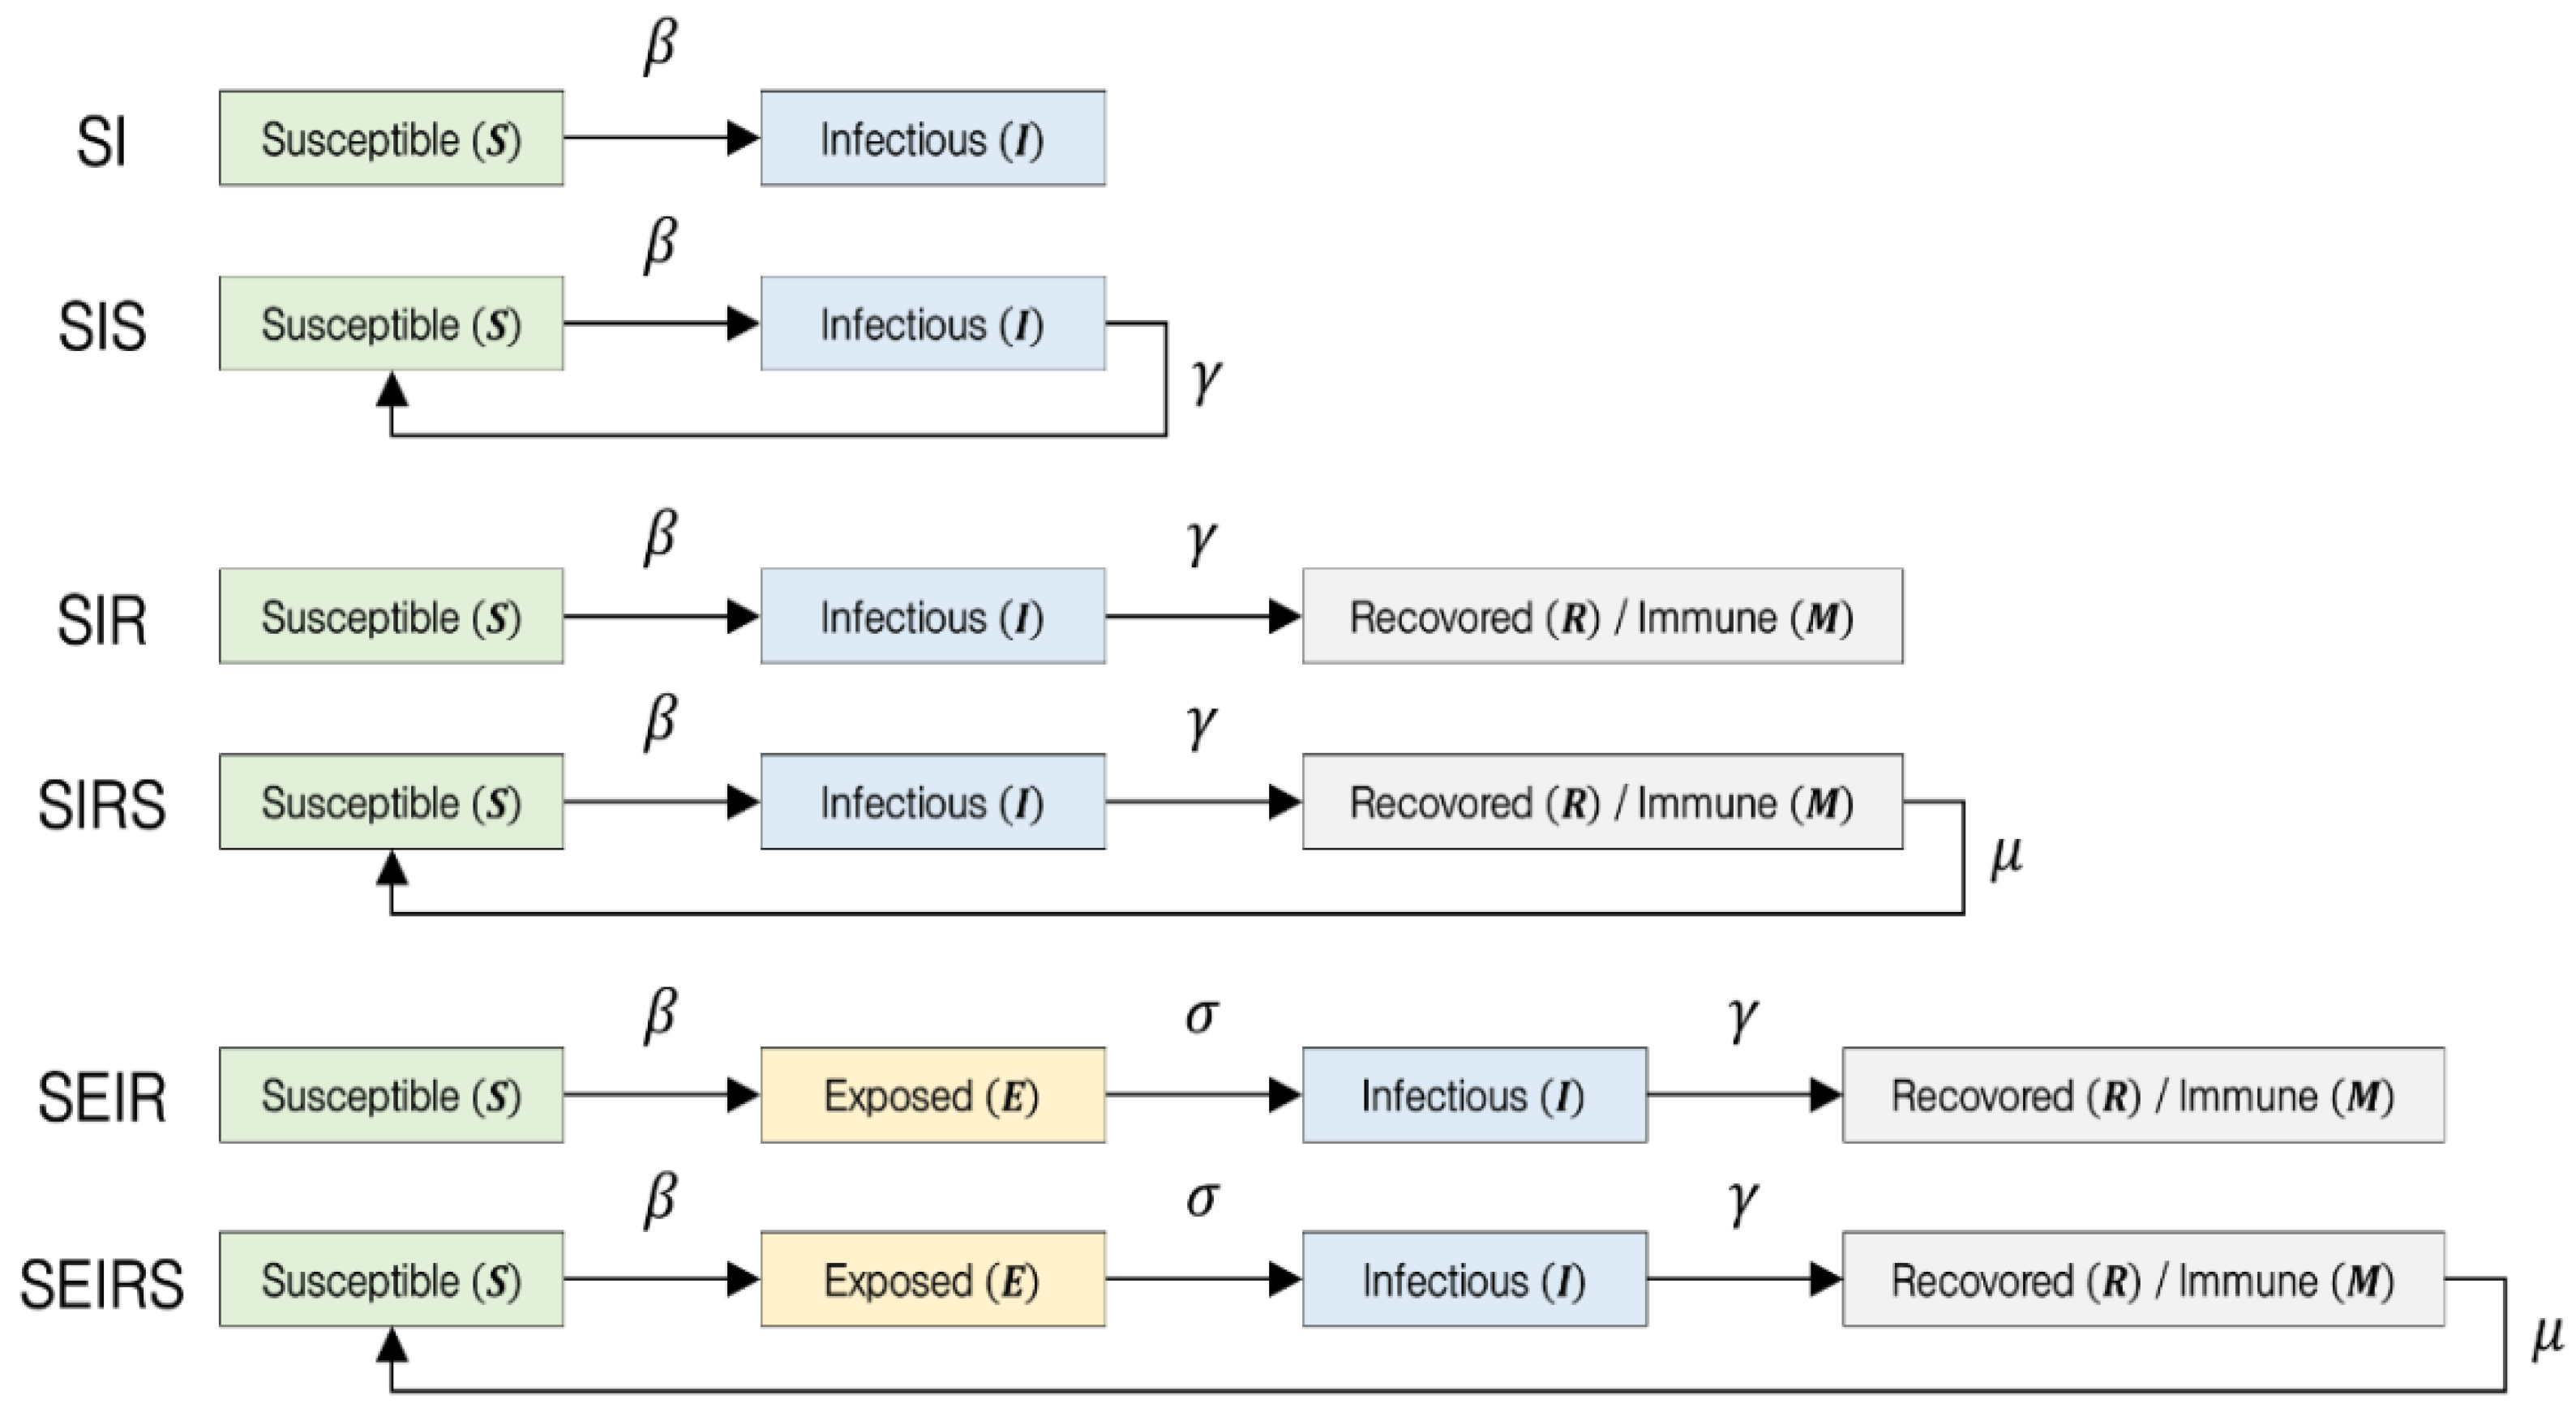
However, the addition of the Exposed compartment introduces greater complexity in parameter estimation and model interpretation, requiring additional data to define the newly introduced parameters. Similar to the SIR model, the SEIR framework does not incorporate spatial dynamics, making it difficult to apply directly to detailed risk assessments in specific indoor environments. In summary, SIR/SEIR-type compartmental models are useful for understanding transmission trends at the population level and are commonly applied to public health strategy planning and forecasting community-level outbreaks. However, they are limited in their ability to provide immediate and spatially contextualized infection risk assessments within confined indoor settings. In particular, critical environmental parameters such as room volume, ventilation rate, and occupant density are not explicitly incorporated into the model. Moreover, it assumes a homogeneous population, thereby failing to account for spatial heterogeneity, such as seating arrangements or airflow patterns, and it has a limited capacity to precisely reflect dynamic environmental factors, including temporal variations in ventilation and changes in mask-wearing compliance. The basic structures of compartmental models commonly used in infectious disease modeling are illustrated in Figure 1.
Figure 1.
Basic types of compartmental models used in infectious disease transmission modeling.
In compartmental models such as SEIR, the population is divided into distinct health states. The Susceptible (S) compartment represents individuals who are not yet immune and are at risk of infection upon exposure. The Exposed (E) compartment includes individuals who have been infected by the pathogen but are not yet infectious. The Infectious (I) group consists of individuals capable of transmitting the disease to susceptible individuals. The Recovered (R), or Immune (M), compartment refers to those who have acquired immunity either through recovery or vaccination and are resistant to reinfection. Transitions between these compartments are governed by key parameters: β denotes the transmission rate, representing the probability that a susceptible individual becomes infected upon contact with an infectious individual. γ is the recovery rate, indicating the speed at which infectious individuals recover and either gain immunity or lose infectiousness, thereby exiting the Infectious compartment. σ represents the progression rate from the Exposed to the Infectious state, corresponding to the inverse of the incubation period, during which individuals are infected but not yet contagious, and μ is the immunity waning rate, reflecting the proportion of recovered individuals who lose immunity over time and return to the Susceptible compartment, thus capturing the possibility of reinfection. In addition to compartmental models, agent-based models (ABMs) and computational fluid dynamics (CFD)-based aerosol models are also used for simulating infectious disease transmission. Agent-based models represent each individual as a discrete agent and simulate their movements, interactions, and infection processes within a realistic spatial environment. Unlike models based on average transmission rates, ABMs allow for the probabilistic modeling of individual contact events and can incorporate heterogeneous behavioral patterns. This enables detailed analysis of how micro-level changes in individual behavior or spatial conditions influence macro-level transmission outcomes [11]. While agent-based models offer flexibility and a high level of detail, they require complex input settings and substantial computational resources. Each individual agent and environmental parameter must be explicitly defined, resulting in a large number of parameters. This also necessitates reliable data to support assumptions regarding behavioral patterns and probability distributions, which can be a limiting factor. Computational fluid dynamics (CFD)-based aerosol transmission models, on the other hand, numerically solve fluid dynamics governing equations—such as the Navier–Stokes equations—to simulate indoor airflow and aerosol particle behavior. These models achieve a high level of physical accuracy and are capable of capturing fine-scale airflow dynamics, turbulence effects, and the influence of temperature, humidity, evaporation, and gravitational settling. As such, they provide the most detailed and realistic representation of aerosol transport in indoor environments. However, CFD simulations are computationally intensive and time-consuming. Moreover, interpreting CFD outputs in terms of infection risk requires integration with separate epidemiological models. While CFD can estimate variables such as aerosol concentration and air velocity fields, it cannot directly predict infection probability or the number of secondary cases. Therefore, additional models—such as the Wells–Riley equation or empirical dose–response data—are needed to convert CFD results into actionable infection risk assessments [12]. To overcome the limitations of existing models and methodologies, this study proposes a risk assessment framework based on the extended Wells–Riley model suggested by REHVA, aimed at quantitatively evaluating airborne infection risks and systematically classifying risk levels in indoor environments. This model enables numerical estimation of airborne transmission risk using relatively simple input variables and offers a practical advantage by calculating the event reproduction number (R_event), which allows for multi-tier risk classification and cross-comparison across different spatial settings. Building on this approach, the present study introduces a five-tier risk level system and applies it to various indoor scenarios, thereby providing a field-oriented, quantitative basis for infection risk judgment and the formulation of practical mitigation strategies.
3. Methodology
3.1. Structure of the REHVA Model and Quantitative Risk Assessment Method for Airborne Infection
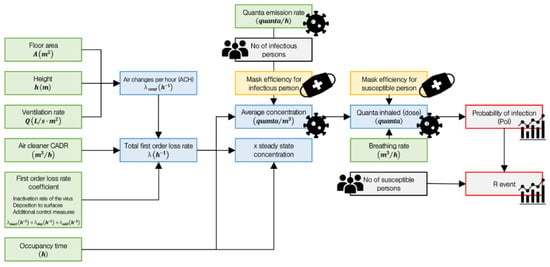
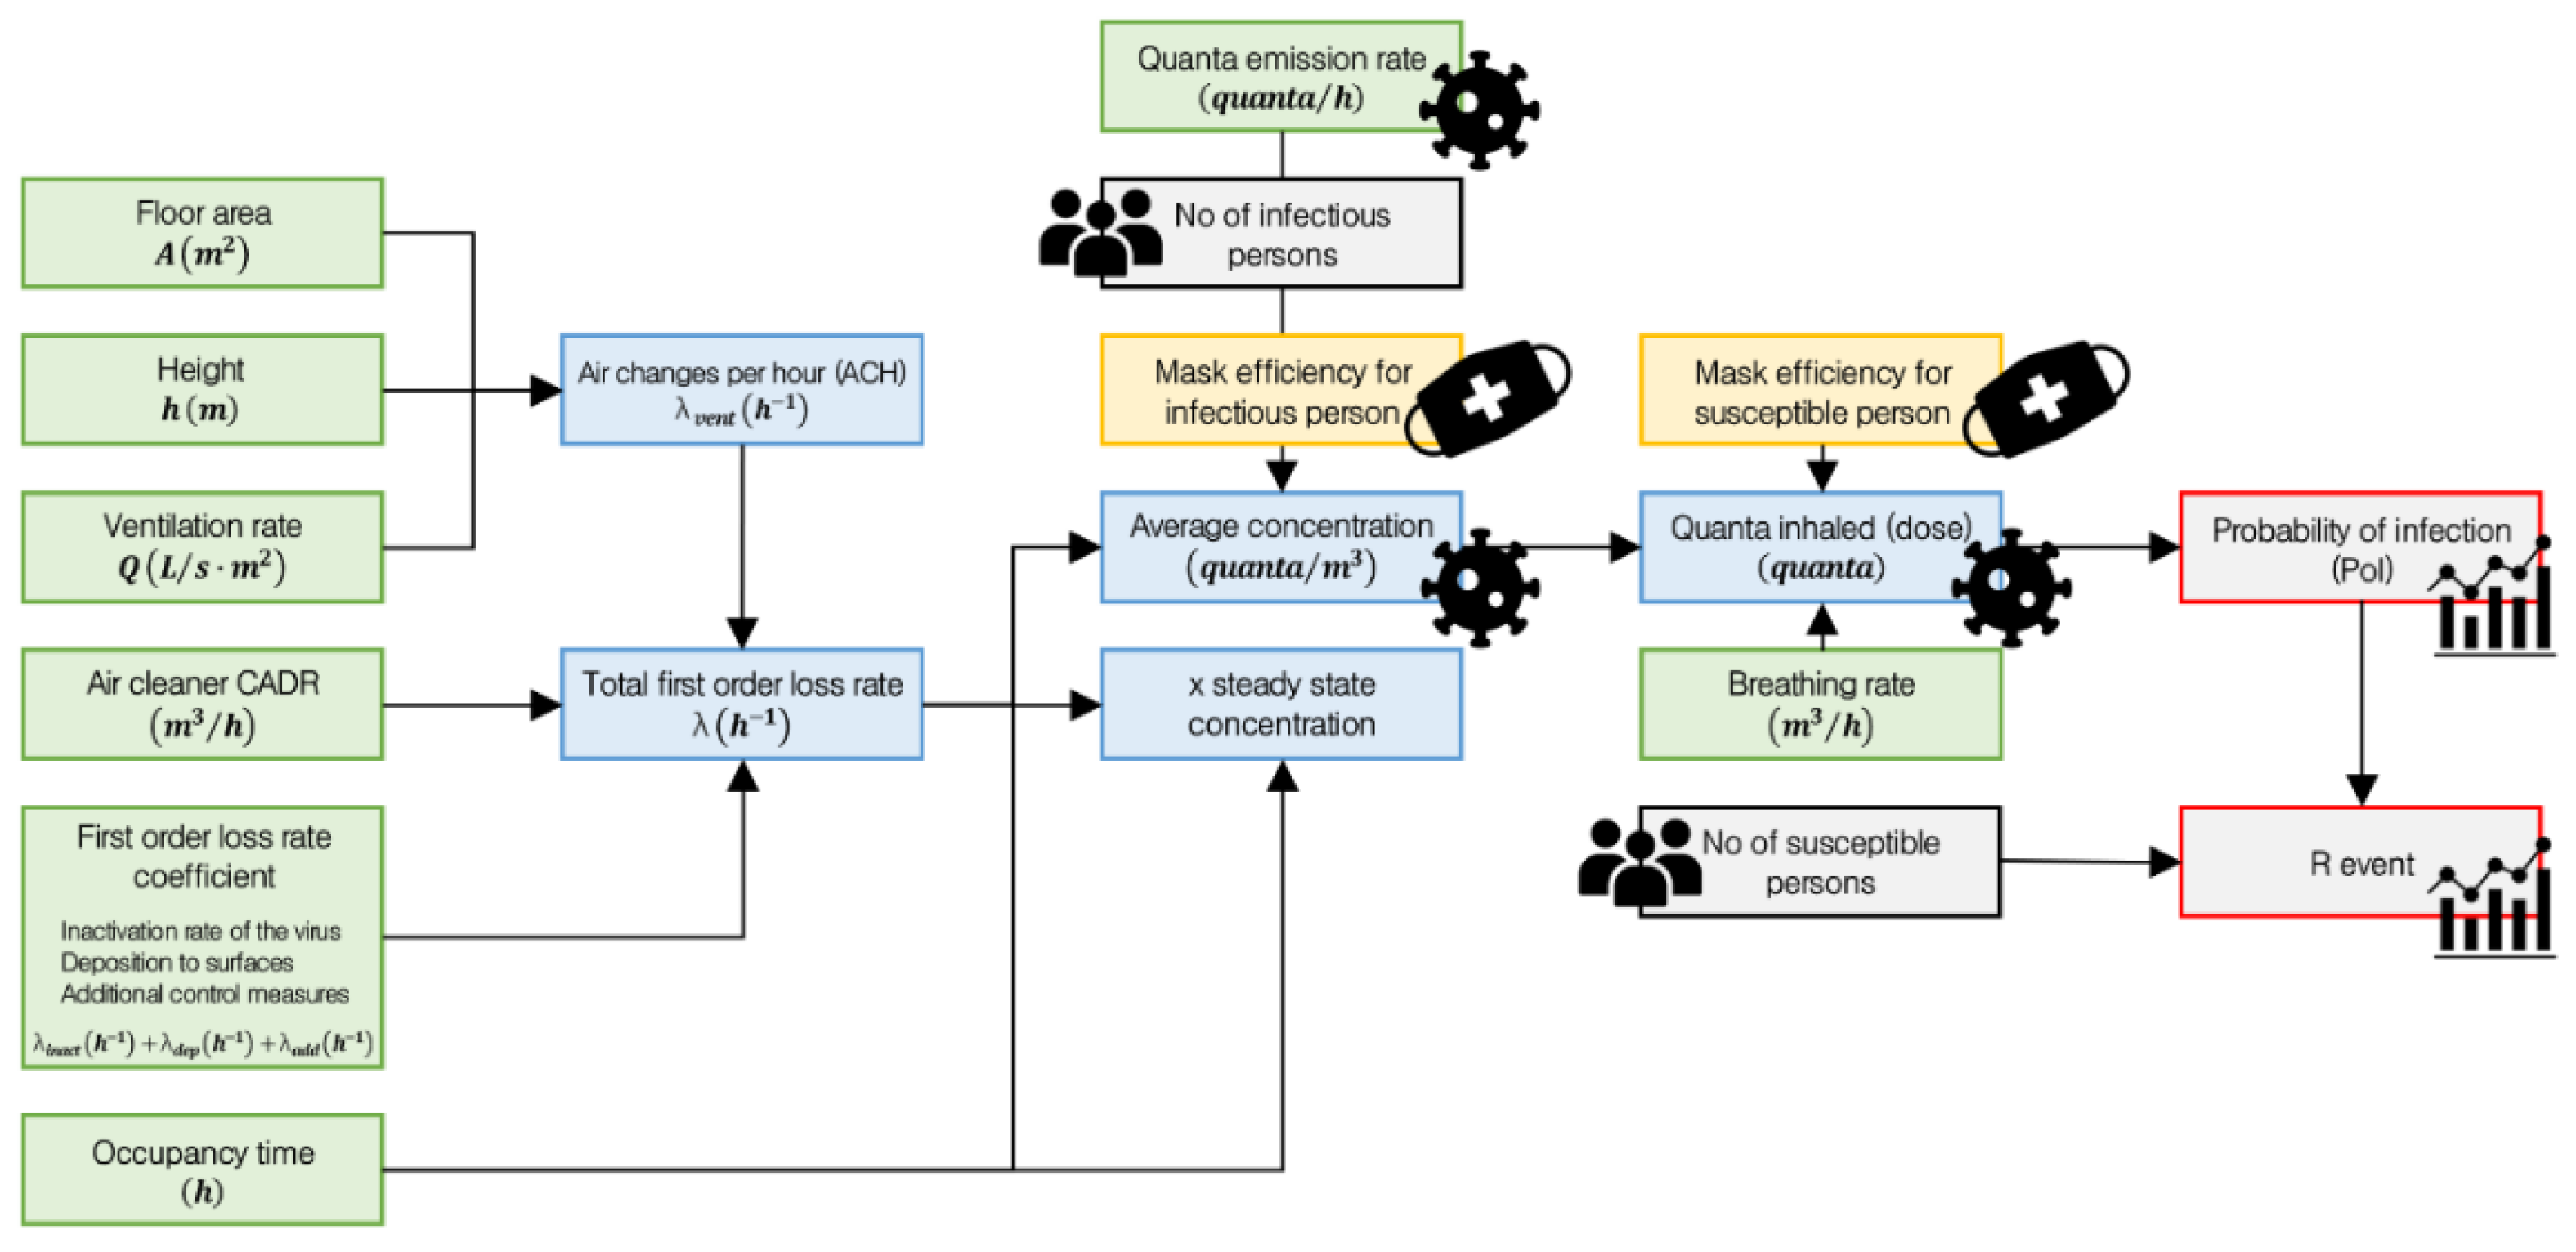
Following the COVID-19 pandemic, the Federation of European Heating, Ventilation and Air Conditioning Associations (REHVA) proposed a risk assessment model based on the Wells–Riley model as a means of quantitatively evaluating airborne infection risk in indoor environments. In this study, the REHVA-based infection risk assessment model uses the probability of infection (PoI) and the event reproduction number (R_event) as its core indicators. Figure 2 illustrates the quantitative calculation flow of the REHVA model and the process for deriving the probability of infection and the R_event.
Figure 2.
Quantitative computational flow of the REHVA model.
Several steps are required to calculate the probability of infection (PoI) and the event reproduction number (R_event). Floor area and height represent the area of the floor and the ceiling height of the space, respectively, and are used to calculate the total volume. The ventilation rate, expressed as the number of air changes per hour, plays a critical role in diluting indoor air and removing airborne contaminants. The Clean Air Delivery Rate (CADR) of an air cleaner is an indicator of its purification performance, representing the volume of clean air delivered per unit time. The first-order loss rate coefficient refers to the rate at which airborne viruses are removed per hour through natural or technical processes. In this study, it consists of the following components:
- Inactivation rate of the virus: The biological decay process by which viral particles naturally lose infectivity over time.
- Deposition to surfaces: The mechanical loss of aerosol particles as they settle onto surfaces such as walls and floors due to gravity, diffusion, or turbulence.
- Additional control measures: Technical removal methods other than ventilation and air cleaners; these include HEPA filtration, ultraviolet germicidal irradiation (UVGI), and ionization technologies.
Occupancy time is defined as the duration for which individuals remain in a given space, and it is used to calculate exposure dose and infection probability. Based on these parameters, two key indicators are computed:
- Air changes per hour (ACH), which represents the number of times the entire volume of indoor air is replaced within one hour through mechanical ventilation, natural ventilation, or window opening.
- Total first-order loss rate, which quantifies the rate at which infectious aerosols are removed from the air, reflecting the decay speed of airborne pathogens.
Equations (2) and (3) present the calculations for air changes per hour and total first-order loss rate, respectively.
The result of the total first-order loss rate is used to calculate the average concentration of infectious particles in the air over a given period of time. This value is critical for estimating actual exposure dose, as it reflects the average airborne concentration resulting from quanta emitted by an infector and partially removed through ventilation and other loss mechanisms. Additionally, when an infectious person remains in a space for an extended period, the quanta generated reach a dynamic equilibrium with the removal processes, resulting in a steady concentration level. This theoretical upper limit of quanta concentration over time is referred to as the x steady-state concentration. Equations (4) and (5) represent the calculations for average concentration and x steady-state concentration, respectively.
Mask efficiency for an infectious person refers to the quantitative measure of how effectively a mask worn by an infectious individual blocks the release of respiratory particles. It reduces the amount of quanta emitted into the air. If no mask is worn, the value is set to 0, while the default value for a standard mask is 0.5 [13]. Number of infectious persons in the room is one of the key variables that determines the total amount of infectious particles released into the air. As the number of infectious individuals increases, the concentration of quanta and the corresponding infection risk increase linearly. In most scenarios, the model assumes one infectious person as the default. Quanta emission rate refers to the amount of infectious aerosol particles emitted into the air by one infectious person per unit time. A “quantum” represents the minimum infectious dose that leads to a 63% probability of infection. This value varies depending on the type of disease, the activity level of the individual, and whether a mask is worn. Quanta inhaled (dose) is calculated based on the average concentration result. It represents the amount of infectious quanta actually inhaled by a susceptible person from the air. In other words, it quantifies the extent to which a person at risk has been exposed to airborne infectious particles. Equation (6) presents the calculation for quanta inhaled (dose).
Breathing rate refers to the volume of air inhaled by a susceptible person per unit of time and varies depending on the level of physical activity. It determines how much airborne infectious material a person is likely to inhale when exposed to quanta in the air. Mask efficiency for a susceptible person is the coefficient that indicates how effectively a mask worn by a non-infected person blocks infectious particles in the air. This efficiency is a key factor in reducing the amount of quanta inhaled. If no mask is worn, the value is set to 0, while the default value for a standard mask is 0.3. Once the quanta inhaled (dose) is determined, both the probability of infection and the R_event can be calculated. The probability of infection quantifies the likelihood that a susceptible person will become infected after staying in the same space with an infectious person for a given period. It serves as a key metric for assessing individual-level risk in airborne transmission scenarios. The R_event is the expected number of secondary infections caused by a single infectious person in the same space over a specified duration. It reflects the transmission potential of the infector in a given environment and can be used to compare and classify the relative risk levels of different spaces. Equations (7) and (8) present the calculations for the probability of infection and the R_event, respectively. In Equation (8), No of susceptible persons refers to the number of individuals in the space who are potentially exposed to infection.
3.2. Quantitative Criteria for the Five-Level Risk Classification System Based on the REHVA Model
The REHVA model enables the quantitative assessment of airborne transmission risk in indoor environments by calculating the probability of infection (PoI) and the event reproduction number (R_event). This chapter proposes a five-level risk classification system—Monitor, Caution, Alert, High Risk, Critical—based on both the PoI and R_event values. The aim of this classification is to clearly communicate the relative risk levels for different types of indoor spaces and to support practical decision-making for infection control. It helps prioritize response actions depending on spatial conditions and provides guidance for appropriate ventilation and mitigation strategies. Each risk level is defined by considering both the probability of infection and R_event. Table 1 presents the quantitative classification of infection risk levels and corresponding response measures. The five-tier risk classification thresholds proposed in this study were determined with reference to the allowable risk ranges presented in the REHVA guidelines, and by comparing them with the infection probability intervals reported in studies based on the Wells–Riley model. In addition, the calculated results from the empirical cases analyzed in Section 4 (Scenario Design) were applied to adjust each threshold range to a more realistic level.
Table 1.
Quantitative classification of infection risk levels and corresponding response measures.
- Level 1: Monitor
At this level, the infection risk is extremely low, with the individual probability of infection estimated as below 1% and the R_event remaining under 0.1—indicating virtually no concern for secondary transmission. Even if an infectious person is present in the space, the likelihood of further spread is negligible, and the situation can be considered low risk. This level is typically observed in spacious environments with few occupants and adequate ventilation. For example, in aircraft cabins equipped with HEPA filters and high air exchange rates, the estimated probability of infection for passengers during a 2–3 h flight with one infected individual on board is less than 0.1%. Under such conditions, maintaining standard ventilation protocols is generally sufficient, and no additional control measures are deemed necessary [13].
- Level 2: Caution
This stage represents a relatively low but non-negligible level of risk, where the individual probability of infection ranges from approximately 1% to 5%, and the R_event remains below 0.5—meaning that one infected person would, on average, transmit the virus to fewer than 0.5 individuals (i.e., less than one in two). The Caution level is typically achievable in most indoor environments with adequate ventilation. According to the study by [14], when applying the Category I ventilation rate from [13], which is the most stringent among current building standards, the infection probability in most indoor spaces remains below 5%. For instance, in a well-ventilated, open-plan office, the infection probability over an 8-h period with one infectious person present was estimated at approximately 1.9%. At this level, the likelihood of transmission is low, but it is recommended to maintain adequate ventilation and continue basic infection control practices such as mask-wearing and hand hygiene.
- Level 3: Alert
This stage represents a moderate level of infection risk, where the individual probability of infection ranges from 5% to 10%. Within this range, the R_event value may approach 0.5 and, in some cases, come close to or slightly exceed 1.0, indicating that one infectious person could potentially infect approximately one additional individual. At the Alert level, there is a heightened concern that transmission may begin to escalate, and interventions such as increasing ventilation and reducing crowd density should be considered. For example, in a moderately ventilated mid-sized office where an infectious person remains for 8 h, the individual infection probability is estimated at around 7.5%, and the R_event is calculated at approximately 1.3, indicating that secondary transmission is likely. Even in well-ventilated large meeting rooms, if it is difficult to maintain physical distancing and there is significant vocal activity, infection probabilities of 6–7% may still occur. At this alert level, facility managers should take precautionary measures such as maximizing ventilation system performance, avoiding unnecessary crowding, and strictly restricting access for individuals exhibiting symptoms.
- Level 4: High Risk
This stage represents a high level of infection risk, where the individual probability of infection ranges from approximately 10% to 50%. At this level, the presence of an infectious individual poses a significant threat of transmission to multiple people within the space. The R_event value typically exceeds 1 and can increase several-fold, indicating a strong likelihood of cluster outbreaks. In the High Risk stage, it becomes necessary to restrict activities in the space and implement intensive ventilation and infection control measures. A notable example is the 2020 outbreak in a restaurant in Guangzhou, China, where one infected individual among approximately 20 customers led to 7–9 secondary infections, resulting in an estimated infection probability of 35–45% [15]. In this restaurant case, transmission occurred between adjacent tables in a poorly ventilated indoor setting, demonstrating that in enclosed and crowded environments, a single infected individual can easily spread the virus to multiple people. Similarly, in small offices with inadequate ventilation, the probability that one person could infect others may exceed 10%, and extended time spent in poorly ventilated buses or vehicles also presents a similarly high level of risk. At the High Risk level, use of the space should be restricted or suspended altogether. If use is unavoidable, all possible mitigation measures must be implemented, including enhancing ventilation, installing air purifiers, reducing occupancy, shortening exposure time, and enforcing mandatory mask-wearing.
- Level 5: Critical
This stage represents the most critical level of infection risk, where the individual probability of infection exceeds 50%, meaning that more than half of the occupants could become infected. At this level, the R_event value surpasses 3, indicating a strong likelihood of superspreading events, where a single infected individual can lead to widespread transmission. A representative example is the Skagit Valley choir outbreak, where an indoor choir rehearsal lasting 2.5 h resulted in approximately 87% of participants becoming infected [14]. Another notable case occurred in Chicago in 2020, where 55 out of 81 participants (68%) in an indoor fitness class became infected. The combination of intense physical activity, increased respiratory output, lack of mask usage, and a confined indoor environment contributed to the severity of transmission in that event [16]. At this stage, immediate suspension of space operations and thorough disinfection procedures are required. Individuals who may have been exposed must undergo testing and isolation. The Critical level indicates that large-scale indoor transmission has already occurred or is imminent. Therefore, public warnings should also be issued to prevent access, and the highest level of response must be implemented. Although the probability of infection (PoI) and the R_event are closely related, their risk levels do not always align. This discrepancy arises from differences in their calculation methods and the type of outcome each metric represents. Accordingly, when determining infection risk levels, it is advisable to take the more conservative (i.e., higher) of the two values. That is, even if PoI is low, a high R_event implies the need to focus on blocking further transmission; conversely, if the R_event is low but PoI is high, individual-level protection and mitigation measures are essential.
4. Scenario Design
This study aims to validate the proposed five-tier infection risk classification system by applying the REHVA model-based infection risk assessment framework to various real-world indoor environments. The assessment involves calculating the probability of infection (PoI) and the event reproduction number (R_event) under different environmental conditions. To this end, we designed a series of scenarios by combining key variables such as ventilation conditions, occupancy duration, room size, and mask usage. These scenarios were constructed to reflect realistic infection situations that could occur in typical indoor settings. In particular, the scenarios focus on variables that are known to significantly influence the spread of airborne infectious diseases.
- Spatial characteristics: Floor area , ceiling height , room volume
- Ventilation conditions: Air changes per hour (ACH), air cleaner performance (CADR), total first-order loss rate.
- Occupancy and exposure parameters: Number of infectious persons, number of susceptible persons, exposure duration.
- Mask Usage: Mask efficiency—infectious person and susceptible person.
- Activity level: Breathing rate, quanta emission rate.
Each variable was defined within typical ranges based on previous literature and relevant standards such as EN 16798-1 and the REHVA guidebook [13]. In some cases, the ventilation rate was not specified in the original report; in such instances, a conservative estimate was made by referencing the legally required minimum ventilation rates for the given building type and citing ventilation data from facilities of the same type. For example, the air change rate was set at 3 ACH for offices, 4–5 ACH for classrooms, and 20 ACH or higher for aircraft cabins. The scenarios were classified into two types: epidemiological case-based scenarios and theoretical general scenarios. The epidemiological case-based scenarios were modeled to closely reflect real-world outbreaks, using reported data on infection counts, space characteristics, and ventilation conditions. In contrast, the theoretical scenarios were designed to simulate a range of potential conditions in multi-use indoor facilities, allowing for an analysis of how different variable combinations affect risk levels. Table 2 presents the list of simulation cases for both epidemiological and theoretical scenarios. The quanta emission rates were defined based on data specific to COVID-19 (Severe Acute Respiratory Syndrome Coronavirus 2).
Table 2.
Scenario list for epidemiology and theory-based infection simulation.
5. Quantitative Risk Assessment Results
This chapter presents the quantitative results for probability of infection (PoI) and the event reproduction number (R_event) derived from applying the REHVA model to 10 different indoor environment scenarios. The scenarios are categorized into two groups: actual outbreak-based cases grounded in epidemiological data, and theoretical virtual cases designed to reflect a variety of indoor spatial conditions. In each case, infection risk was assessed under the assumption of a single infectious individual being present. Input parameters were determined in accordance with REHVA guidelines and included key variables such as quanta emission rate of the infector, exposure duration, indoor volume, ventilation rate, and mask usage. For real-world cases, ventilation conditions and occupancy were modeled based on published literature to enhance accuracy. A comparison was also conducted between model predictions and actual outbreak sizes to evaluate the model’s explanatory power and margin of error. Based on the calculated values, both the PoI and R_event were evaluated using the five-tier infection risk classification system proposed in this study. Risk levels were assigned accordingly, and a comparative analysis was conducted focusing on differences by space type, ventilation condition, and exposure duration. Table 3 provides a comprehensive summary of the scenario-based simulation results. The “Accuracy” reported in Table 3 refers to a relative error-based accuracy, calculated by comparing the observed number of infections with the REHVA model predictions.
Table 3.
Scenario-based quantitative risk assessment and result comparison using the REHVA model.
In the case of the Guro Call Center in Korea, the REHVA model demonstrated relatively high predictive accuracy. This can be attributed to the setting’s simple layout, fixed seating arrangement, prolonged exposure under consistent conditions, and voice-intensive work, which allowed for a more precise estimation of the quanta emission rate. As such, the Guro Call Center represents an ideal case where the fundamental assumptions of the REHVA model are well met. In contrast, the Daegu church outbreak involved vigorous group singing and repeated attendance by some individuals. Actual transmission likely included multiple exposures, secondary transmission, and household spread. The spatial complexity and behavioral variability in this setting exceeded the simplified assumptions of the model, resulting in lower predictive accuracy. In the Guangzhou restaurant case, most infections occurred only at specific tables aligned with the direction of airflow from an air conditioner. Due to the REHVA model’s assumption of uniform exposure across the entire space, it was unable to reflect such localized transmission hotspots. This case highlights the need for computational fluid dynamics (CFD) modeling to capture spatially heterogeneous airflow patterns in localized environments. In the Skagit Valley choir outbreak, the REHVA model predicted the number of actual infections with a high degree of accuracy, suggesting strong applicability in settings involving prolonged indoor vocal activity under homogeneous exposure conditions. This is attributed to the fact that activity types, exposure duration, and spatial layout were well-defined and consistent—conditions under which the activity intensity and environmental parameters were clearly characterized, thereby enhancing model accuracy. In the Chicago indoor fitness class case, the environment involved intense physical activity in a confined space with inadequate ventilation, representing a high-risk transmission scenario. However, variations in participant exposure time and movement patterns were not fully captured by the model, likely contributing to reduced predictive accuracy. Across all five epidemiological cases simulated using the REHVA model, the infection risk level was consistently classified as Level 5 (High Risk) in the five-tier risk framework. Subsequently, the model was applied to theoretical indoor scenarios to assess infection risk based on the R_event values. The results showed that in both large restaurants and shared office spaces, the R_event exceeded 1.0, placing them in the “High Risk” category—indicating that a single infectious individual could generate multiple secondary infections. In particular, large restaurants are characterized by the absence of masks, closely spaced seating, and sustained vocal activity during meals, which significantly increases the likelihood of aerosol-based airborne transmission. In such environments, if the ventilation rate is insufficient, the R_event may rapidly exceed 3.0, highlighting the need for targeted intervention strategies. In contrast, public libraries were identified as the lowest-risk environments among all simulated scenarios. This is attributed to the quiet atmosphere, minimal vocal interaction, and relatively favorable mechanical ventilation conditions. University lecture halls also showed relatively low risk under typical conditions, particularly due to short class durations and the presence of basic ventilation systems. Department store retail spaces, while characterized by short individual dwell times due to their walk-through layout, may still pose elevated risks during peak hours. During such periods, transient crowd density increases sharply, indicating that these spaces require heightened infection risk management, particularly under crowded conditions.
6. Discussion and Conclusions
Based on the numerical framework proposed by REHVA, this study quantitatively assessed the risk of airborne transmission in indoor environments and developed a five-tier risk classification system grounded in the probability of infection (PoI) and the event reproduction number (R_event). When applied to 10 real-world indoor scenarios, including documented outbreak cases, the model was found to reasonably reproduce observed infection patterns. In particular, the predicted PoI and R_event values based on a single infector showed trends that aligned closely with actual secondary case counts, supporting the model’s practical applicability and explanatory power. Key variables—such as air change rate (ACH), occupancy time, room volume, and mask usage—demonstrated high sensitivity in influencing both the PoI and R_event. This indicates the model’s utility in establishing tailored infection control guidelines for different spaces. For instance, in identical environments, doubling the ventilation rate consistently resulted in a more than 50% reduction in PoI. Moreover, population size and spatial density (i.e., number of people per unit area) were confirmed to be critical determinants of infection probability. Even under the same ventilation conditions, higher occupancy or crowding led to a sharp increase in the R_event, emphasizing the need for multi-factorial rather than single-variable risk assessment. The proposed five-tier system can quantitatively capture subtle differences in environmental conditions, thereby serving as a more practical reference for infection control decision-making compared to conventional qualitative assessments. Nevertheless, some parameters—such as the quanta emission rate—exhibit high variability depending on situational factors, making accurate input estimation difficult. In scenarios where the presence of an infector is uncertain, a conservative approach to interpretation is recommended. In conclusion, this study demonstrated the feasibility of using the REHVA-based model to establish quantitative infection risk thresholds and apply them to various indoor settings. The findings suggest strong potential for comparative risk evaluation and evidence-based decision-making in infection control, tailored to the characteristics of the space and its occupants. Future research will consider multi-source infection scenarios by analyzing, in conjunction with CFD simulations, the changes in risk distribution according to the location and number of infection sources within the same space. Furthermore, a robust assessment framework will be developed to address temporal, seasonal, and regional variations by incorporating quanta emission rates that reflect differences in transmission characteristics among virus variants. In addition, an integrated system will be created by linking IoT sensors with an AI-based prediction platform to enable real-time risk level estimation, thereby allowing direct application to infection control measures and facility operations.
Author Contributions
Conceptualization, H.K.; Methodology, H.K. and D.S.; Software, H.K. and D.S.; Validation, H.K., S.H. and Y.S.; Formal analysis, H.K. and D.S.; Investigation, H.K. and Y.S.; Resources, H.K. and Y.S.; Data curation, H.K. and S.H.; Writing—original draft preparation, H.K., S.H., Y.S. and D.S.; Writing—review and editing, H.K., S.H., Y.S. and D.S.; Visualization, H.K.; Supervision, H.K. and D.S.; Project administration, H.K. and D.S.; Funding acquisition, H.K. All authors have read and agreed to the published version of the manuscript.
Funding
This work was supported by the Korea Institute of Energy Technology Evaluation and Planning (KETEP) and the Ministry of Trade, Industry & Energy (MOTIE) of the Republic of Korea (No. 20212020800120).
Data Availability Statement
The original contributions presented in this study are included in the article. Further inquiries can be directed to the corresponding author.
Conflicts of Interest
Author Hyuncheol Kim was employed by the i CAPTAIN Co., Ltd. The remaining author declare that the research was conducted in the absence of any commercial or financial relationships that could be construed as a potential conflict of interest.
Correction Statement
This article has been republished with a minor correction to the Data Availability Statement. This change does not affect the scientific content of the article.
References
- Park, S.Y.; Kim, Y.M.; Yi, S.; Lee, S.; Na, B.J.; Kim, C.B.; Kim, J.I.; Kim, H.S.; Kim, Y.B.; Park, Y.; et al. Coronavirus disease outbreak in call center, South Korea. Emerg. Infect. Dis. 2020, 26, 1666–1670. [Google Scholar] [CrossRef] [Scilit] [PubMed]
- Shin, J.; Kim, S.; Koh, K. Economic impact of targeted government responses to COVID-19: Evidence from the large-scale clusters in Seoul. J. Econ. Behav. Organ. 2021, 192, 199–221. [Google Scholar] [CrossRef] [Scilit] [PubMed]
- Wood, S.G.; Craske, J.; Burridge, H.C. Relating quanta conservation and compartmental epidemiological models of airborne disease outbreaks in buildings. Sci. Rep. 2023, 13, 17335. [Google Scholar] [CrossRef] [Scilit] [PubMed]
- Sze To, G.N.; Chao, C.Y.H. Review and comparison between the Wells–Riley and dose-response approaches to risk assessment of infectious respiratory diseases. Indoor Air 2010, 20, 2–16. [Google Scholar] [CrossRef] [Scilit] [PubMed]
- Kurnitski, J.; Boerstra, A.; Franchimon, F.; Sikonczyk, I.; van Dijken, F.; Lungu, C.; Hovorka, F. REHVA COVID-19 Ventilation Calculator Documentation (Version 2.0); REHVA: Brussels, Belgium, 2021; pp. 1–8. [Google Scholar]
- Riley, E.C.; Murphy, G.; Riley, R.L. Airborne spread of measles in a suburban elementary school. Am. J. Epidemiol. 1978, 107, 421–432. [Google Scholar] [CrossRef] [Scilit] [PubMed]
- Feng, Y.; Fan, Y.; Luo, X.; Ge, J.A. Wells-Riley based COVID-19 infectious risk assessment model combining both short range and room scale effects. Beijing: Tsinghua University Press. Build. Simul. 2024, 17, 93–111. [Google Scholar] [CrossRef] [Scilit]
- Noakes, C.J.; Beggs, C.B.; Sleigh, P.A.; Kerr, K.G. Modelling the transmission of airborne infections in enclosed spaces. Epidemiol. Infect. 2006, 134, 1082–1091. [Google Scholar] [CrossRef] [Scilit] [PubMed]
- Kermack, W.O.; McKendrick, A.G. A contribution to the mathematical theory of epidemics. Proc. R. Soc. London. Ser. A Contain. Pap. A Math. Phys. Character 1927, 115, 700–721. [Google Scholar]
- Mwalili, S.; Kimathi, M.; Ojiambo, V.; Gathungu, D.; Mbogo, R. SEIR model for COVID-19 dynamics incorporating the environment and social distancing. BMC Res. Notes 2020, 13, 352. [Google Scholar] [CrossRef] [Scilit] [PubMed]
- Gaddis, M.; Manoranjan, V.; Streipel, J. Agent-Based Modeling to Simulate Aerosolized Transmission of SARS-CoV-2 inside Small Ventilated Spaces. COVID 2023, 3, 937–955. [Google Scholar] [CrossRef] [Scilit]
- Crawford, C.; Vanoli, E.; Decorde, B.; Lancelot, M.; Duprat, C.; Josserand, C.; Timsit, J.F.; Jilesen, J.; Bouadma, L. Modeling of aerosol transmission of airborne pathogens in ICU rooms of COVID-19 patients with acute respiratory failure. Sci. Rep. 2021, 11, 11778. [Google Scholar] [CrossRef] [Scilit] [PubMed]
- Wang, F.; Zhang, T.T.; You, R.; Chen, Q. Evaluation of infection probability of Covid-19 in different types of airliner cabins. Build. Environ. 2023, 234, 110159. [Google Scholar] [CrossRef] [Scilit] [PubMed]
- Miller, S.L.; Nazaroff, W.W.; Jimenez, J.L.; Boerstra, A.; Buonanno, G.; Dancer, S.J.; Noakes, C.; Kurnitski, J.; Marr, L.C.; Morawska, L. Transmission of SARS-CoV-2 by inhalation of respiratory aerosol in the Skagit Valley Chorale superspreading event. Indoor Air 2021, 31, 314–323. [Google Scholar] [CrossRef] [Scilit] [PubMed]
- Lau, Z.; Griffiths, I.M.; English, A.; Kaouri, K. Predicting the spatio-temporal infection risk in indoor spaces using an efficient airborne transmission model. Proc. R. Soc. A 2022, 478, 20210383. [Google Scholar] [CrossRef] [Scilit] [PubMed]
- Lendacki, F.R. COVID-19 outbreak among attendees of an exercise facility—Chicago, Illinois, August–September 2020. MMWR Morb. Mortal. Wkly. Rep. 2021, 70, 321–325. [Google Scholar] [CrossRef] [Scilit] [PubMed]

Disclaimer/Publisher’s Note: The statements, opinions and data contained in all publications are solely those of the individual author(s) and contributor(s) and not of MDPI and/or the editor(s). MDPI and/or the editor(s) disclaim responsibility for any injury to people or property resulting from any ideas, methods, instructions or products referred to in the content. |
© 2025 by the authors. Licensee MDPI, Basel, Switzerland. This article is an open access article distributed under the terms and conditions of the Creative Commons Attribution (CC BY) license (https://creativecommons.org/licenses/by/4.0/).