Abstract
Monitoring battery voltage is important to ensure a steady supply of energy. A crucial aspect to avoid failure is estimating the voltage required by the battery load. Lead acid batteries play a vital role as engine starters when the generators are activated. The generator engine requires an adequate voltage to initiate the power generation process. This article discusses three prediction models for estimating the voltage and degradation values based on data-driven methods. The machine-learning models used were Gaussian process regression (GPR), Support Vector Regression (SVR), and Random Forest. The prediction results were compared using evaluation metrics, such as the Mean Squared Error (MSE), Root Mean Squared Error (RMSE), and R-squared (R2). The implementation of the Internet of Things (IoT) was demonstrated to collect real-time battery data using a voltage sensor and a temperature sensor as inputs for the prediction model. According to the experiment, the Random Forest algorithm provided highly accurate predictions, with an RMSE of 0.0401, MAE of 0.0241, and R-squared of 0.9651.
1. Introduction
Rechargeable batteries are commonly used in various applications, such as data centers, telecommunication base stations, radio microwave systems, government buildings, storing energy in solar panels, and supplying energy to electric vehicles, medical devices, and consumer electronics [1,2]. They are frequently utilized as backup sources in the event of a failure in primary supply systems. A battery management system (BMS) was designed to monitor and control the charging and discharging of batteries, ensuring their safe and efficient operation. They are used in various applications including lithium-ion batteries [3,4] and lead-acids [5]. A BMS typically monitors parameters such as the voltage, current, temperature, internal resistance, and state of charge. It also includes circuits to protect against potential safety hazards.
Battery voltage refers to the electrical potential difference between the positive and negative terminals of a battery. It is a measure of the electrical energy available in a battery and is typically expressed in volts (V). The voltage of a battery determines its ability to provide electrical power to a device or system. As a battery discharges, its voltage gradually decreases until it reaches a certain cutoff value, indicating the end of its usable life. The specific voltage profile of a battery over time depends on various factors, including the battery characteristics, load conditions, and system design [6]. This is also a key factor in determining the state of charge (SoC) of a battery, which represents the remaining usable percentage of its capacity. The SoC is often estimated based on the battery’s output voltage, with a cut-off voltage indicating a zero SoC. Battery voltage fluctuations can pose challenges in various applications such as telecommunication towers, and monitoring systems are implemented to ensure stable operation and prevent hazards.
Battery voltage degradation refers to a decrease in the voltage capacity or performance of the battery. This is a common issue in lithium-ion batteries and can impact the overall reliability and efficiency of battery-powered systems [7]. Battery voltage fluctuations can also pose challenges in telecommunications towers, leading to poor management and other potential hazard [8]. The degradation mechanisms of lithium-ion batteries with Li4Ti5O12 (LTO) negative electrodes have been studied, and it has been found that the loss of active material in the positive electrode is a significant factor contributing to the capacity loss [9]. Various approaches have been proposed to address battery voltage degradation. One approach is the development of battery voltage-level monitoring systems that allow the real-time monitoring of battery usage and can help identify voltage fluctuations and potential hazards [8]. Another approach involves the use of battery management systems that regulate the charging and discharging processes to prevent overcharging, overvoltage, and excessive discharge, which can contribute to battery degradation [10]. However, the degradation of lead-acid batteries is primarily caused by complex and interconnected chemical and mechanical processes and presents a significant challenge in terms of their performance and lifespan [11]. The ability to predict the level of degradation and remaining battery life is crucial for both performance and economic reasons. Accurate estimation of the state of charge (SoC) and remaining battery life allows for better management of battery-powered systems, such as electric vehicles [12].
The emergence of the Internet of Things (IoT) has transformed the way data are gathered and analyzed across various domains [13]. In the context of battery monitoring and management, IoT offers a promising solution for real-time data acquisition and analysis [14]. By integrating IoT devices, sensors, and connectivity, we can gather comprehensive data on various parameters such as voltage [8,15] and temperature [8]. This rich dataset enables the development of predictive models and provides insights into the health conditions and remaining lifespan of lead–acid batteries.
A promising approach for prediction is Gaussian process regression (GPR). This is particularly useful in solving regression problems. GPR models the relationship between the input and output variables by assuming a Gaussian distribution over functions. It provides a flexible and non-parametric approach to regression, allowing accurate predictions with uncertainty estimation. One advantage of GPR is its ability to handle non-linear relationships and capture complex patterns in the data. It can be used with various types of data structures using different kernel functions [16]. The predictive distribution of the GPR for a new input location can be derived in a closed form, allowing for efficient prediction [17]. However, predicting new inputs using GPR can be computationally inefficient when dealing with large datasets [18]. To address this issue, researchers have proposed various approaches to accelerate GPR. One approach is the use of quantum algorithms, which can achieve quadratic speedup over their classical counterparts [18]. Additionally, the use of localization kernels has been explored to down weigh the contributions from distant data points, resulting in considerable speedups compared with the standard GPR [19]. GPR is a powerful machine-learning technique that can capture complex patterns and correlations in data, enabling accurate predictions and uncertainty estimation [20,21,22,23].
Support Vector Regression (SVR) and Random Forest (RF) are machine-learning algorithms commonly used for non-linear prediction tasks. SVR is a regression algorithm that uses support vector machines to perform a non-linear regression. It aims to find a hyperplane that best fits the training data while minimizing error. SVR can handle non-linear relationships between the input variables and the target variable by using kernel functions to transform the data into a higher-dimensional space where a linear relationship can be found. The choice of kernel function can significantly affect the performance of SVR models [24]. The RF is an ensemble learning method that combines multiple decision trees to make predictions. Each decision tree is trained on a random subset of the training data and a random subset of the input features. RF can handle nonlinear relationships by combining the predictions of multiple decision trees, which collectively capture the complex interactions between the input variables [25]. Both SVR and RF have been shown to be effective in non-linear prediction tasks. For example, in the context of short-term load forecasting, a hybrid model that combines SVR, gray catastrophe, and RF has been developed and shown to outperform alternative models in terms of forecasting accuracy [25].
In this case study, P.T. XYZ has not yet utilized the potential of the Internet of Things (IoT) technology for monitoring and Machine Learning to predict future voltage and degradation values. PT XYZ is an oil and gas (O&G) company that operates in the Rokan Block working area and contributes to the fulfillment of national energy needs. P.T. XYZ has 14 generator sets (gensets) placed at several vital operational locations such as data centers, towers, and gathering stations. Generators function as power backup sources for IT devices such as routers, switches, and trunked radio systems, to maintain connectivity and communication when the main power source is disrupted or fails.
Currently, battery monitoring is performed manually. It requires visits to the generator location once a week to inspect the battery voltage. The implementation of an automatic monitoring system is necessary because of the critical functions of these generators. If a generator fails, it can disrupt oil operations and affect the achievement of the daily lifting targets. Periodic manual monitoring may not be able to detect changes or issues that occur between the monitoring intervals. Therefore, the implementation of an automatic monitoring system is necessary owing to the critical functions of these generators. If a generator fails, it can disrupt oil operations and affect the achievement of the daily lifting targets. Therefore, in this study, the use of IoT was proposed as a voltage monitoring system and employed for operational data acquisition. The development of a predictive model using Gaussian Process Regression (GPR) is aimed at estimating voltage over time.
2. Related Works
A battery using the Internet of Things (IoT) is a technology that allows the monitoring of battery operation and performance in various applications. This involves the integration of battery monitoring systems with IoT infrastructure to enable real-time data acquisition, communication, and analysis. Several studies have explored the topic of battery monitoring using IoT. Ref. [26] proposed a battery monitoring system based on the IoT, which included a data acquisition system, communication system, and monitoring platform. Ref. [27] presented a battery monitoring system developed for a smart microgrid, utilizing IoT technology for data acquisition, cloud storage, and the human–machine interface (HMI). The average execution time for data acquisition to the cloud server in this system was found to be 19.54 ± 18.00 s, with a satisfactory result for data reliability [27]. Energy efficiency is another important aspect of IoT-based battery monitoring. Ref. [28] discussed the concept of the energy-efficient IoT and its potential to improve communication and information exchange in IoT systems. Ref. [29] focused on implementing an absolute battery monitoring system using the IoT to enhance battery life in battery-powered electric vehicles. This paper describes the use of a Cuk converter and voltage-based methods to determine the state of charge of batteries. Battery monitoring using IoT is a rapidly developing field with applications in various sectors, including smart grids, healthcare, and electric vehicles. The integration of the IoT technology enables real-time monitoring, data analysis, and improved battery performance [26,27,28,29].
Battery voltage prediction using Gaussian process regression (GPR) has been explored in several studies. Ref. [1] proposed two algorithms based on the GPR framework to predict the voltage corresponding to the future current profile demanded by the battery load. These data-driven algorithms aim to handle diverse battery operating conditions and have been tested on real-time industrial datasets, thereby demonstrating their viability for practical use [1]. Additionally, ref. [30] presented a comprehensive study using a long short-term memory-based method to predict the battery voltage. Although this paper does not explicitly mention Gaussian process regression, it provides insights into the effectiveness of different architectures and normalization techniques for voltage prediction. The study concluded that temperature had no noticeable impact on prediction accuracy, and applying data normalization did not consistently improve accuracy across different temperatures.
A method for predicting the voltage and lifetime of lead-acid batteries using machine-learning techniques was proposed [31]. The prediction models were developed using three modes: M1, M2, and M3. M1 was formed by four fixed voltage values over four weeks, M2 was formed by four previous voltage values from the prediction time, and M3 was formed by combining the four previous data with the last predicted data. The training data consisted of recordings from 10 lead acid batteries over 155 weeks, whereas the examined data for the model were captured over 105 weeks. A Convolutional Neural Network (CNN) was selected as the machine-learning method to train and predict the battery model. The M1 model did not achieve accurate predictions, except for the linear case. The M2 model successfully predicted the battery voltage and lifetime, although the curve did not fit smoothly. The M3 model achieved high prediction accuracy with a smooth curve. It is important to note that prediction accuracy is influenced by the number of input parameters used in the prediction and the need for consecutive input parameters. It is important to note that prediction accuracy is influenced by the number of input parameters used and the need for consecutive input parameters [31].
3. Material and Method
3.1. Experimental Setup
This study was conducted at an IT facility for P.T. XYZ, an oil and gas company in Indonesia. This location was selected for the experiment because of its status as an unmanned facility that ensured uninterrupted data collection and analysis. Monitoring experiments at this unmanned facility were highly appropriate. In this monitoring system, as shown in Figure 1, we opted to utilize voltage and temperature sensors, along with an Arduino microcontroller, to integrate and process data from both sensors. The Ethernet Shield module was used to connect the Arduino to the LAN network. This module enables Arduino to communicate with the server using the HTTP protocol. Here, we implement a Web API, which serves as an endpoint for receiving data from Arduino. The Web API processes requests sent by Arduino, extracts sensor data, and stores them in a database through a LAN network using a 10-m-long cable. It is important to note that the measured battery voltage is related to the flat open circuit voltage (OCV) condition. However, these data do not encompass situations where the battery is charged or used during normal operation.
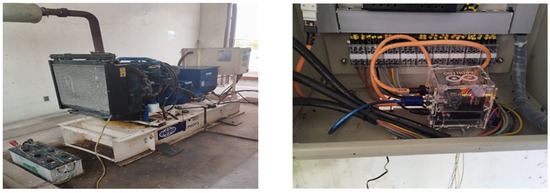
Figure 1.
Battery monitoring setup in genset facility.
3.2. Experimental Design
Figure 2 shows the block diagram used in this study. First, we installed and tested an IoT monitoring system as a data-acquisition method. The collected voltage data were pre-processed by smoothing due to fluctuation and then split into training and testing sets with an 80/20 mechanism. The prediction model was then trained using the Gaussian Process Regression, Support Vector Regression, and Random Forest. A performance analysis was performed to evaluate the prediction model.
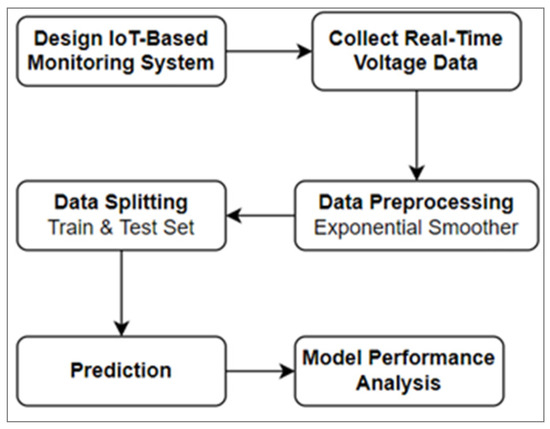
Figure 2.
Block diagram of study.
3.2.1. Proposed Predictive Model
Figure 3 shows the proposed predictive model of the lead acid battery. The process begins with obtaining data from lead-acid batteries, which is the primary focus of this investigation. Real-time data regarding voltage levels at specific time points were collected. Subsequently, a voltage prediction model was developed to project voltage values based on the available data. Using this model, the decrease or degradation in voltage levels over time can be estimated. The results of this analysis provide crucial information regarding the performance and conditions of lead-acid batteries. This information can provide valuable insights for decision-making regarding the maintenance and performance optimization of batteries.
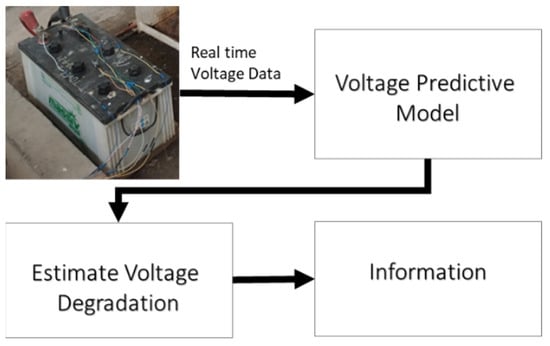
Figure 3.
Lead acid battery predictive model.
3.2.2. IoT-Based Monitoring System
The monitoring system, as shown in Figure 4, was operated using a 25-volt direct current (DC) sensor and DS18B20 temperature sensor. These two sensor types were selected because of their capability to measure battery voltage and ambient temperature. The data collected by these sensors were then transmitted via HTTP over a LAN network and subsequently stored in a database for further analysis and processing.
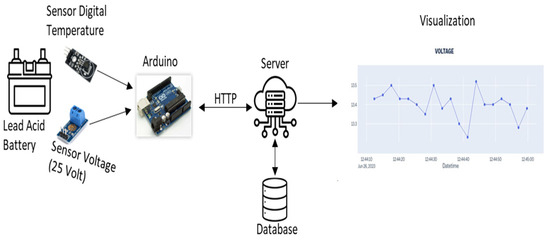
Figure 4.
Proposed monitoring system sketch.
The acquired data were then visualized using a dedicated dashboard, which provided a comprehensive and user-friendly interface for monitoring voltage over time. The visualization in Figure 5 shows the voltage and degradation values over time in seconds, providing a real-time view of trends, which enables stakeholders to gain insights into voltage variations and patterns, ultimately aiding in the prediction and assessment of the battery voltage.
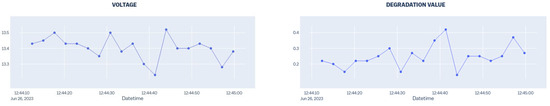
Figure 5.
Voltage and degradation value visualization over time.
3.2.3. Real-Time Data Acquisition Process
This section provides a comprehensive overview of the real-time data acquisition process, as shown in Figure 6. It outlines the key components involved, including the Arduino microcontroller, sensor, and internet communication module, which, in this instance, is an Ethernet Shield. The Arduino program retrieves data from the sensor and transmits them via HTTP requests by utilizing both POST and GET methods. Subsequently, the Arduino interfaces with a Web API possess an appropriate endpoint for receiving these requests. On the Web API side, the received data are stored securely in a database.
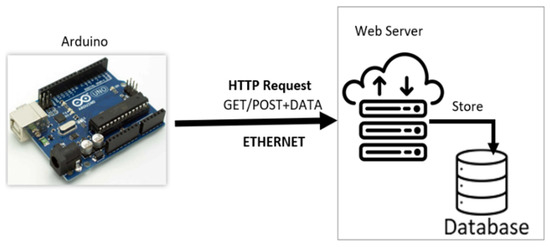
Figure 6.
Arduino HTTP Request.
3.2.4. Dataset
Table 1 shows a sample of the dataset used in this study, which was collected through real-time monitoring of a single battery at intervals of seconds (s). Data Training will be taken from a sample of data with a time range of 26 June 2023 12:44:12.403 until 26 June 2023 17:59:54.437 or equivalent to 5 h of monitoring, which has a data composition resulting in 7200 data rows with a portion of 80% or 5760 data rows for training and 20% or 1440 data rows for testing.

Table 1.
Sample of dataset.
The input matrix (X) has dimensions of 7200 (N observations) × 3 (D features), namely:
- N Observations (7200): This means that 7200 observations or datasets are included in the matrix. Each observation represents 1 s from the previous 24 h for a single battery unit.
- D Features (3): There are 3 features or variables were recorded for each observation, namely, Voltage, Temperature, and Degradation Value.
Thus, the input matrix (X) will have 7200 rows and three columns, where each row represents data from one second in the previous 24 h and each column represents the Voltage, Temperature, and Degradation Value.
Here is a more detailed explanation of data parameters:
- Datetime: This is the timestamp indicating when the measurement data were obtained.
- Voltage: This parameter measured the voltage of the battery at the time of measurement.
- Temperature: This refers to the ambient temperature where the battery is located.
- Degradation Value: This value is calculated based on the baseline value minus the measured voltage. . These degradation values may indicate changes in the battery. However, there is not always a direct correlation between voltage changes and deeper degradation values.
3.2.5. Data Preprocessing
Before making the predictions, the first crucial step was data preprocessing. In the context of this model diagram, as shown in Figure 2, we applied an exponential smoothing technique to pre-process the gathered data. Exponential smoothing serves as a data-smoothing method designed to mitigate noise and random fluctuations. This is particularly beneficial when dealing with data exhibiting high levels of volatility and erratic variation, as shown in Figure 7a. This approach contributes to the generation of more refined data, which can be observed by comparing the original and smoothed data, as shown in Figure 7b, where smoothing makes the fluctuation level appear sharper. The implementation of the exponential smoother formula on the time measurement and voltage datasets involves the following steps:
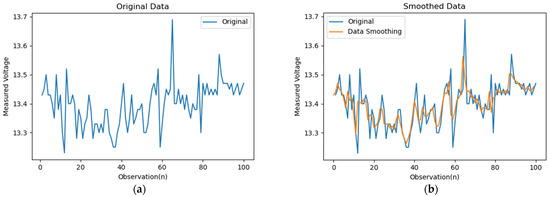
Figure 7.
(a) Trend of original voltage data. (b) Smoothed voltage data during 100 observations.
- The initial value of smoothed data was determined from the first observation, in the voltage dataset.
- We then chose the smoothing constant α to control the desired level of smoothing.
- The formula = α x + (1 − α) x was used to calculate the smoothed value at each time t, where is the voltage value at time t and is the previous smoothed value.
- This step was applied to each voltage observation, resulting in a new dataset with a smoothed voltage value.
3.2.6. Model Prediction and Performance Analysis
We used scikit-learn to construct an accurate predictive model for data analysis and considered three algorithms: Gaussian Process Regression (GPR), Support Vector Regression (SVR), and Random Forest. Each algorithm possesses unique characteristics and capabilities for handling various data types. Using appropriate parameter combinations, our aim was to select the most suitable model for predicting the desired outcomes. The main step in building a prediction model is to define model parameters. Table 2 displays the parameters used in the model.
Table 2.
Model parameters.
After making the predictions, the final step involved performance analysis. We compared the prediction results with actual data in the testing dataset to assess the accuracy of the model predictions. Evaluation metrics, such as the Root Mean Squared Error (RMSE), Mean Absolute Error (MAE), and R-squared, were used to measure the model’s performance. The formulas used for the performance evaluation metrics are as follows:
The RMSE measures how well the predicted values approximate the actual values. For the voltage or degradation value prediction, represents the actual value and represents the predicted value. RMSE calculates the square root of the average of the squared differences between the actual and predicted values.
The MAE measures the absolute magnitude of the error between the predicted and actual values. In the voltage or degradation value predictions, represents the actual value and represents the predicted value. MAE calculates the average of the absolute values of the differences between the actual and predicted values.
R-squared, or the coefficient of determination, is a statistical measure that indicates how well the variation in the target variable (actual values) can be explained by the statistical model. The R-squared value indicates the extent of the observed.
4. Result and Discussion
4.1. Prediction Performance
A comprehensive set of metrics is employed to evaluate the performance of the proposed prediction model. Based on the performance evaluation results of the three tested algorithms with various smoothing factors listed in Table 3, several conclusions can be drawn. Overall, Random Forest demonstrated the best performance among the GPR and SVR algorithms. With a Smoothing Factor of approximately 0.3, Random Forest is capable of providing highly accurate predictions with a Root Mean Squared Error (RMSE) of 0.0401, Mean Absolute Error (MAE) of 0.0241, and R-squared () of 0.9651. These results highlight the remarkable ability of Random Forest to predict the battery voltage and degradation values. On the other hand, GPR and SVR exhibited good performance, although not as strong as Random Forest. GPR has an RMSE ranging from 0.0445 to 0.0477, MAE from 0.0277 to 0.0309, and R2 from 0.9532 to 0.9580, whereas SVR has an RMSE ranging from 0.1354 to 0.1379, MAE from 0.0921 to 0.0923, and R2 from 0.6548 to 0.6557. Therefore, based on these results, it can be concluded that Random Forest is an excellent choice for predicting battery voltage and degradation values online, particularly with a Smoothing Factor of approximately 0.3.
Table 3.
Model performance comparison with exponential smoothing.
4.2. Improving Model Performance by Smoothing Factor
The application of exponential smoothing to battery data that tends to be volatile led to a significant improvement in the prediction results. Figure 8 compares the prediction results of the application of exponential smoothing with a smoothing factor and the model without smoothing. It is evident that exponential smoothing produces more accurate predictions, particularly when the battery data experience sharp fluctuations. Battery data often experience sharp fluctuations, particularly in situations of intensive use or rapid environmental change. The implementation of exponential smoothing helps to mitigate these fluctuations by assigning more weight to the recent data. Thus, this method makes the model more responsive to recent changes in battery conditions. The results of the experiment show that exponential smoothing with a smoothing factor of approximately 0.3 produces more accurate prediction results, as shown in Table 3, compared to higher smoothing factor values and compared with the model without smoothing, as shown in Table 4. Therefore, for datasets with fluctuating characteristics, exponential smoothing can be a highly effective strategy for enhancing prediction quality.
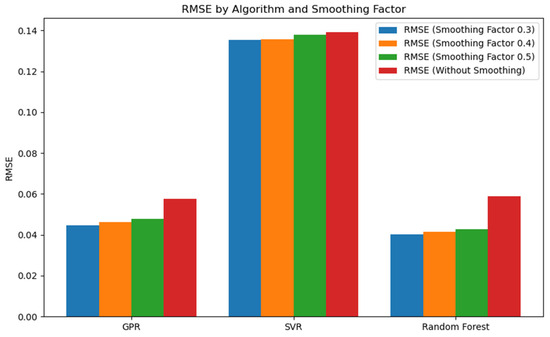
Figure 8.
RMSE score comparison.
Table 4.
Model performance comparison without exponential smoothing.
4.3. Discussion
This section provides insightful recommendations for enhancing the predictive model based on the obtained results and a comprehensive data analysis. Beyond the currently considered voltage and temperature parameters, there exists the potential to integrate additional features sourced from parameters such as battery current, state of health, and state of charge. Expanding the feature set allows the model to capture intricate relationships more effectively, thereby leading to more precise predictions. Moreover, optimizing these hyperparameters plays a crucial role in influencing the performance of the model. Further exploration and fine-tuning of these hyperparameters can significantly increase the accuracy of the model. Additionally, employing ensemble techniques by combining predictions from diverse models holds promise for further improving prediction accuracy and bolstering reliability, as it addresses the specific limitations of individual models.
5. Conclusions
This study reaffirms the superiority of the Random Forest algorithm in predicting the battery voltage and degradation value. Additionally, models such as Gaussian Process Regression (GPR) and Support Vector Regression (SVR) have demonstrated satisfactory performances. The utilization of Internet of Things (IoT) technology in data collection significantly contributes to the quality and accuracy of the data used in the prediction model. However, it is important to note that the reliability and accuracy of IoT data also play crucial roles in the final prediction quality. Therefore, careful implementation and maintenance of IoT infrastructure are key to the success of this approach. Furthermore, the importance of data smoothing in addressing battery data fluctuations has proven to be significant in enhancing the prediction quality.
Author Contributions
Conceptualization, N.S.; methodology, N.S. and H.W.; software, H.W.; validation, H.W.; investigation, H.W.; resources, H.W.; data curation, H.W.; writing—original draft preparation, N.S. and H.W.; writing—review and editing, N.S. and H.W.; visualization, H.W.; supervision, N.S.; funding acquisition, N.S. All authors have read and agreed to the published version of the manuscript.
Funding
This research was supported by Bina Nusantara University.
Institutional Review Board Statement
Not applicable.
Informed Consent Statement
Not applicable.
Data Availability Statement
The data presented in this study are available on request from the corresponding author. The data are not publicly available due to confidentiality agreement with the data provider.
Conflicts of Interest
The authors declare no conflict of interest.
References
- Pajovic, M.; Sahinoglu, Z.; Wang, Y.; Orlik, P.V.; Wada, T. Online data-driven battery voltage prediction. In Proceedings of the 2017 IEEE 15th International Conference on Industrial Informatics (INDIN), Emden, Germany, 24–26 July 2017; pp. 827–834. [Google Scholar] [CrossRef]
- Wibawa, U.; Pratama, B.; Hasanah, R.N. Lifetime prediction of lead-acid batteries in base-transceiver station. Int. J. Adv. Sci. Eng. Inf. Technol. 2017, 7, 1361–1366. [Google Scholar] [CrossRef][Green Version]
- Pengcheng, W.; Zhigang, C. Research on High Precision Lithium Battery Management System. IOP Conf. Ser. Earth Environ. Sci. 2019, 371, 052038. [Google Scholar] [CrossRef]
- Sathapornbumrungpao, T.; Moonjud, D.; Leeton, U. Battery Management System Using Relay Contactor by Arduino Controller for Lithium-ion Battery. Int. J. Chem. Eng. Mater. 2022, 1, 14–17. [Google Scholar] [CrossRef]
- Wang, P.; Zhu, C. Summary of Lead-acid Battery Management System. IOP Conf. Ser. Earth Environ. Sci. 2020, 440, 022014. [Google Scholar] [CrossRef]
- Rakhmatov, D. Battery voltage modeling for portable systems. ACM Transact. Des. Autom. Electron. Syst. 2009, 14, 1–36. [Google Scholar] [CrossRef]
- Qu, X.; Song, Y.; Liu, D.; Cui, X.; Peng, Y. Lithium-ion battery performance degradation evaluation in dynamic operating conditions based on a digital twin model. Microelectron. Reliab. 2020, 114, 113857. [Google Scholar] [CrossRef]
- Uwamahoro, R.; Mduma, N.; Machuve, D. A Battery Voltage Level Monitoring System for Telecommunication Towers. Eng. Technol. Appl. Sci. Res. 2021, 11, 7875–7880. [Google Scholar] [CrossRef]
- Liu, S.; Winter, M.; Lewerenz, M.; Becker, J.; Sauer, D.U.; Ma, Z.; Jiang, J. Analysis of cyclic aging performance of commercial Li4Ti5O12-based batteries at room temperature. Energy 2019, 173, 1041–1053. [Google Scholar] [CrossRef]
- Sardju, A.P.; Abbas, M.Y.H. Perancangan Charge Controller Untuk Pengisian Baterai Pada Sel Surya. J. Sci. Eng. 2021, 4, 47. [Google Scholar] [CrossRef]
- Ruetschi, P. Aging mechanisms and service life of lead-acid batteries. J. Power Sources 2004, 127, 33–44. [Google Scholar] [CrossRef]
- Srirattanawichaikul, W.; Wirasanti, P. Evaluation of lightweight battery management system with field test of electric bus in campus transit system. Int. J. Electr. Comput. Eng. 2020, 10, 6202. [Google Scholar] [CrossRef]
- Kumar, R.; Kumar, P.; Kumar, Y. Time Series Data Prediction using IoT and Machine Learning Technique. Procedia Comput. Sci. 2020, 167, 373–381. [Google Scholar] [CrossRef]
- Ashton, K. That ‘Internet of Things’ Thing. RFID J. 2009, 22, 97–114. [Google Scholar]
- Setiawan, B.J. Design and Build Voltage and Current Monitoring Parameters Device of Rechargeable Batteries in Real-Time Using the INA219 GY-219 Sensor. J. Energy Mater. Instrum. Technol. 2023, 4, 58–71. [Google Scholar] [CrossRef]
- Yoshikawa, Y.; Iwata, T. Gaussian Process Regression With Interpretable Sample-Wise Feature Weights. IEEE Trans. Neural Netw. Learn. Syst. 2023, 34, 5789–5803. [Google Scholar] [CrossRef]
- Alodat, M.T.; Shakhatreh, M.K. Gaussian process regression with skewed errors. J. Comput. Appl. Math. 2020, 370, 112665. [Google Scholar] [CrossRef]
- Chen, M.-H.; Yu, C.H.; Gao, J.L.; Yu, K.; Lin, S.; Guo, G.D.; Li, J. Quantum algorithm for Gaussian process regression. Phys. Rev. A 2022, 106, 012406. [Google Scholar] [CrossRef]
- Gogolashvili, D.; Kozyrskiy, B.; Filippone, M. Locally Smoothed Gaussian Process Regression. Procedia Comput. Sci. 2022, 207, 2717–2726. [Google Scholar] [CrossRef]
- Sanz-Alcaine, J.M.; Sebastián, E.; Sanz-Gorrachategui, I.; Bernal-Ruiz, C.; Bono-Nuez, A.; Pajovic, M.; Orlik, P.V. Online voltage prediction using gaussian process regression for fault-tolerant photovoltaic standalone applications. Neural Comput. Appl. 2021, 33, 16577–16590. [Google Scholar] [CrossRef]
- Richardson, R.R.; Osborne, M.A.; Howey, D.A. Gaussian process regression for forecasting battery state of health. J. Power Sources 2017, 357, 209–219. [Google Scholar] [CrossRef]
- Li, Q.; Liu, G.; Zhang, J.A.; Su, Z.; Hao, C.; He, J.; Cheng, Z. The prediction of capacity trajectory for lead–acid battery based on steep drop curve of discharge voltage and gaussian process regression. Electronics 2021, 10, 2425. [Google Scholar] [CrossRef]
- Zhang, Y.; Zhang, H.; Tian, Z. The Application of Gaussian Process Regression in State of Health Prediction of Lithium Ion Batteries. In Proceedings of the 2018 IEEE 3rd Advanced Information Technology, Electronic and Automation Control Conference, IAEAC 2018, Chongqing, China, 12–14 October 2018; pp. 515–519. [Google Scholar] [CrossRef]
- Yaohao, P.; Albuquerque, P.H.M. Non-Linear Interactions and Exchange Rate Prediction: Empirical Evidence Using Support Vector Regression. Appl. Math. Financ. 2019, 26, 69–100. [Google Scholar] [CrossRef]
- Fan, G.-F.; Yu, M.; Dong, S.-Q.; Yeh, Y.-H.; Hong, W.-C. Forecasting short-term electricity load using hybrid support vector regression with grey catastrophe and random forest modeling. Util Policy 2021, 73, 101294. [Google Scholar] [CrossRef]
- Hu, Y. Research on Battery Monitoring Technology Based on Internet of Things. In Proceedings of the 2021 International Conference on Signal Processing and Machine Learning (CONF-SPML), Stanford, CA, USA, 14 November 2021; pp. 150–153. [Google Scholar] [CrossRef]
- Friansa, K.; Haq, I.N.; Santi, B.M.; Kurniadi, D.; Leksono, E.; Yuliarto, B. Development of Battery Monitoring System in Smart Microgrid Based on Internet of Things (IoT). Procedia Eng. 2017, 170, 482–487. [Google Scholar] [CrossRef]
- Suresh, K.; Babu, M.R. Towards Effective Communication Technique for Energy Efficient Internet of Things. Int. J. Eng. Res. Afr. 2015, 21, 184–190. [Google Scholar] [CrossRef]
- Jasiha, E.J.; Dr, R.R. Implementation of ABMS with Cuk Converter for Enhanced Battery Life Using Internet of Things. Int. J. Mod. Trends Sci. Technol. 2021, 7, 107–111. [Google Scholar] [CrossRef]
- Zhu, D.; Campbell, J.J.; Cho, G. Battery Voltage Prediction Using Neural Networks. In Proceedings of the 2021 IEEE Transportation Electrification Conference & Expo (ITEC), Chicago, IL, USA, 21–25 June 2021; pp. 807–812. [Google Scholar] [CrossRef]
- Wang, Z.-H.; Hendrick; Horng, G.-J.; Wu, H.-T.; Jong, G.-J. A prediction method for voltage and lifetime of lead–acid battery by using machine learning. Energy Explor. Exploit. 2020, 38, 310–329. [Google Scholar] [CrossRef]


Disclaimer/Publisher’s Note: The statements, opinions and data contained in all publications are solely those of the individual author(s) and contributor(s) and not of MDPI and/or the editor(s). MDPI and/or the editor(s) disclaim responsibility for any injury to people or property resulting from any ideas, methods, instructions or products referred to in the content. |
© 2023 by the authors. Licensee MDPI, Basel, Switzerland. This article is an open access article distributed under the terms and conditions of the Creative Commons Attribution (CC BY) license (https://creativecommons.org/licenses/by/4.0/).