Article

Body Weight Loss Efficiency in Overweight and Obese Adults in the Ketogenic Reduction Diet Program—Case Study

by
Gordana Markovikj
1,
Vesna Knights
1,* and
Jasenka Gajdoš Kljusurić
2
1
Faculty of Technology and Technical Sciences-Veles, University St. Kliment Ohridski-Bitola, Dimitar Vlahov bb, 1400 Veles, North Macedonia
2
Faculty of Food Technology and Biotechnology, University of Zagreb, Pierottijeva 6, 10000 Zagreb, Croatia
*
Author to whom correspondence should be addressed.
Appl. Sci. 2023, 13(19), 10704; https://doi.org/10.3390/app131910704
Submission received: 1 September 2023 / Revised: 22 September 2023 / Accepted: 25 September 2023 / Published: 26 September 2023

Abstract

:

Featured Application

The appropriate application of data analysis techniques provides relevant data that can be used in designing strategies and programs for the general population, such as the effectiveness of weight loss programs and key similarities or differences in the eating habits of similar and/or different population groups.

Abstract

Obesity stands out as an ongoing pandemic today, and it is crucial to recognize the basic factors that influence it in the observed group and to intervene through lifestyle changes. Therefore, in this work, the k ketogenic diet (E = 6280 ± 210 kJ) was used in a weight loss program for two regionally different groups (including 200 participants) from southeastern European countries (Republic of North Macedonia (n = 100) and Kosovo (n = 100)). The applied data analysis revealed similarities and differences in (ii) the consumption of certain food groups (e.g., 0.5–1 kg Nuts/week; in region 1 is consumed by 11.3% of participants while in region 2 by 37.8%, respectively) and (ii) anthropometric indicators of excess body mass (body mass index and waist-to-hip ratio). Nutritional intervention with a ketogenic diet also reduces the intake of sweet and salty snacks that are rich in carbohydrates. The average expected time to reach the target body mass was 112 days, and the results of the progress of all participants were presented after 120 days. The results show regional differences, especially in women; in group 1, 73.91% achieved a body mass index in the healthy range (<25 kg/m2), while in group 2, the success rate was 81.69%. Understanding the different eating habits in the mentioned regions is key here, and it was shown that in region 2, over 40% of the participants consume 500–1000 g of seeds per week. The above indicates that the results of this study and regional differences can be considered when designing strategies and intervention programs in the lifestyle of overweight and obese people in similar environments. The study also shows that the ketogenic diet is one of the useful dietary intervention approaches used to change eating habits that will show results relatively quickly.

1. Introduction

In the human population, obesity has become a pandemic of the modern era [1]. Numerous diseases and health complications are associated with obesity and excess body weight and are manifested in cardiovascular diseases, various types of cancer, hypertension, type 2 diabetes, polycystic ovary syndrome (PCOS), and many others [2,3]. But less often considered is the social isolation and mental state [4] often accompanied with anxiety and depression [5], which Berry [6] describes as follows: “Imprisoned in every fat man, a thin man is wildly signaling to be let out”. Research shows that one of the important steps in “releasing the thin man” and solution to “globesity” [7] is the establishment of a balanced diet, adequate physical activity, and changing behavior and lifestyle [2,3,4,5,6,7,8].
Therefore, a number of strategies have been launched at the world level, in the design of appropriate educational programs and body weight regulation programs, because this implies an improvement in the general condition of the population [9,10], with the aim to start at childhood because prevention is better than to cure [11].
The parameter used to classify moderately active people into groups of malnourished, normally nourished, obese, or overweight people is the body mass index (BMI) as a ratio of body mass to the square of body height (kg/m2). Values of the BMI for normal nourished individual is in the range of 18.5–25 kg/m2, while the classification of “overweighed” starts with a BMI > 25 kg/m2, and obesity with a BMI ≥ 30 kg/m2 [7].
Flegal et al. [12] investigated the changes in body height, body mass, and BMI in the period from 1999 to 2016, analyzing the data available in the sources as (i) the National Health and Nutrition Examination Survey (NHANES) [13], (ii) National Health Interview Survey (NHIS) [14], and (iii) Behavioral Risk Factor Surveillance System (BRFSS) [15]. The mean height of the female and male population remained the same (1.76 m for men and 1.62 m for women), while the body mass values have shown a proportional increase within the observed years (1999 to 2016), and thus BMI increased proportionally. Unfortunately, from the average BMI in the population in 1999 (men: 27.6 kg/m2; women 28.1 kg/m2), the values for men and women increased to 29.1 kg/m2 and 29.6 kg/m2, respectively [12].
Individuals who decide to reduce their body mass, which will consequently result in a reduction in their BMI, often want to see some results hastily, otherwise they rapidly return to their old food patterns and/or behavior, wherefore the yo-yo effect occurs, meaning that the person then feels even worse [16]. Therefore, the perception of effective weight loss is especially necessary for people with a BMI ≥ 30 kg/m2 in order to remain stable after restrictive energy intake.
Forehand recognition of the factors that influence an individual’s increased body weight (eating habits) helps nutritionists and medical doctors design appropriate body weight regulation programs in which the ketogenic diet pattern is often used, which may modify lipid profile and the inflammatory state of the body [17] and can help with weight loss, visceral adiposity, and appetite control [18]. Drabińska et al. [17] highlighted the presence of different ketogenic diets depending on the amount of carbohydrates, but the majority of them are characterized by the minimization of energy and carbohydrate intake [19]. In the standard ketogenic diet, there is a preferred share of carbohydrates under 5% in the daily energy intake, while the share of fats is dominant (≈60%), and the remaining part is made up of proteins (35%) [20]. The limited intake of carbohydrates, with a dominant share of fats and a moderate intake of protein, results in the use of ketone bodies from fat metabolism. Because of the limited intake of carbohydrates, the primary way of producing energy from glucose is utilizing fat as its primary source of energy, i.e., nutritional ketosis [17,18]. The ketogenic diet with a reduced daily energy intake can be beneficial for weight loss [17,18,19]; however, one should not ignore the regional differences (due to, for example, body composition, eating habits, and preferences) that have proven to be significant in weight loss programs as well [20].
Therefore, the aim of our study was to investigate the (i) similarities and/or differences in the food habits of the participants from two southeastern European countries, (ii) the relationship of the anthropometric indicators related to unhealthy nourishment (body mass index and waist-to-hip ratio) with the consumption of certain foods and health problems, as well as the (iii) effectiveness of the ketogenic diet pattern on two regionally different groups in the same program of body weight reduction.

2. Materials and Methods

This study included 200 overweight and obese adults (% of them are females) who participated in a cross-sectional case study. The study was conducted in two countries in southern Europe, the Republic of North Macedonia (Group 1: 100 participants, 31% male and 69% female) and Kosovo (Group 2: also 100 participants, 13% male and 87% female). All participants were enrolled in the body weight reduction program and signed consent for their data to be used for scientific purposes, considering and respecting all GDPR principles. None of the participants dropped out of the program. The study was conducted in accordance with ethical permission (code 10-168/1 approved on 28 April 2022).
The data collected for each participant were based on their (i) medical condition and family history related to overweight/obesity, (ii) dietary habits related to the intake of foods with high (snacks (salty/sweet), seeds, nuts, sweet and carbonated drinks) and low energy densities (fruits and vegetable), before the weight loss program, and (iii) anthropometric data (body height, body mass, chest, abdomen, waist, hips, biceps, and thigh circumferences) before and after 120 days of being enrolled in the program. The participants’ anthropometric data were collected following the recommendation [20]. For each participant, a targeted body mass was set (which corresponds to a body mass index in the range of 24–25 kg/m2). Basic data of the participants at the beginning of the program are listed in Table 1.
The food intake of both groups during the weight loss program based on the ketogenic diet was controlled and based on the average daily energy and nutrient intake presented in Table 2.
To determine the differences in the mean values of consumed certain foods between the observed groups, an analysis of variance (ANOVA) was performed, while a principal components analysis was performed to determine the factors of similarity or difference (dietary habits vs. anthropometric parameters and personal data) in the mentioned regions. In order to graphically highlight the prevalence of certain diseases (which are more common in overweight and obese people) in the observed regions and according to gender, a heat map was used, where higher and/or lower values were highlighted in different colors. With the aim of clearer data analysis (changes in WHR, BMI, and BM in the weight loss program) and potential deviation and characterized symmetry of data distribution (depending on region, age, gender, and family prevalence of obesity/overweight), a box plot was used.

3. Results

3.1. Determining the Level of Nutrition and Eating Habits before Body Weight Reduction Program

In order to assess the condition of each individual included in the program, it is important to determine the degree of overweight and adjust the approach depending on whether the participant is overweight or obese. For each participant, the expected time to reach the target body mass was calculated according to the Wishnofsky equation [8]. The average expected duration of the adapted ketogenic diet was 112 days (ranging from 60 to 380 days). For the majority of the male population, the time frame for reaching the targeted body weight was 180 to 380 days.

3.1.1. Consumption of Different Food Groups

In order to determine the intake of certain foods during the day, the respondents provided information on quantitative intake according to the presented qualitative models [22], and the results are shown in Table 3. The daily consumption of drinks (carbonated drinks and water) is presented in the Appendix A (Table A1).
The results show significant differences for the consumed amounts for the participants from the same group but related to gender, as well as between groups.
Female participants have a strong preference for sweets, in both regions, and their consumption between 101 and 200 g (37.7% from Group 1) dominates, while almost a third of respondents from Group 2 (29.9%) consume more than 200 g of sweet food per day, which, according to the interview data, included chocolate, cakes, biscuits, and candies.
For respondents who singled out high values of fruit intake, it is important to emphasize that according to the interview, it is clear that it was about candied and dried fruit, while in the case of vegetables, fried vegetables and stuffed vegetables were often mentioned. Southeast Europe abounds in vegetables that are stuffed with cheese and/or meat and vegetables that are consumed as a salad, but are fried or baked in oil (e.g., roasted peppers in oil with garlic), the energy value of which is significantly higher compared to raw vegetables prepared for a salad or cooked. Comparing the nutrition facts of 100 g of raw green papers [23] with 30 kcal and 0% fat with the same pepper but stuffed with cheese [24], the energy values are almost seven times higher (200 kcal, 67.5% of fat).
Specific foods eaten during the day are nuts and seeds, for which the amounts are different regarding regional differences and different food habits. A study conducted in Serbia gave an overview of the chemical composition and nutritional characteristics of nuts and seeds as food daily consumed in this region [25], indicating the nutrition richness and corresponding composition of this food, but also how it is high in energy.

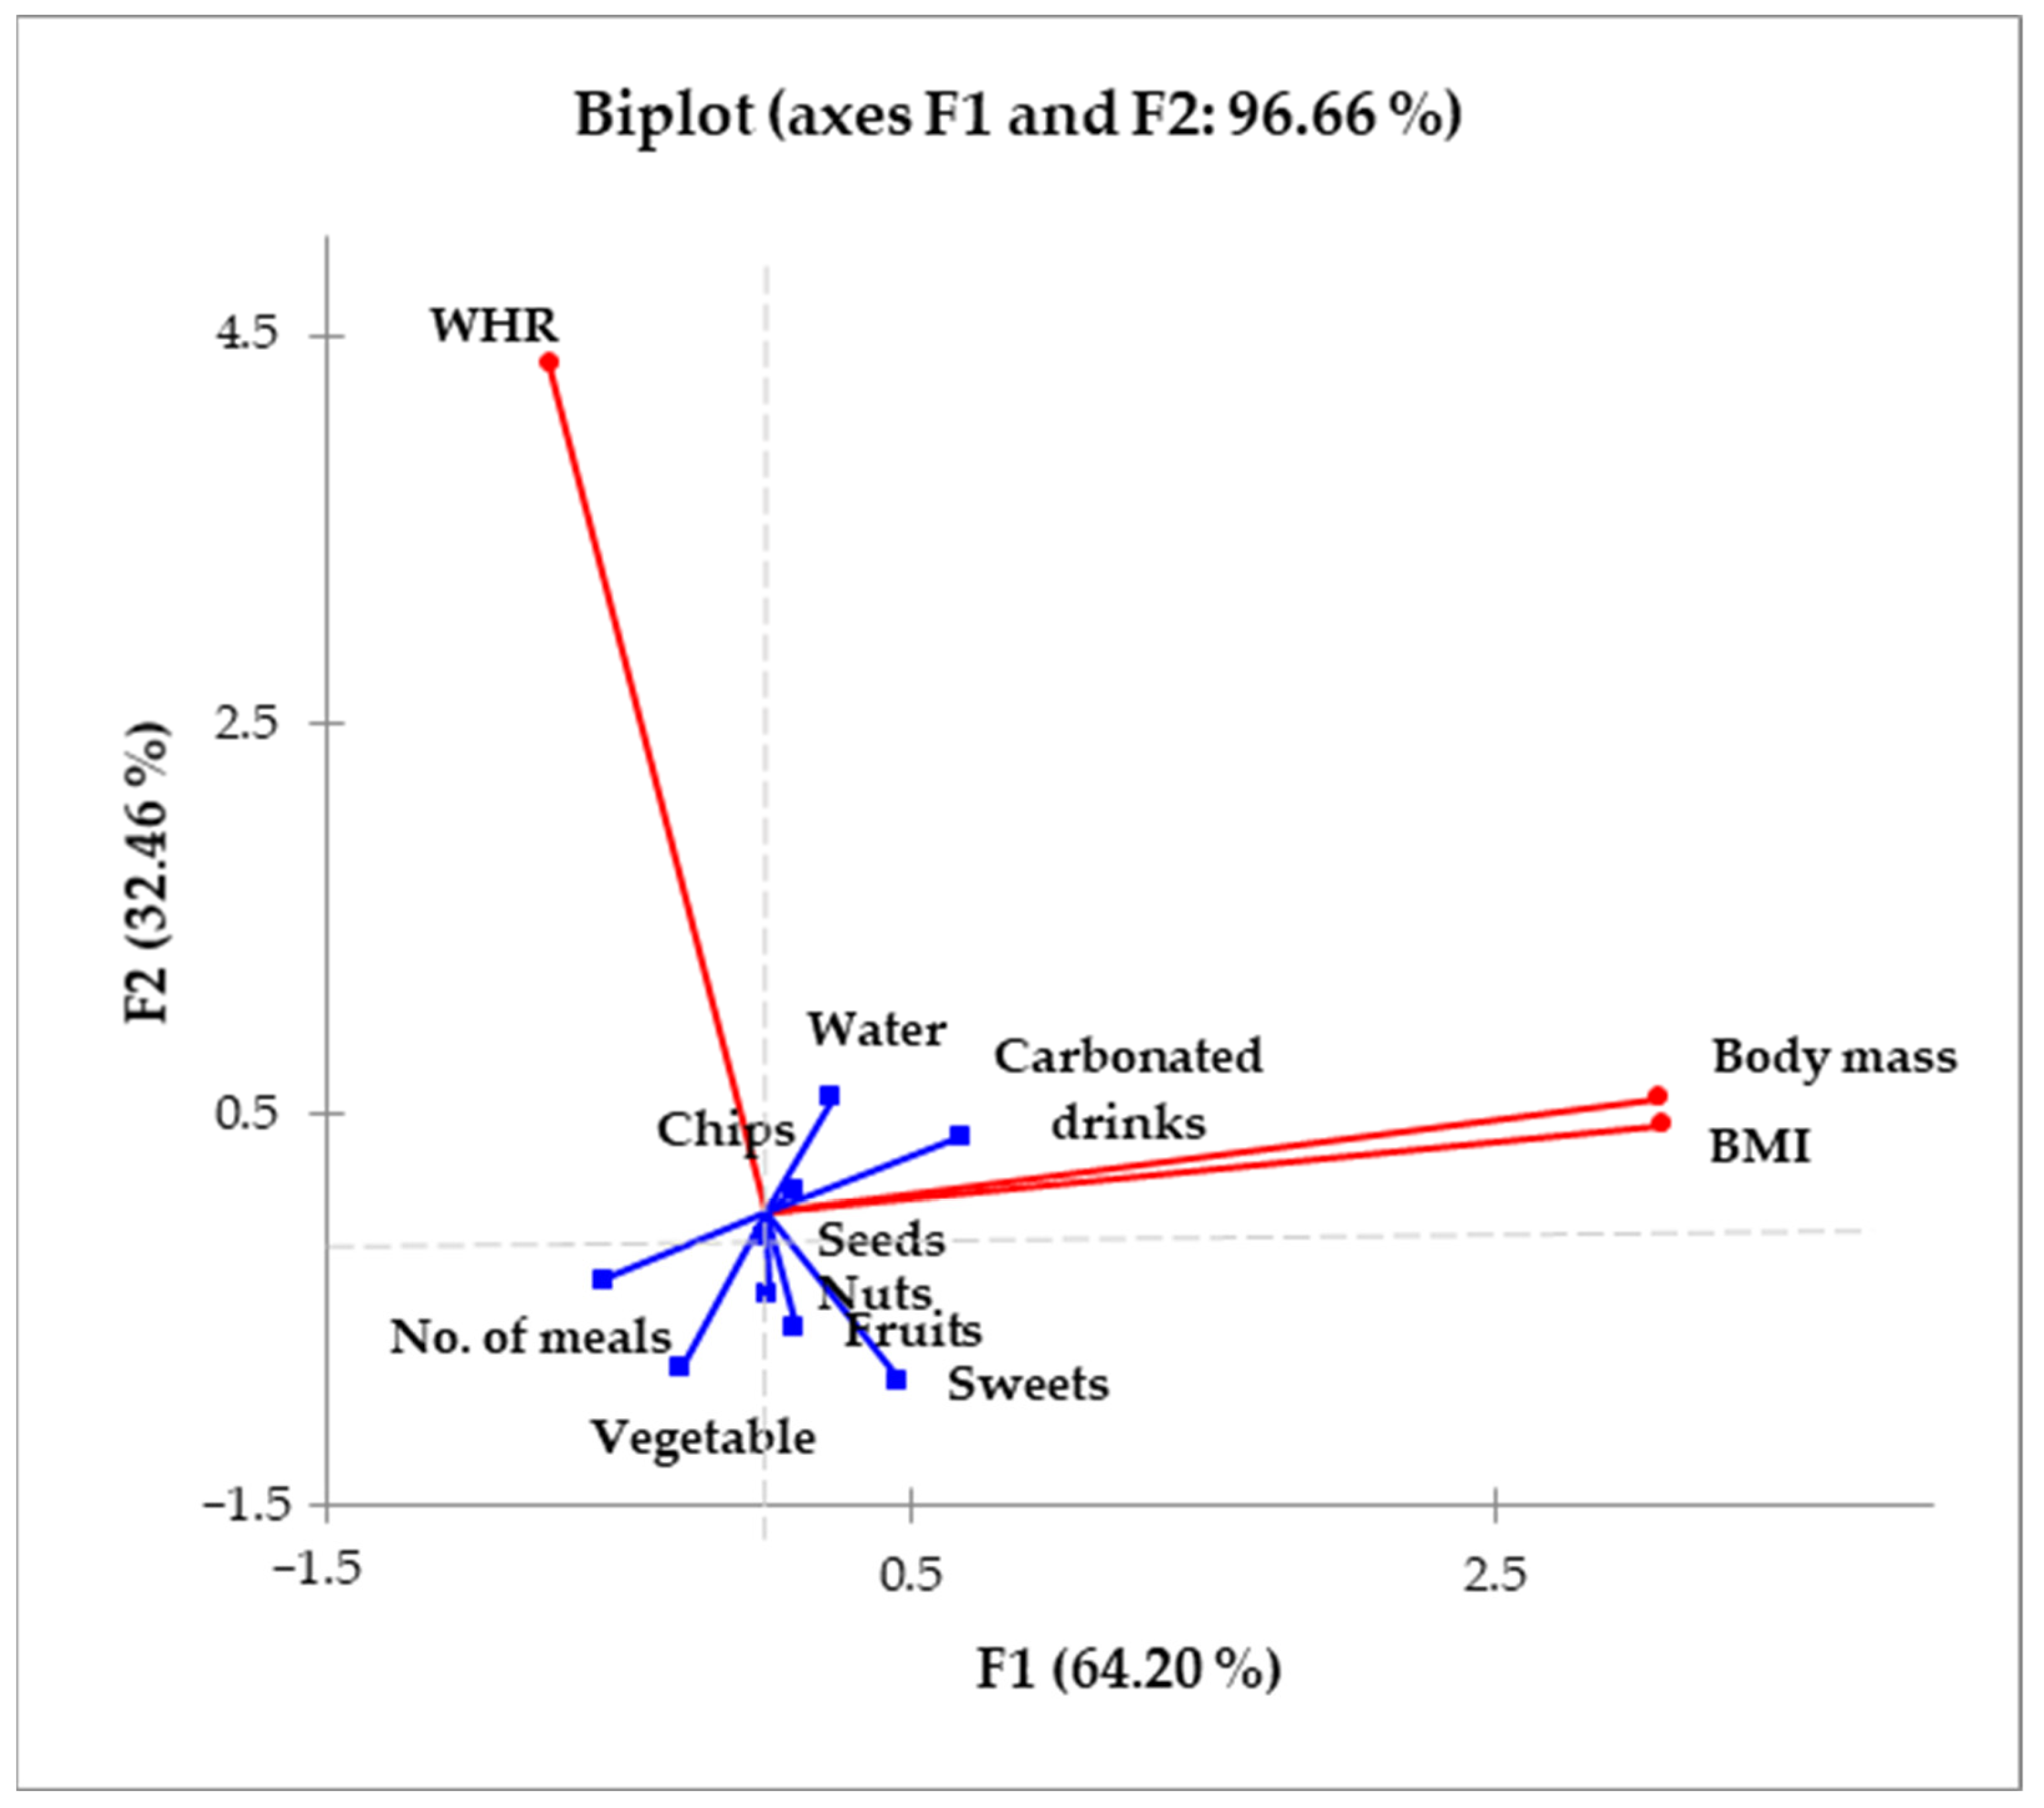
3.1.2. Body Mass Index as the Indicator of Level of Nourishment

The first indicator of the need for body weight reduction, in the average population, is the body mass index (BMI). It is calculated as the ratio of body mass (in kg) to the square of body height (in meters). According to the classification according to the body mass index [26], obese people have a body mass index in the range of 25–29.9 kg/m2, and the obesity category is divided into three classes: I obesity class (BMI 30–34.9 kg/m2) and extreme obesity, which is defined as BMI > 35 kg/m2, where the II class of obesity is in the BMI range of 35–39.9, and the third (obesity class III) denotes BMI values > 40 kg/m2. In the first group (Region 1) the overweight group is dominant (30%), while in Group 2 (Region) the obesity group, class I, is the dominant one, followed by the overweight group (25%), as presented in Figure 1.
During the first medical examination, answers were collected through an interview, and one of the important issues was the incidence of overweight/obesity in the family (Table A2) as well as diagnosed health problems, for which the prevalence in the examined group is presented using a heat map (Figure 2) because this enables the observation of potential grouping in the observed groups [27] and at the same time highlights the differences in values (dark green—the lowest proportion and gradation to dark red—the highest value). Helicobacter pylori was not present in the group of respondents, while hypertension was extremely high in the male population in Group 2. Thyroid problems were dominant in the female population and steatosis in the male population. Dyslipidemia is a health problem equally appearing in the obese/overweight participants with a slightly higher incidence in the female population in Group 2.

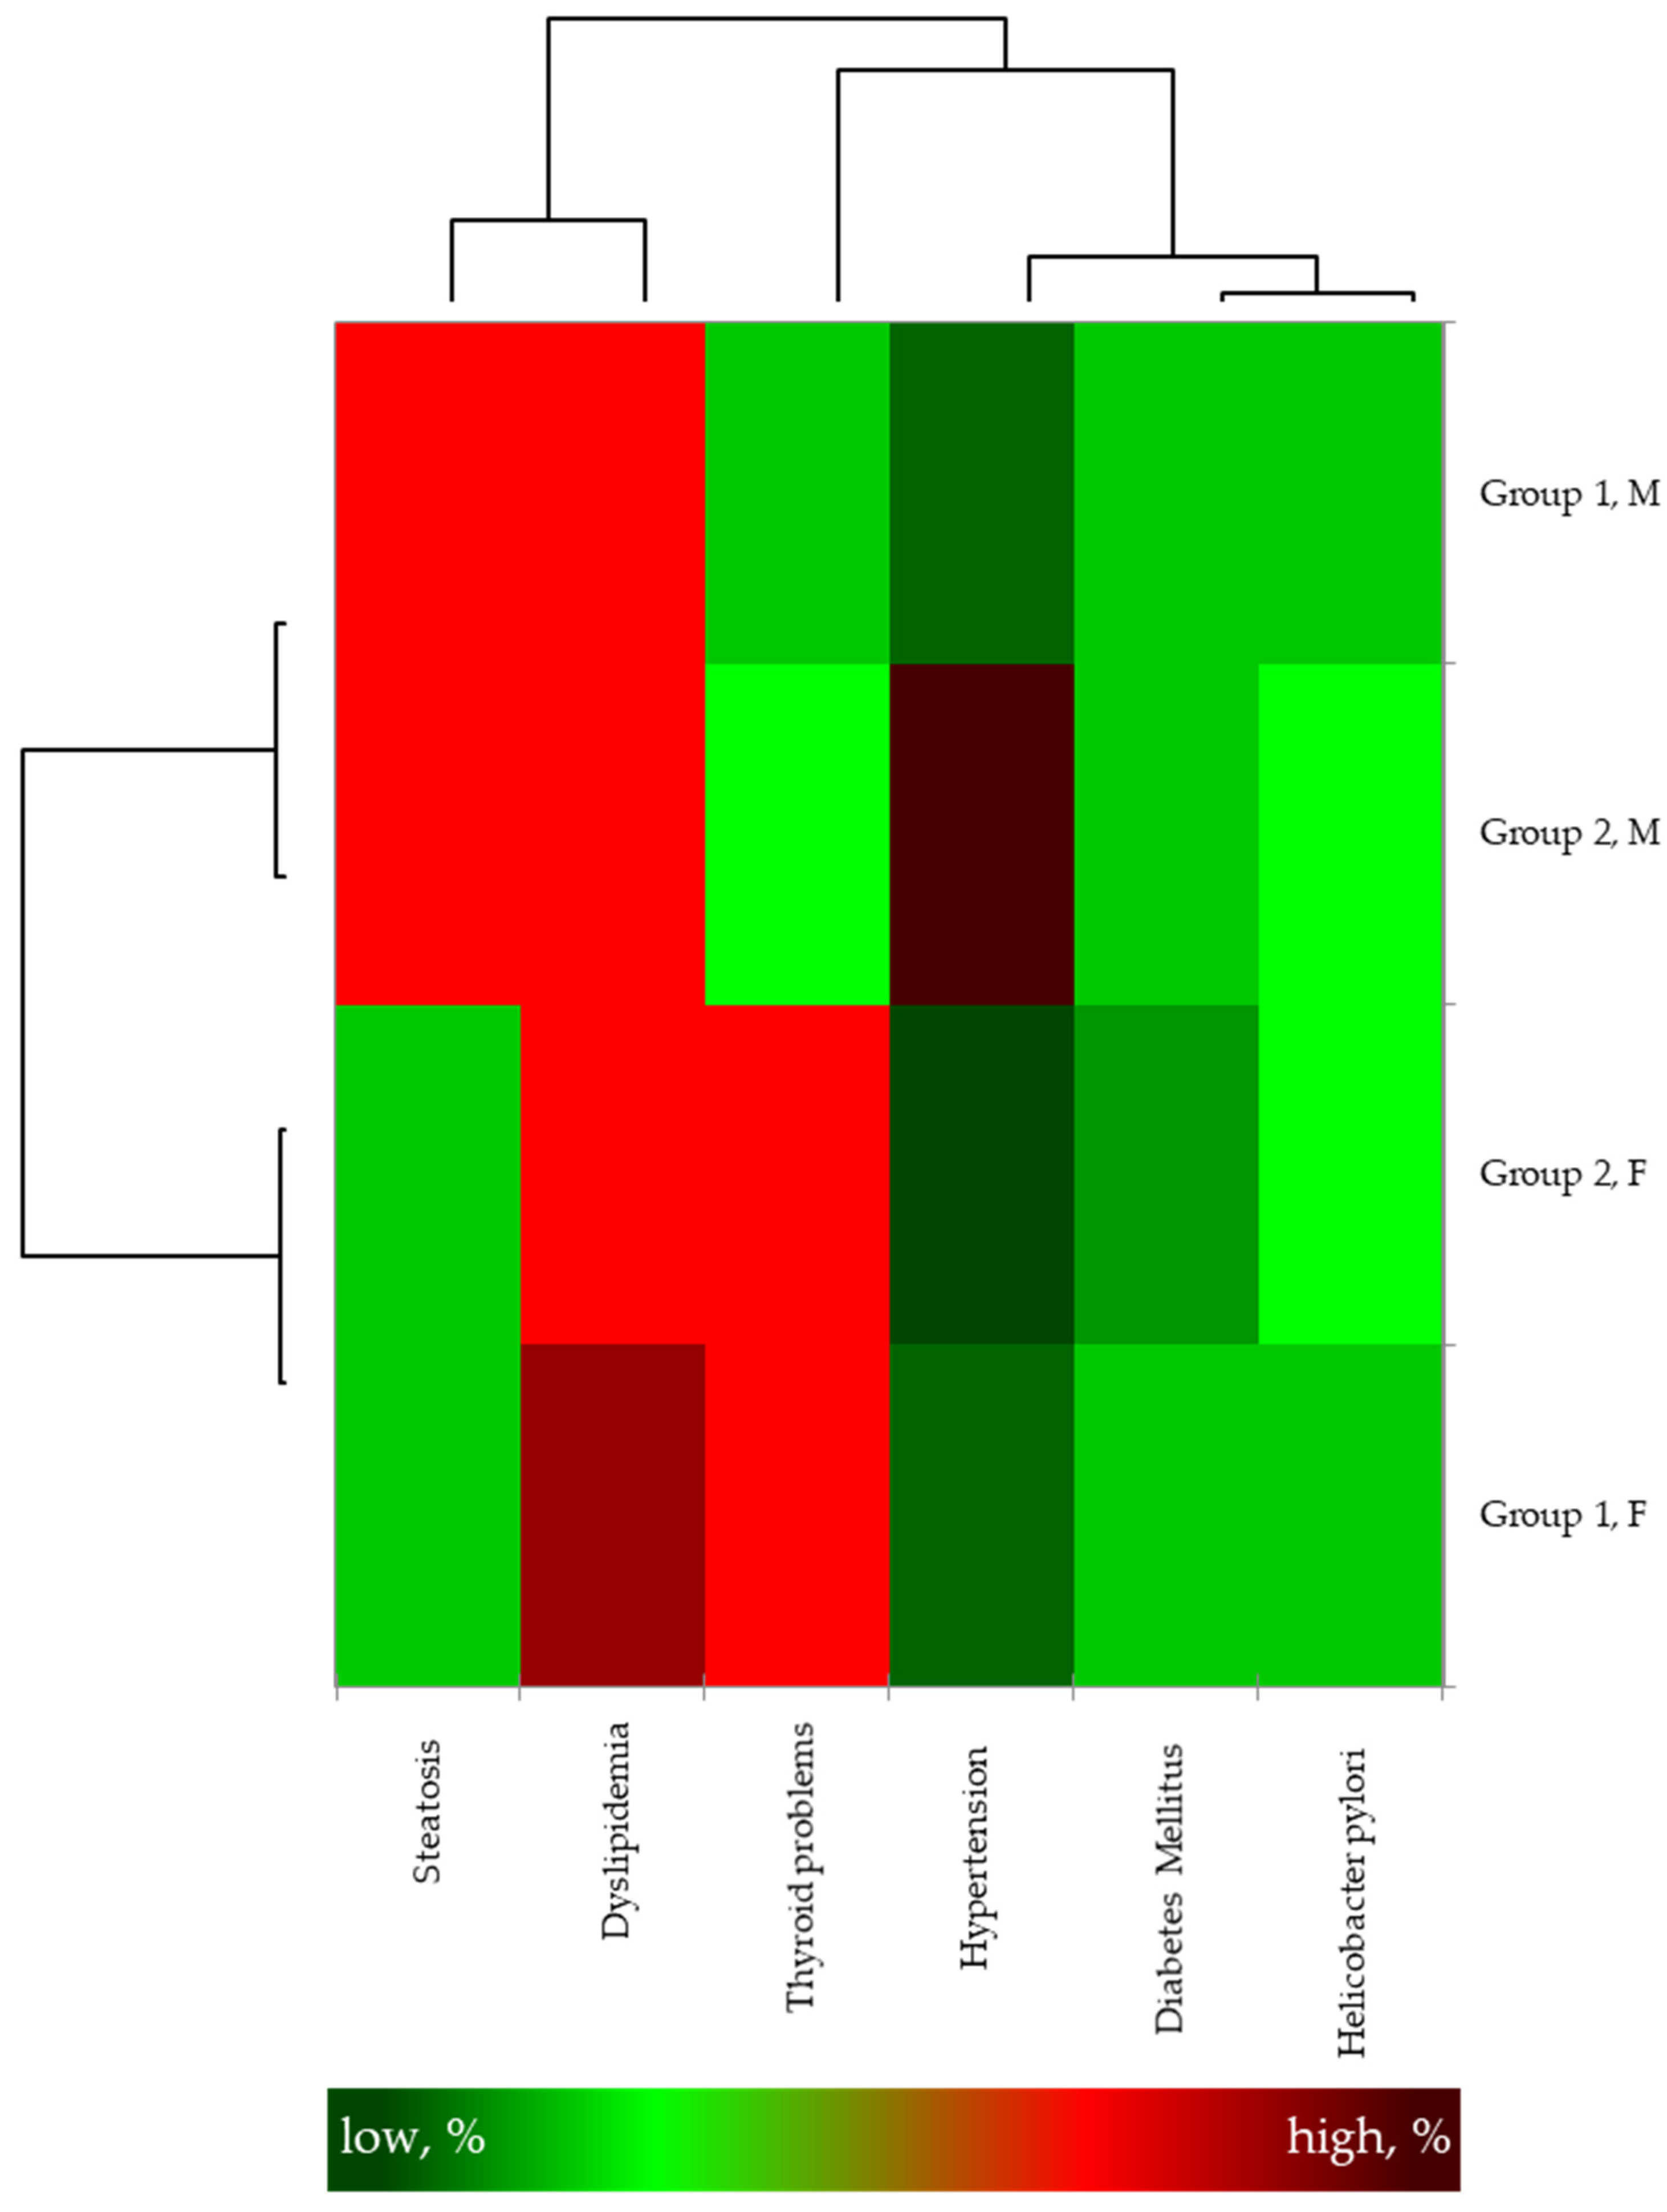
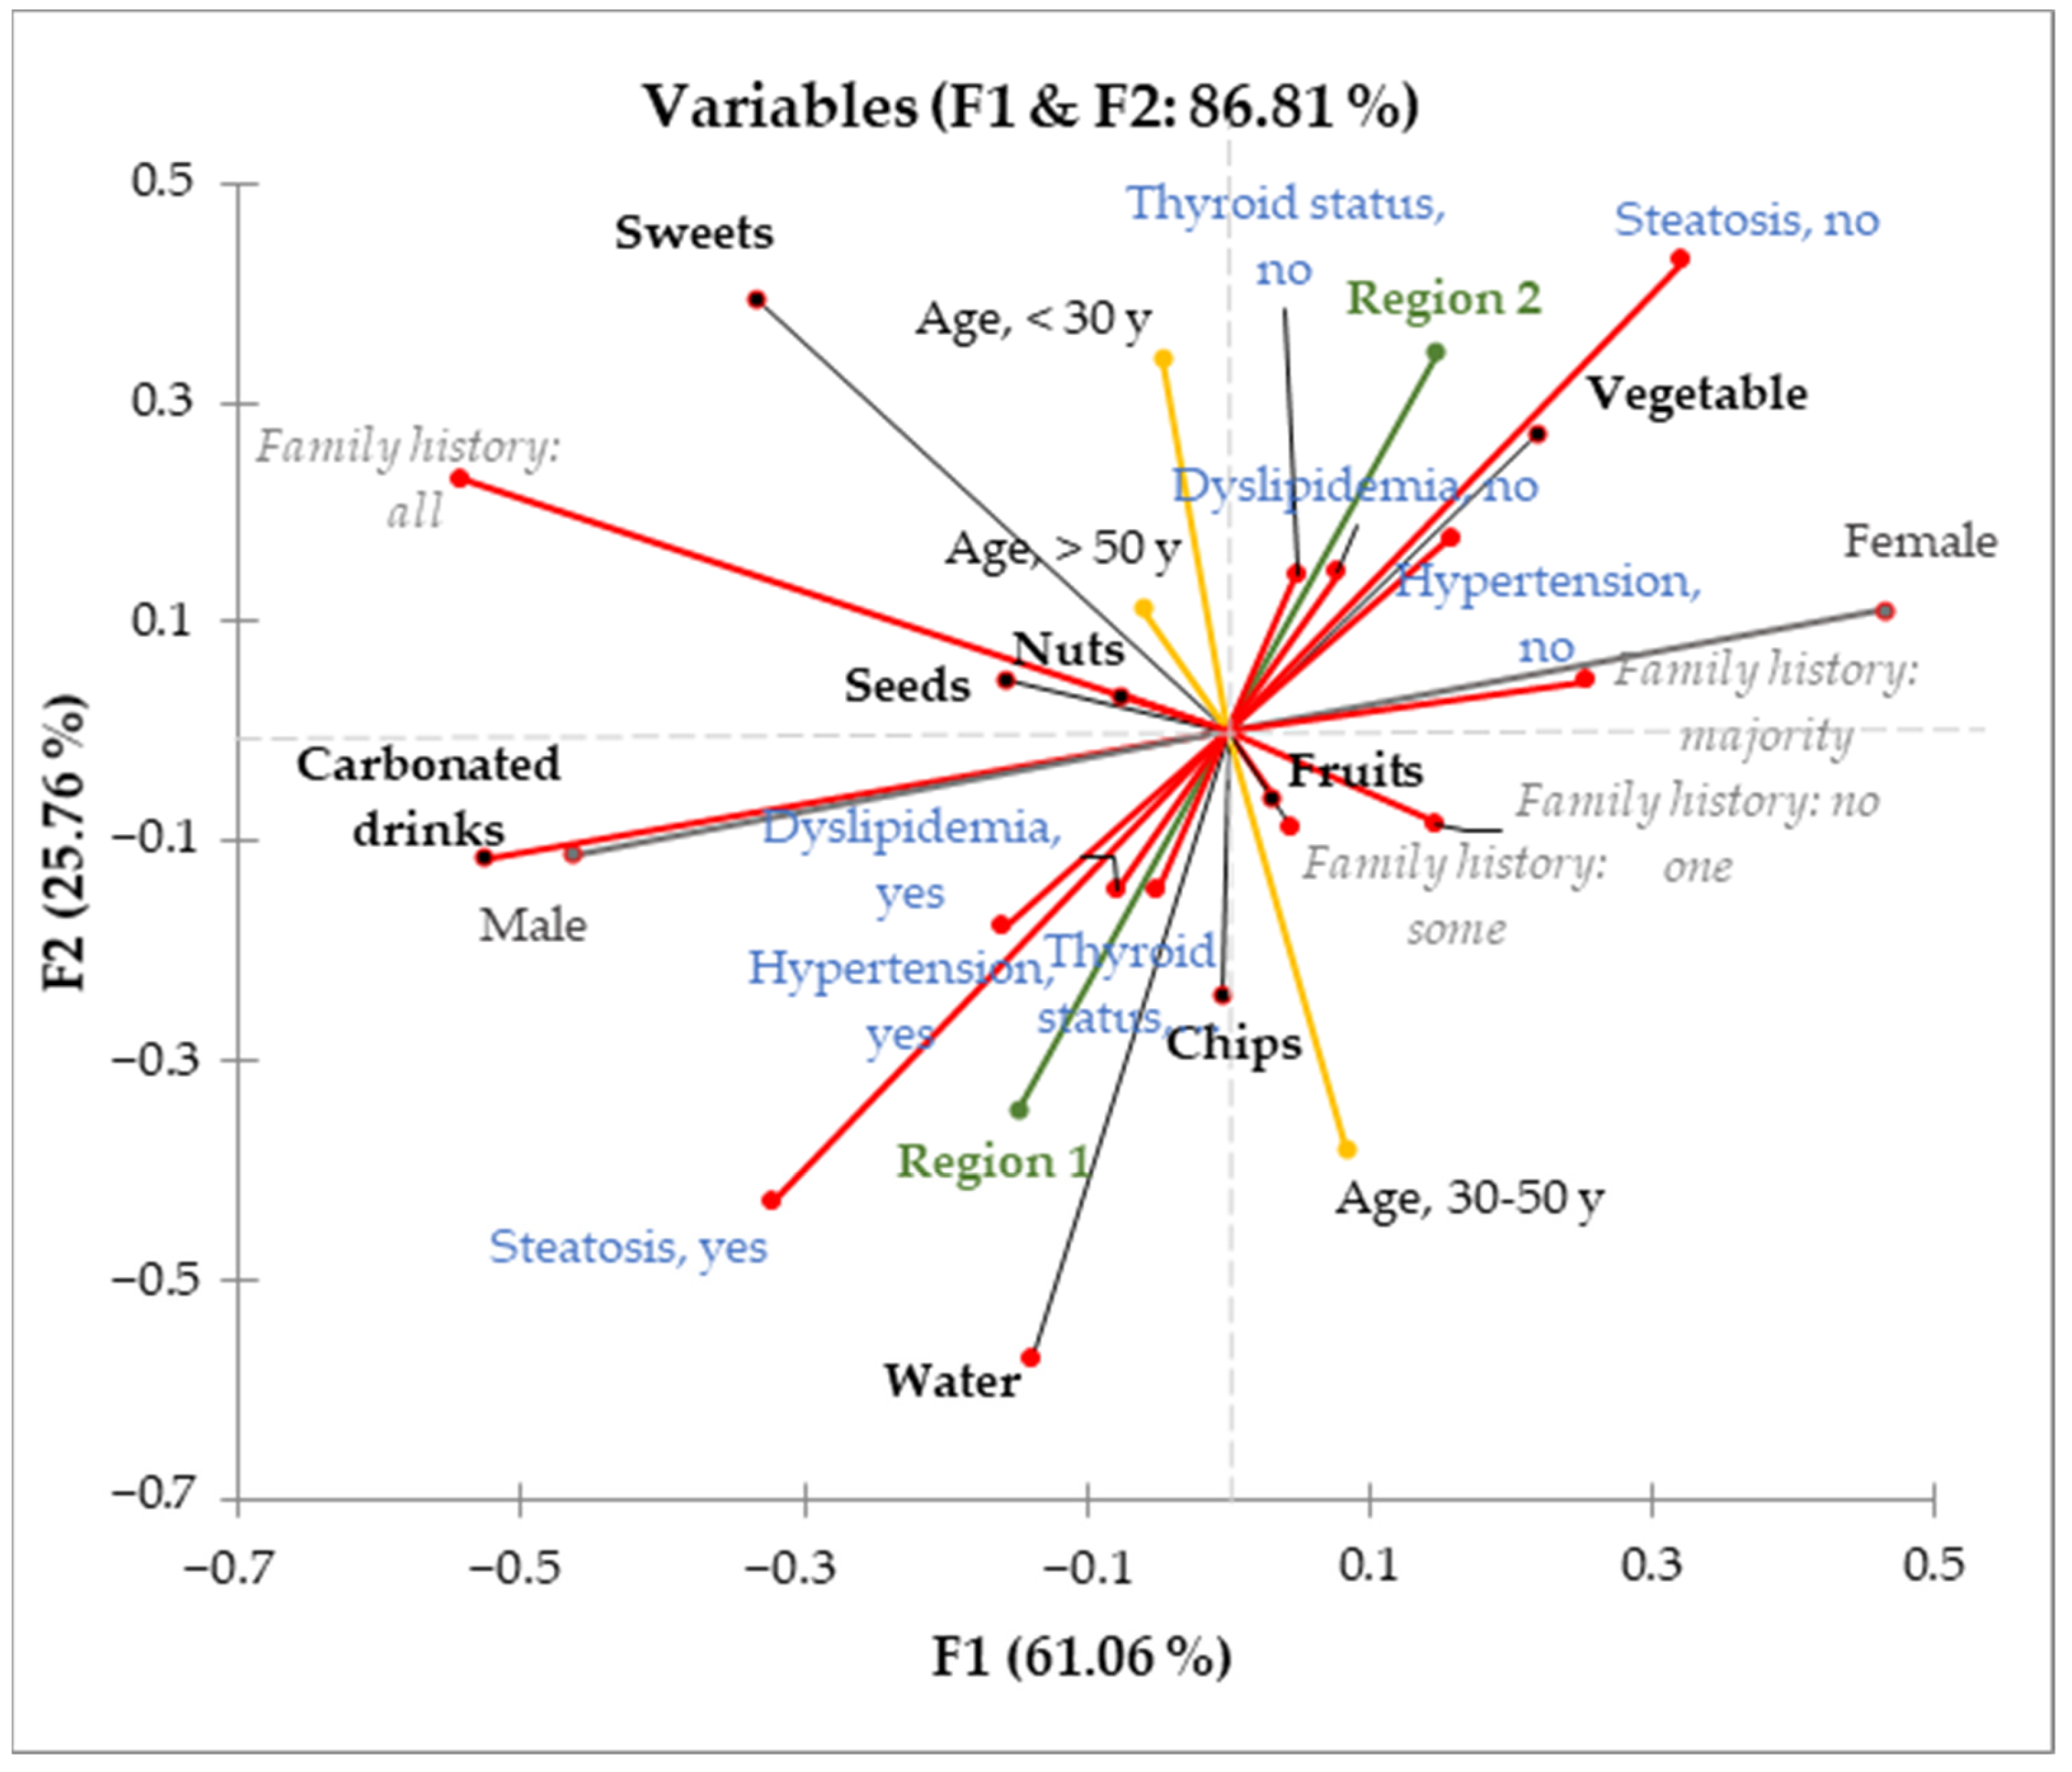
3.2. Relating Overweight/Obesity with Eating Habits

In order to determine what needs to be done in particular for people with excess body weight and different classes of obesity, a qualitative analysis and a quantitative analysis were carried out. Principal components analysis served as a qualitative tool for the entire set of respondents (Figure 3). This made it possible to determine the grouping of the observed parameters according to similarity/difference [27,28], but also to determine which of the observed parameters describe the connection between obesity and eating habits, with a share of variations greater than 85%, in the observed set.
Higher consumption of sweets is related with age under 30 years, as well those aged over 50 years. The consumption of a larger amount of vegetables was specified by the female population, while carbonated drinks were consumed more by the male population. The qualitative variable regions are located on opposite sides of the coordinate system, which is an indication that there are a number of differences in their dietary patterns.
The investigated food groups are also associated with the anthropometric indicators, such as body mass, body mass index, and waist-to-hip ratio, by use of the same qualitative multivariate tool as presented in the previous figure (Figure 3), principal component analysis. Such an approach greatly helps in understanding the observed problem [29], especially when the share that describes the set of all variations in the observed set is as high as it is in the case outlined in Figure 4, where the first and second main components describe almost 96.7% of all variations. As expected, the variables “Body mass” and “Body mass index” are positioned in the same coordinate quadrant. This was expected because body mass is in the numerator of the BMI calculation equation. What should definitely be highlighted in this figure are the variables opposite the first quadrant, namely the variables positioned in the third quadrant: the number of meals and the consumption of vegetables. Namely, the variables in the opposite quadrants should be inversely proportional [23], which would lead to the conclusion that an increase in the number of meals and the amount of vegetables consumed reduces BM and BMI. However, the explanation is the following, which is that the number of meals was not singled out as a significant variable, and the proportion of vegetables has already been commented on, and its consumption should be taken with a grain of salt, as well as the “form” of vegetables consumed.

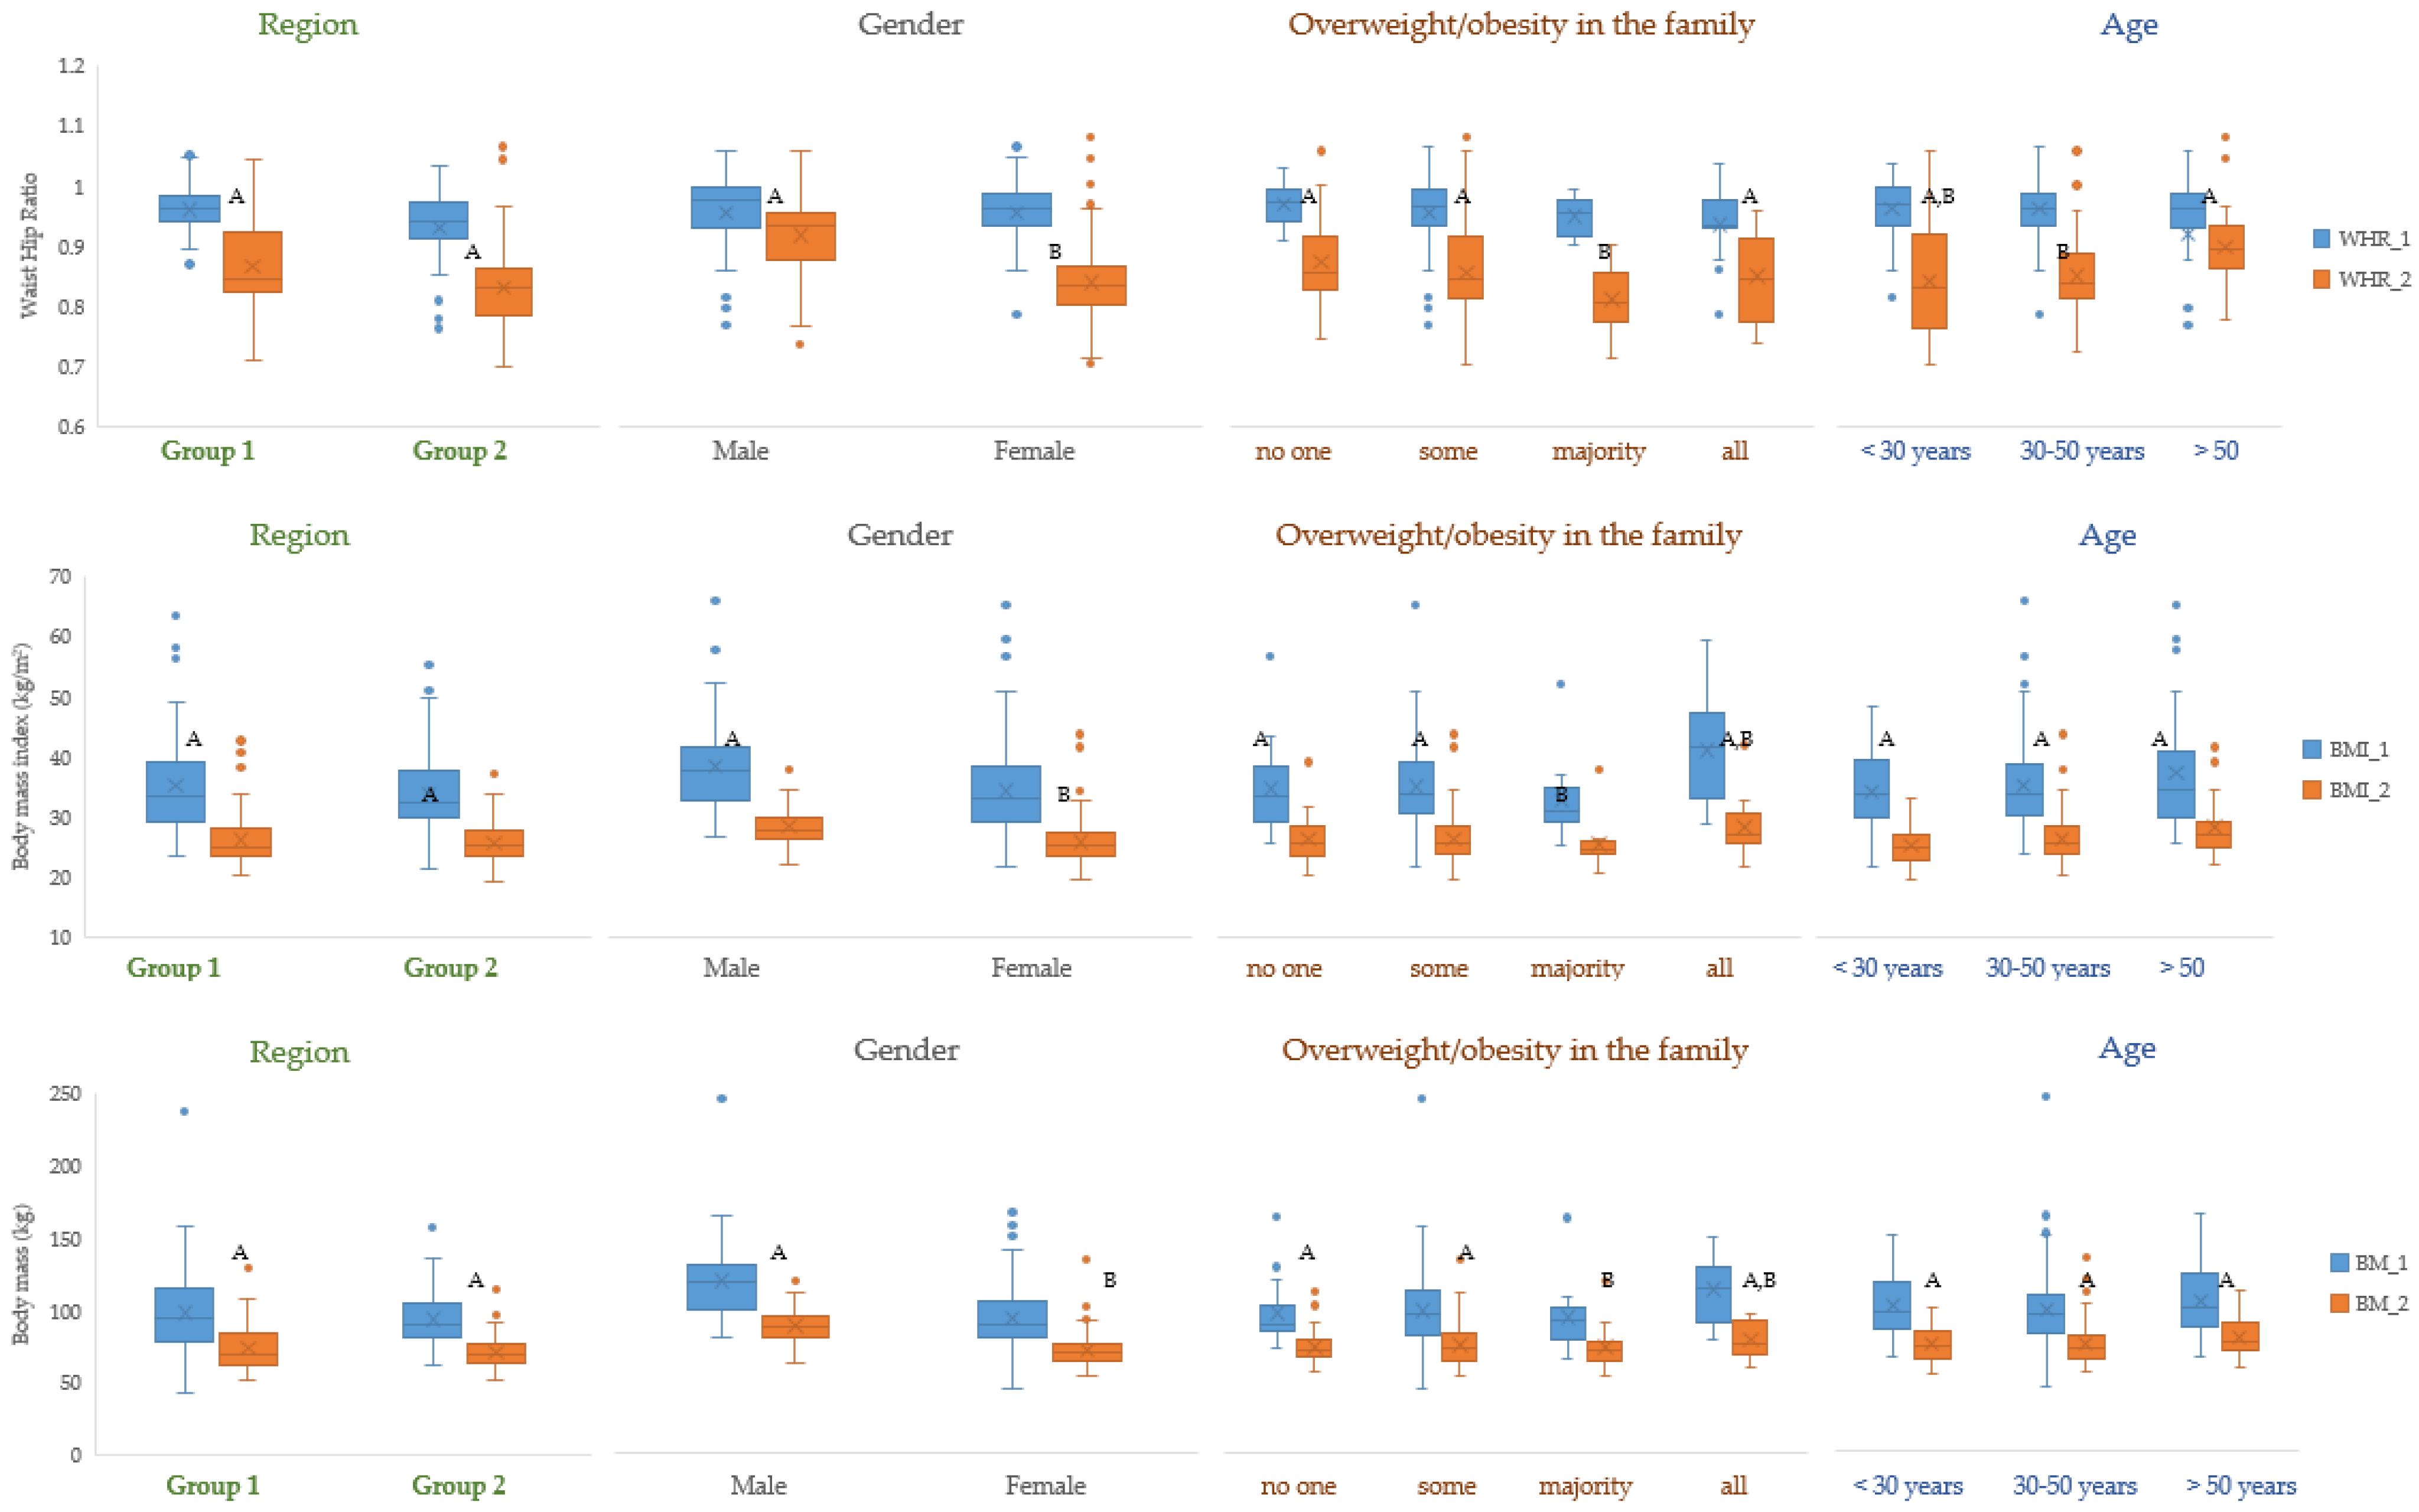
3.3. Successful Implementation of the Body Weight Reduction Program

For all participants (regardless of whether the target body mass was achieved), after 4 months, a comparison of parameters that are indicators of the success of body mass reduction, and which directly results in the reduction in parameters such as WHR and BMI, was carried out, as shown in Figure 5. In order to show the range, average, and potential of respondents who are the so-called outliers according to the observed parameter [8], the Box–Whisker diagram was used. The effectiveness of the ketogenic diet after 120 days in the program is presented in Table 4.
The female population was more effective considering the proportion of those participants who achieved the healthy range of BMI (73.9% from Region 1; 81.7% from Region 2) and WHR (over 69% in Region 1 and over 98% in Region 2). Table A3 presents the progress in the body weight reduction program, and this is presented in Table 1 (at the beginning of the program) according to groups and gender. Only age and body height are omitted because they did not change during the weight loss program.
Significant differences in the BM, BMI, and WHR are related with the familiar prevalence of overweight/obesity and age (only for the WHR).

4. Discussion

Our finding indicated regional differences in the daily and weekly consumption of foods from all observed food categories (Sweets, Chips, Vegetables, Fruits, and Nuts and Seeds, but not in the category “Drinks”). However, gender, as a qualitative variable, showed that the female population consumed at least 101 g of these (44.9% from Group 1 and 53.3%, from Group 2, respectively). Causes of globesity are related with overfeeding [30], ultra-processed food [31], and fast food [32], but also with the gut microbiota [33,34], inheritance and genetics [35], etc., indicating its multiplex etiology [36]. But when obesity is related with food intake, the causes are high energy and low nutrient density [37], with a high proportion of salty snacks and sweets [38] and an extremely low proportion of fruits and vegetables [39]. As Nour and coworkers presented [40], the consumption of more than four servings per day reduces the risk of weight gain but also the inverse association with waist circumference in women (≈−0.4 cm per daily vegetable serving), while another study has related vegetable intake with a higher intake of fibers, relating it with weight loss among Full Plate Living program participants [41].
A high share of the obese participants (73% obese and 27% overweight) in the total set of 200 participants (100 per region/group) is also related with the estimation of overweight/obesity, where a “few pounds more” is mostly taken seriously when obesity is more likely than overweight, especially in the male population [42].
Unfortunately, the findings of our study also confirmed the relation of health problems such as steatosis, dyslipidemia, thyroid problems, hypertension, diabetes, and Helicobacter pylori with high values of WHR and BMI (over the values related with normal health). A study which investigated hypertension (HTA) in obese patients showed that it is present in 58% of male and 49% of female patients [43]; luckily, in our group, only eight male participants were diagnosed with HTA, but eight females were also diagnosed too. In the group of our respondents, dyslipidemia dominated (14% of respondents), followed by a thyroid problem (11%), which was exclusively present in the female population, followed by steatosis and HTA (8% of patients) and diabetes (2%). Although the study of Baradaran at al. [44] showed that participants infected with H. pylori have a higher risk of obesity (OR of 1.01), in our study groups, no one reported this health problem during the first interview.
The final results of this study present significant weight loss after four months in the program (or earlier for those for whom the expected time frame was under the average of 112 days for achieving the targeted body mass). Although the proportions of BMI and WHR in the healthy range are in favor of the female population (BMI = 77.8%; WHR = 84.08%), the male population initially had more kilos to lose, and the time span in which the target body mass was expected to be reached was 6 to 12 months for most of them. This corresponds to the share of almost a third (31.8%) who achieved the desired body mass in four months. What should definitely be pointed out is that the proportion of the male population who, through the weight loss program, reduced their waist and hip circumferences to a value of less than 0.9 also achieved the expected body mass index that corresponds to a healthy BMI, which is 25 kg/m2. Similar findings were the outcomes of a study which is among one of the few investigating gender differences in weight loss and weight loss maintenance, where the male population lost a smaller amount compared to females in the same time frame [45].
Research investigating optimal dietary strategies for weight loss and body weight maintenance [46] highlighted the ketogenic diet as effective in suppressing hunger (during the diet), and some therapeutic effects were found in patients with type 2 diabetes, as well as in cardiovascular and neurological diseases and polycystic ovary syndrome. However, the aforementioned research by Kim [46], as well as other studies, state that additional studies are needed to confirm the effectiveness and safety of the ketogenic diet [47,48]. A safe diet after the weight loss program which can help maintain the targeted body weight would be a plant-based diet [49], as well as the Mediterranean diet [50]. The ketogenic diet was suggested as one of the options for losing weight in obese people [17], but there are certain risks, such as kidney disease [51], osteoporosis, and liver disease, while a high share of fats increases the daily intake of saturated fats, which can lead to heart disease [47]. The study of Gomez-Arbelaz et al. [52] showed that 120 days of ketogenic diet will not influence the values of the plasma bicarbonate level and acid-base status or blood pH, indicating “that this diet can be considered as a safe nutritional solution for obese individuals” [53].
Several key takeaways which emerge from this study are:
Regional and Gender Differences: This research highlighted substantial differences in food consumption patterns between the two studied regions, as well as gender-based variations. These variations underscore the importance of tailoring interventions to specific populations and considering cultural and regional factors in weight loss programs.
Health Implications: The prevalence of health problems, such as hypertension, dyslipidemia, and thyroid issues, was found to be closely linked to higher body mass index (BMI) and waist-to-hip ratio (WHR) values. This underscores the critical role of weight management in reducing the risk of various health complications.
Eating Habits and Weight Loss: This study demonstrated that dietary habits have a significant impact on weight loss outcomes. Participants who adopted healthier eating habits and reduced their consumption of high-calorie, low-nutrient foods achieved more successful weight loss results.
Ketogenic Diet Efficacy: The ketogenic diet approach was shown to be effective in facilitating weight loss and improving anthropometric indicators, especially for females. The program’s success suggests that dietary interventions, such as the ketogenic diet, can play a crucial role in achieving relatively rapid weight loss results.
Importance of Individualization: This study emphasized the importance of tailoring weight loss interventions to individual needs, including factors like age, gender, family history, and personal preferences. This individualized approach enhances the likelihood of sustainable weight loss and improved overall well-being.
Consideration of Lifestyle and Cultural Factors: Lifestyle changes, including dietary modifications, play a crucial role in addressing the obesity epidemic. Understanding cultural and regional differences in eating habits can help design more effective and targeted intervention programs.

5. Conclusions

This case study investigated the effectiveness of a ketogenic diet program for weight loss among overweight and obese adults from two distinct regions. The study revealed noteworthy findings that shed light on the complexities of weight management and its relation to dietary habits, health issues, gender, and regional variations. Several key takeaways which emerge from this study are (i) the confirmed regional (cultural) and gender differences; (i) health implications related to BMI over 30 kg/m2; and (iii) the effectiveness of the ketogenic diet for weight reduction.
In essence, this case study underscores the multifaceted nature of weight management and the importance of comprehensive strategies that encompass dietary changes, lifestyle modifications, and tailored approaches. These findings contribute valuable insights for healthcare professionals, policymakers, and individuals seeking effective ways to combat obesity and promote healthier living.

Author Contributions

Conceptualization, V.K. and J.G.K.; methodology, J.G.K..; validation, G.M., V.K. and J.G.K.; formal analysis, J.G.K.; investigation, G.M.; resources, G.M.; data curation, V.K. and J.G.K.; writing—original draft preparation, G.M., V.K. and J.G.K.; writing—review and editing, V.K. and J.G.K.; visualization, V.K. and J.G.K.; supervision, V.K. and J.G.K.; project administration, G.M.; funding acquisition, G.M. All authors have read and agreed to the published version of the manuscript.

Funding

This research received no external funding.

Institutional Review Board Statement

The study was conducted in accordance with the Declaration of Helsinki and approved by the Institutional Review Board of Унивepзитeт „Cв. Kлимeнт Охpидски“—Битoлa, Teхнoлoшкo—тeхнички фaкyлтeт Beлeс (protocol code 10-168/1 approved on 28 April 2022).

Informed Consent Statement

Informed consent was obtained from all subjects involved in the study.

Data Availability Statement

The data that support the findings of this study are available from the corresponding author upon reasonable request.

Acknowledgments

We would like to thank our participants for providing their written consent to the use of their data for processing and publication in this paper.

Conflicts of Interest

The authors declare no conflict of interest.

Appendix A

Table A1. Frequency of consumed foods from different food groups presented as average and the ranges for each gender from the observed groups.
Frequency (% per Day)
Drink Consumed per DayGroup 1Group 2
MaleFemaleMaleFemale
Carbonated drinks
0 L25.8 A,a39.1 B,a30.8 A,a32.9 A,a
<0.5 L12.9 A,a29.0 B,a38.5 A,b17.1 B,b
0.5–1 L16.1 A,a20.3 A,a23.1 A,b25.7 A,a
1–2 L38.7 A,a7.2 B,a23.1 A,b17.1 A,b
>2 L6.5 A,a4.3 A,a15.4 A,b7.1 B,a
Water
0 L74.2 A,a56.5 B,a75.0 A,a88.5 B,b
<0.5 L19.4 A,a33.3 B,a0.5 A,b2.3 A,b
0.5–1 L6.5 A,a10.1 A,a16.7 A,b3.4 A,b
1–2 L0.0 A,a0.0 A,a0.0 A,a2.3 A,b
>2 L0.0 A,a0.0 A,a8.3 A,b3.4 A,b
Different capital letters in the same line: significant differences (p < 0.05) by gender (within the same regional group); different lowercase letters: significant differences (p < 0.05) for the same gender (different groups).
Table A2. Frequency of incidence of overweight/obesity in the family for investigated groups and gender.
Family Incidence of Overweight/ObesityGroup 1Group 2Total
MaleFemaleMaleFemaleMaleFemale
No one16.1 A,a17.2 A,a7.7 A,b22.1 A,a11.919.7
Some77.4 A,a73.4 A,a46.2 A,b65.1 A,b61.869.3
Majority3.2 A,a1.6 A,a23.1 A,b5.8 B,a13.23.7
All3.2 A,a7.8 A,a23.1 A,b7.0 B,a13.27.4
Different capital letters in the same line: significant differences (p < 0.05) by gender (within the same regional group); different lowercase letters: significant differences (p < 0.05) for the same gender (different groups).
Table A3. Average values with corresponding range (given in the brackets)of the anthropometric parameters for the participants of two groups after 120 days in the weight loss program based on the ketogenic diet.
Basic InformationGroup 1Group 2
Male (n = 31)Female (n = 69)Male (n = 13)Female (n = 87)
Body mass (kg)85.4
(60.3–107.7)
68.1
(50.7–129.1)
84.5
(68.0–114.8)
68.5
(51.1–89.6)
Body mass index (kg/m2)27.8
(21.6–38.2)
25.4
(20.0–42.6)
27.9
(23.4–37.1)
25.1
(19.2–33.7)
Consumed meals per day (No.)2.6
(1–5)
2.8
(1–6)
2.5
(2–4)
2.5
(1–5)
Waist Circumference (cm)86.7
(72–114)
80.2
(71–120)
84.3
(66–102)
79.1
(58–84)
Waist-to-hip ratio 0.920.840.880.82
(0.82–1.04)(0.71–0.93)(0.71–1)(0.70–0.91)
Group 1: participants from Republic of North Macedonia; Group 2: participants from Kosovo.

References

  1. Meldrum, D.R.; Morris, M.A.; Gambone, J.C. Obesity pandemic: Causes, consequences, and solutions-but do we have the will? Fertil. Steril. 2017, 107, 833–839. [Google Scholar] [CrossRef]
  2. Ahluwalia, M.K. Chrononutrition—When We Eat Is of the Essence in Tackling obesity. Nutrients 2022, 14, 5080. [Google Scholar] [CrossRef]
  3. Di Rosa, C.; Lattanzi, G.; Taylor, S.F.; Manfrini, S.; Khazrai, Y.M. Very low calorie ketogenic diets in overweight and obesity treatment: Effects on anthropometric parameters, body composition, satiety, lipid profile and microbiota. Obes. Res. Clin. Pract. 2020, 14, 491–503. [Google Scholar] [CrossRef]
  4. Tham, K.W.; Abdul Ghani, R.; Cua, S.C.; Deerochanawong, C.; Fojas, M.; Hocking, S.; Lee, J.; Nam, T.Q.; Pathan, F.; Saboo, B.; et al. Obesity in South and Southeast Asia-A new consensus on care and management. Obes. Rev. 2023, 24, e13520. [Google Scholar] [CrossRef]
  5. Zavala, G.A.; Kolovos, S.; Chiarotto, A.; Chiarotto, A.; Bosmans, J.E.; Campos-Ponce, M.; Rosado, J.L.; Garcia, O.P. Association between obesity and depressive symptoms in Mexican population. Soc. Psychiatry Psychiatr. Epidemiol. 2018, 53, 639–646. [Google Scholar] [CrossRef]
  6. Berry, E.M. The Obesity Pandemic-Whose Responsibility? No Blame, No Shame, Not More of the Same. Front. Nutr. 2020, 7, 2. [Google Scholar] [CrossRef]
  7. Vasileva, L.V.; Marchev, A.S.; Georgiev, M.I. Causes and solutions to “globesity”: The new FA(S)T alarming global epidemic. Food Chem. Toxicol. 2018, 121, 173–193. [Google Scholar] [CrossRef]
  8. Markovikj, G.; Knights, V.; Kljusurić, J.G. Ketogenic Diet Applied in Weight Reduction of Overweight and Obese Individuals with Progress Prediction by Use of the Modified Wishnofsky Equation. Nutrients 2023, 15, 927. [Google Scholar] [CrossRef]
  9. Frank, J.W. Controlling the obesity pandemic: Geoffrey Rose revisited. Can. J. Public Health 2022, 113, 736–742. [Google Scholar] [CrossRef]
  10. Abarca-Gomez, L.; NCD Risk Factor Collaboration. Worldwide trends in body-mass index, underweight, overweight, and obesity from 1975 to 2016: A pooled analysis of 2416 population-based measurement studies in 128·9 million children, adolescents, and adults. Lancet 2017, 390, 2627–2642. [Google Scholar] [CrossRef]
  11. Pandita, A.; Sharma, D.; Pandita, D.; Pawar, S.; Tariq, M.; Kaul, A. Childhood obesity: Prevention is better than cure. Diabetes Metab. Syndr. Obes. 2016, 9, 83–89. [Google Scholar] [CrossRef]
  12. Flegal, K.M.; Ogden, C.L.; Fryar, C.; Afful, J.; Klein, R.; Huang, D. Comparisons of Self-Reported and Measured Height and Weight, BMI, and Obesity Prevalence from National Surveys: 1999–2016. Obesity 2019, 27, 1711–1719. [Google Scholar] [CrossRef] [PubMed]
  13. CDC. National Health and Nutrition Examination Survey 1999–2016 Survey Content Brochure. Available online: https://www.cdc.gov/nchs/nhanes/index.htm (accessed on 7 June 2023).
  14. CDC. National Center for Health Statistics- National Health Intervju Survey. Available online: https://www.cdc.gov/nchs/nhis/index.htm (accessed on 7 June 2023).
  15. CDC. Behavioral Risk Factor Surveillance System. Available online: https://www.cdc.gov/brfss/index.html (accessed on 7 June 2023).
  16. Contreras, R.E.; Schriever, S.C.; Pfluger, P.T. Physiological and Epigenetic Features of Yoyo Dieting and Weight Control. Front. Genet. 2019, 10, 1015. [Google Scholar] [CrossRef]
  17. Drabińska, N.; Wiczkowski, W.; Piskuła, M.K. Recent advances in the application of a ketogenic diet for obesity management. Trends Food Sci. Technol. 2021, 110, 28–38. [Google Scholar] [CrossRef]
  18. Dowis, K.; Banga, S. The Potential Health Benefits of the Ketogenic Diet: A Narrative Review. Nutrients 2021, 13, 1654. [Google Scholar] [CrossRef] [PubMed]
  19. Knights, V.; Kolak, M.; Markovikj, G.; Gajdoš Kljusurić, J. Modeling and Optimization with Artificial Intelligence in Nutrition. Appl. Sci. 2023, 13, 7835. [Google Scholar] [CrossRef]
  20. Papadaki, A.; Linardakis, M.; Plada, M.; Larsen, T.M.; van Baak, M.A.; Lindroos, A.K.; Pfeiffer, A.F.; Martinez, J.A.; Handjieva-Darlenska, T.; Kunešová, M.; et al. A multicentre weight loss study using a low-calorie diet over 8 weeks: Regional differences in efficacy across eight European cities. Swiss Med. Wkly. 2013, 143, w13721. [Google Scholar] [CrossRef]
  21. Sreenivas, S. Keto Diet for Beginners—Nourish byWebMD. Available online: https://www.webmd.com/diet/keto-diet-forbeginners (accessed on 4 July 2022).
  22. Maltarić, M.; Ruščić, P.; Kolak, M.; Bender, D.V.; Kolarić, B.; Ćorić, T.; Hoejskov, P.S.; Bošnir, J.; Kljusurić, J.G. Adherence to the Mediterranean Diet Related to the Health Related and Well-Being Outcomes of European Mature Adults and Elderly, with an Additional Reference to Croatia. Int. J. Environ. Res. Public Health 2023, 20, 4893. [Google Scholar] [CrossRef]
  23. Fatsecret. Green Peppers—Nutrition Facts. Available online: https://www.fatsecret.com/calories-nutrition/usda/green-peppers (accessed on 30 August 2023).
  24. Fatsecret. Hot & Sweet Peppers Stuffed with Cheese—Nutrition Facts. Available online: https://www.eatthismuch.com/food/nutrition/hot-sweet-peppers-stuffed-with-cheese,2508247/ (accessed on 30 August 2023).
  25. Dodevska, M.; Kukic Markovic, J.; Sofrenic, I.; Tesevic, V.; Jankovic, M.; Djordjevic, B.; Ivanovic, N.D. Similarities and differences in the nutritional composition of nuts and seeds in Serbia. Front. Nutr. 2022, 9, 1003125. [Google Scholar] [CrossRef] [PubMed]
  26. Weir, C.B.; Jan, A. BMI Classification Percentile and Cut Off Points. [Updated 2023 Jun 26]. Available online: https://www.ncbi.nlm.nih.gov/books/NBK541070/ (accessed on 16 August 2023).
  27. Maraschim, J.; Honicky, M.; Moreno, Y.M.F.; Hinnig, P.d.F.; Cardoso, S.M.; Back, I.d.C.; Vieira, F.G.K. Consumption and Breakfast Patterns in Children and Adolescents with Congenital Heart Disease. Int. J. Environ. Res. Public Health 2023, 20, 5146. [Google Scholar] [CrossRef] [PubMed]
  28. Addas, A. Understanding the Relationship between Urban Biophysical Composition and Land Surface Temperature in a Hot Desert Megacity (Saudi Arabia). Int. J. Environ. Res. Public Health 2023, 20, 5025. [Google Scholar] [CrossRef]
  29. Plura, J.; Vykydal, D.; Tošenovský, F.; Klaput, P. Graphical Tools for Increasing the Effectiveness of Gage Repeatability and Reproducibility Analysis. Process. 2023, 11, 1. [Google Scholar] [CrossRef]
  30. Fiore, G.; Pascuzzi, M.C.; Di Profio, E.; Corsello, A.; Agostinelli, M.; La Mendola, A.; Milanta, C.; Campoy, C.; Calcaterra, V.; Zuccotti, G.; et al. Bioactive compounds in childhood obesity and associated metabolic complications: Current evidence, controversies and perspectives. Pharmacol. Res. 2023, 187, 106599. [Google Scholar] [CrossRef] [PubMed]
  31. Buckley, J.P.; Kim, H.; Wong, E.; Rebholz, C.M. Ultra-processed food consumption and exposure to phthalates and bisphenols in the US National Health and Nutrition Examination Survey, 2013–2014. Environ. Int. 2019, 131, 105057. [Google Scholar] [CrossRef] [PubMed]
  32. Anderson, B.; Rafferty, A.P.; Lyon-Callo, S.; Fussman, C.; Imes, G. Fast-food consumption and obesity among Michigan adults. Prev. Chronic Dis. 2011, 8, A71. [Google Scholar]
  33. Vetrani, C.; Di Nisio, A.; Paschou, S.A.; Barrea, L.; Muscogiuri, G.; Graziadio, C.; Savastano, S.; Colao, A.; on behalf of the Obesity Programs of Nutrition, Education, Research and Assessment (OPERA) Group. From Gut Microbiota through Low-Grade Inflammation to Obesity: Key Players and Potential Targets. Nutrients 2022, 14, 2103. [Google Scholar] [CrossRef]
  34. Xu, Y.-S.; Liu, X.-J.; Liu, X.-X.; Chen, D.; Wang, M.-M.; Jiang, X.; Xiong, Z.-F. The Roles of the Gut Microbiota and Chronic Low-Grade Inflammation in Older Adults with Frailty. Front. Cell. Infect. Microbiol. 2021, 11, 675414. [Google Scholar] [CrossRef]
  35. Cheng, Z.; Zheng, L.; Almeida, F.A. Epigenetic reprogramming in metabolic disorders: Nutritional factors and beyond. J. Nutr. Biochem. 2018, 54, 1–10. [Google Scholar] [CrossRef]
  36. González-Muniesa, P.; Mártinez-González, M.A.; Hu, F.B.; Després, J.P.; Matsuzawa, Y.; Loos, R.J.F.; Moreno, L.A.; Bray, G.A.; Martinez, J.A. Obesity. Nat. Rev. Dis. Prim. 2017, 3, 17034. [Google Scholar] [CrossRef]
  37. Stelmach-Mardas, M.; Rodacki, T.; Dobrowolska-Iwanek, J.; Brzozowska, A.; Walkowiak, J.; Wojtanowska-Krosniak, A.; Zagrodzki, P.; Bechthold, A.; Mardas, M.; Boeing, H. Link between Food Energy Density and Body Weight Changes in Obese Adults. Nutrients 2016, 8, 229. [Google Scholar] [CrossRef]
  38. Tristan Asensi, M.; Napoletano, A.; Sofi, F.; Dinu, M. Low-Grade Inflammation and Ultra-Processed Foods Consumption: A Review. Nutrients 2023, 15, 1546. [Google Scholar] [CrossRef]
  39. Wu, E.; Ni, J.; Zhou, W.; You, L.; Tao, L.; Xie, T. Consumption of fruits, vegetables, and legumes are associated with overweight/obesity in the middle- and old-aged Chongqing residents: A case-control study. Medicine 2022, 101, e29749. [Google Scholar] [CrossRef] [PubMed]
  40. Nour, M.; Lutze, S.A.; Grech, A.; Allman-Farinelli, M. The Relationship between Vegetable Intake and Weight Outcomes: A Systematic Review of Cohort Studies. Nutrients 2018, 10, 1626. [Google Scholar] [CrossRef] [PubMed]
  41. Kelly, R.K.; Calhoun, J.; Hanus, A.; Payne-Foster, P.; Stout, R.; Sherman, B.W. Increased dietary fiber is associated with weight loss among Full Plate Living program participants. Front. Nutr. 2023, 10, 1110748. [Google Scholar] [CrossRef]
  42. Jorge, T.; Sousa, S.; do Carmo, I.; Lunet, N.; Padrão, P. Accuracy of Assessing Weight Status in Adults by Structured Observation. Appl. Sci. 2023, 13, 8185. [Google Scholar] [CrossRef]
  43. Pedrianes-Martin, P.B.; Perez-Valera, M.; Morales-Alamo, D.; Martin-Rincon, M.; Perez-Suarez, I.; Serrano-Sanchez, J.A.; Gonzalez-Henriquez, J.J.; Galvan-Alvarez, V.; Acosta, C.; Curtelin, D.; et al. Resting metabolic rate is increased in hypertensive patients with overweight or obesity: Potential mechanisms. Scand. J. Med. Sci. Sport. 2021, 31, 1461–1470. [Google Scholar] [CrossRef]
  44. Baradaran, A.; Dehghanbanadaki, H.; Naderpour, S.; Pirkashani, L.M.; Rajabi, A.; Rashti, R.; Riahifar, S.; Moradi, Y. The association between Helicobacter pylori and obesity: A systematic review and meta-analysis of case–control studies. Clin. Diabetes Endocrinol. 2021, 7, 15. [Google Scholar] [CrossRef]
  45. Crane, M.M.; Jeffery, R.W.; Sherwood, N.E. Exploring Gender Differences in a Randomized Trial of Weight Loss Maintenance. Am. J. Men’s Health 2017, 11, 369–375. [Google Scholar] [CrossRef]
  46. Kim, J.Y. Optimal Diet Strategies for Weight Loss and Weight Loss Maintenance. J. Obes. Metab. Syndr. 2021, 30, 20–31. [Google Scholar] [CrossRef]
  47. Harvard Health Publishing. Should you Try the Keto Diet? Available online: https://www.health.harvard.edu/staying-healthy/should-you-try-the-keto-diet (accessed on 18 September 2023).
  48. Batch, J.T.; Lamsal, S.P.; Adkins, M.; Sultan, S.; Ramirez, M.N. Advantages and Disadvantages of the Ketogenic Diet: A Review Article. Cureus 2020, 12, e9639. [Google Scholar] [CrossRef]
  49. Clark, J.E. Diet, exercise or diet with exercise: Comparing the effectiveness of treatment options for weight-loss and changes in fitness for adults (18–65 years old) who are overfat, or obese; systematic review and meta-analysis. J. Diabetes Metab. Disord. 2015, 14, 31, Erratum in J. Diabetes Metab. Disord. 2015, 14, 73. [Google Scholar] [CrossRef] [PubMed]
  50. Gerić, M.; Matković, K.; Gajski, G.; Rumbak, I.; Štancl, P.; Karlić, R.; Bituh, M. Adherence to Mediterranean Diet in Croatia: Lessons Learned Today for a Brighter Tomorrow. Nutrients 2022, 14, 3725. [Google Scholar] [CrossRef] [PubMed]
  51. Ayele, G.M.; Atalay, R.T.; Mamo, R.T.; Hussien, S.; Fissha, A.; Michael, M.B.; Nigussie, B.G.; Behailu, A. Is Losing Weight Worth Losing Your Kidney: Keto Diet Resulting in Renal Failure. Cureus 2023, 15, e36546. [Google Scholar] [CrossRef] [PubMed]
  52. Gomez-Arbelaez, D.; Bellido, D.; Castro, A.I.; Ordonez-Mayan, L.; Carreira, J.; Galban, C.; Martinez-Olmos, A.A.; Crujeiras, A.B.; Sajoux, I.; Casenueva, F.F. Body composition changes after very-low-calorie ketogenic diet in obesity evaluated by 3 standardized methods. J. Clin. Endocrinol. Metab. 2017, 102, 488–498. [Google Scholar] [CrossRef]
  53. Gomez-Arbelaez, D.; Crujeiras, A.B.; Castro, A.I.; Goday, A.; Mas-Lorenzo, A.; Bellon, A.; Tejera, C.; Bellido, D.; Galban, C.; Sajoux, I.; et al. Acid–base safety during the course of a very low-calorie-ketogenic diet. Endocrine 2017, 58, 81–90. [Google Scholar] [CrossRef]
Figure 1. Share of two group participants in the overweight and obesity classes.
Applsci 13 10704 g001
Figure 2. Prevalence (%) of diagnosed diseases in overweight and obese subjects.
Applsci 13 10704 g002
Figure 3. Principal component analysis indicating relationship of eating habits (bolded text) with the incidence of some healthy issues (blue text), according to (i) belonging to one of the two observed regions (green), (ii) gender, (iii) prevalence of overweight/obesity in the family (gray text), and (iv) age (yellow lines).
Applsci 13 10704 g003
Figure 4. Principal component analysis indicating relationship of numbers of meals per day and consumption of observed foods and drinks (blue lines, bolded text) with the anthropometric indicators (red lines) as waist hip ration (WHR), body mass and body mass index (BMI).
Applsci 13 10704 g004
Figure 5. Box plot success in reducing WHR, body mass index, and body weight loss after participating in a weight loss program. Different capital letters within the observed groups in (i) a certain region, (ii) according to gender, (iii) prevalence of overweight/obesity in the family, and (iv) age indicate significant differences. Compared are the body mass indexes at the beginning (BMI_1, blue) and at the end (BMI_2, orange) of the weight loss program.
Applsci 13 10704 g005
Table 1. Basic data presented as average value with corresponding range (given in the brackets) for the participants of two groups collected during the first medical visit.
Basic InformationGroup 1Group 2
Male (n = 31)Female (n = 69)Male (n = 13)Female (n = 87)
Age (years)35.3
(18–569)
37.6
(18–68)
41.8
(18–57)
38
(18–67)
Body mass (kg)103.3
(60.3–237)
78.8
(50.7–152.5)
108.4
(85.1–157.6)
91.3
(62.5–161.2)
Body height (m)1.76
(1.62–1.92)
1.64
(1.47–1.84)
1.74
(1.55–1.85)
1.65
(1.52–1.83)
Body mass index (kg/m2)38.3
(26.3–64.3)
33.6
(25.4–63.5)
35
(28–49)
32.8
(25.1–54.5)
Consumed meals per day (No.)2.5
(1–4)
2.1
(1–4)
2.5
(2–4)
2.6
(1–5)
Waist Circumference (cm)110.7
(80–164)
100.9
(75–162)
105.4
(77–138)
101.3
(66–166)
Waist-to-hip ratio 0.970.950.940.95
(0.91–1.05)(0.89–1.05)(0.85–1)(0.85–1.03)
Group 1: participants from North Macedonia; Group 2: participants from Kosovo.
Table 2. Average energy and nutrient content of the controlled ketogenic diet.
Controlled Dietary ParametersContent
Energy, kJ6280 ± 210
Proteins #, g136 ± 5.6
Fats #, g95 ± 4.3
Carbohydrates #, g360 ± 1.9
Vitamins
  Thiamine (vit. B1), mg1.4 ± 0.02
  Riboflavin (vit. B2), mg1.6 ± 0.03
  Niacin (vit. B3), mg NE 18 ± 0.8
  Pantothenic acid (vit. B5), mg6 ± 0.3
  Vitamin B6, mg 2 ± 0.08
  Biotin (vit. B7), μg150 ± 6.2
  Folic acid (vit. B9), μg200 ± 10.4
  Vitamin B12, μg1 ± 0.2
  Vitamin C, mg60 ± 2.7
  Vitamin D, μg5 ± 0.25
  Vitamin E, mg7.4 ± 0.4
  Vitamin K, μg30 ± 1.1
  Vitamin A, μg RE800 ± 32.7
Minerals
  Calcium, mg360 ± 17.8
  Chromium, μg25 ± 0.9
  Cupper, mg1 ± 0.01
  Iodine, μg100 ± 4.2
  Iron, mg8 ± 2.1
  Magnesium, mg360 ± 15.9
  Manganese, mg1 ± 0.03
  Molybdenum, μg25 ± 1.1
  Potassium, mg1200 ± 48.3
  Selenium, μg25 ± 1.3
  Sodium, mg1200 ± 44.2
  Zinc, mg10 ± 0.9
polyunsaturated fats
  Omega-3, mg1000 ± 30
# share of proteins/fats/carbohydrates (35:60:5) followed the recommendations [21].
Table 3. Daily consumed amounts of foods from different food groups presented as frequencies for each gender from the observed groups.
Amount of Daily Consumed FoodsFrequency (% per Day or per Week #)
Group 1Group 2
MaleFemaleMaleFemale
Sweets
0 g9.7 A,a5.8 B,a0.0 A,b0.0 A,b
<50 g38.7 A,a26.1 B,a25.0 A,b18.2 B,b
50–100 g16.1 A,a23.2 A,a8.3 A,b28.6 B,a
101–200 g16.1 A,a37.7 B,a0.0 A,b23.4 B,b
>200 g19.4 A,a7.2 B,a66.7 A,b29.9 B,b
Chips
0 g35.5 A,a18.8 B,a25.0 A,b29.9 A,a
<50 g25.8 A,a33.3 B,a16.7 A,b26.0 B,b
50–100 g19.4 A,a30.4 B,a41.7 A,b35.1 B,a
101–200 g9.7 A,a13.0 A,a8.3 A,a6.5 A,b
>200 g9.7 A,a4.3 A,a8.3 A,a2.6 B,a
Vegetables
0 g12.9 A,a10.1 A,a0.0 A,b4.0 B,a
<500 g87.1 A,a88.4 A,a0.0 A,b12.0 B,b
500–1000 g0.0 A,a1.4 A,a91.7 A,b70.7 B,b
1001–1500 g0.0 A,a0.0 A,a0.0 A,a4.0 B,b
>1500 g0.0 A,a0.0 A,a8.3 A,b9.3 A,b
Fruits
0 g19.4 A,a17.4 A,a0.0 A,b2.6 A,b
<500 g54.8 A,a49.3 A,a36.4 A,b46.1 B,a
500–1000 g16.1 A,a18.8 A,a36.4 A,b31.6 A,b
1001–1500 g6.5 A,a8.7 A,a18.2 A,b11.8 A,a
>1500 g3.2 A,a5.8 A,a9.1 A,b7.9 A,a
Nuts #
0 g22.6 A,a26.1 A,a45.5 A,b16.2 B,b
<500 g32.3 A,a31.9 A,a9.1 A,b29.7 B,a
500–1000 g9.7 A,a13.0 A,a36.4 A,b39.2 A,b
1001–1500 g22.6 A,a26.1 A,a0.0 A,b9.5 B,b
200–500 g12.9 A,a2.9 B,a9.1 A,a5.4 A,a
>500 g0.0 A,a0.0 A,a9.1 A,b2.7 B,b
Seeds #
0.0 g54.8 A,a56.5 A,a33.3 A,a24.7 A,a
<500 g22.6 A,a21.7 A,a25.0 A,a23.3 A,a
500–1000 g6.5 A,a4.3 A,a41.7 A,a43.8 A,a
1001–1500 g16.1 A,a17.4 A,a0.0 A,a6.8 A,a
>1500 g0.0 A,a0.0 A,a0.0 A,a1.4 A,a
# Consumption per week; different capital letters in the same line: significant differences (p < 0.05) by gender (within the same regional group); different lowercase letters: significant differences (p < 0.05) for the same gender (different groups).
Table 4. Proportion of successfully reduced anthropometric indicators (BMI < 25 kg/m2 and WHR < 0.85 and 0.9 for women and men, respectively) with corresponding mean values and standard deviations according to gender and regions (Group 1 and 2).
ParticipantsBMIWHR
in the Healthy RangeAverage ± SDin the Healthy RangeAverage ± SD
(%)(kg/m2)(%)(kg/m2)
Group 1Male35.7127.76 ± 3.4435.710.92 ± 0.05
Female73.9125.41 ± 4.3569.570.84 ± 0.06
Group 2Male30.7727.9 ± 3.3746.150.88 ± 0.09
Female81.6925.14 ± 3.0698.590.82 ± 0.06
Disclaimer/Publisher’s Note: The statements, opinions and data contained in all publications are solely those of the individual author(s) and contributor(s) and not of MDPI and/or the editor(s). MDPI and/or the editor(s) disclaim responsibility for any injury to people or property resulting from any ideas, methods, instructions or products referred to in the content.

