Article

An Investigation into the Influence of Sample Height on the Consolidation Behaviour of Dredged Silt

1
Guangdong Nonferrous Metals Engineering Investigation Design Institute Shen Zhen Branch, Haitian Rd, Lianhua Street, Futian District, Shenzhen 518000, China
2
Institute of Civil Engineering, Henan University of Engineering, 1 Xianghe Rd, Longhu, Xinzheng 451191, China
*
Author to whom correspondence should be addressed.
Appl. Sci. 2023, 13(18), 10419; https://doi.org/10.3390/app131810419
Submission received: 11 July 2023 / Revised: 12 September 2023 / Accepted: 13 September 2023 / Published: 18 September 2023

Abstract

:
This study delves into the effects of sample height on consolidation behaviour, utilising the automatic air pressure consolidometer. Extensive tests were conducted on three varieties of dredged silt samples of varying heights from Qianwan, Shenzhen, China. The salient findings can be summarised as follows: (1) Compression curves for samples of different dimensions transitioned through three distinct phases: minimal load disturbance, elastic deformation, and plastic deformation. Notably, the void ratio during the latter two phases diminished as sample height increased. (2) A rising sample height corresponded to a reduced stable strain and compression index. Furthermore, the consolidation coefficient notably diminished with an escalation in the sample height, whereas the structural yield stress remained largely unaffected. (3) Given the disparate formation processes, stress histories, and material compositions between dredged and marine silts, the permeability coefficient of dredged silt was found to be superior to that of marine silt. Within the typical preloading pressure scope (50~300 kPa), the consolidation coefficient of dredged silt was lower compared to marine silt. However, as the consolidation pressure significantly surpassed this threshold, the coefficient disparity between the two silts narrowed.

1. Introduction

Land reclamation projects generate substantial quantities of dredged silt. This silt, characterized by its “two highs, three lows, and finite strain”, specifically exhibits a high water content and void ratio. It also possesses low strength, a reduced coefficient of permeability, and a modest consolidation rate, alongside other engineering characteristics. When addressing the treatment of silt using the vertical drain method, it is evident that the compression, permeability, and consolidation coefficients undergo dramatic shifts. These changes span orders of magnitude in response to preloading. This deviation from the traditional Terzaghi consolidation theory, which assumes small deformation, underscores the significance of probing the effects of finite strain consolidation on the one-dimensional consolidation theory of highly compressible soft soils.
In this context, Gibson et al. [1] were pioneers in studying the finite strain consolidation challenge in soft soils. They meticulously deduced the governing equation for one-dimensional finite strain consolidation of soft soils and then solved it using the finite difference method. Subsequent advancements were made by Schiffman [2], and the duo Znidarcic and Schiffman [3], who built upon and refined Gibson’s foundational theory on finite strain consolidation. Later on, research by Xie et al. [4] and Xie et al. [5] established the one-dimensional finite strain consolidation equation for soft soils, providing an approximate analytical solution for this governing equation. Through both finite element analysis and analytical solutions, they demarcated the boundaries of applicability for finite strain consolidation.
Further enriching the discussion, Wen et al. [6], Chen and Hai [7], and Zheng et al. [8] integrated the nonlinear compression and permeability traits of soft soils into their analyses. Their efforts culminated in the one-dimensional finite strain nonlinear consolidation equation for soft soils. Various methodologies, including the finite difference method, analytical method, and semi-analytical method, were employed to navigate this intricate problem, allowing a deeper exploration into the finite strain consolidation behaviour of soft soils.
Building upon the finite strain consolidation theory, Li et al. [9] and Li et al. [10], as well as Dong et al. [11], incorporated considerations like the initial hydraulic gradient of seepage, non-Darcy seepage, and the nonlinear compression and permeability properties of soft soils. This led to the formulation of the governing equation for the finite strain nonlinear one-dimensional consolidation challenge. Using a custom finite difference program, they charted the consolidation process of soft soil foundations. Integrating Barron’s equal strain consolidation theory with Gibson’s one-dimensional finite strain consolidation theory, Jiang and Zhang [12] formulated the finite strain consolidation equation. This considered nuances such as the well resistance impact of the vertical drain, variations in the radial permeability coefficient, and vertical seepage. The equation was then tackled using the finite difference method.
The crux of employing the finite strain consolidation theory rests on the precision with which we can ascertain soft soil compressibility and permeability parameters, particularly for materials like dredger silt. This precision, achieved through rigorous experimentation, is pivotal in accurately defining the consolidation behaviour of these soils. Several researchers have examined the consolidation behaviour of dredged silt through tests and have yielded insightful findings. For instance, Hu [13] employed the GJZ-2 dual-medium pressure consolidometer to study two varieties of ultra-soft dredged fill in Shanghai, subsequently establishing a linear model correlating the logarithm of the permeability coefficient with the void ratio. Similarly, Lu [14] conducted tests on various dredged fills in Tianjin Binhai New Area using the GDS consolidation apparatus. His research delineated a nonlinear compression and permeability relationship suited for the dredged fills of that region. Additionally, Zhang et al. [15,16] undertook comprehensive analyses, highlighting the variations in consolidation coefficients for dredged silt in Shenzhen Bay, China, revealing that post-preloading treatment allowed dredged silt to attain a drainage consolidation rate on par with undisturbed silt.
Typically, the standard sample utilised in consolidation tests has a cross-sectional area of either 30 cm2 or 50 cm2 and stands at 2 cm in height. In real-world applications, the depth of the dredged fill can exceed 5 m. Representing such extensive depths with a 2 cm sample might lead to discrepancies in the consolidation, compression, and permeability characteristics, a phenomenon coined as the ‘size effect’. The size of soil samples undeniably impacts test outcomes during consolidation tests. Such size effects, previously observed in rock, concrete, and other solid materials, have been the subject of extensive research [17,18,19,20,21,22,23,24]. These effects have also been noted to influence the strength and deformation properties across various soil types, including soft clay soil, residual granite soil, coarse-grained soil, and expansive soil.
To elaborate, Zheng [25] probed the sample height on the consolidation deformation properties of soft clay using an automatic air pressure consolidometer. He investigated how the height of the sample swayed attributes like the consolidation deformation rate, consolidation coefficient, and compression properties. Similarly, Lei et al. [26] experimented with dredged fill soft soil samples of different sizes, analysing variations in stress–strain relationships and consolidation characteristics among these samples. Zhou et al. [27], on the other hand, designed consolidation simulation tests for large-size soft clay samples. Their study shed light on the consolidation deformation patterns and the size effect on these clays under varying pressures, culminating in a quantitative relation between size effect and sample settlement. Furthermore, research [28] compared the effects of specimen size on consolidation properties of soft Bangkok clays using two differently sized samples. Lastly, Chen and Lv [29] delved into how the size effect influenced the resilient modulus of red clay samples, employing both laboratory tests and numerical simulations.
Prior research has delved into the impact of the size effect on the strength and deformation properties of residual granite soil. For instance, Zheng et al. [30] executed conventional triaxial consolidation undrained shear tests on coastal residual granite soil samples of 39.1 mm, 61.8 mm, and 101 mm diameters. Their research centred on how the sample size influenced the soil’s stress–strain attributes and strength. A few years prior, similar triaxial tests were conducted on both undisturbed and remoulded granite residual soil samples of varying diameters, emphasizing the correlation between particle size, sample size, stress–strain characteristics, and shear strength [31,32]. Li and Chen [33] undertook K0 triaxial consolidation undrained tests on several sizes of seabed-undisturbed, strongly weathered granite samples. Their focus was in discerning how sample size impacted the stress–strain dynamics and shear strength indices of the weathered granite.
The influence of size effect on the stress–strain behaviour and strength of coarse-grained soil has garnered attention as well. Laboratory triaxial compression and direct shear tests have illustrated the specimen size’s pronounced impact on the stress–strain behaviour of sands, with larger specimens generally showcasing reduced shear strengths [34]. Li et al. [35] performed confining pressure stress path tests on sandstone transition materials of varied sample diameters and maximum particle sizes using a triaxial apparatus. Their research particularly honed in on how sample diameter and particle size influenced the stress-strain-strength characteristics. Further, Mei et al. [36] scrutinized the size effect on sandy gravel deformation using both triaxial compression and bearing capacity tests on two distinct sandy gravel mixture sizes, and they found that extensive experiments can eliminate the error of experimental results caused by the size effect to a certain extent.
Cerato and Lutenegger [37] tested sands from five distinct regions using three different-sized square shear boxes (60 mm, 101.6 mm, and 304.8 mm). Their findings indicate that the friction angle was inversely proportional to specimen size. Zhu et al. [38] also engaged in triaxial consolidation drained shear tests on rockfill samples of varying diameters, aiming to understand the sample size’s effect on the stress-strain and strength properties of coarse-grained soil. In another study, Yang et al. [39] contrasted the shear strengths of expansive soil obtained from both indoor and field shear tests, identifying significant disparities attributed to the size effect. They further evaluated the origins of the size effect and proposed a reduction coefficient for shear strength in indoor tests. Huang [40] aggregated a vast array of experimental data to discern how sample size affected the shear strength of expansive soil. He subsequently crafted a method to ascertain a reasonable diameter and shear strength indices c and φ when evaluating the shear strength of expansive soil.
Notably, there is a paucity of research concerning the effect of sample height pertaining to dredged silt. To bridge this gap, the present study probes the dredged silt found on the ground surface of reinforcement treatments and land reclamation projects in Qianwan, Shenzhen.
Using an automatic air pressure consolidometer, consolidation tests were conducted on dredged silt samples of three distinct heights. The study delved into the variances in compression, deformation, permeability, and consolidation attributes across samples of different sizes. Additionally, comparisons between the permeability and consolidation properties of regional marine silt and dredged silt were drawn, offering a theoretical foundation for the engineering practices of dredged silt foundation treatments.

2. Test Scheme

2.1. Sampled Location

Soil samples were procured from the dredged silt in the land reclamation region of Qianwan, Shenzhen, China. The exact location of sampling is depicted in Figure 1. The water depth at this sampling location ranges between 0 and 1 m. The surface consists of dredged silt, which has been subjected to aeration and sedimentation for a year, with marine silt lying beneath.

2.2. Sampling

After digging to a depth 1 m of silt on the surface, a sampled point with uniform soil quality and no shell debris was selected. A PVC pipe with a diameter of 80 mm and a length of 40 cm was pressed into the soil layer at a depth of 1–2 m to extract samples. Upon sampling, these samples were meticulously sealed within dual layers of plastic bags and subsequently stored in rigid containers to ensure protection. Care was taken to confirm that the plastic bags were securely sealed, exhibiting no visible water leakage.

2.3. Test Instrument

For testing purposes, an automatic air pressure consolidometer was utilized. When contrasted with the traditional single-lever consolidation device, this instrument offers distinct advantages:
(1)
It facilitates real-time data capture, aligning with test parameters set for specific time and load sequences. The device visually projects both the square root of time curve and the logarithmic time curve. Consequently, it offers superior adaptability and accelerates the testing phase when compared to the single lever consolidation device.
(2)
The apparatus autonomously collects testing data. Both larger and smaller ring knives can be individually adjusted and loaded, reducing human involvement and enhancing test accuracy.

2.4. Samples Preparing

Due to the flow-plastic nature of the soil samples, the creation of undisturbed specimens posed challenges. As a result, the sample should be poured into the ring knife of the consolidation apparatus with an area of 30 cm2 in layers and compacted in layers to ensure the density of the sample. The interior of the ring knife was pre-coated with petroleum jelly. Once positioned inside the consolidation container, filter paper and permeable stones were set at both sample termini. The specimen was allowed to rest for an interval, ensuring the permeable stone remained steady with no surrounding water condensation near the side limiting ring before advancing to the next phase. If any significant settlement displacement of the permeable stone was observed, the sample would be reloaded for testing.

2.5. Test Method

A total of 10 bags were methodically assessed, with the mean values of their respective physical properties delineated in Table 1. To discern the effect of drainage distance (denoted by sample height) on test outcomes and the consolidation attributes of the soil samples, both high-pressure and standard consolidation tests were performed on samples of varying initial heights (as expounded in Table 2). These tests were carried out at room temperature, under conditions of double-sided drainage. Adhering to prevailing test standard specifications, the initial height for soil samples in the high-pressure consolidation test was set at 2 cm. Meanwhile, in the standard consolidation test, the samples had initial heights of 2 cm, 3 cm, and 4 cm, each possessing a cross-sectional area of 30 cm2. Given the sample’s intrinsic low initial strength, the first and second consolidation pressures were calibrated at 5 kPa and 12.5 kPa, respectively. Deformation measurements revealed values falling below the 0.005 mm/h threshold, which was designated as the stability criterion for each loading stage. Any subsequent loading was commenced only upon confirming that the sample exhibited stable deformation under the preceding load. In a bid to achieve comprehensive consolidation, the terminal load stage was maintained consistently, allowing the consolidation process to span the ensuing three days.

3. Test Results and Analysis

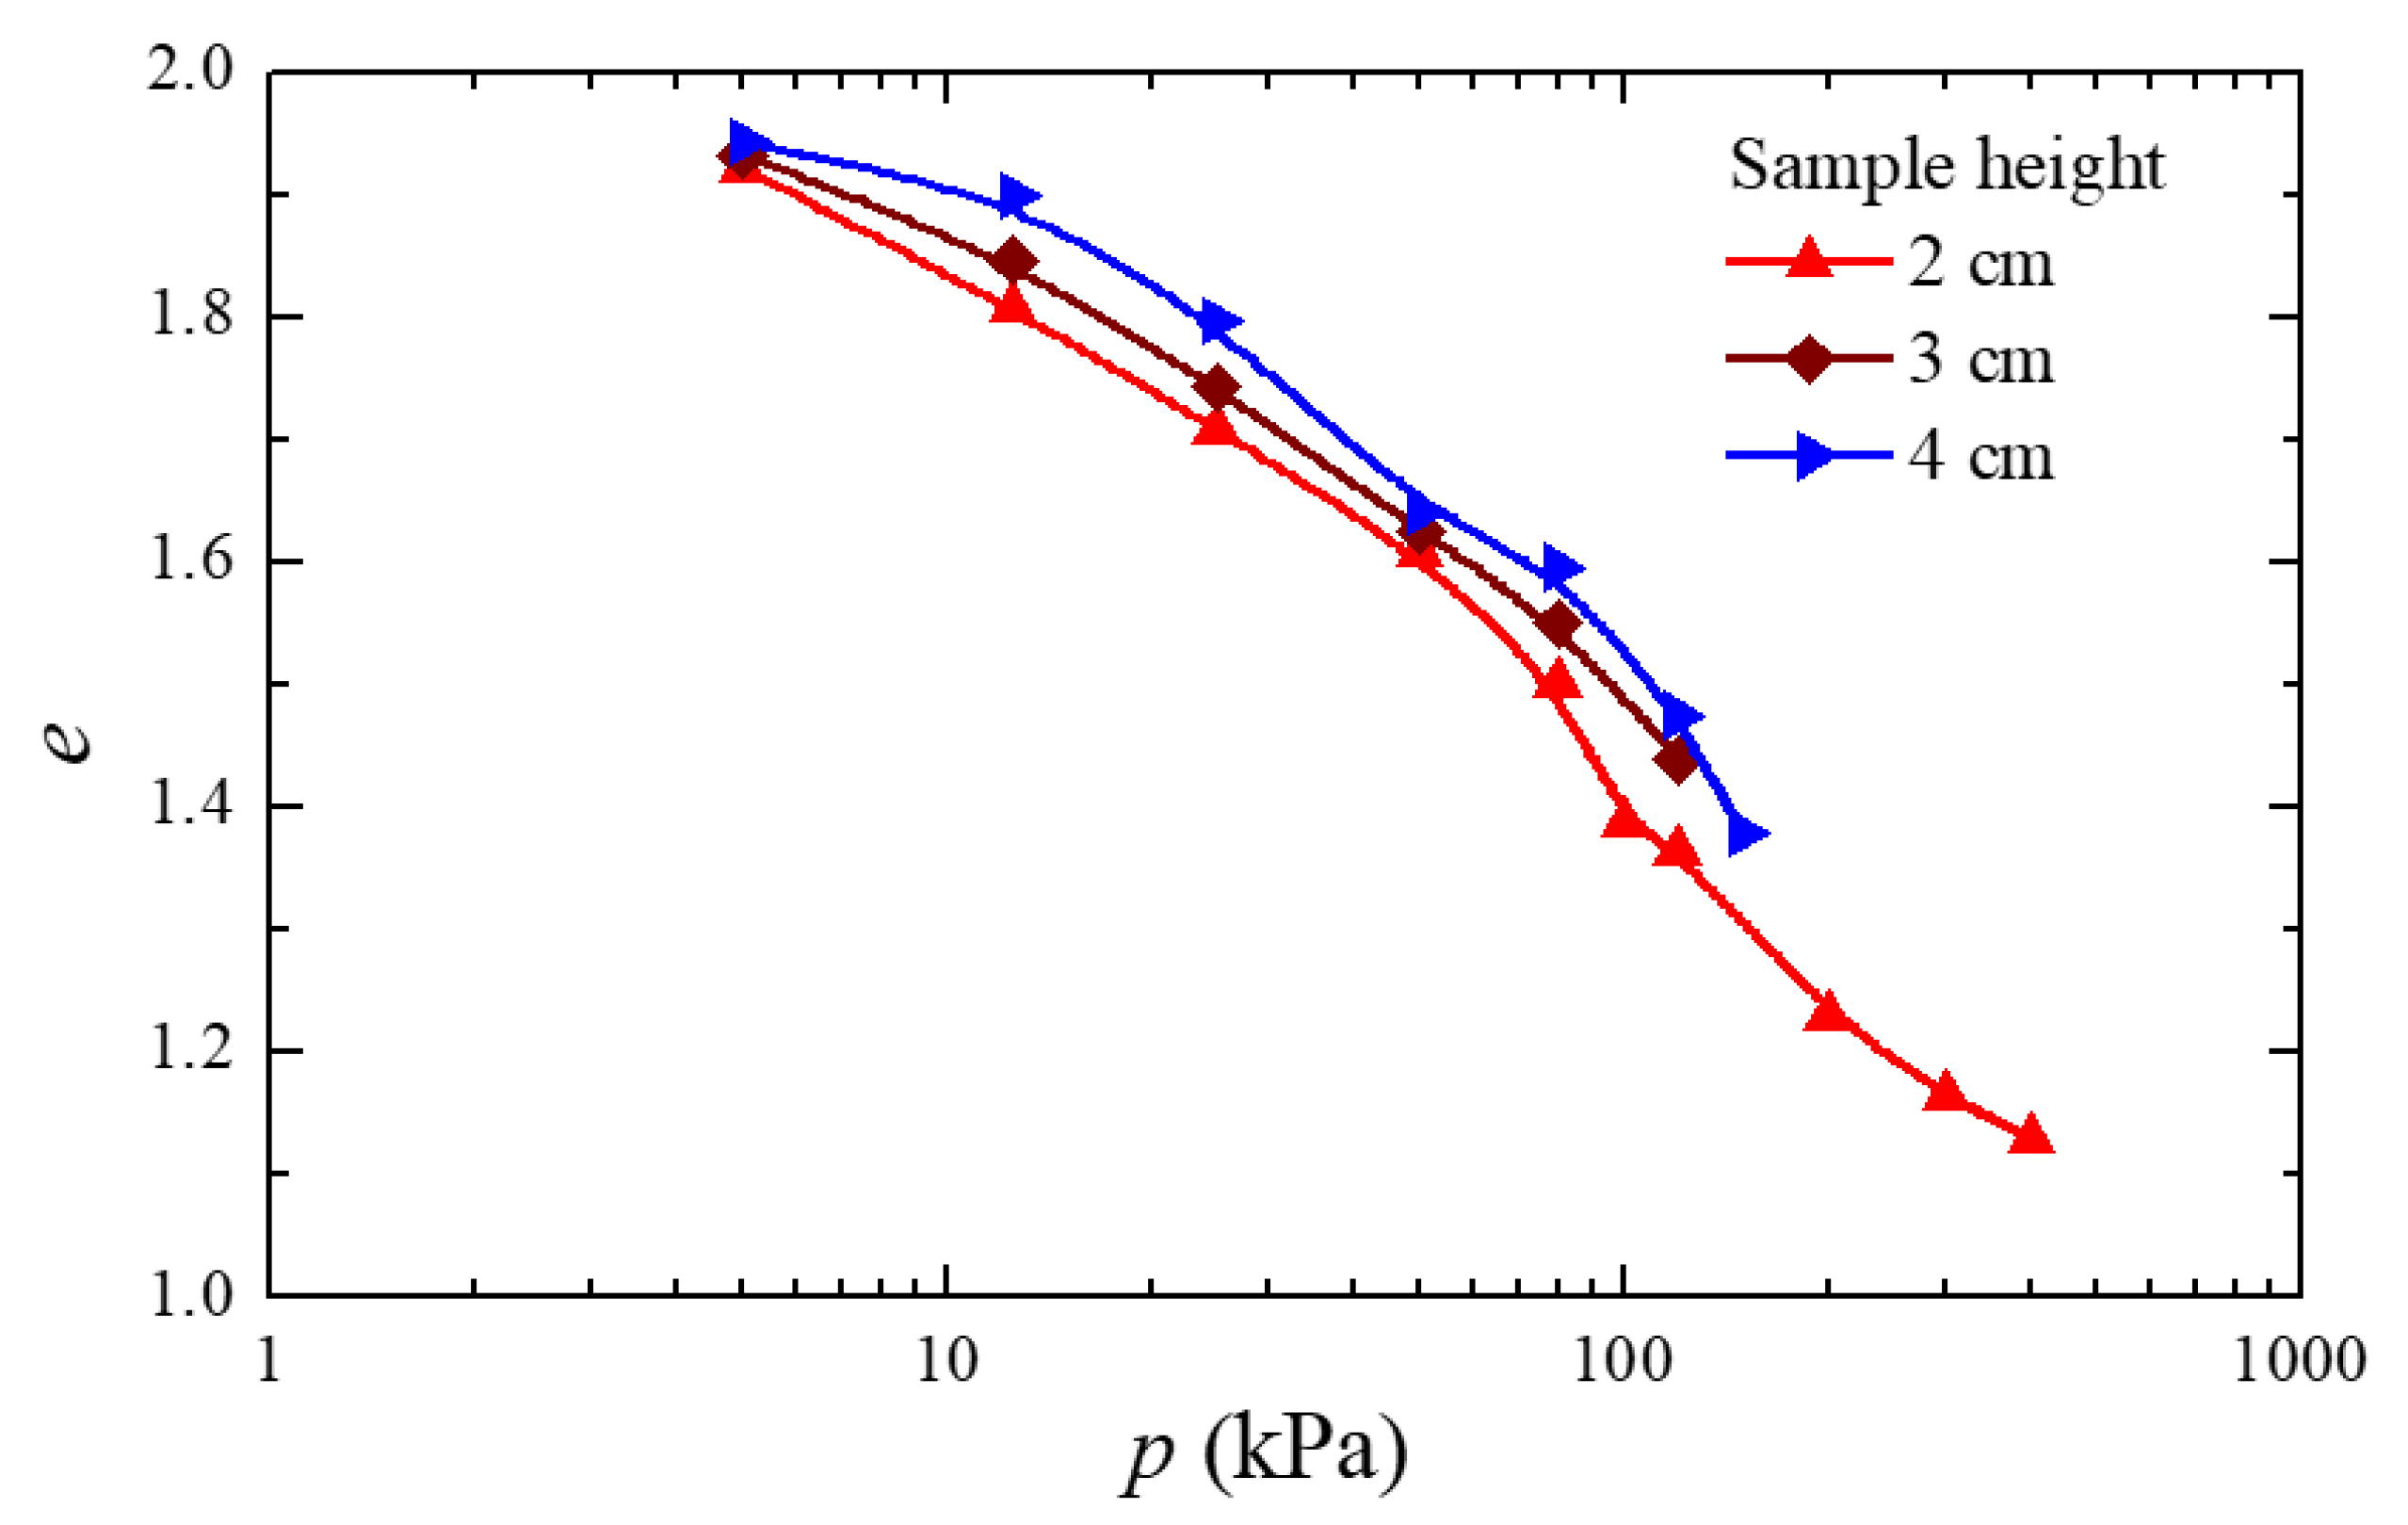
3.1. Compression Curve

Figure 2 and Figure 3 depict the e-p and e-lgp curves for samples of varying heights. Both figures indicate that the compression curves across different sample heights exhibit a consistent pattern. The compression process of dredged silt can be categorized into three distinct phases:
(1)
Initial Load Disturbance Phase (consolidation pressure p ≤ 12.5 kPa): This phase features a pronounced compression curve with a high compression coefficient. Owing to the initially loose state of the dredged silt, significant deformation arises even under minimal consolidation pressure. Intense extrusion of inter-particle film water leads to a notable reduction in the void ratio. This behaviour distinctly contrasts with the compression characteristics typically observed in natural soft clays.
(2)
Elastic Deformation Phase: As the consolidation pressure rises (p = 25~150 kPa), the soil undergoes continuous compaction, establishing a renewed structural strength. This strength partially counters the added pressure, resulting in a gentler curve trajectory which aligns closely with a linear pattern. During this period, the soil’s skeletal structure primarily experiences elastic deformation. With only a minor amount of film water being extruded, the deformation is significantly less pronounced compared to the first phase, and the compression coefficient remains relatively low.
(3)
Plastic Deformation Phase: With further escalation in consolidation pressure, the soil structure becomes compromised. Clay particles undergo relative slippage and adopt a tighter arrangement. Predominantly characterized by plastic deformation, the curve in this stage adopts a concave upwards trajectory. This effect becomes increasingly evident with rising consolidation pressures.
During the initial phase, a significant shift in the void ratio was observed, with little to no variation attributed to differing sample heights. However, the void ratio’s evolution in samples of different heights during the second and third phases demonstrated notable disparities. As the initial height of the sample increased, the drainage span under a specific consolidation pressure also augmented. Consequently, the rate of pore water discharge diminished, leading to a decreased rate of pore ratio change.

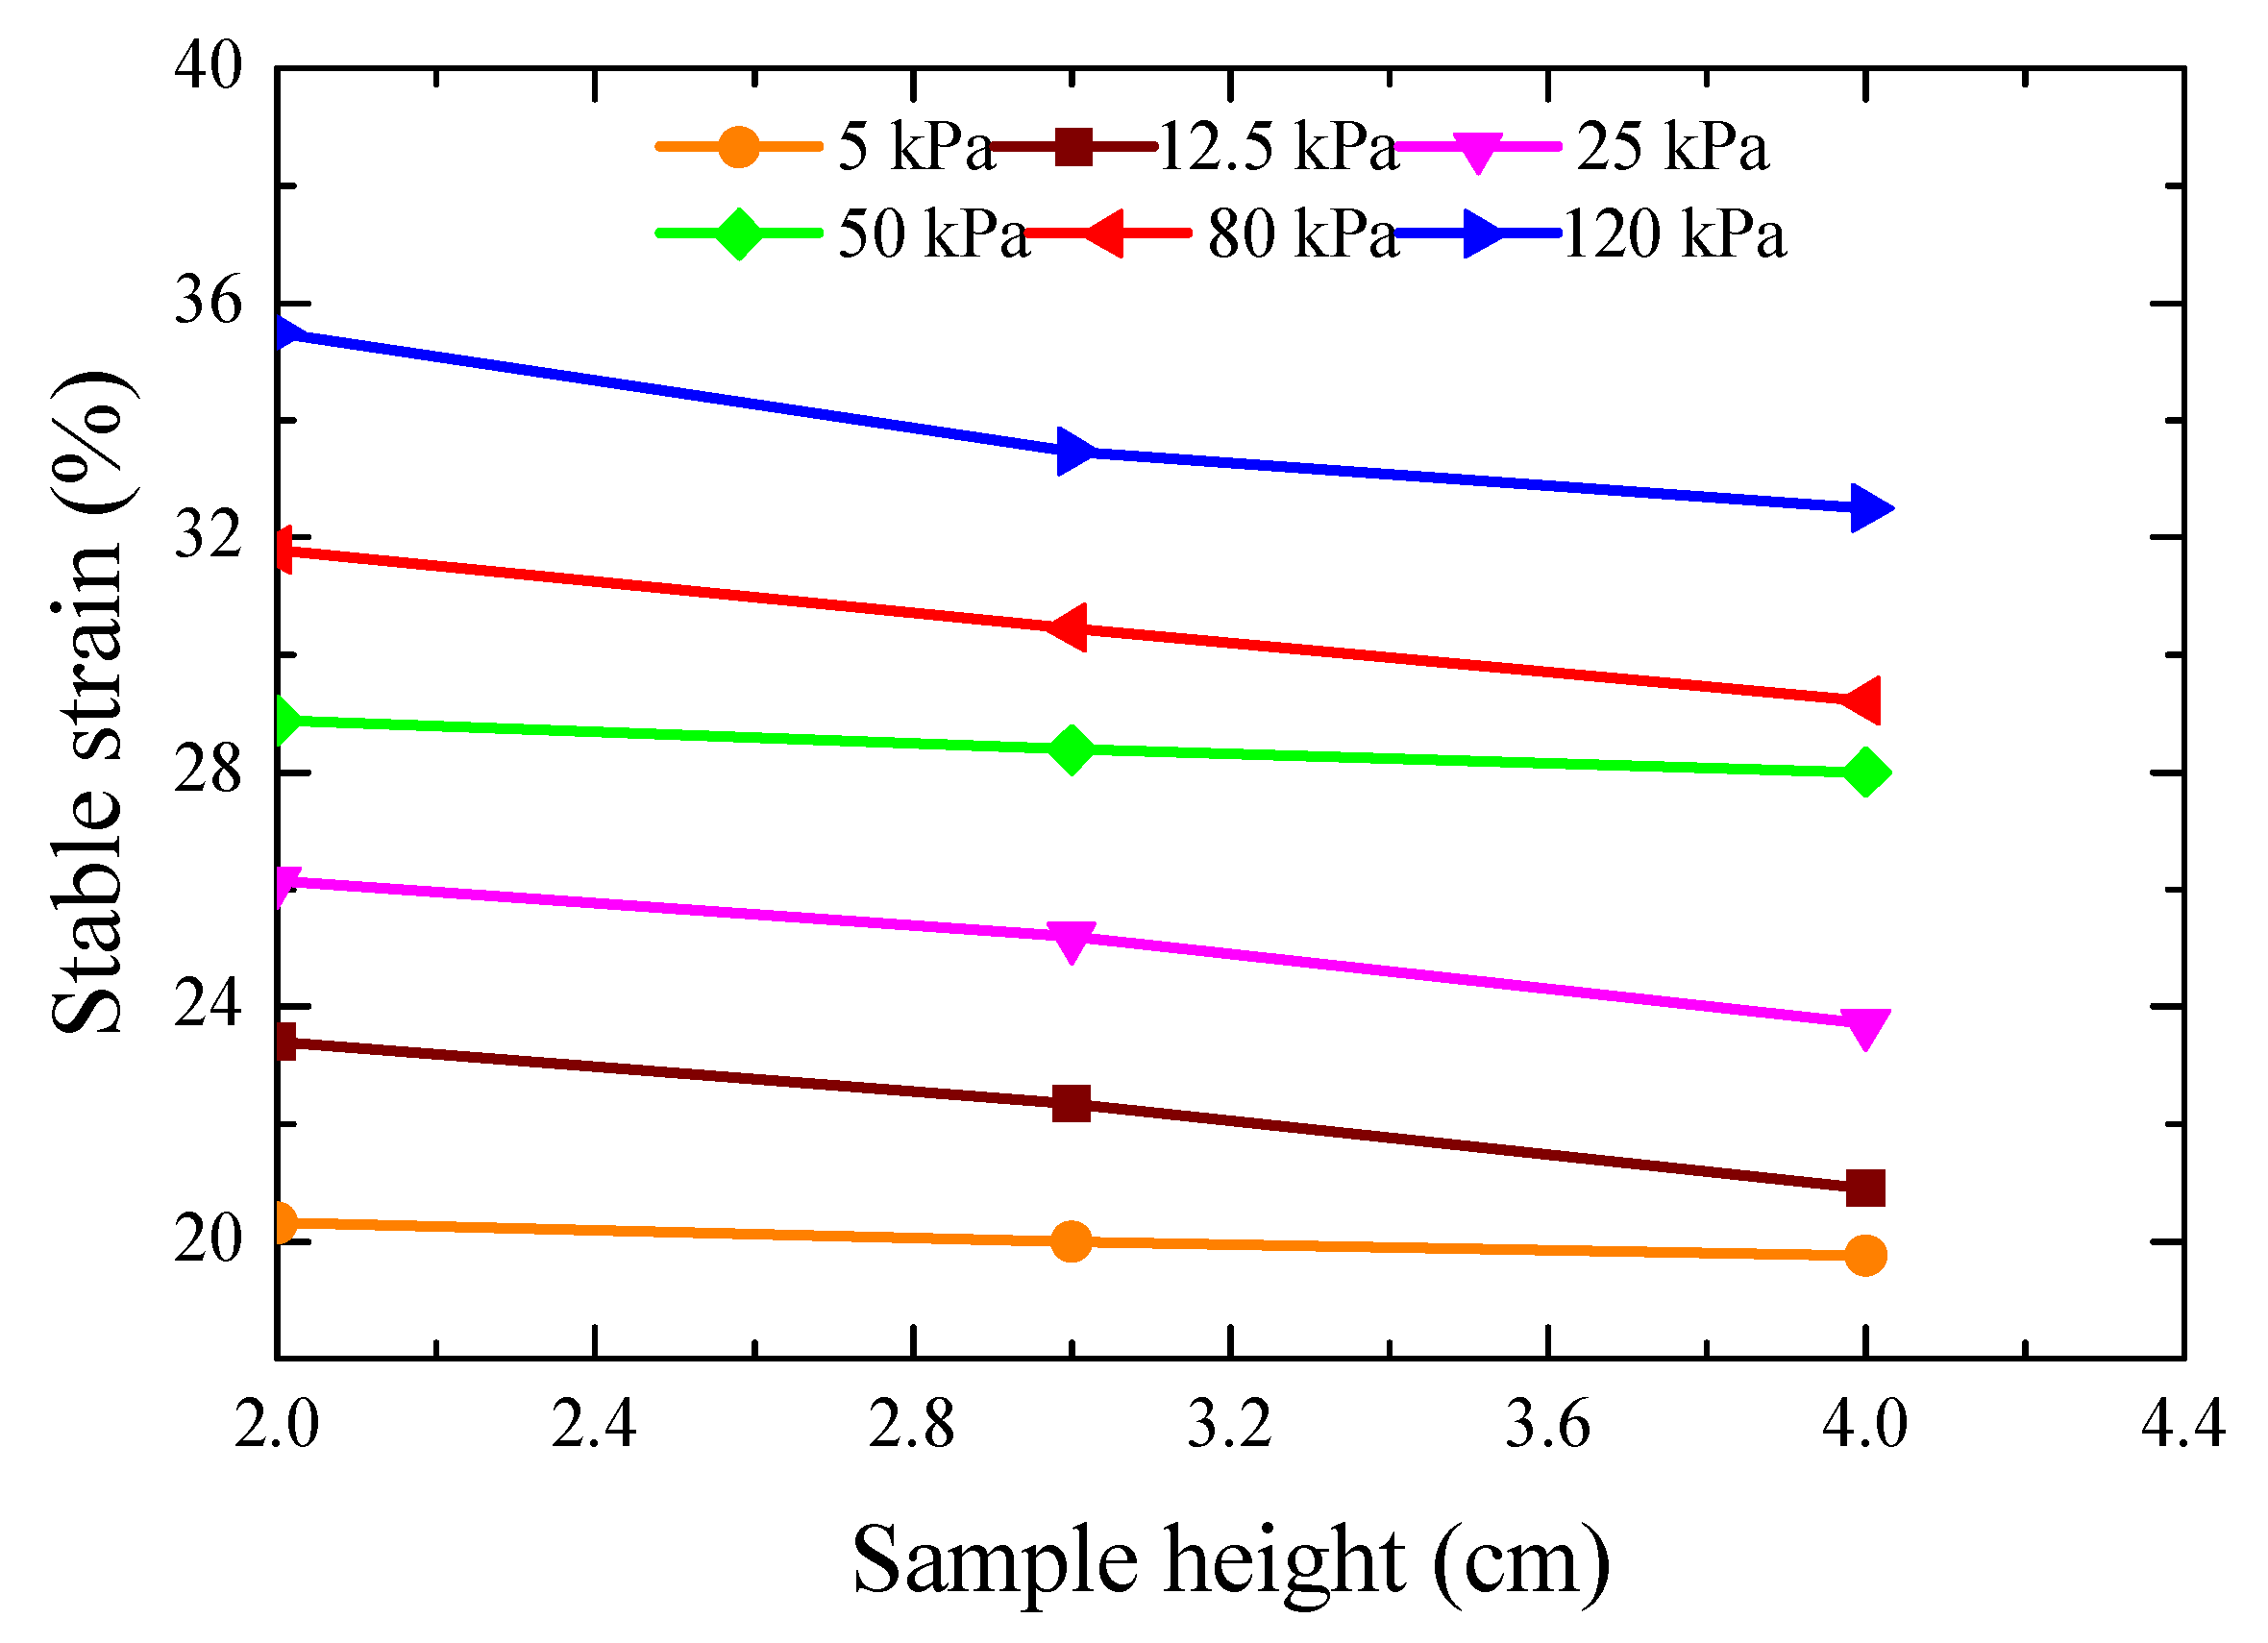
3.2. Compression Strain

Figure 4 displays the cumulative stable strain of samples of various heights under different consolidation pressures. From this figure, it is evident that, under a constant consolidation pressure, the relationship between the sample height and the stable strain of the soil sample was roughly linear. Specifically, as the sample size (or height) increased, the cumulative stable strain of the soil sample diminished. This linear reduction was subtle under lower consolidation pressures but became more pronounced as the pressure escalated.
With the increase of sample height, the change of cumulative strain is shown in Table 3. It can be seen from Table 3 that as the sample height expanded from 2 cm to 3 cm, the smallest strain difference was 0.318% at a consolidation pressure of 5 kPa. Conversely, at a consolidation pressure of 120 kPa, the strain difference peaked at 2.022%. When the sample height transitioned from 3 cm to 4 cm, the minimal strain difference stood at 0.242% under a 5 kPa consolidation pressure. Yet, at a pressure of 25 kPa, this difference reached its zenith at 1.482%. An increase in sample height from 2 cm to 4 cm led to the least strain difference at 0.56% under 5 kPa of consolidation pressure. When subjected to 120 kPa, the most pronounced strain difference was measured at 2.997%.

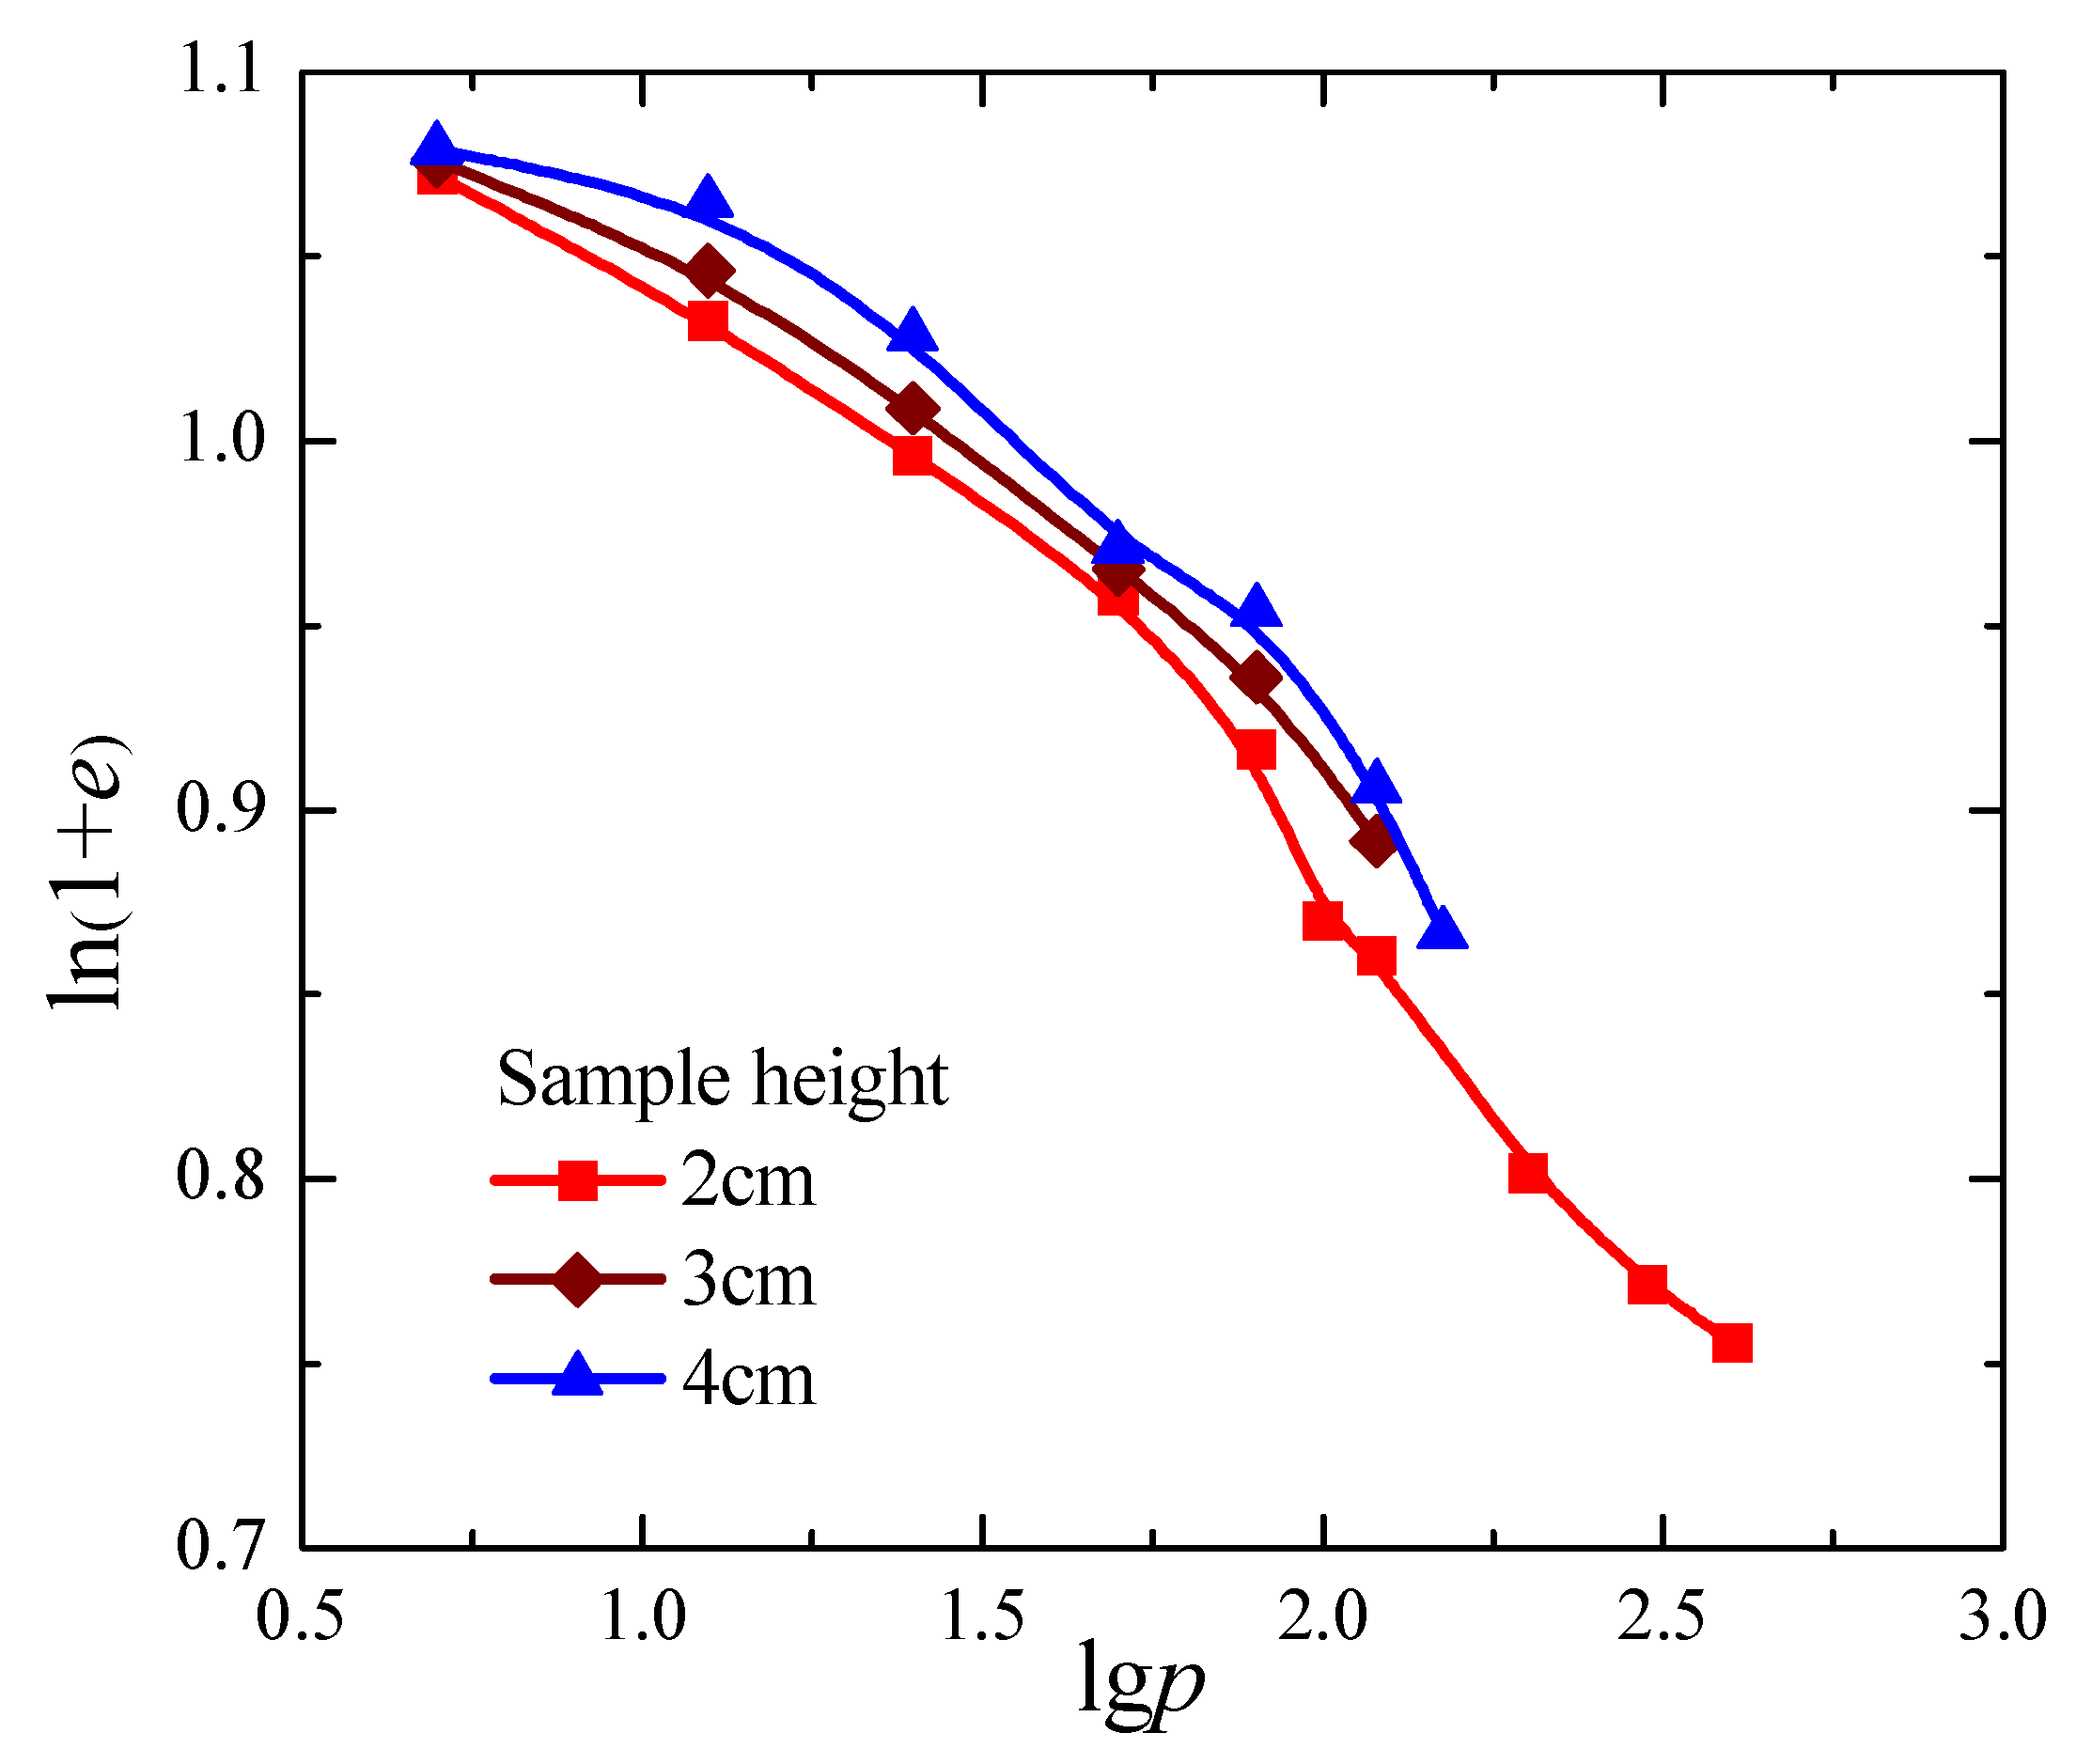
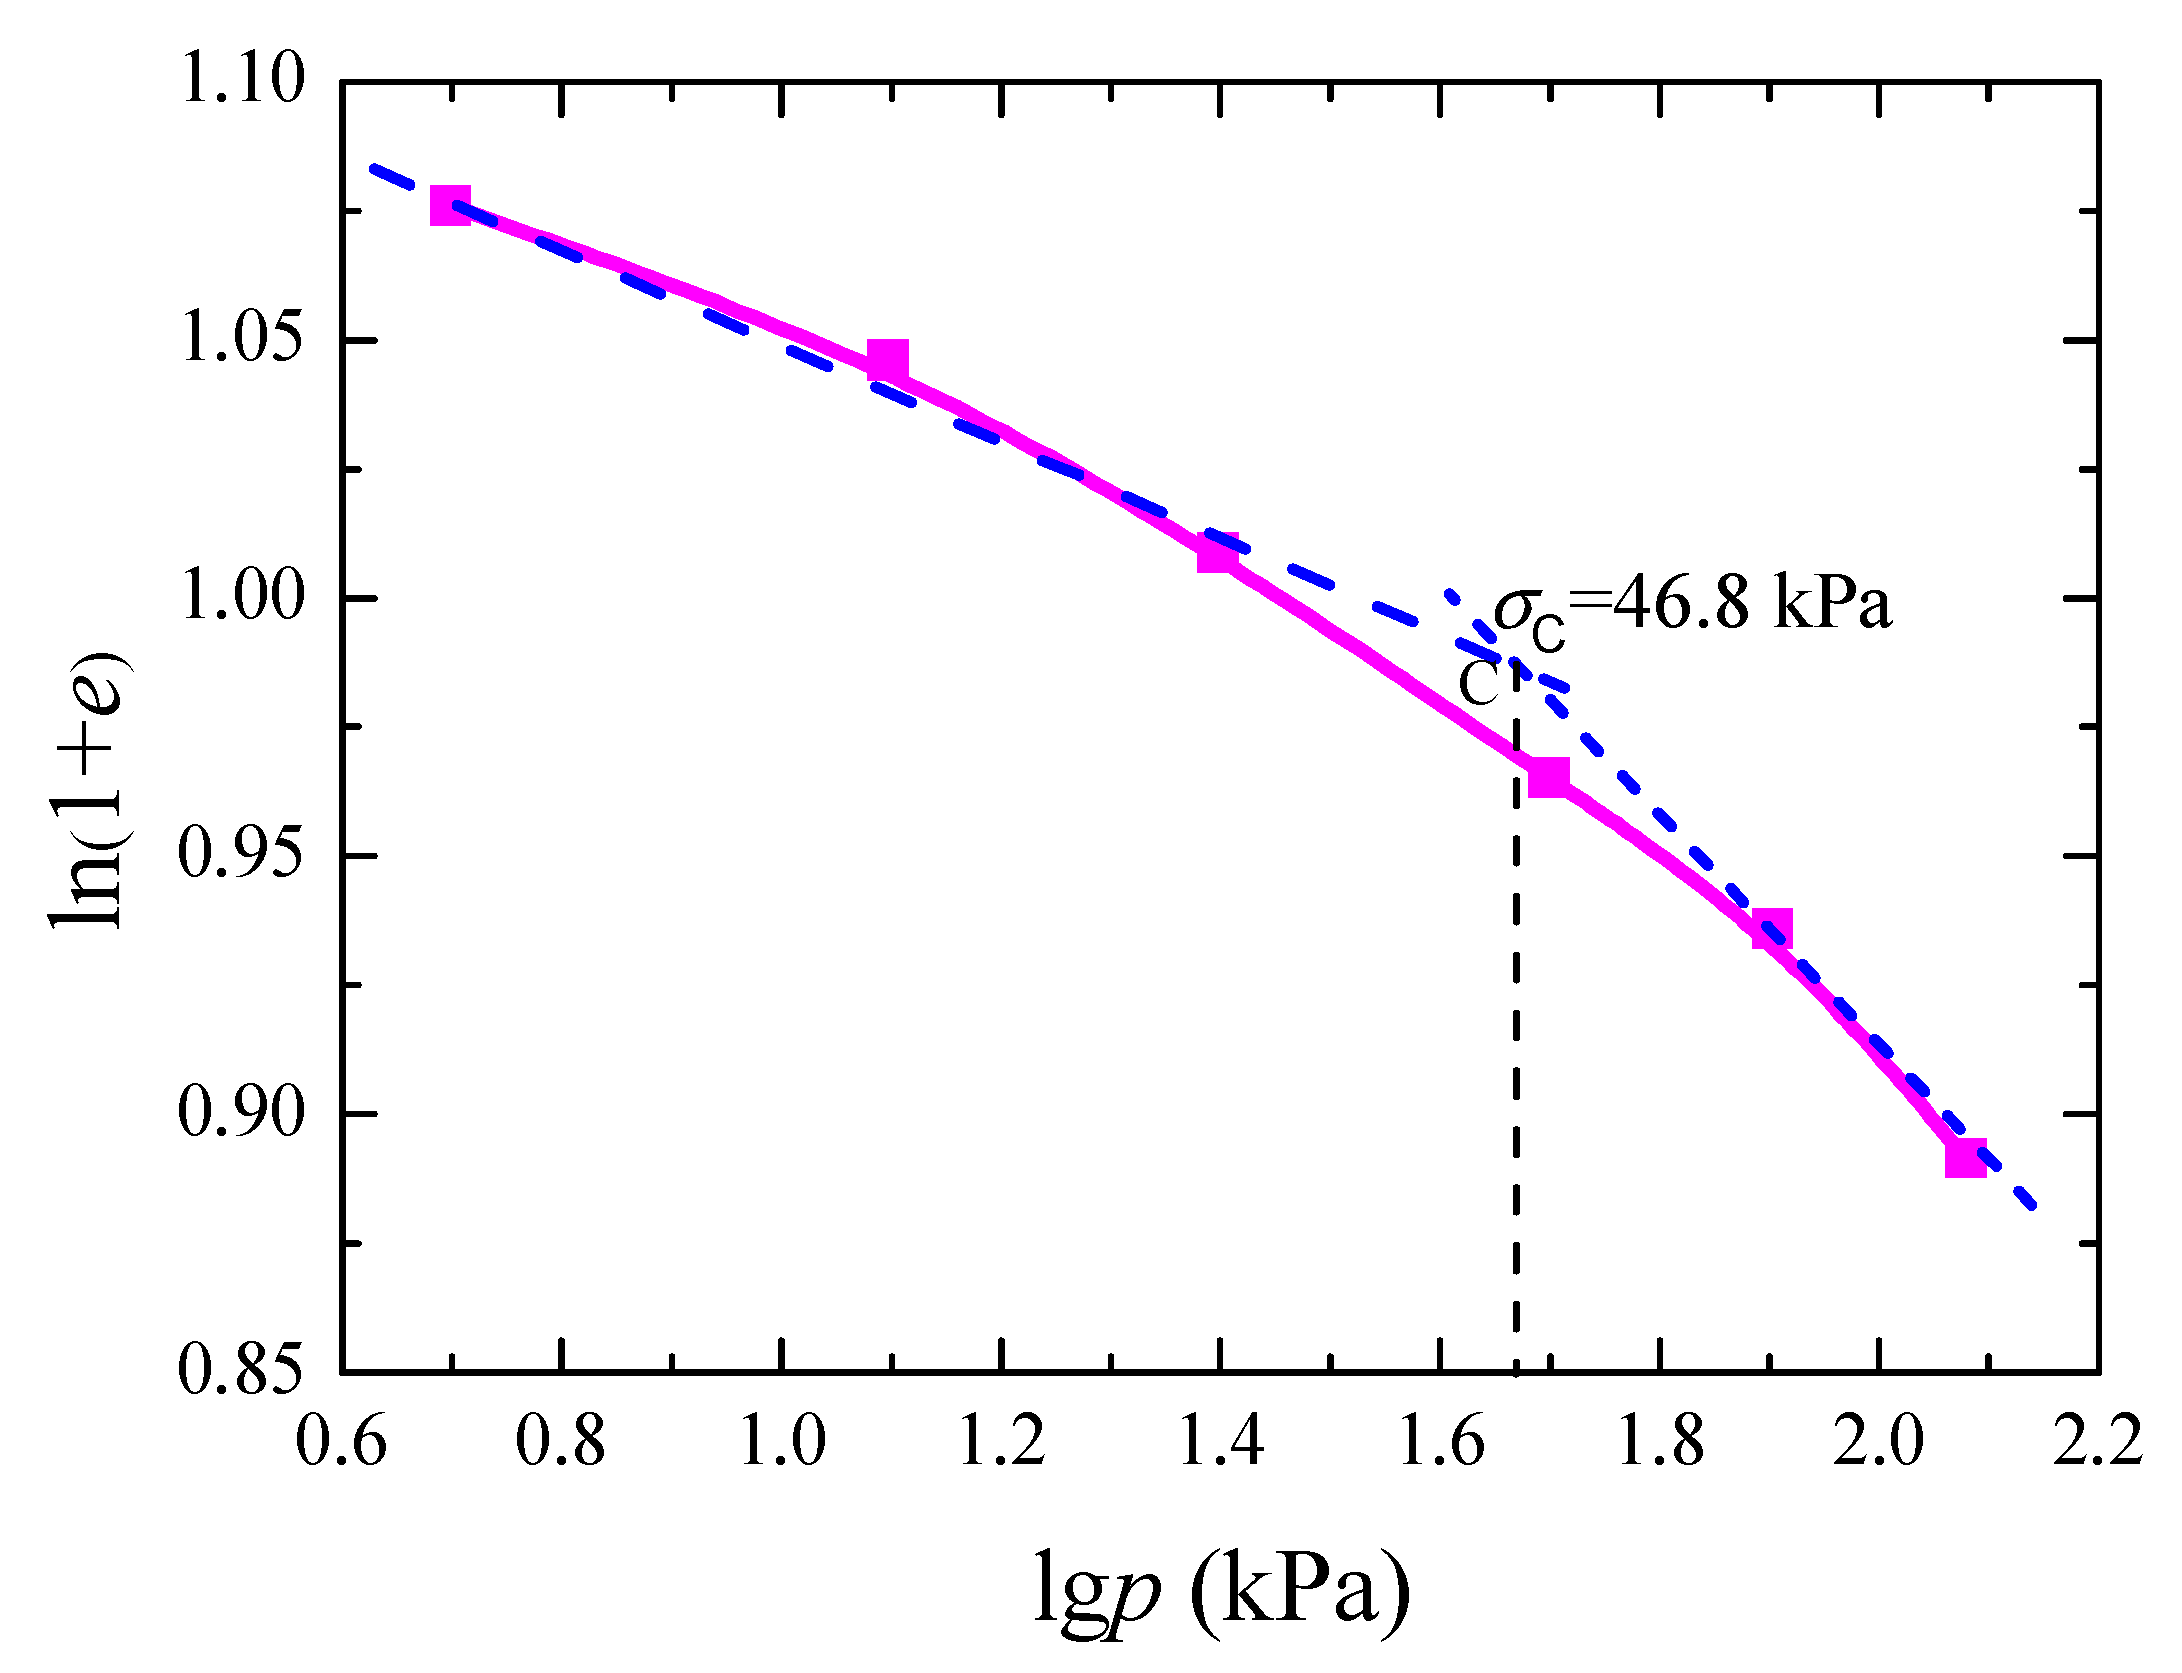
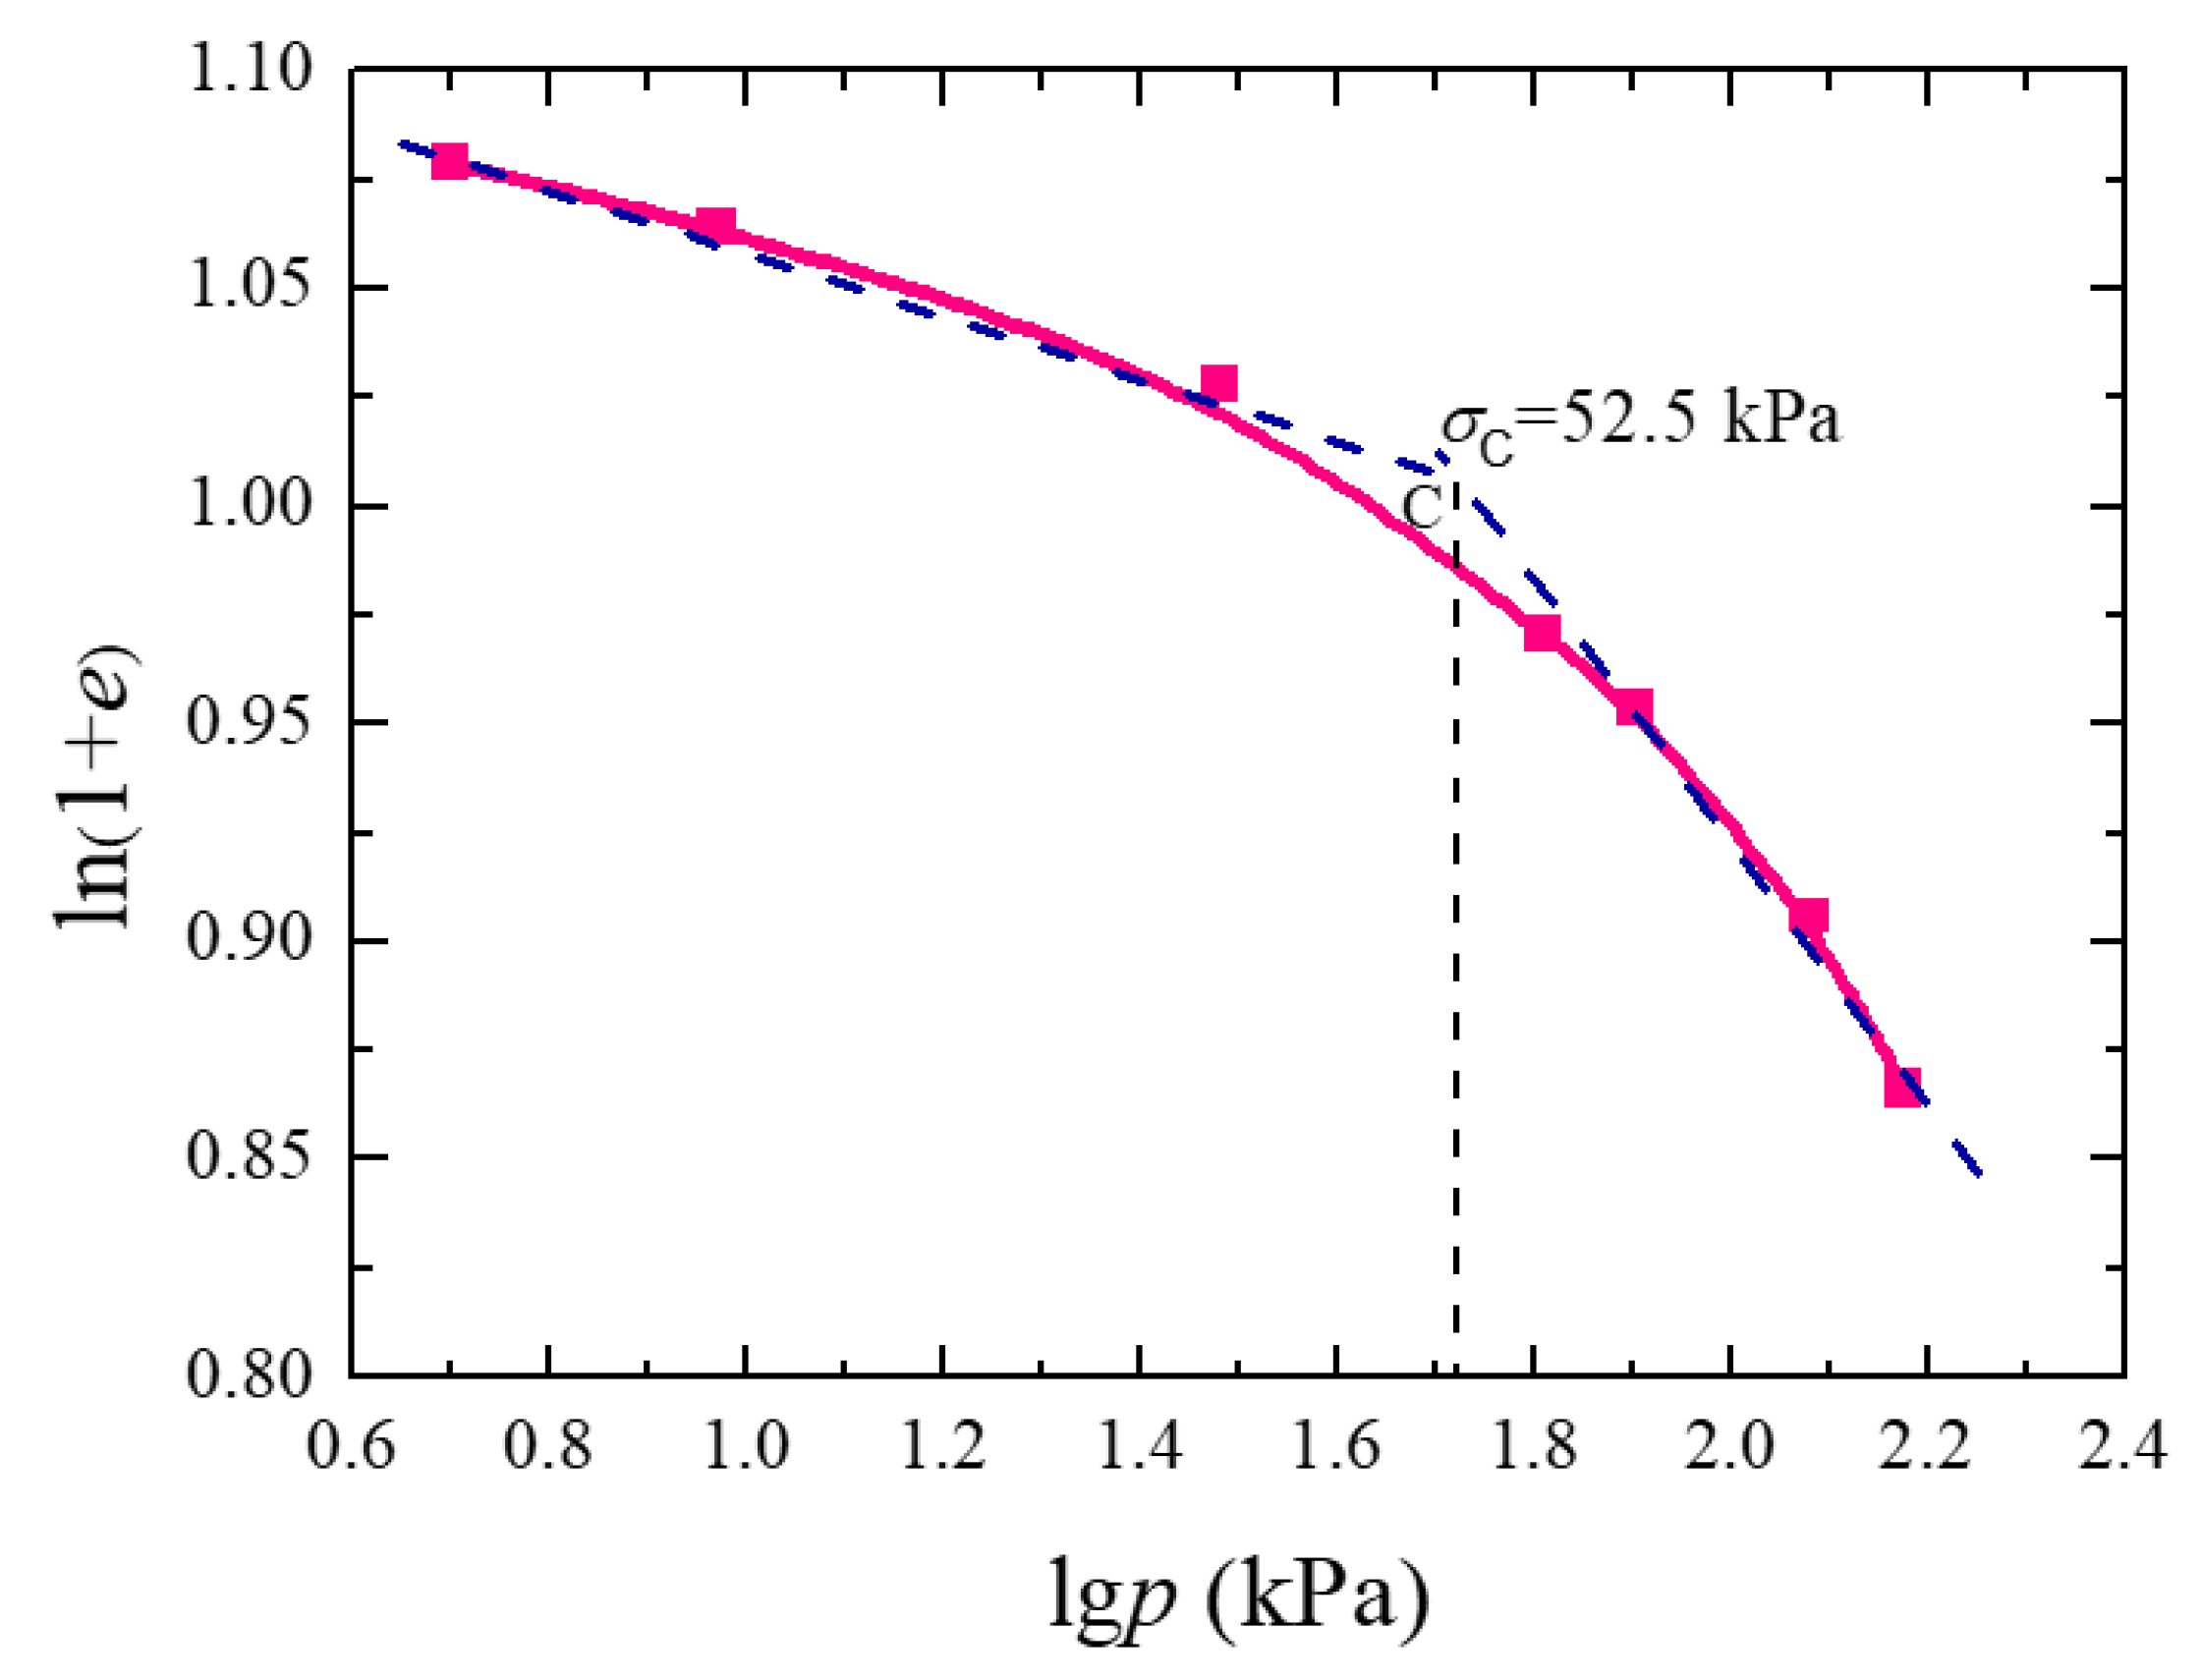
3.3. Yield Stress of Soil Structure and Compression Index

The mechanical characteristics of structural soil, such as dredged silt, vary significantly across stages before and after yielding. One crucial parameter in the assessment of dredged silt is the structural yield stress. Butterfield [41] first introduced the idea of determining this yield stress using double logarithmic coordinates. Subsequent research by various scholars has affirmed the efficacy of this technique, establishing that the intersection point of the two linear graphs represents the yield stress of the soil structure [42,43]. In our study, we employed Butterfield’s double logarithmic coordinates method (ln(1 + e)~lgp) to ascertain the structural yield stress of the dredged silt.
Figure 5, Figure 6, Figure 7 and Figure 8 present the ln(1 + e)~lgp curves for soil samples of diverse dimensions. An examination of these figures reveals compression curves, which can be essentially delineated by two straight lines. Table 4 showcases the structural yield stress values derived from these curves for samples of varying heights. A consistent observation from Table 4 is that the yield stress of the soil samples remained relatively constant, averaging around 50 kPa, regardless of the sample height. This consistency underscores the notion that yield stress is a pivotal metric for gauging the structural integrity of soil. For identical soil compositions, structural strength predominantly hinges on the inherent characteristics, connectivity patterns, and arrangement of soil particles, rather than just sample size. The compression index, denoted as Cc, is calculated based on the gradient of the e-lgp curve in the yielding phase of the soil structure, which closely mirrors a linear progression. Table 4 also presents the compression indices for soil samples at various heights. Notably, as the sample height escalated, the compression index Cc experienced a decline. However, the disparities in compression indices across different sample sizes were marginal.

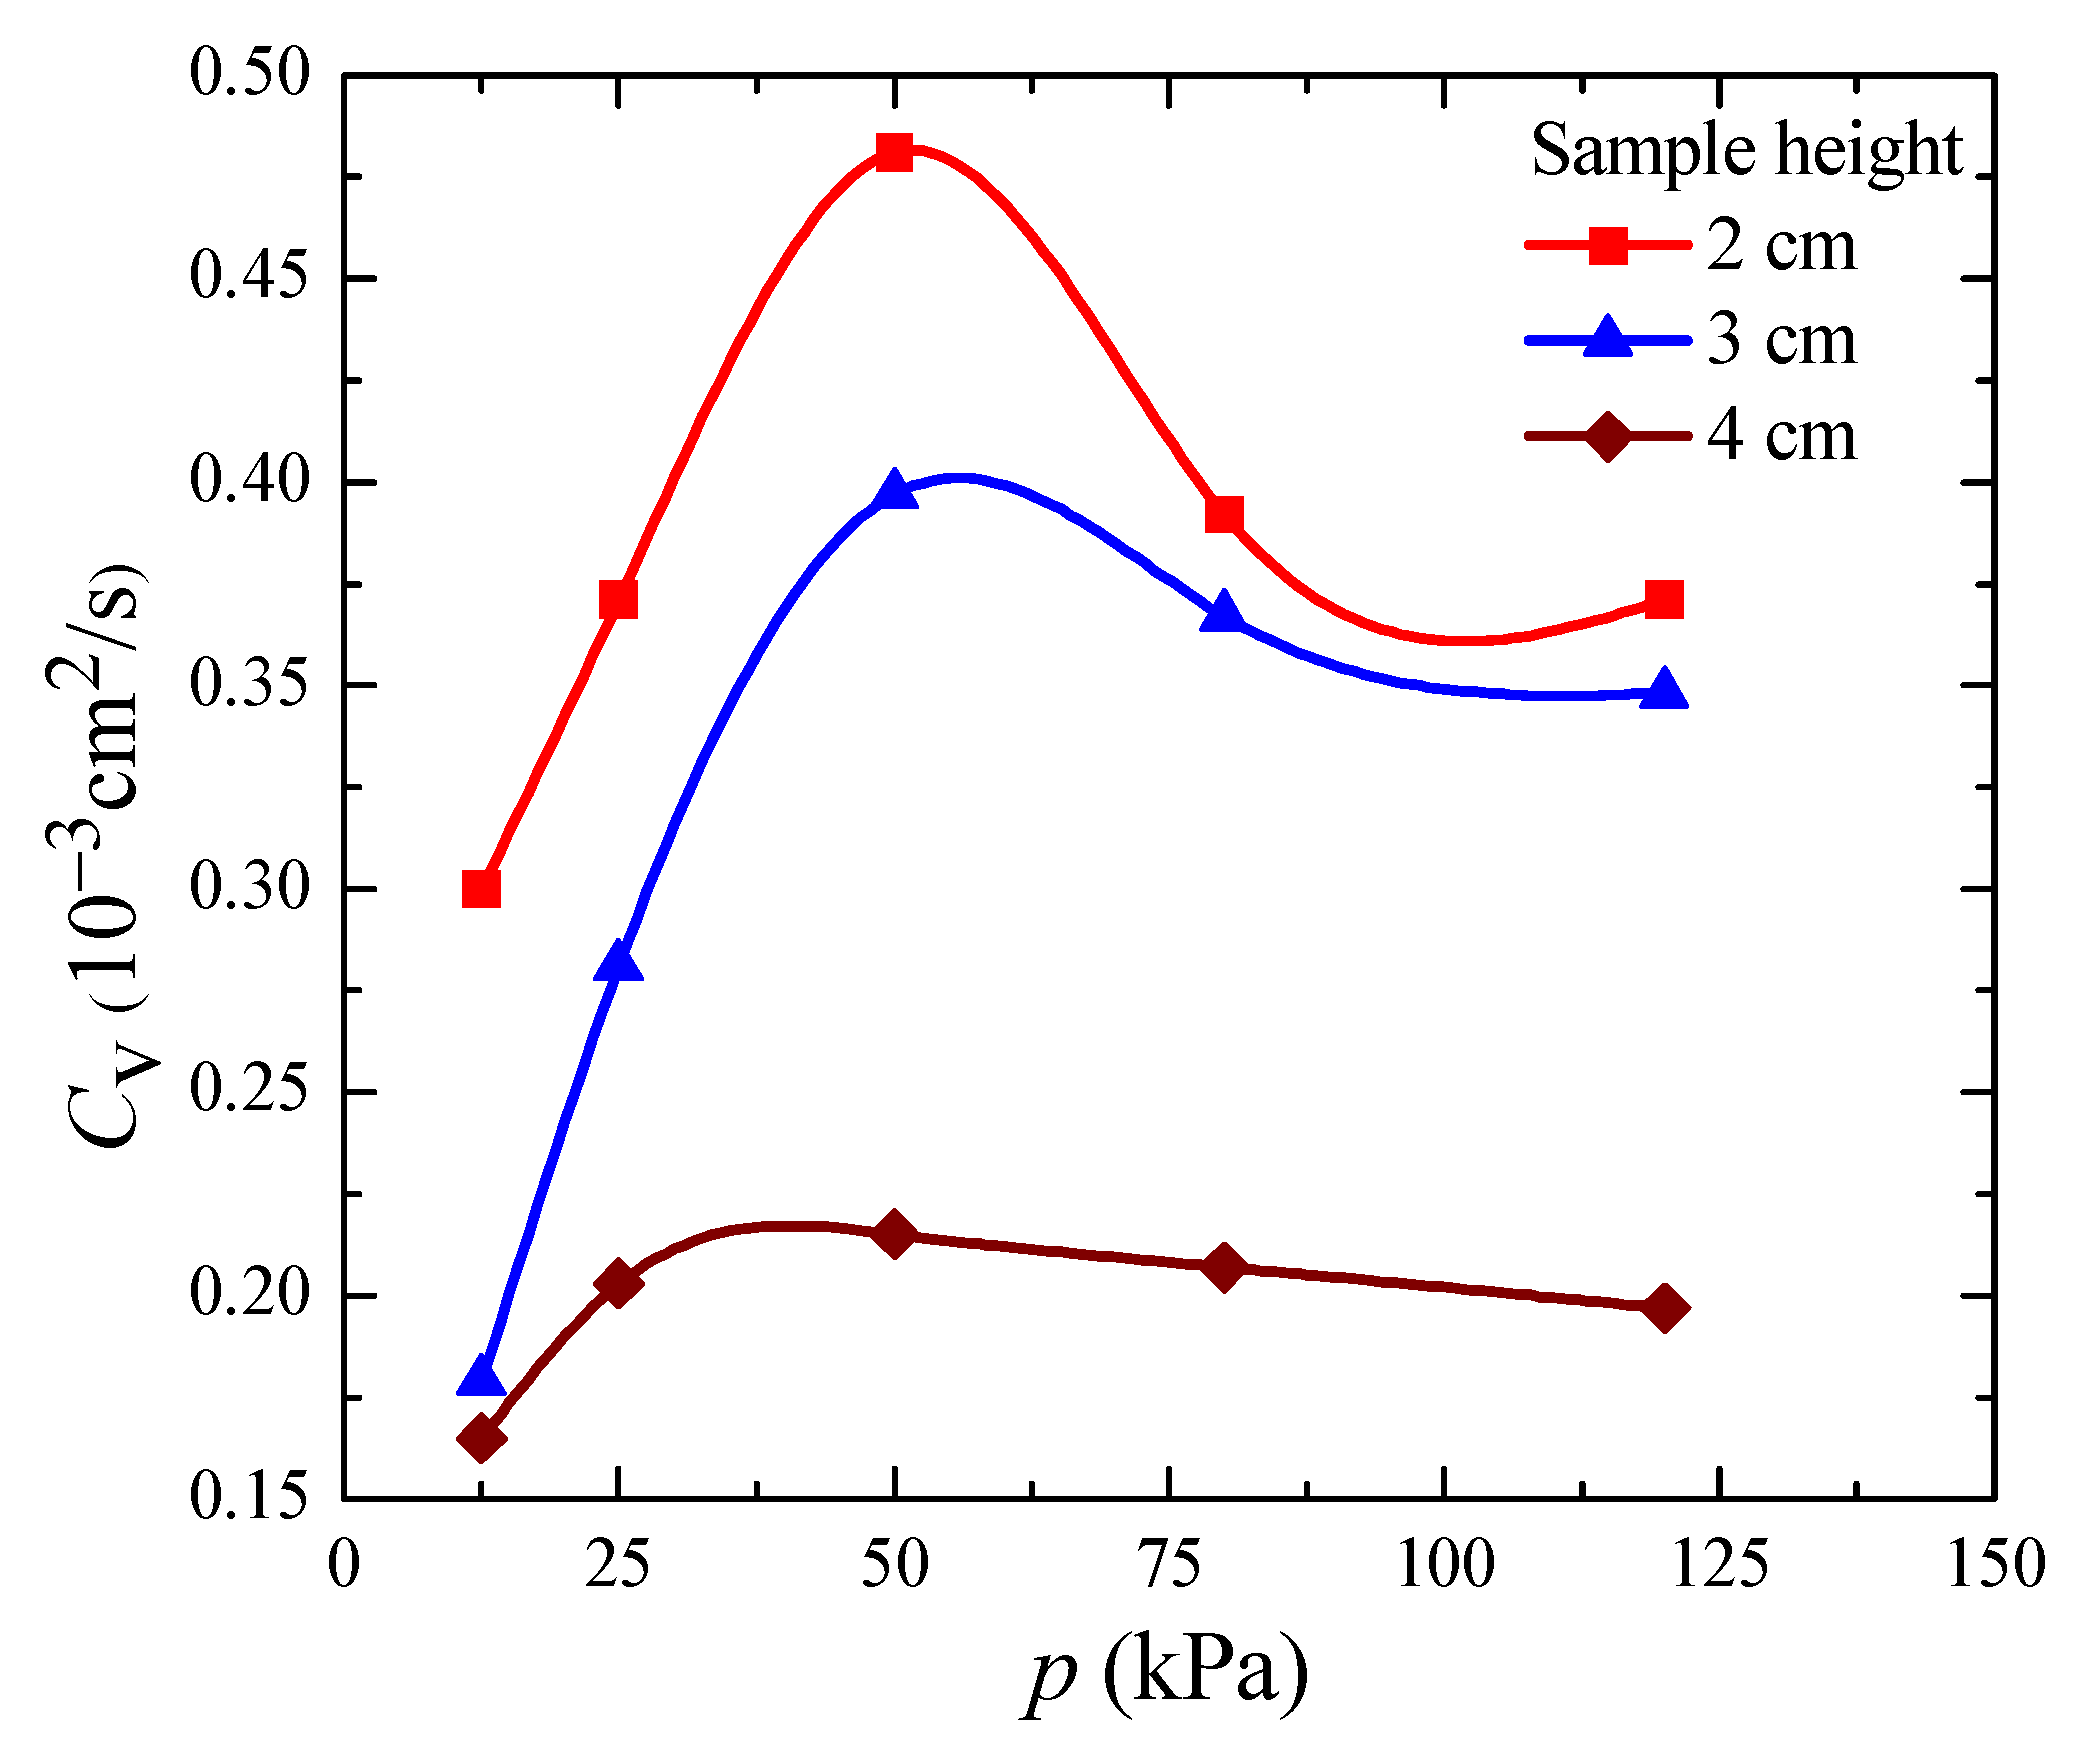
3.4. Coefficient of Consolidation

The coefficient of consolidation was ascertained using an automatic air pressure consolidometer, with results graphically represented by the time square root curve. This coefficient, for samples of varying heights under different consolidation pressures, was derived using the “time square root method”, as depicted in Figure 9.
For a consistent consolidation pressure, an increase in sample height—which corresponds to an extended drainage distance—results in a gradual decrease in the consolidation coefficient of the soil sample. Concurrently, the consolidation rate of the soil sample also diminishes. At a lower consolidation pressure (p = 12.5 kPa), the consolidation coefficient for a soil sample with a height of 2 cm was approximately double that of a 4 cm sample. However, the trend in the consolidation coefficient in relation to consolidation pressure remained uniform across varying sample heights. Specifically, when the consolidation pressure was below the structural yield stress σc (50 kPa), the consolidation coefficient rose with an increase in the consolidation pressure, peaking at the structural yield stress. Conversely, when the consolidation pressure surpassed the structural yield stress σc, the consolidation coefficient diminished with increasing pressure until it stabilised. When the consolidation pressure was beneath the structural yield stress, the soil sample maintained a relatively expansive void ratio. This resulted in enhanced permeability, elevating the consolidation coefficient. However, when the consolidation pressure exceeded the structural yield stress, the soil underwent swift compression deformation, leading to a sharp decline in the void ratio. As a consequence, the soil particles became more densely packed, compromising the interconnectivity between them. This shift influenced the soil’s permeability, causing a rapid decrease in permeability and, in turn, reducing the soil sample’s consolidation coefficient.
However, one key observation was that the consolidation coefficient reduced as the soil sample height increased. Relying solely on the consolidation coefficient acquired from conventional soil samples (of 2 cm height) to forecast the consolidation rate and settlement process of dredged silt foundations would be an oversimplification. It underscores the need for an in-depth exploration into the impact of size effects on the consolidation process.

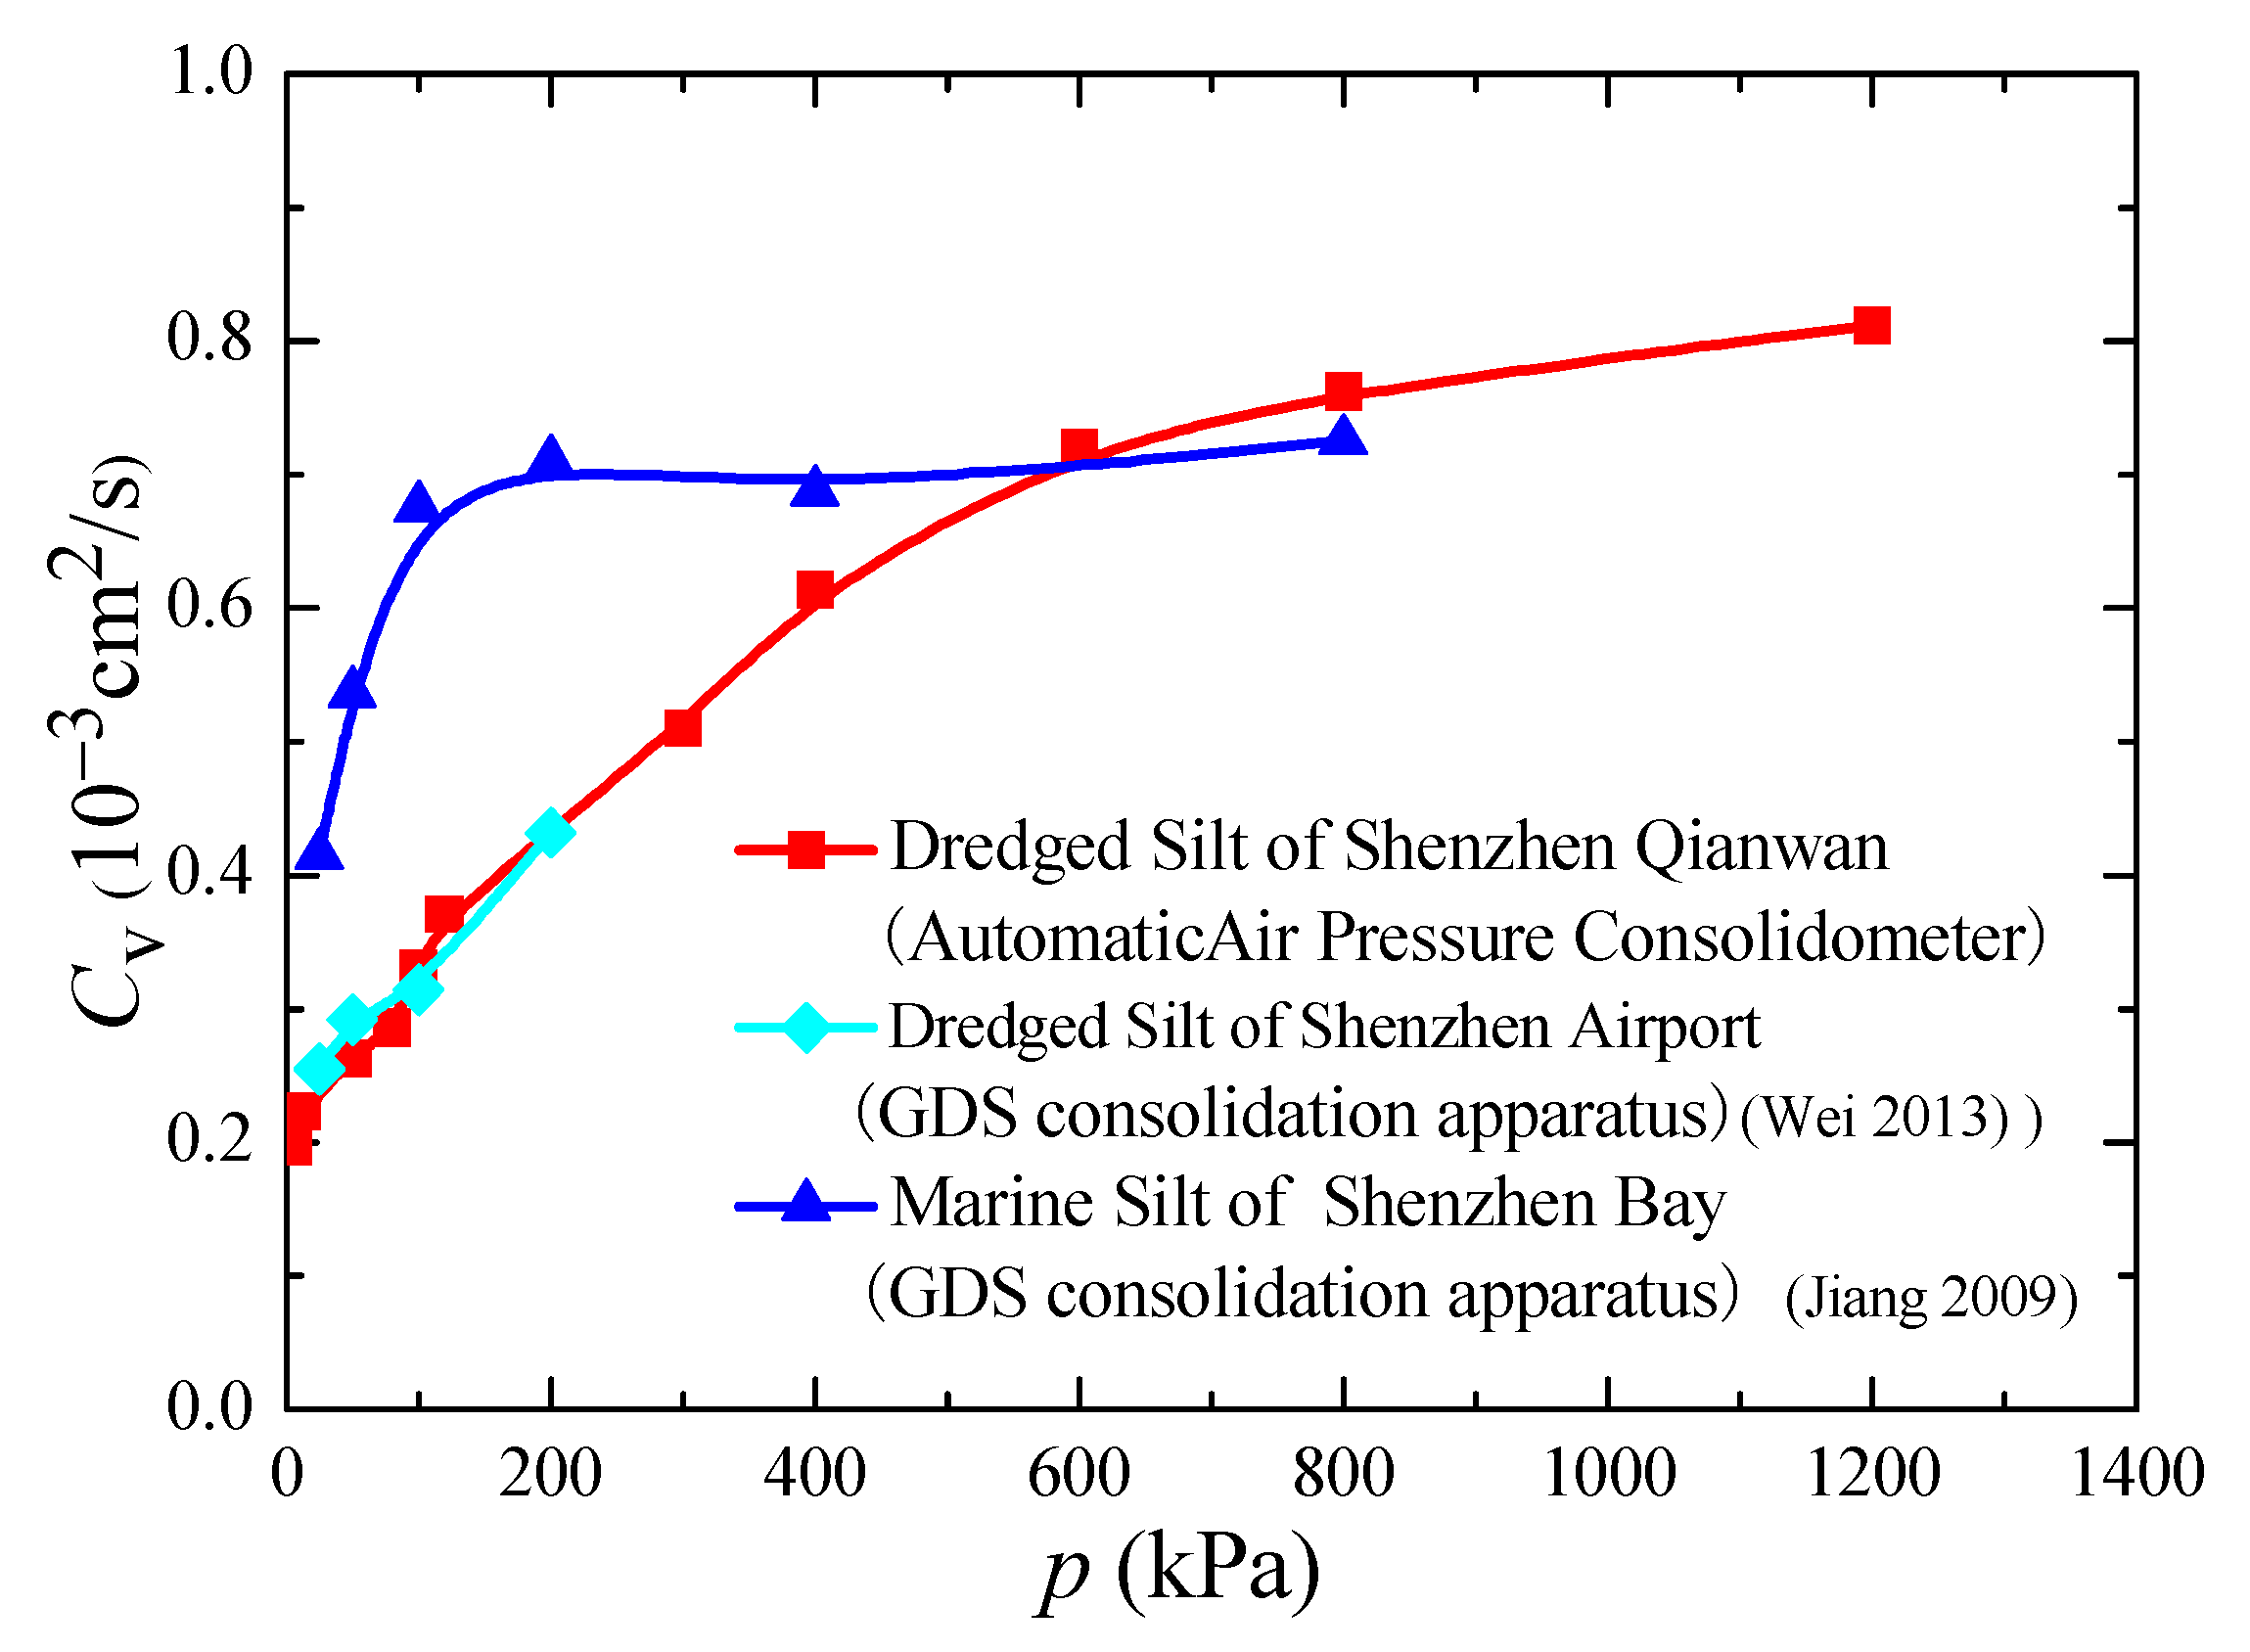
3.5. Comparative Analysis of Consolidation Coefficient between Dredged Silt and Marine Silt

Silt samples from identical regions, specifically dredged silt and marine silt (refer to Table 1), were examined. Table 5 delineates the physical attributes of both silt types along with the associated consolidation pressures. Both types presented similar initial water content and void ratios. These were analysed to determine variations in the consolidation coefficient and permeability coefficient in relation to consolidation pressure. The GDS consolidation device was employed for both consolidation and permeability tests to calculate these coefficients. Marine silt was sourced from a depth of 2 m in the shallow waters adjacent to the west channel port of Shenzhen Bay, and the test process and test results were described by Jiang [44]. In contrast, the dredged silt originated from 0.5 to 1.5 m depths atop the silt pond within Shenzhen airport’s reclamation zone, and the test results were presented in Wei’s study [45]. Additionally, Zhang et al. [16] conducted particle analysis tests on three types of silt samples and tested the composition of clay minerals by X-ray diffraction method. The outcomes are presented in Table 6.
Figure 10 depicts the consolidation coefficient’s fluctuation as a function of consolidation pressure across the three silt types. Observations from Figure 10 include:
(1)
The consistency between the curves representing the consolidation coefficient of dredged silt from Shenzhen Qianwan and Shenzhen Airport suggests the reliability of the different consolidation devices employed. As the consolidation pressure amplified, the consolidation coefficient of dredged silt followed suit. Specifically, below or at 200 kPa, it continually rose in proportion to the intensifying consolidation pressure. For instance, under a preloading load ranging from 50 to 300 kPa, the coefficient surged from 0.263 × 10⁻³ cm2/s to 0.510 × 10⁻³ cm2/s. This doubling emphasizes the potential inaccuracies if one were to use a static consolidation coefficient for predicting settlement progression and consolidation intensity.
(2)
At pressures less than or equal to 200 kPa, marine silt’s consolidation coefficient significantly surpassed that of the two dredged silt types. As this pressure escalated, the disparity between the silts diminished, eventually converging at a singular point. At a consolidation pressure of 600 kPa, the dredged silt’s coefficient outperformed that of marine silt. These findings highlight the inferior initial consolidation properties of dredged silt. However, post-preloading treatment, it can either match or surpass marine silt’s drainage consolidation rate.
The distinction between the consolidation coefficients of dredged and marine silt is rooted in their formation mechanisms, stress histories, and compositional differences. Dredged silt emerges from undisturbed marine silt subjected to aerating and mechanical agitation, leading to under-consolidated soil. This disruption alters the initial soil structure into a looser form, characterised by unstable turbidity and granular patterns. These features contrast with the marine silt’s predominantly granular bonding and honeycomb formations. The test results in Table 6 reveal that the marine silt in Shenzhen is dominated by kaolinite, followed by illite and chlorite. The results also indicate that dredged silt predominantly comprises illite/montmorillonite and kaolinite. These distinctions yield marked differences in physical and mechanical properties. For example, dredged silt has a more substantial water content and void ratio than marine silt, making its consolidation coefficient less than that of marine silt.
Table 6 offers a summary of the clay and colloid proportions from the Shenzhen Qianwan dredged silt, Shenzhen Airport dredged silt, and marine silt from Shenzhen Bay’s western channel. The recorded values were 47.0%, 48.2%, and 54.8%, respectively. Whereas these figures closely align, it is evident that particle size composition profoundly affected the soil’s drainage consolidation rate. In later testing stages under a high consolidation pressure, dredged silt’s consolidation coefficient approached or even surpassed that of marine silt.

3.6. Comparative Analysis of Permeability Coefficient between Dredged Silt and Marine Silt

The permeability coefficient was determined based on the consolidation coefficients of the three silt samples. Figure 11 illustrates the permeability coefficient’s variation in relation to the consolidation pressure. Two primary observations emerged:
(1)
The permeability coefficient of dredged silt measured by different consolidation apparatuses in Shenzhen Qianwan and Shenzhen Airport had the same variation under the consolidation pressure. When the consolidation pressure p ≤ 50 kPa, that is, the consolidation pressure was less than the structural yield stress, the permeability coefficient of dredged silt decreased significantly with the increase of the consolidation pressure. When the consolidation pressure increased, the permeability coefficient of dredged silt stabilised at a specific value. When the preloading load was 5~400 kPa, the permeability coefficient of dredged silt in Shenzhen Qianwan Bay decreased from 5.39 × 10⁻⁷ cm/s to 2.20 × 10⁻⁸ cm/s (it went down an order of magnitude). A constant permeability coefficient was used to predict the consolidation settlement process, and a significant error occurred.
(2)
Under the same consolidation pressure, the permeability coefficient of two kinds of dredged silt was found to be significantly greater than that of marine silt. The significance was particularly greater when the smaller consolidation pressure p ≤ 50 kPa. When the consolidation pressure p = 25 kPa, the permeability coefficient of dredged silt was three times that of marine silt. When the consolidation pressure increased, the permeability coefficient of marine silt decreased and stabilised at a certain value. When the preloading load was 25–800 kPa, the permeability coefficient of marine silt decreased from 6.77 × 10⁻⁸ cm/s to 3.80 × 10⁻⁹ cm/s. This value is nearly approximately one order of magnitude smaller than that of the dredged silt.
The disparity in the permeability coefficients between dredged and marine silt arose from their respective particle compositions and pore structures. Particle size tests (as detailed in Table 6) revealed that dredged silt underwent hydraulic reshaping, gravity separation, and clayization during the dredger fill process. The aggregate of clayey and colloidal particles in dredged silt was lesser than in marine silt. Consequently, dredged silt manifested a higher permeability and a more considerable permeability coefficient. Additionally, dredged silt primarily exhibited interparticle pore development. Notably, with an increase in these interparticle pores, micro-layers and fractures emerged. The enhanced connectivity between these more abundant intergranular pores translated to a permeability coefficient that was significantly higher than that of marine silt.

4. Conclusions

  • The compression process of dredged silt samples of varying heights progressed through three distinct stages: small load disturbance, elastic deformation, and plastic deformation. During the small load disturbance stage, there was a minimal difference in the void ratio variations among samples of different heights. However, as one progressed through the elastic and plastic deformation stages, the rate of void ratio variation diminished with an increase in the initial height of the samples.
  • As the initial height of the dredged silt samples increased, both the cumulative stable strain and the compression index showed a decline. The structural strength of the soil primarily hinged on the attributes, interconnections, and spatial arrangement of the soil particles. Consequently, the initial height of the sample exerted a minimal influence on the structural yield stress of the dredged silt.
  • For dredged silt samples of different heights, the consolidation coefficient escalated with rising consolidation pressure, peaking at the structural yield stress. As the sample height increased, the consolidation coefficient of the dredged silt diminished. Therefore, the potential influence of the size effect on the consolidation coefficient warrants further exploration.
  • At lower consolidation pressures (typical preloading ranges), the consolidation coefficient of dredged silt was significantly lower than that of marine silt. However, as the consolidation pressure intensified, the disparity between the two decreased. This observation suggests that, after a high preloading regimen, dredged silt might achieve, or even match, the drainage consolidation rate intrinsic to marine silt.
  • The permeability coefficient of dredged silt contracted with increasing consolidation pressure, experiencing a 10-fold reduction within standard preloading loads. Consequently, employing a consistent permeability coefficient for projecting its consolidation settlement process could introduce substantial errors. Given the observable differences in particle composition and pore dynamics between dredged and marine silt, it is evident that under low consolidation pressures, the permeability coefficient of dredged silt exceeded that of marine silt.

Author Contributions

The authors confirm their contributions to the paper as follows: methodology, M.Z. and R.H.; formal analysis, M.Z. and R.H.; investigation, R.H. and J.W.; resources, R.H. and J.W.; data curation, M.Z. and R.H.; writing—original draft preparation, R.H.; writing—review and editing, J.W. and R.H.; supervision, M.Z.; project administration, R.H.; funding acquisition, R.H. and M.Z. All authors have read and agreed to the published version of the manuscript.

Funding

This research was funded by the Science and Technology Project of Henan Province of China (Grant No.182102310003) and the Program of Guangdong Nonferrous Metals Engineering Investigation Design Institute of Guangdong Province of China (Grant No. GDYSSZ2021-0001).

Conflicts of Interest

The authors declare no conflict of interest.

References

  1. Gibson, R.E.; England, G.L.; Hussey, M.J.L. The theory of one-dimensional consolidation of saturated clays: I. Finite non-linear consolidation of thin homogeneous layers. Geotechnique 1967, 17, 261–273. [Google Scholar] [CrossRef]
  2. Schiffman, R.L. Finite and infinitesimal strain consolidation. J. Geotech. Eng. Div. 1980, 106, 203–207. [Google Scholar] [CrossRef]
  3. Znidarcic, D.; Schiffman, R.L. Finite strain consolidation: Test conditions. J. Geotech. Eng. Div. 1981, 107, 684–688. [Google Scholar] [CrossRef]
  4. Xie, X.Y.; Zhu, X.R.; Xie, K.H.; Pan, Q.Y. New developments of one-dimensional large strain consolidation theories. Chin. J. Geotech. Eng. 1997, 19, 30–38. [Google Scholar]
  5. Xie, K.H.; Zheng, H.; Leo, C.J. Analytical solution for 1-D large strain consolidation of saturated soft clay under time-depending loading. Shuili Xuebao 2003, 10, 6–13. [Google Scholar] [CrossRef]
  6. Wen, H.J.; Zhang, Y.X.; Liu, Y. FDM for large strain consolidation of multi-layers super soft ground. J. Chongqing Univ. 2003, 26, 101–104. [Google Scholar]
  7. Chen, J.Y.; Hai, Y. Analytical solutions of Gibson’s finite non-linear consolidation equation of soil. J. Jiaxing Univ. 2011, 23, 41–46. [Google Scholar] [CrossRef]
  8. Zheng, H.; Xie, K.H.; Yang, X.Q. Study of one-dimensional large strain consolidation of double-layered saturated soft soils. Rock Soil Mech. 2004, 25, 1770–1774. [Google Scholar] [CrossRef]
  9. Li, C.X.; Dong, X.Q.; Jin, D.D.; Xie, K.H. Nonlinear large-strain consolidation analysis of soft clayconsidering threshold hydraulic gradient. Rock Soil Mech. 2017, 38, 377–384. [Google Scholar] [CrossRef]
  10. Li, G.; Zhang, J.L.; Yang, Q.; Jiang, M.J. Analysis of large-strain consolidation with non-Darcy flow and variable permeability coefficient. J. Cent. South Univ. Sci. Technol. 2016, 47, 977–983. [Google Scholar] [CrossRef]
  11. Dong, X.Q.; Li, C.X.; Chen, M.M.; Zhang, J.; Xie, K.H. Analysis of large-strain nonlinear consolidation of double-layer soft clay foundation with considering effect of non-Darcy’s flow. Rock Soil Mech. 2016, 37, 2321–2331. [Google Scholar] [CrossRef]
  12. Jiang, W.H.; Zhan, L.T. Large strain consolidation of sand-drained ground considering the well resistance and the variation of radial permeability coefficient. Rock Soil Mech. 2021, 42, 755–766. [Google Scholar] [CrossRef]
  13. Hu, T. Experimental study on the consolidation characteristics of two dredged ultra-soft soils. Soil Eng. Found. 2020, 34, 247–250. [Google Scholar]
  14. Lu, J.X. Experimental Study on Nonlinear Characteristics of Permeability and Compressibility of Soft Clay. Master’s Thesis, Tianjin University, Tianjin, China, 2015. [Google Scholar]
  15. Zhang, M.; Wang, W.; Zhao, Y.M.; Liu, G.N.; Ma, D.H. Study on coefficient of consolidation of dredged fill based on GDS consolidation and permeability test. J. Beijing Univ. Technol. 2012, 38, 1214–1219. [Google Scholar]
  16. Zhang, M.; Zhao, Y.M.; Gong, L.; Hu, R.H. Test study of coefficient of consolidation of fresh hydraulic fill ultra-soft in Shenzhen Bay. Chin. J. Rock Mech. Eng. 2010, 29, 3157–3161. [Google Scholar]
  17. Komurlu, E. Loading rate conditions and specimen size effect on strength and deformability of rock materials under uniaxial compression. Int. J. Geo-Eng. 2018, 9, 17. [Google Scholar] [CrossRef]
  18. Faramarzi, L.; Rezaee, H. Testing the effects of sample and grain sizes on mechanical properties of concrete. J. Mater. Civ. Eng. 2018, 30, 04018065. [Google Scholar] [CrossRef]
  19. Xu, W.J.; Zhang, H.Y. Research on the effect of rock content and sample size on the strength behavior of soil-rock mixture. Bull. Eng. Geol. Environ. 2021, 80, 2715–2726. [Google Scholar] [CrossRef]
  20. Celik, S.B. The effect of cubic specimen size on uniaxial compressive strength of carbonate rocks from Western Turkey. Arab. J. Geosci. 2017, 10, 426. [Google Scholar] [CrossRef]
  21. Yang, E.I.; Choi, J.C.; Yi, S.T. Effect of specimen sizes and shapes on compressive strength of concrete. J. Korea Concr. Inst. 2004, 16, 375–382. [Google Scholar] [CrossRef]
  22. Zhou, F.P.; Balendran, R.V.; Jeary, A.P. Size effect on flexural, splitting tensile, and torsional strengths of high strength concrete. Cem. Concr. Res. 1998, 28, 1725–1736. [Google Scholar] [CrossRef]
  23. Zhang, N. Size Effect and Failure Characteristics on Splitting Tensile Strength of Concrete. Master’s Thesis, Da Lian University of Technology, Dalian, China, 2016. [Google Scholar]
  24. Han, W.W.; Liu, S.H. Size effect on the strength and durability of high strength concrete. Ready-Mix. Concr. 2016, 2, 73–77. [Google Scholar]
  25. Zheng, A.R. Experimental study on consolidation characteristics of fresh hydraulic fill ultra-soft clay soil samples at different heights. In 25th China National Symposium of Geotechnical Testing; Zhejiang University Press: Hangzhou, China, 2008; pp. 245–248. [Google Scholar]
  26. Lei, H.Y.; He, C.F.; Qiu, W.W.; Chen, L. Experimental research on size effect upon consolidation property of hydraulic reclamation soft clay. J. Tianjin Univ. Sci. Technol. 2016, 49, 73–79. [Google Scholar] [CrossRef]
  27. Zhou, C.Y.; Zeng, Q.; Li, Y. Research on consolidation deformation test of large-size soft clay samples. Acta Sci. Nat. Univ. Sunyaseni 2005, 44, 25–29. [Google Scholar] [CrossRef]
  28. Kongkitkul, W.; Kongwisawamitr, K.; Suwanwattana, V.; Thaweeprasart, V.; Sukkarak, R. Comparisons of one-dimensional consolidation characteristics of clays by using two different specimen Sizes. Soil Behav. Geomech. ASCE 2004, 236, 333–342. [Google Scholar] [CrossRef]
  29. Chen, K.S.; Lv, M.F. Influences of size effects and constraints on the rebound modulus of subgrade. J. Water Resour. Archit. Eng. 2017, 15, 35–38. [Google Scholar] [CrossRef]
  30. Zheng, Y.Q.; Chen, S.F.; Pan, S.G.; Yang, H.; Chen, Z.B. Study on specimen size effect of triaxial test of granite residual soil in coastal zone. Fujian Constr. Sci. Technol. 2020, 1, 26–28, 66. [Google Scholar]
  31. Lin, K.B.; Ke, G.G. Size effect on the shear strength of granitic residual soils. Soil Eng. Found. 2017, 31, 521–525. [Google Scholar]
  32. Lin, K.B. Study on Size Effect of Granite Residual Soil Triaxial Test and Its Effect on Slope Stability Analysis. Master’s Thesis, Fuzhou University, Fuzhou, China, 2016. [Google Scholar]
  33. Li, C.Y.; Chen, Z.B. Specimen size effect of strongly weathered granite of seabed in triaxial under K0-consolidation condition. J. Cent. South Univ. Sci. Technol. 2020, 51, 1646–1653. [Google Scholar] [CrossRef]
  34. Omar, T.; Lakkaraju, S.K.; Osouli, A.; Sadrekarimi, A. Influence of specimen size in engineering practice. Geo-Congr. ASCE 2014, 234, 2960–2969. [Google Scholar] [CrossRef]
  35. Li, C.; He, C.R.; Wang, C.; Zhao, H.F. Study of scale effect of large-scale triaxial test of coarse-grained materials. Rock Soil Mech. 2008, 29, 563–566. [Google Scholar]
  36. Mei, Y.J.; Liang, N.X.; Li, Z.Y. Dimension effect to the deformation characteristic of aggregate. J. Chongqing Jiaotong Univ. 2005, 24, 79–82. [Google Scholar] [CrossRef]
  37. Cerato, A.B.; Lutenegger, A.J. Specimen size and scale effects of direct shear box tests of sands. Geotech. Test J. 2006, 29, 507–516. [Google Scholar]
  38. Zhu, J.G.; Liu, Z.; Weng, H.Y.; Wu, Z.F.; Fu, H.Y. Study on effect of specimen size upon strength and deformation behavior of coarse-grained soil in triaxial test. J. Sichuan Univ. Eng. Sci. Ed. 2012, 44, 92–96. [Google Scholar]
  39. Yang, Y.H.; Zhao, Y.; Guang, P.Q.; Li, F. Study on size effect of shear strength of expansive soil. Yangtze River 2007, 38, 18–19, 22. [Google Scholar] [CrossRef]
  40. Huang, Y.J. Size effect of sample of testing shearing strength for swelling soil. Technol. Dev. Enterp. 2013, 32, 56–57. [Google Scholar]
  41. Butterfield, R. A natural compression law for soils. Geotechnique 1979, 29, 469–480. [Google Scholar] [CrossRef]
  42. Sridharan, A.; Abraham, B.M.; Jose, B.T. Improved technique for estimation of preconsolidation pressure. Geotechnique 1991, 41, 263–268. [Google Scholar] [CrossRef]
  43. Hong, Z.; Onitsuka, K. A method of correcting yield stress and compression index of Ariake clays for sample disturbance. Soils Found. 1998, 38, 211–222. [Google Scholar] [CrossRef]
  44. Jiang, H.H. Consolidation Calculation of Super-Soft Ground with Vertical Drains. Ph.D. Thesis, China Academy of Railway Sciences, Beijing, China, 2009. [Google Scholar]
  45. Wei, G.F. Study on compression characteristics of marine silt in Shenzhen bay. Sci. Technol. Eng. 2013, 13, 795–798. [Google Scholar]
Figure 1. The sampled location.
Applsci 13 10419 g001
Figure 2. e-p curves of soil samples with different heights.
Applsci 13 10419 g002
Figure 3. e-lgp curves of soil samples with different heights.
Applsci 13 10419 g003
Figure 4. Accumulative strains of samples with different heights under different consolidation pressures.
Applsci 13 10419 g004
Figure 5. ln(1 + e)-lgp curves of soil samples.
Applsci 13 10419 g005
Figure 6. ln(1 + e)-lgp curve of a soil sample of 2 cm height.
Applsci 13 10419 g006
Figure 7. ln(1 + e)-lgp curve of a soil sample of 3 cm height.
Applsci 13 10419 g007
Figure 8. ln(1 + e)-lgp curve of a soil sample of 4 cm height.
Applsci 13 10419 g008
Figure 9. Consolidation coefficients of samples with different heights under different consolidation pressures.
Applsci 13 10419 g009
Figure 10. The variation of the consolidation coefficients of three kinds of silt [44,45].
Applsci 13 10419 g010
Figure 11. The variation of the permeability coefficient of three kinds of silt.
Applsci 13 10419 g011
Table 1. Average physical property indices of the soil samples.
W (%)ρ (g/cm3)Gse0wL (%)wP (%)IP
95.71.4802.7592.66651.222.523.6
Table 2. Test loading scheme.
Sample NumberSample Height (cm)Consolidation Pressure (kPa)Group NumberRemark
S-125, 12.5, 25, 50, 80, 100, 200, 300, 400, 600,
800, 1200, 1600
64High-pressure Consolidation Test
S-225, 12.5, 25, 50, 80, 100, 120, 200, 300, 40064Standard Consolidation Test
M35, 12.5, 25, 50, 80, 12064Standard Consolidation Test
L45, 12.5, 25, 50, 80, 12064Standard Consolidation Test
Table 3. Variation of accumulative strains of samples with different heights.
Consolidation Pressure p (kPa)Accumulative Strain A
(2 cm) (%)
Accumulative Strain B
(3 cm) (%)
Accumulative Strain C
(4 cm) (%)
A-B
(%)
B-C
(%)
A-C
(%)
520.31519.99719.7550.3180.2420.560
12.523.40022.35020.9101.0501.4402.490
2526.14025.19723.7150.9431.4822.425
5028.88028.38327.9900.4970.3930.890
8031.79530.45029.2081.3451.2422.587
12035.49533.47332.4982.0220.9752.997
Table 4. Structural yield stress and compression index of samples with different heights.
Sample Height (cm)Structural Yield Stress σc (kPa)Compression Index Cc
250.10.5335
346.80.5276
452.50.5206
Table 5. Physical properties and consolidation pressure of two kinds of silt samples.
Silt Samplew (%)ρ (g/cm3)Gse0p (kPa)Sample Size (cm)
Marine Silt in the West Channel Port of Shenzhen Bay [44]99.21.4202.672.70325, 50, 100, 200, 400, 8002
Dredged Silt in Shenzhen Airport [45]100.631.4482.6812.7126, 12.5, 25, 50, 100, 2002
Table 6. Material composition of three kinds of silt samples [16].
Silt SampleComposition Content of Soil Particles (%)Absolute Content of Clay Minerals (%)
Powder Particle
(0.005–0.075 mm)
Clay Particle
(0.002–0.005 mm)
Colloidal Particle
(<0.002 mm)
KaoliniteIllite/Montmori-LloniteChlorite
Dredged silt in Qianwan Bay, Shenzhen53.020.726.314.218.42.8
Dredged silt in Shenzhen airport51.821.526.713.817.93.0
Marine silt in the west channel port of Shenzhen Bay43.216.838.028.64.75.1
Disclaimer/Publisher’s Note: The statements, opinions and data contained in all publications are solely those of the individual author(s) and contributor(s) and not of MDPI and/or the editor(s). MDPI and/or the editor(s) disclaim responsibility for any injury to people or property resulting from any ideas, methods, instructions or products referred to in the content.

