
On Construction of a Campus Outdoor Air and Water Quality Monitoring System Using LoRaWAN

 ,
,  , ,
, ,
Abstract
:1. Introduction
- Implement the LoRaWAN network in an air quality and water monitoring system;
- Evaluate the performance of the LoRaWAN receiver in terms of sensitivity and throughput.
2. Background Review and Related Works
2.1. LoRa Low Power Consumption Network
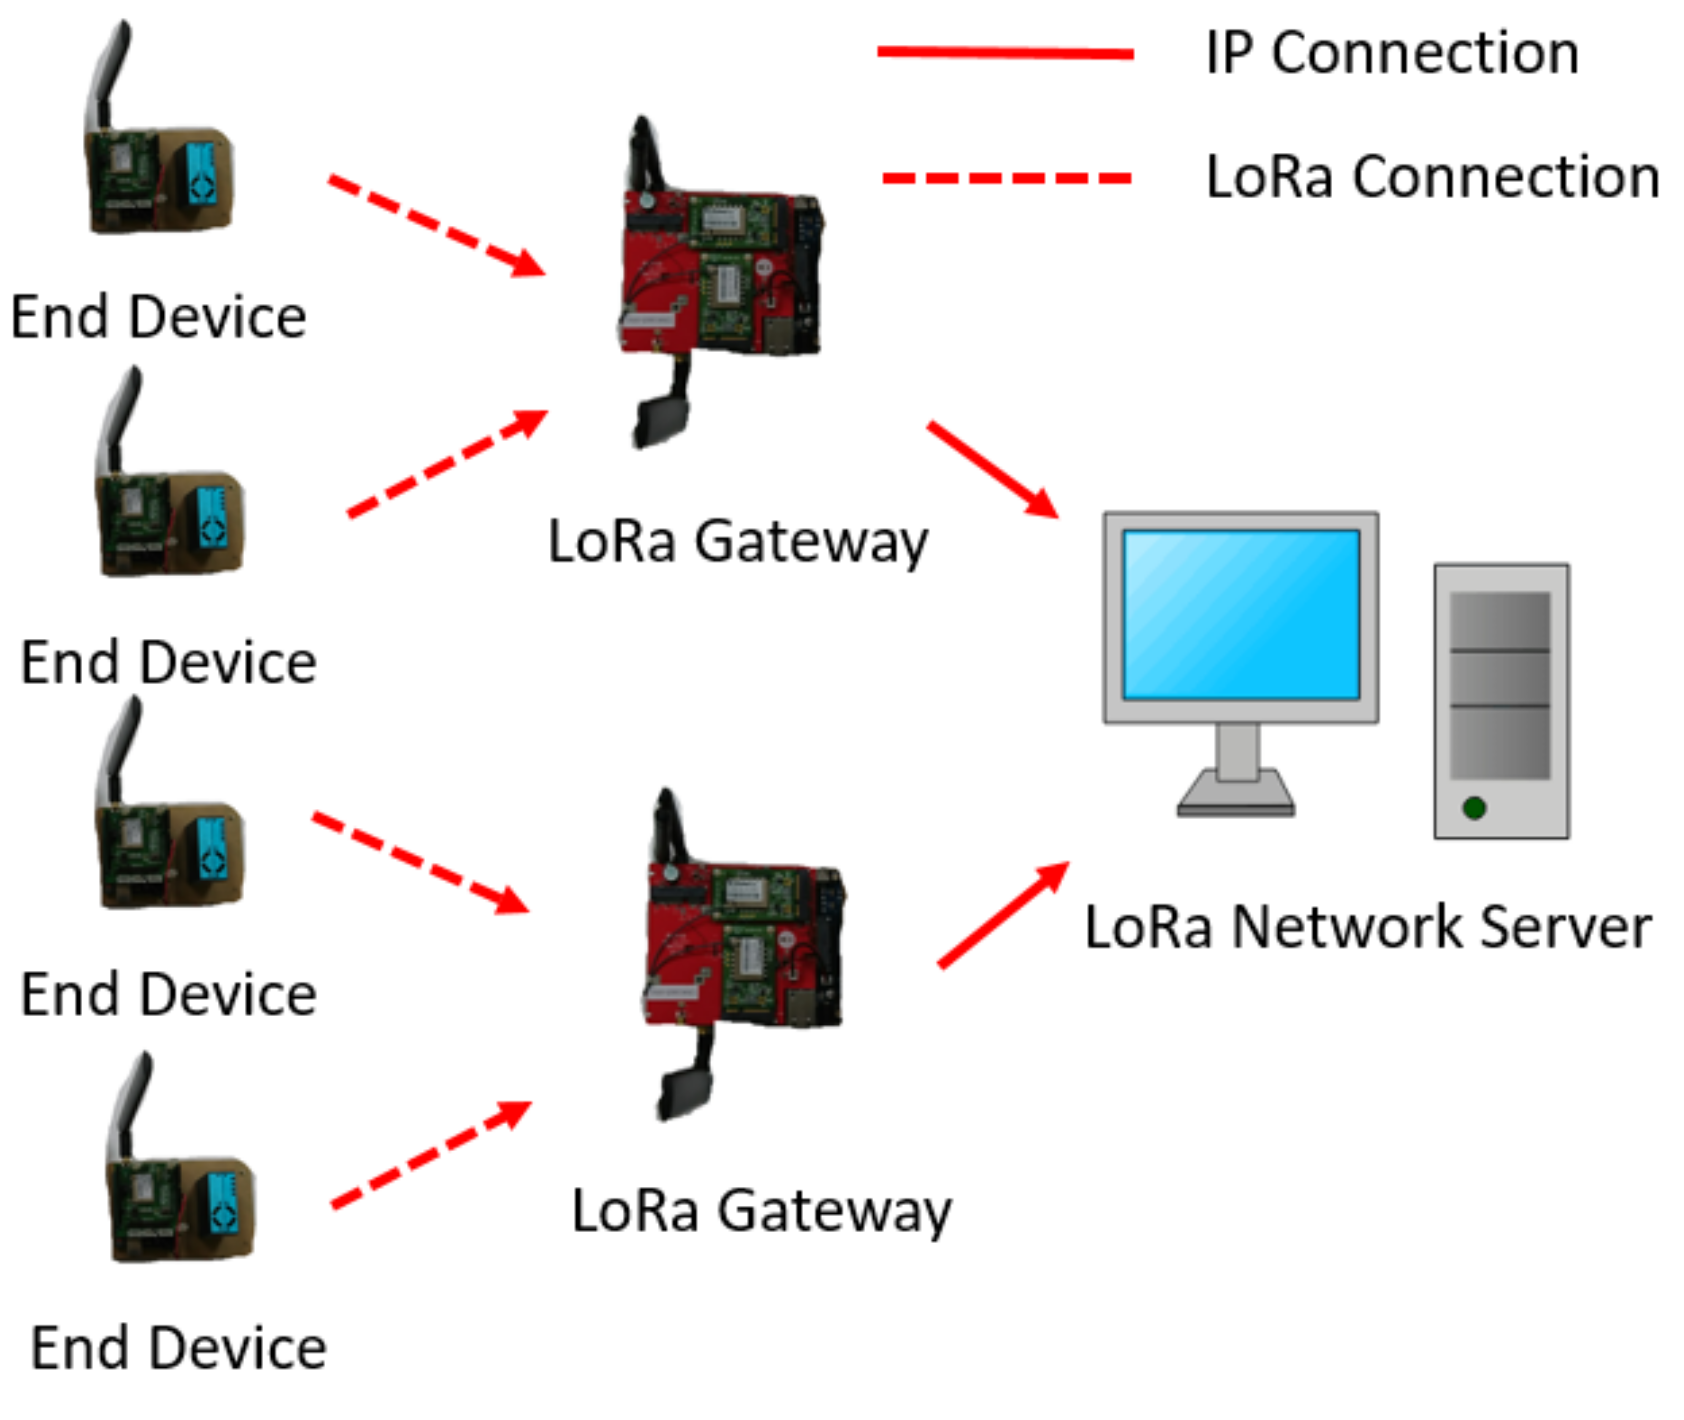
2.2. LoRa Network Architecture
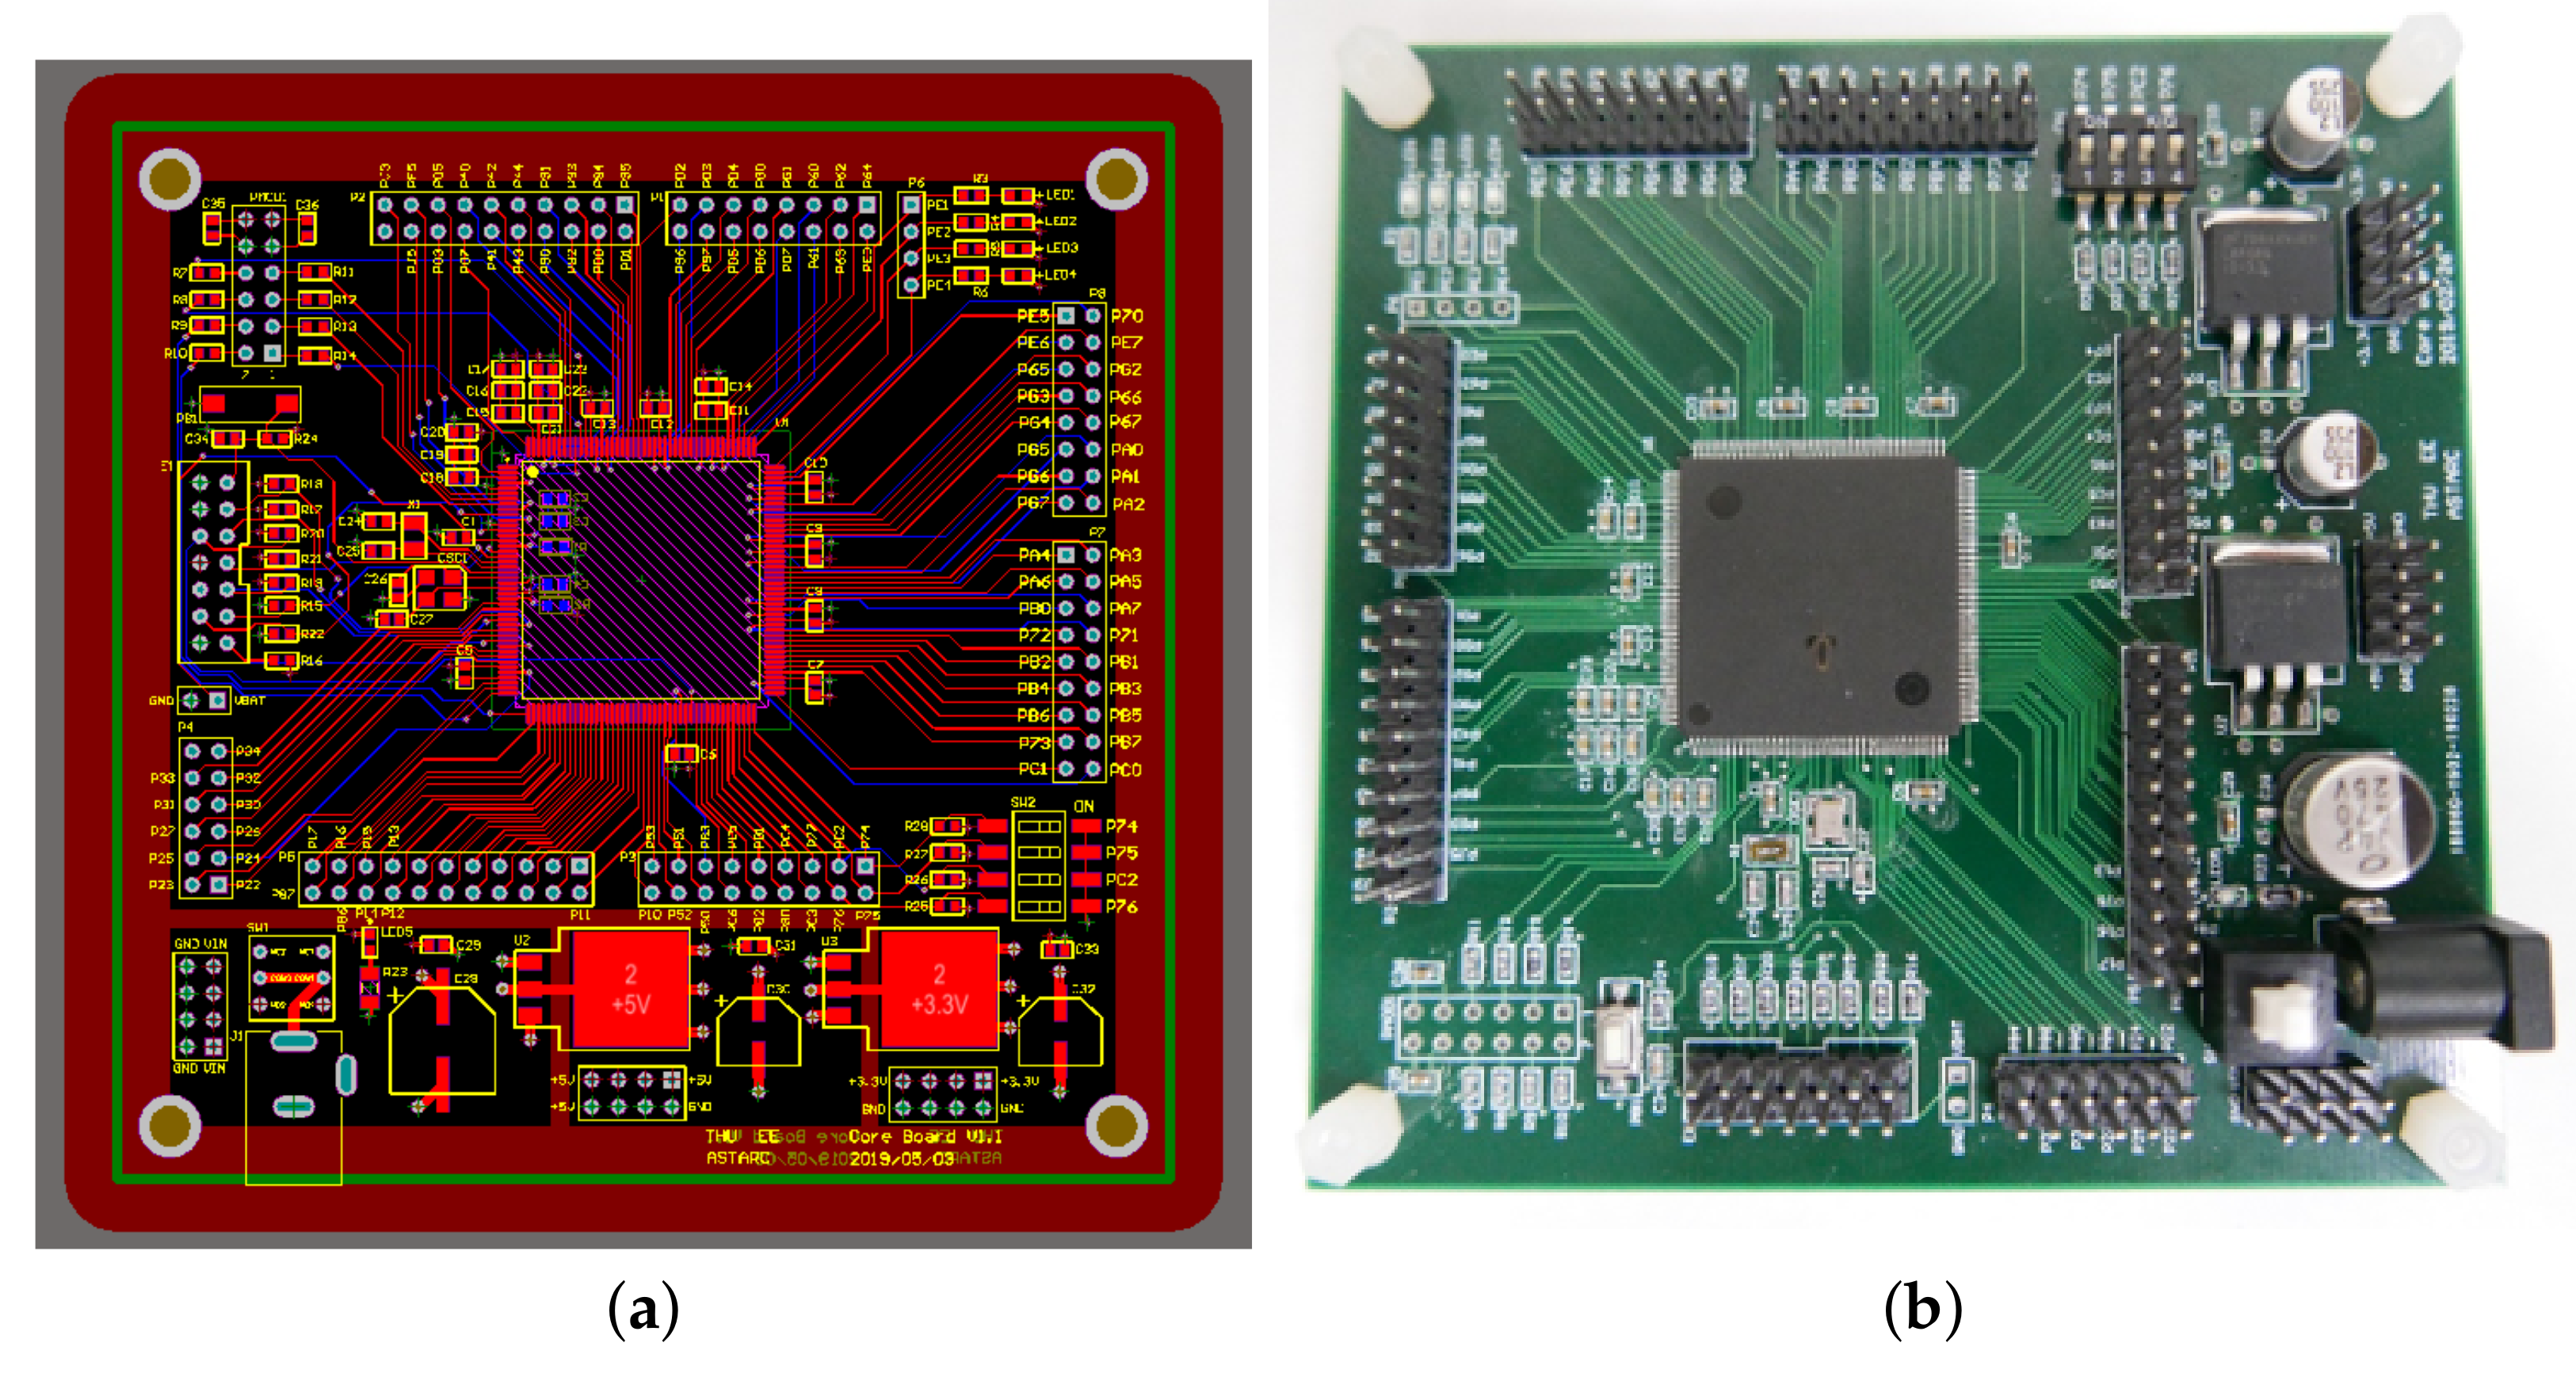
2.3. Arduino Development (Pre-Development for Rapid Implement)
2.4. Inverse Distance Weighted (IDW)
2.5. Related Works
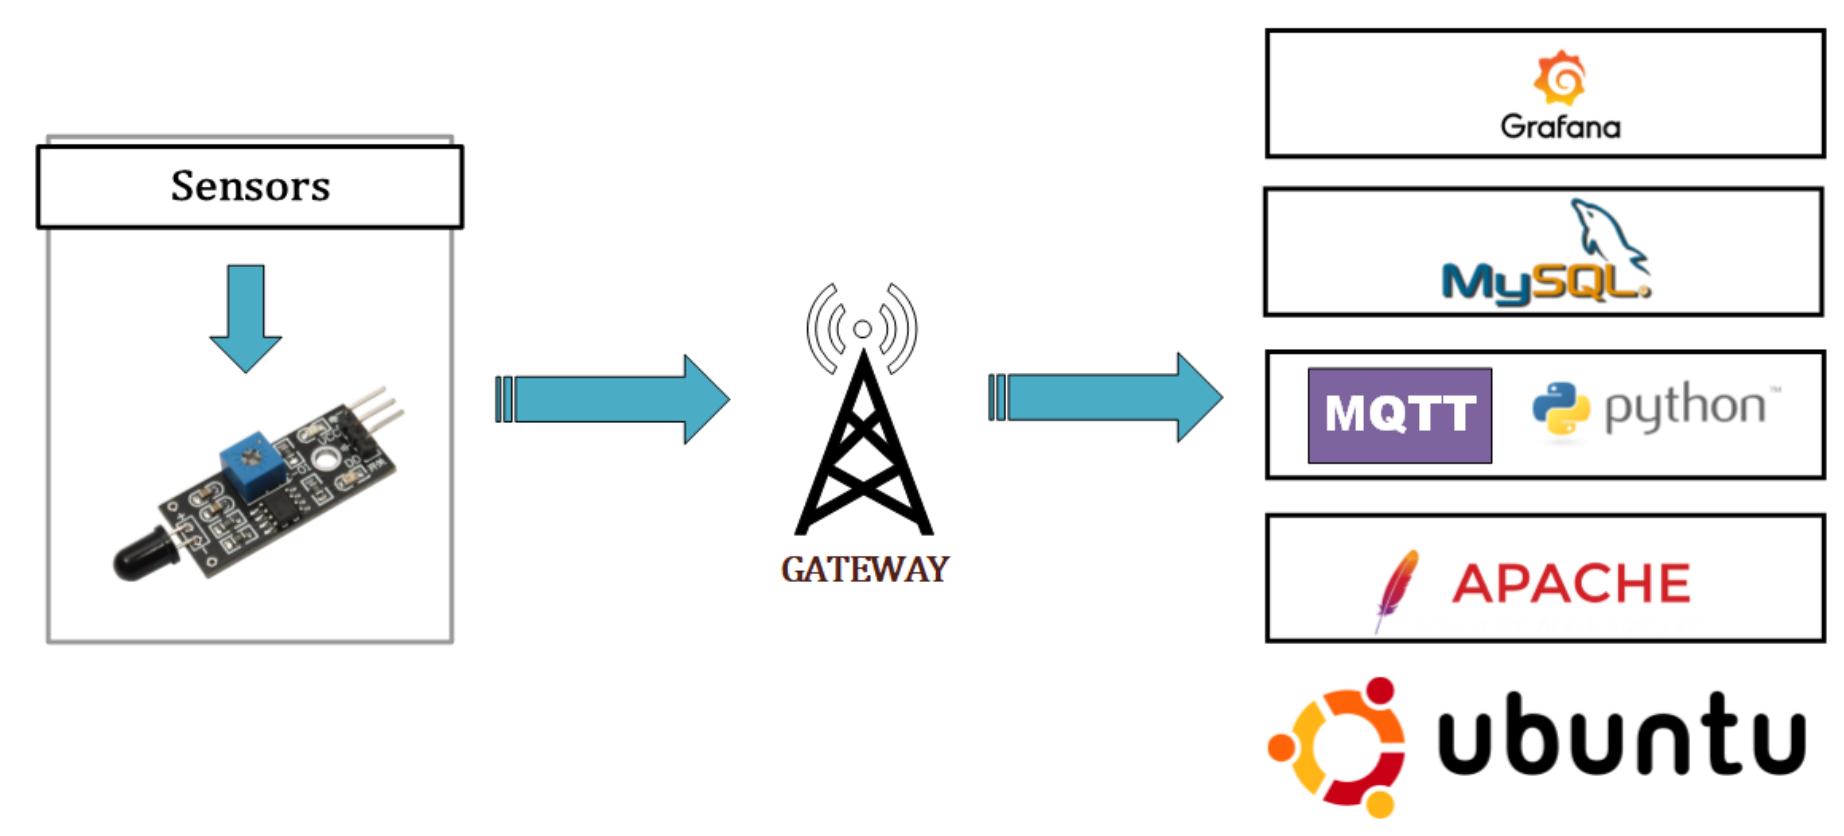
3. System Design and Implementation
3.1. System Environment
- Dissolved Oxygen SensorsThere are two methods for measuring dissolved oxygen: the optical method and the amperometry method. The optical method is the more commonly used method [30].
- pH SensorsThe pH value is determined via a pH-sensitive electrode [34]. The activity of hydrogen ions in the solution generates a tiny current, which can be utilized to determine the pH level in the water.
- Temperature SensorsTemperature sensors perform to a certain extent depending on the voltage across the diode. The resistance of the diode changes in a precise proportion to the change in temperature of the device. When the temperature drops, the resistance decreases, and vice versa for the same reason.
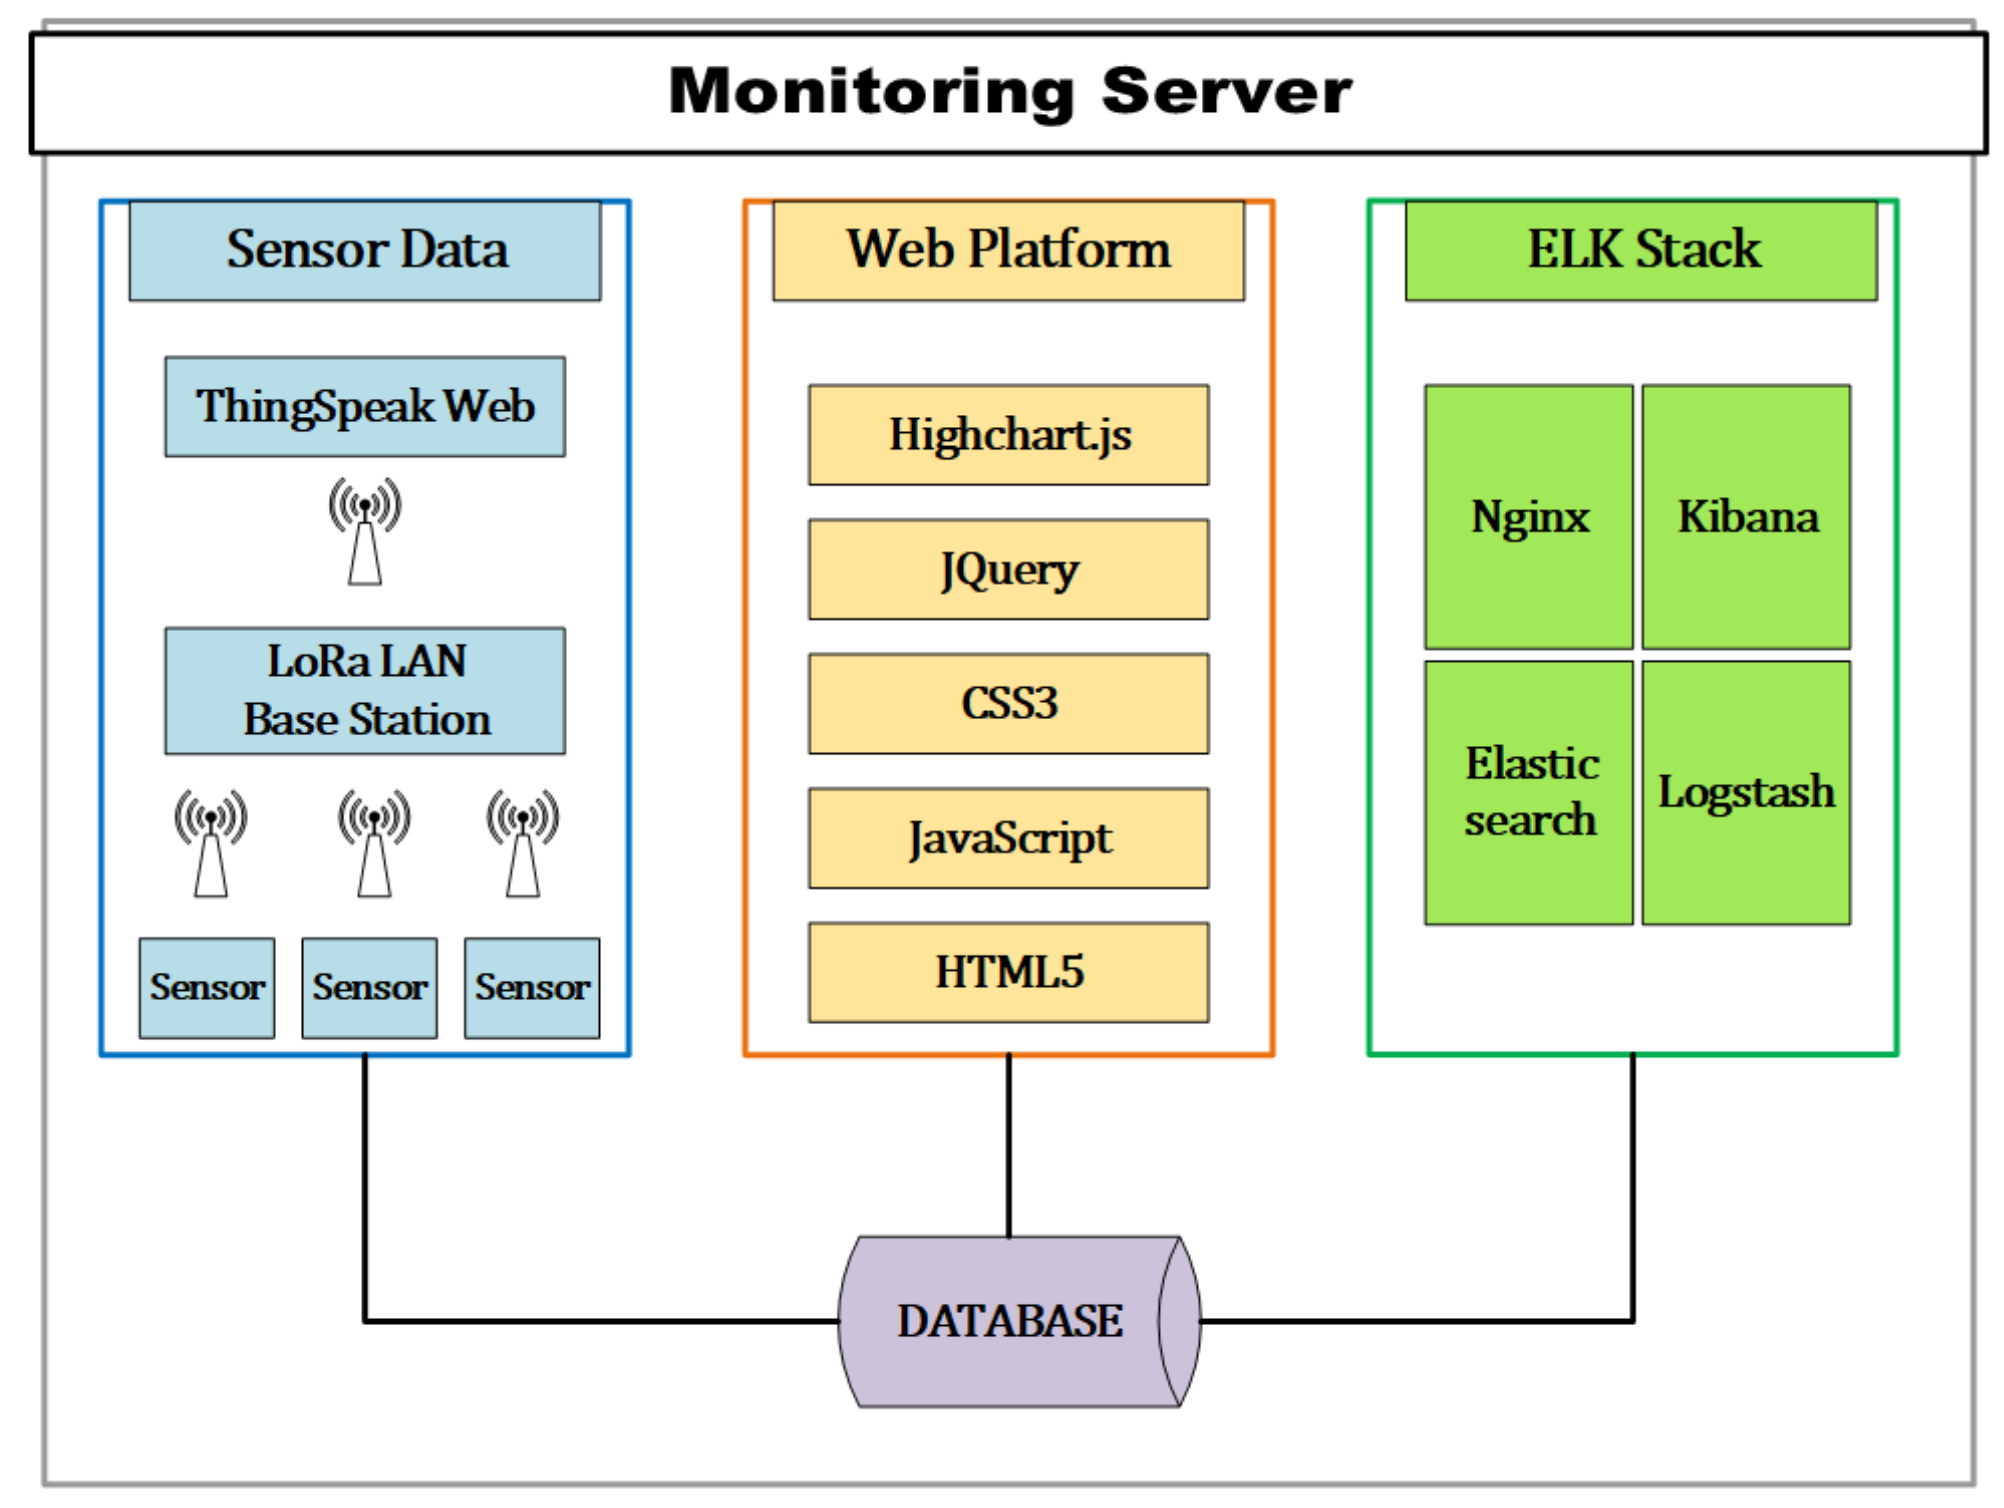
3.2. System Architecture
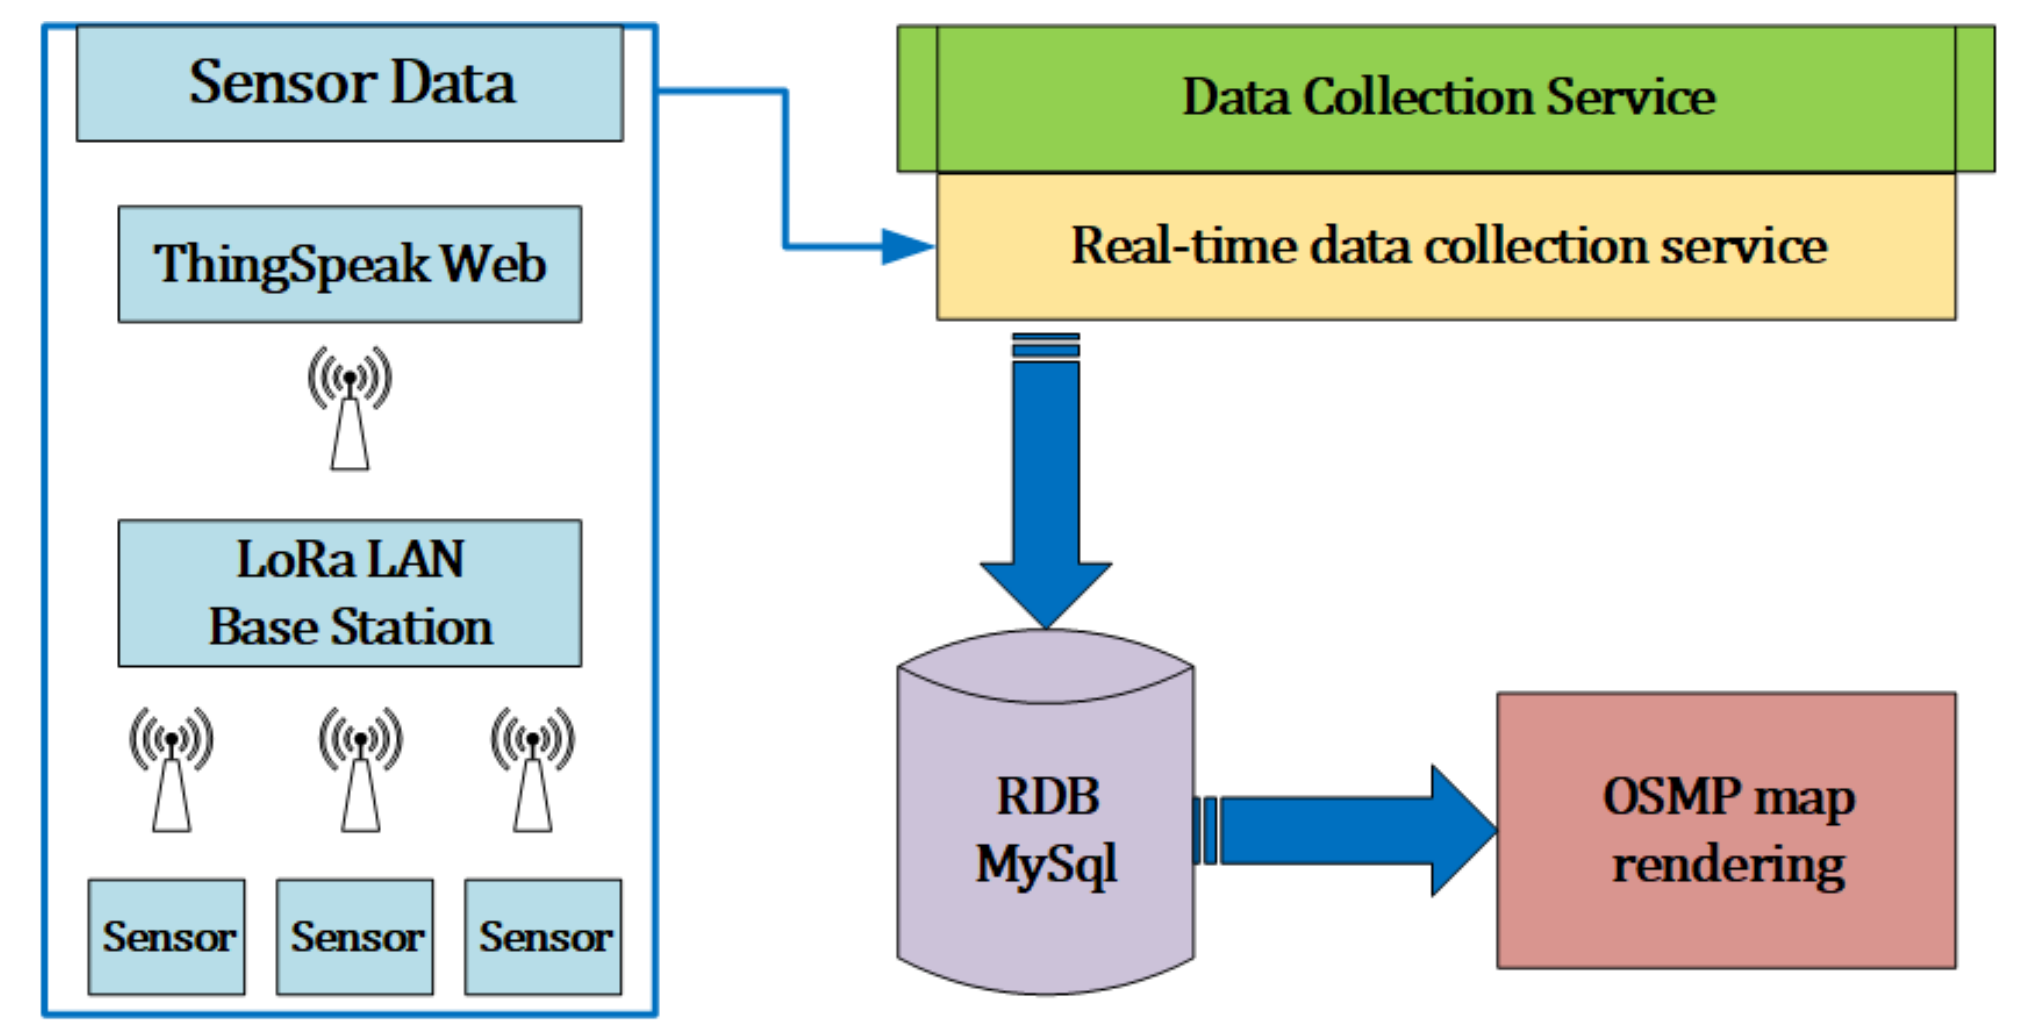
3.3. Real-Time Data Collection Service
3.4. Web Monitoring System
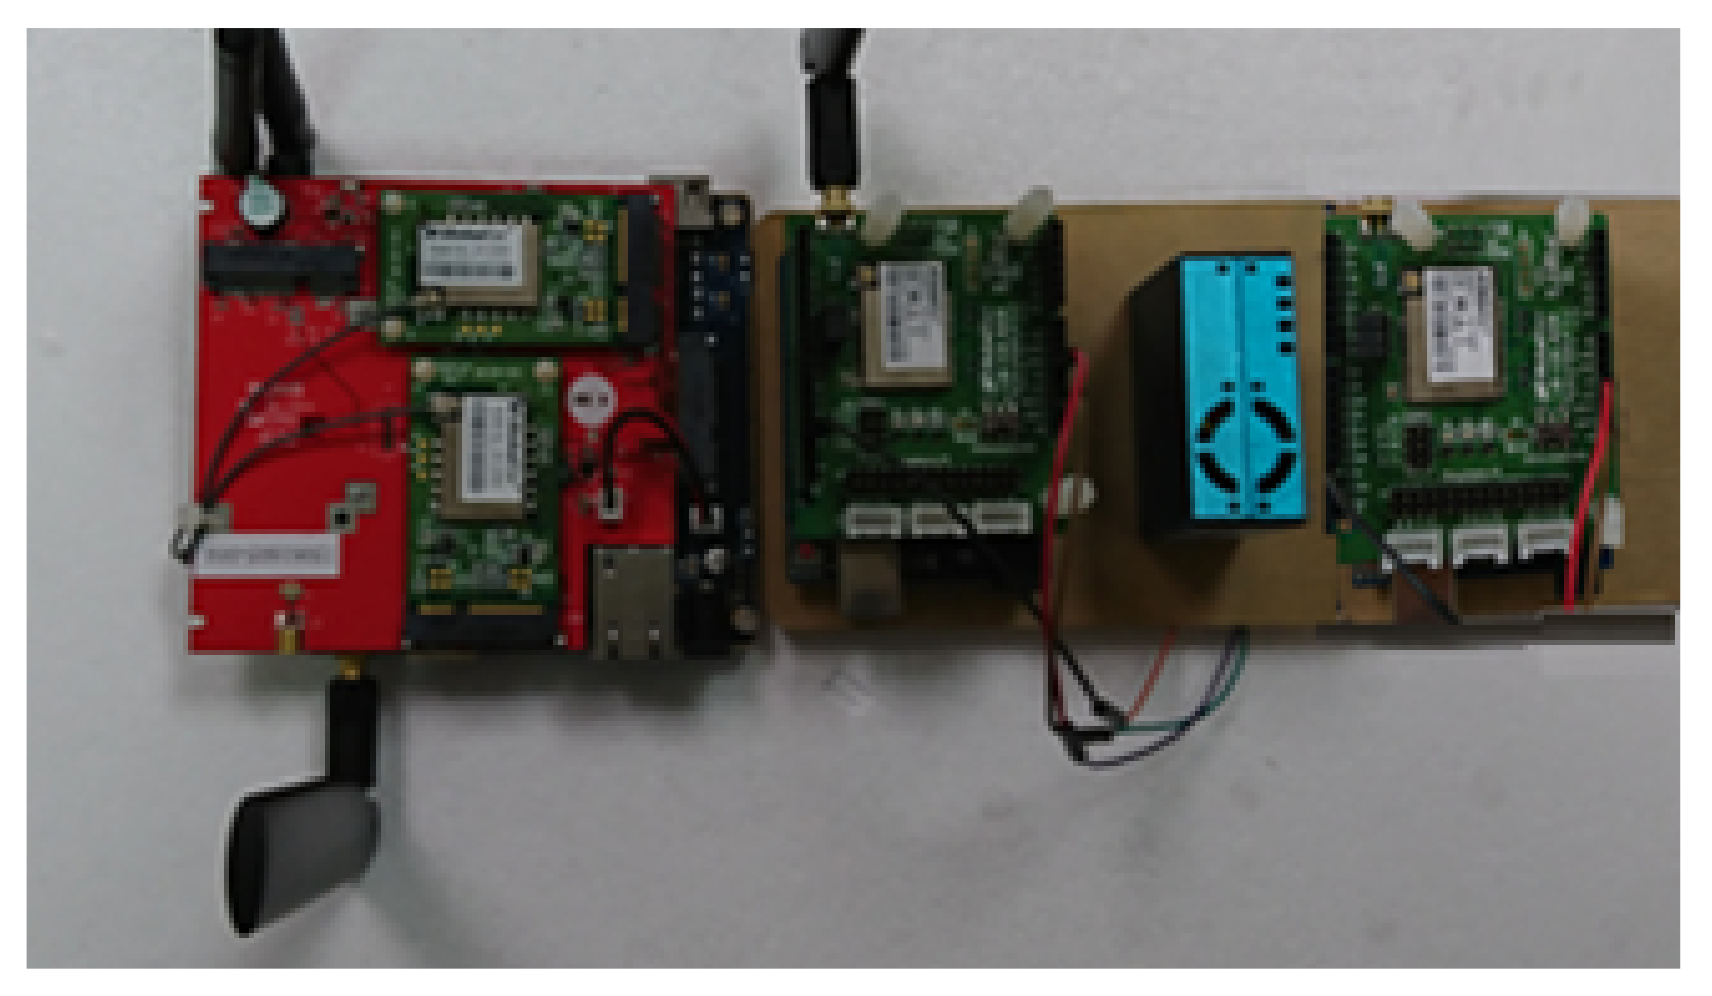
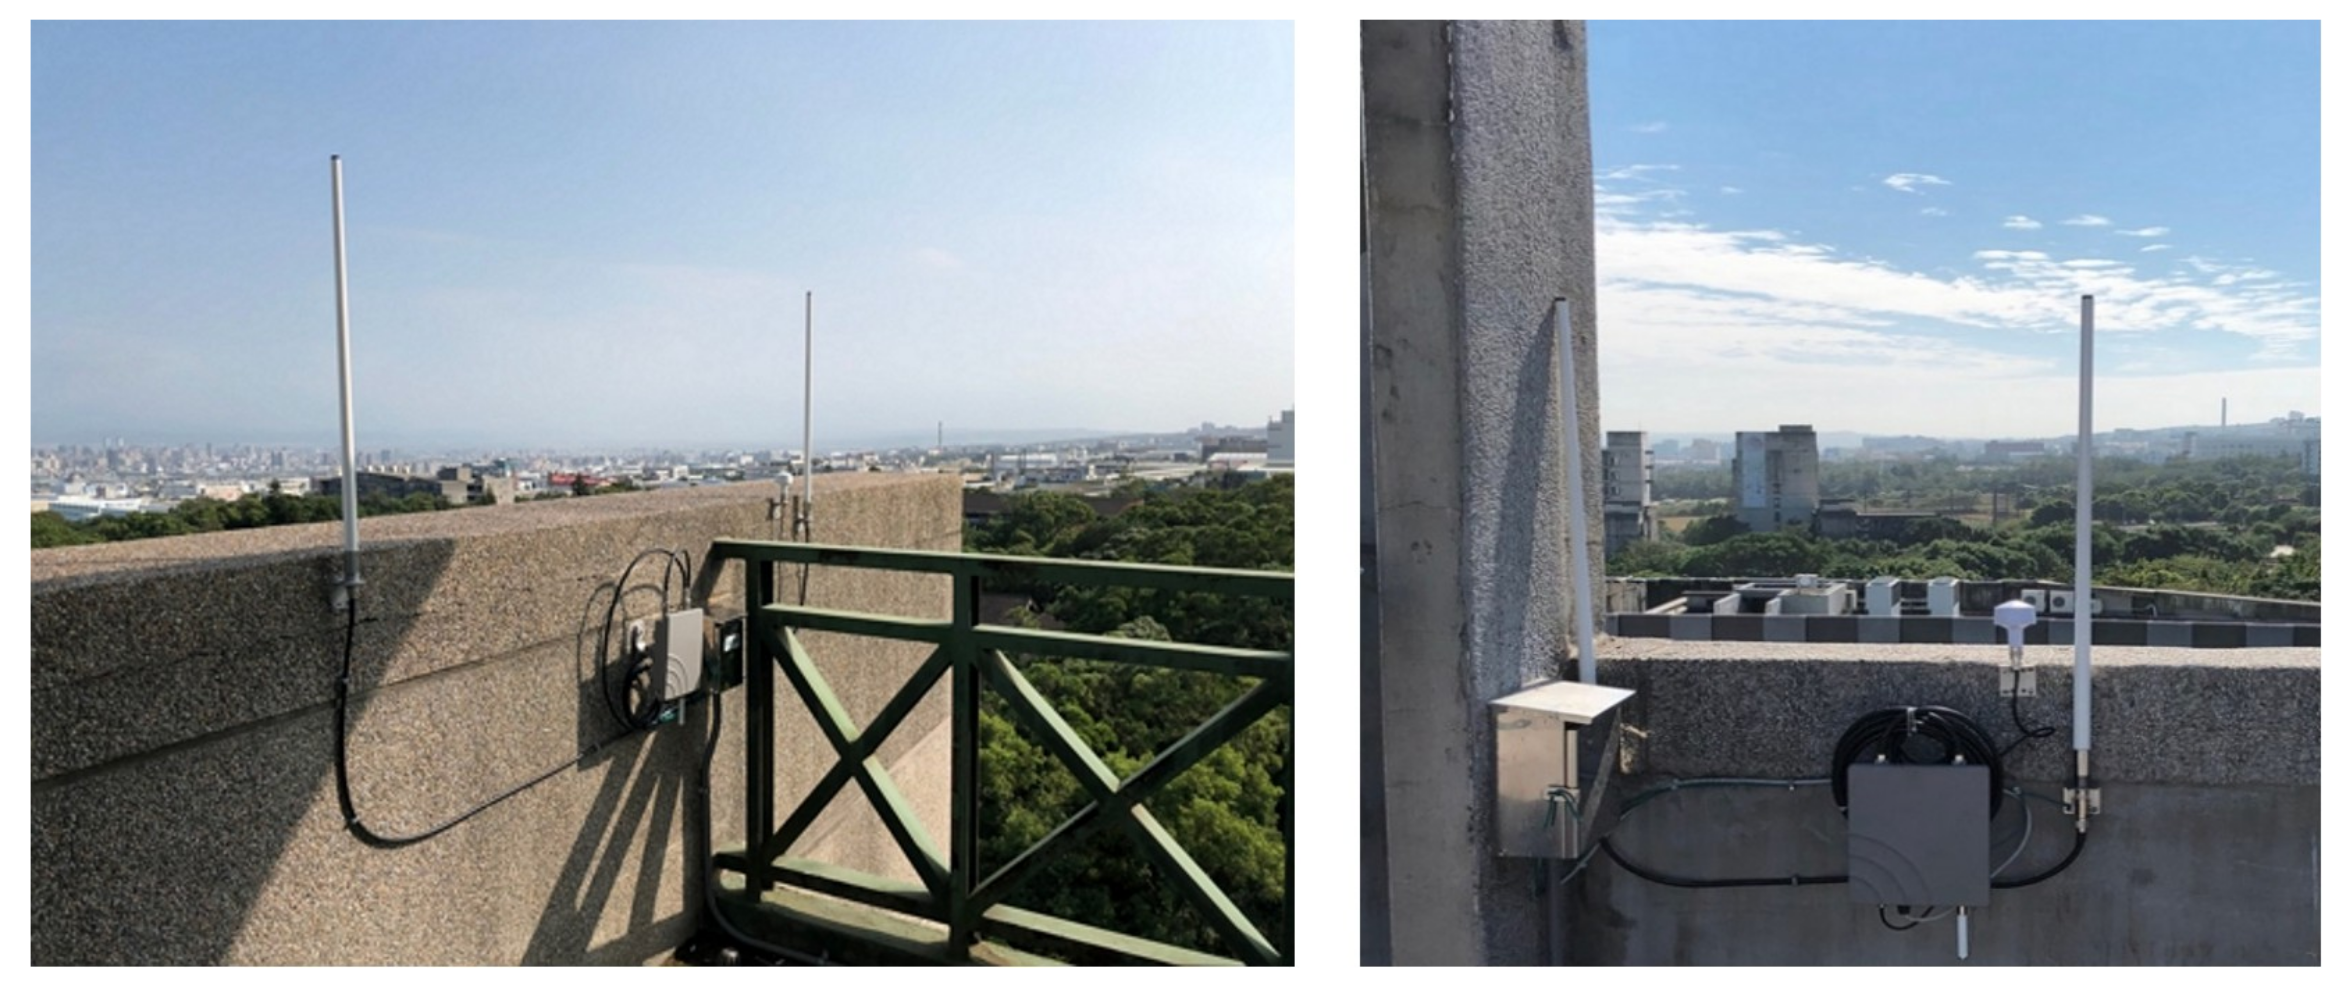
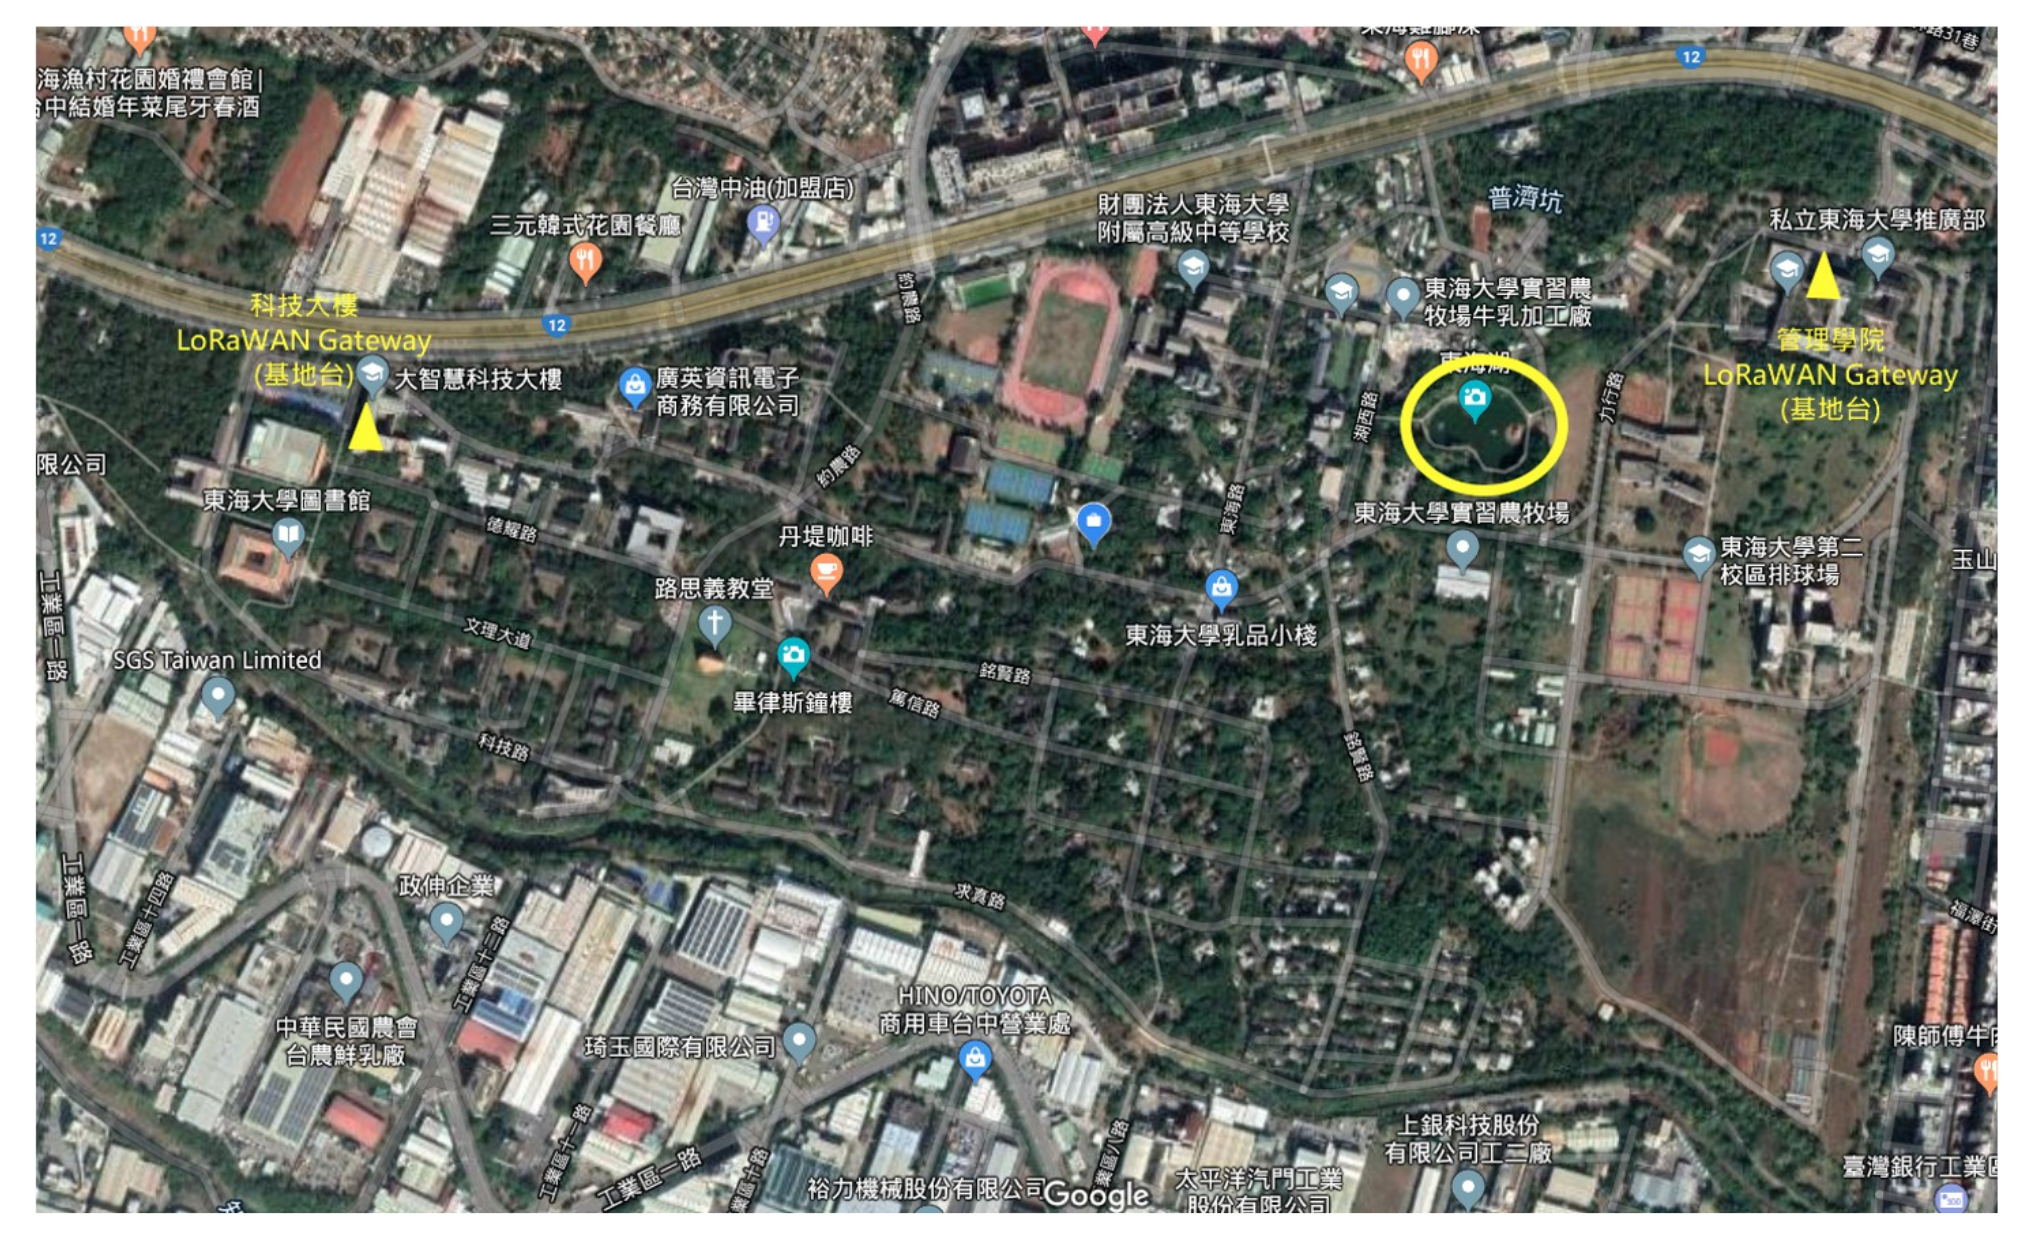
3.5. Sensor Deployment
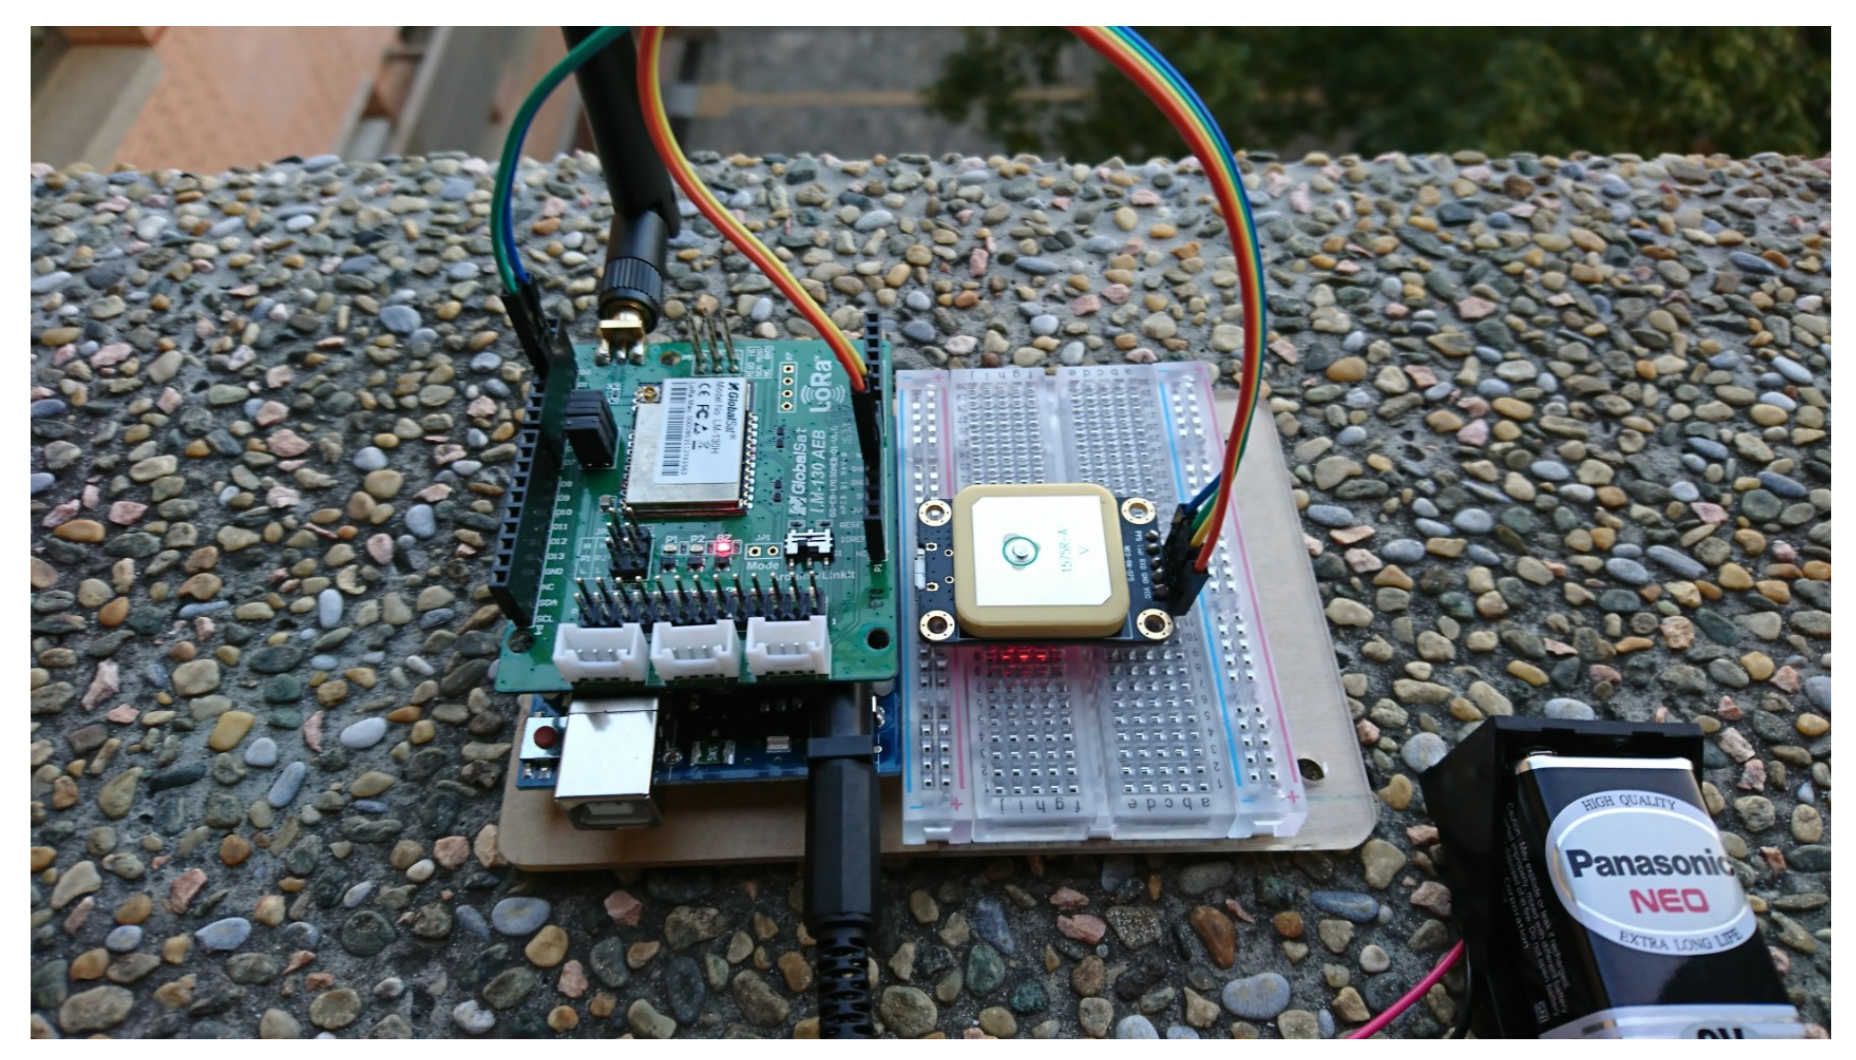
3.5.1. Air Quality Sensor and LoRa Terminal Deployment
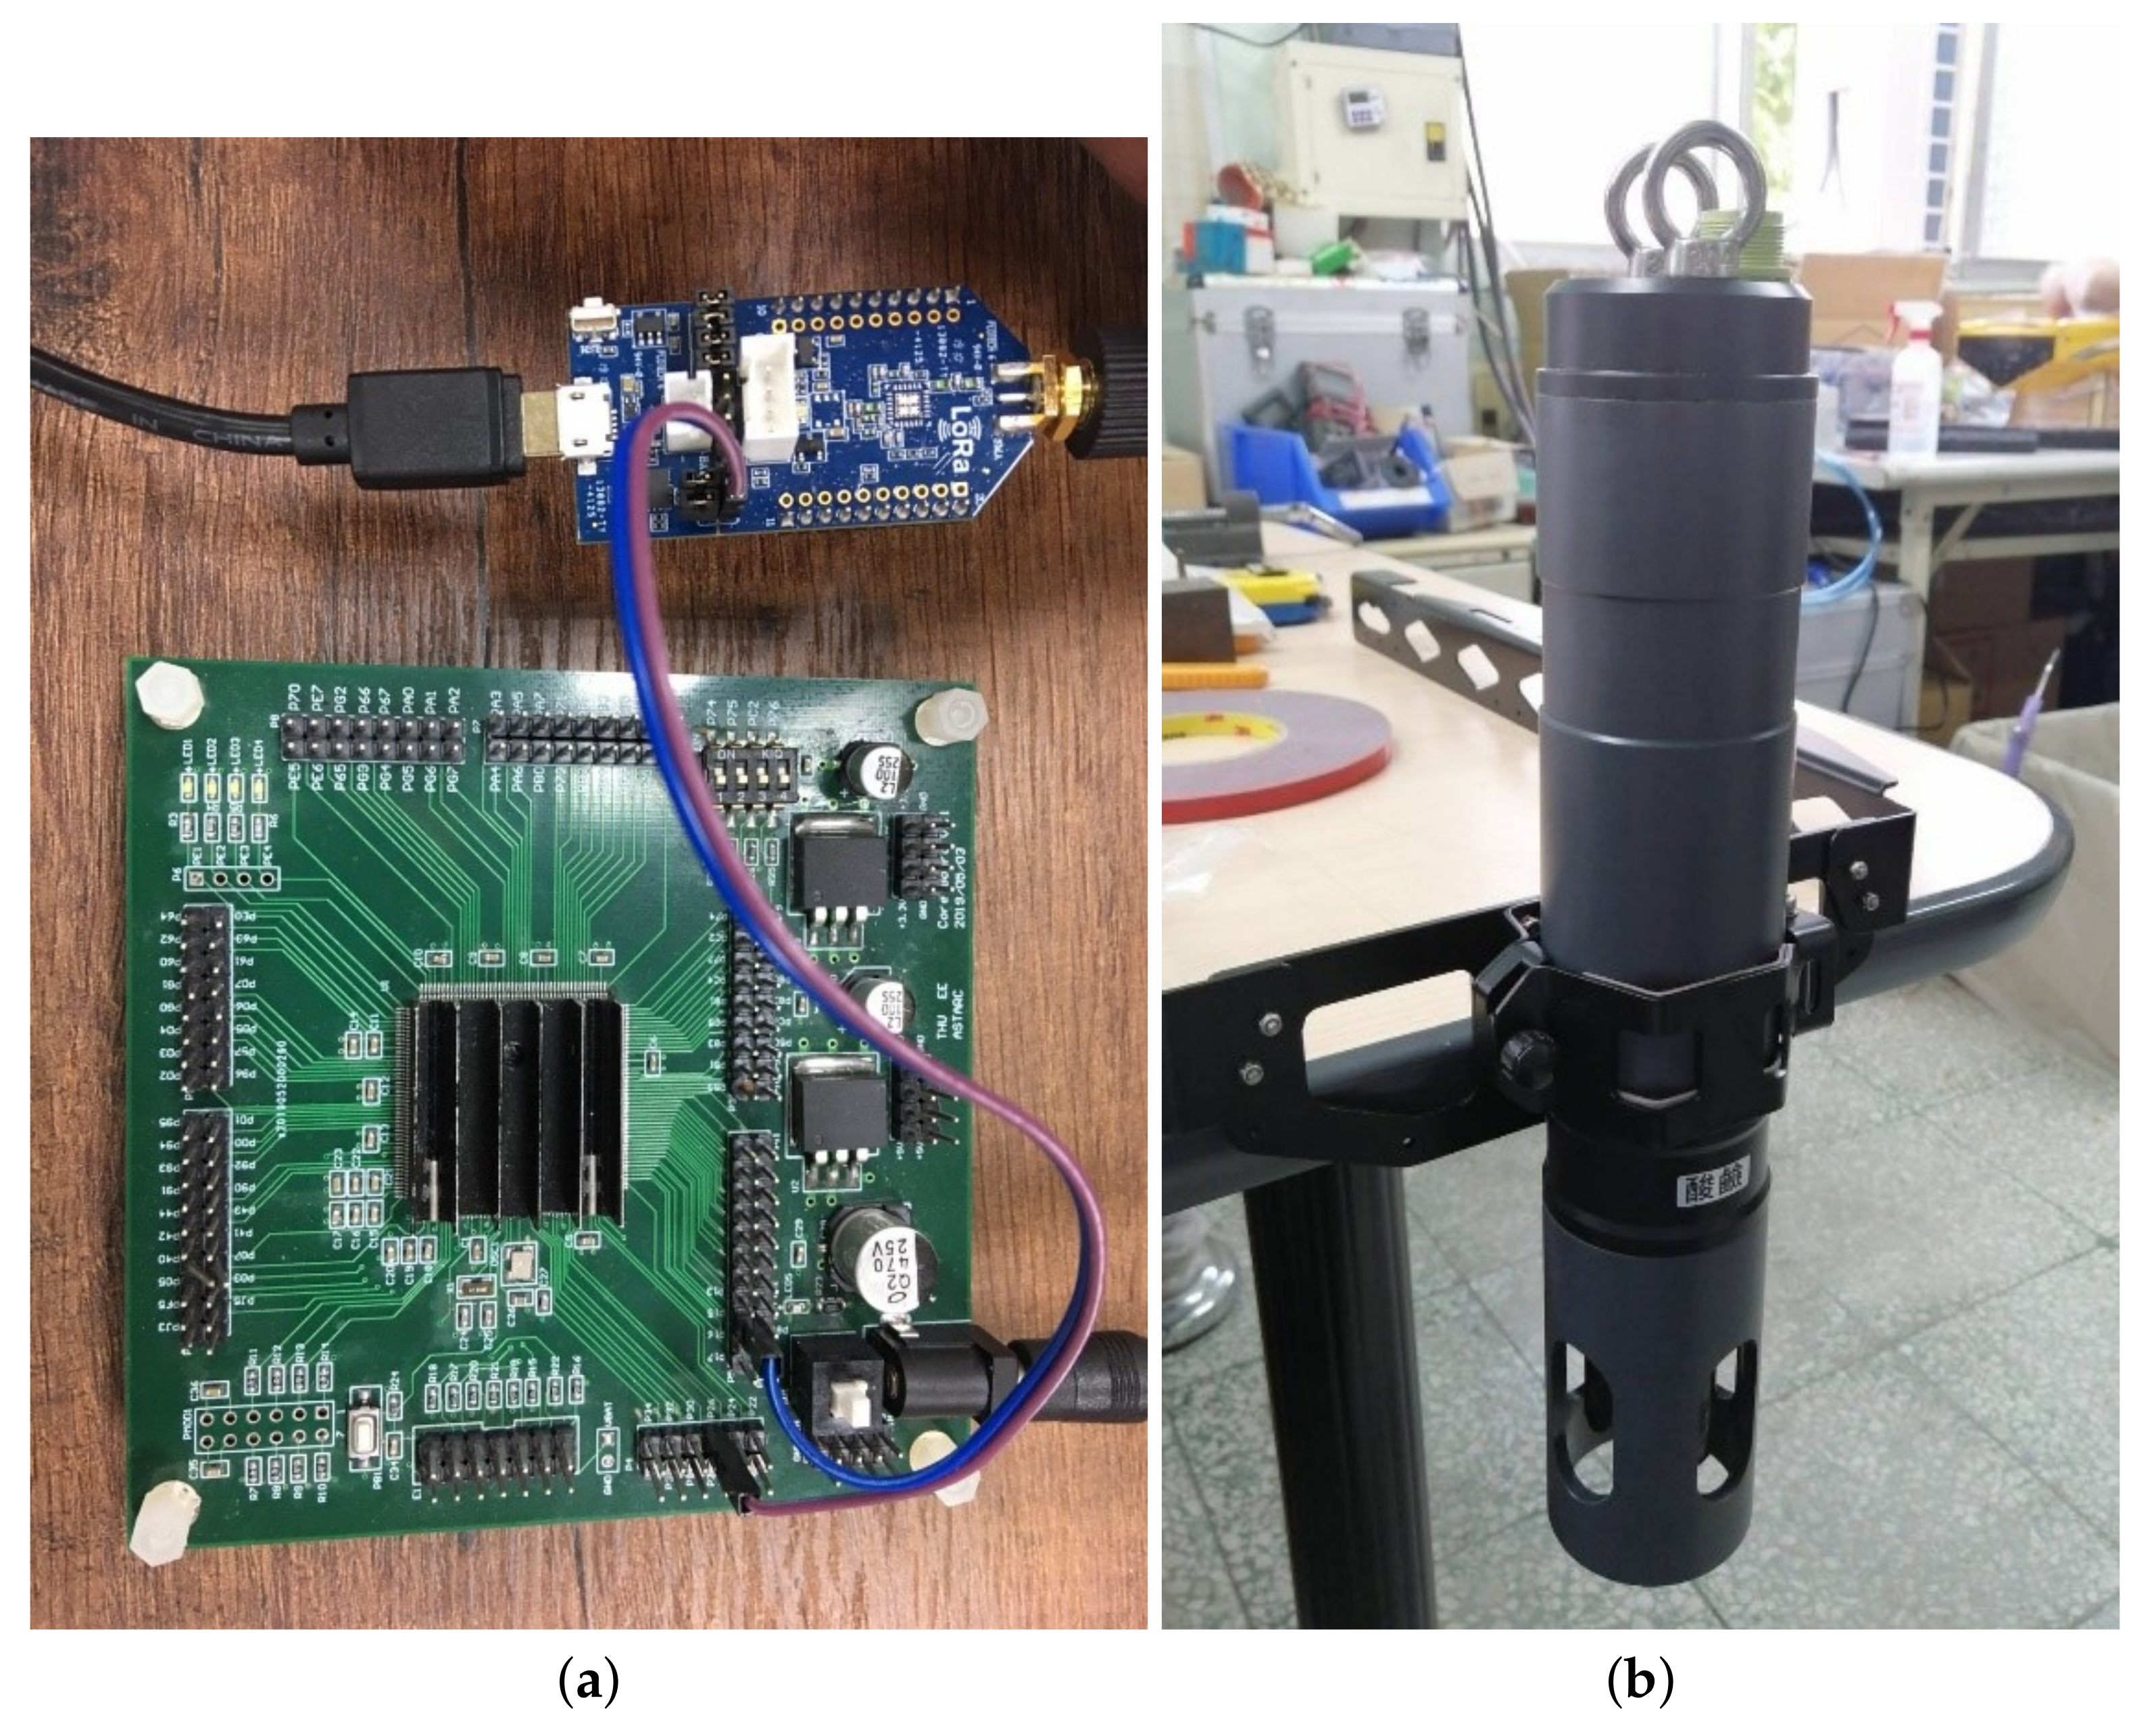
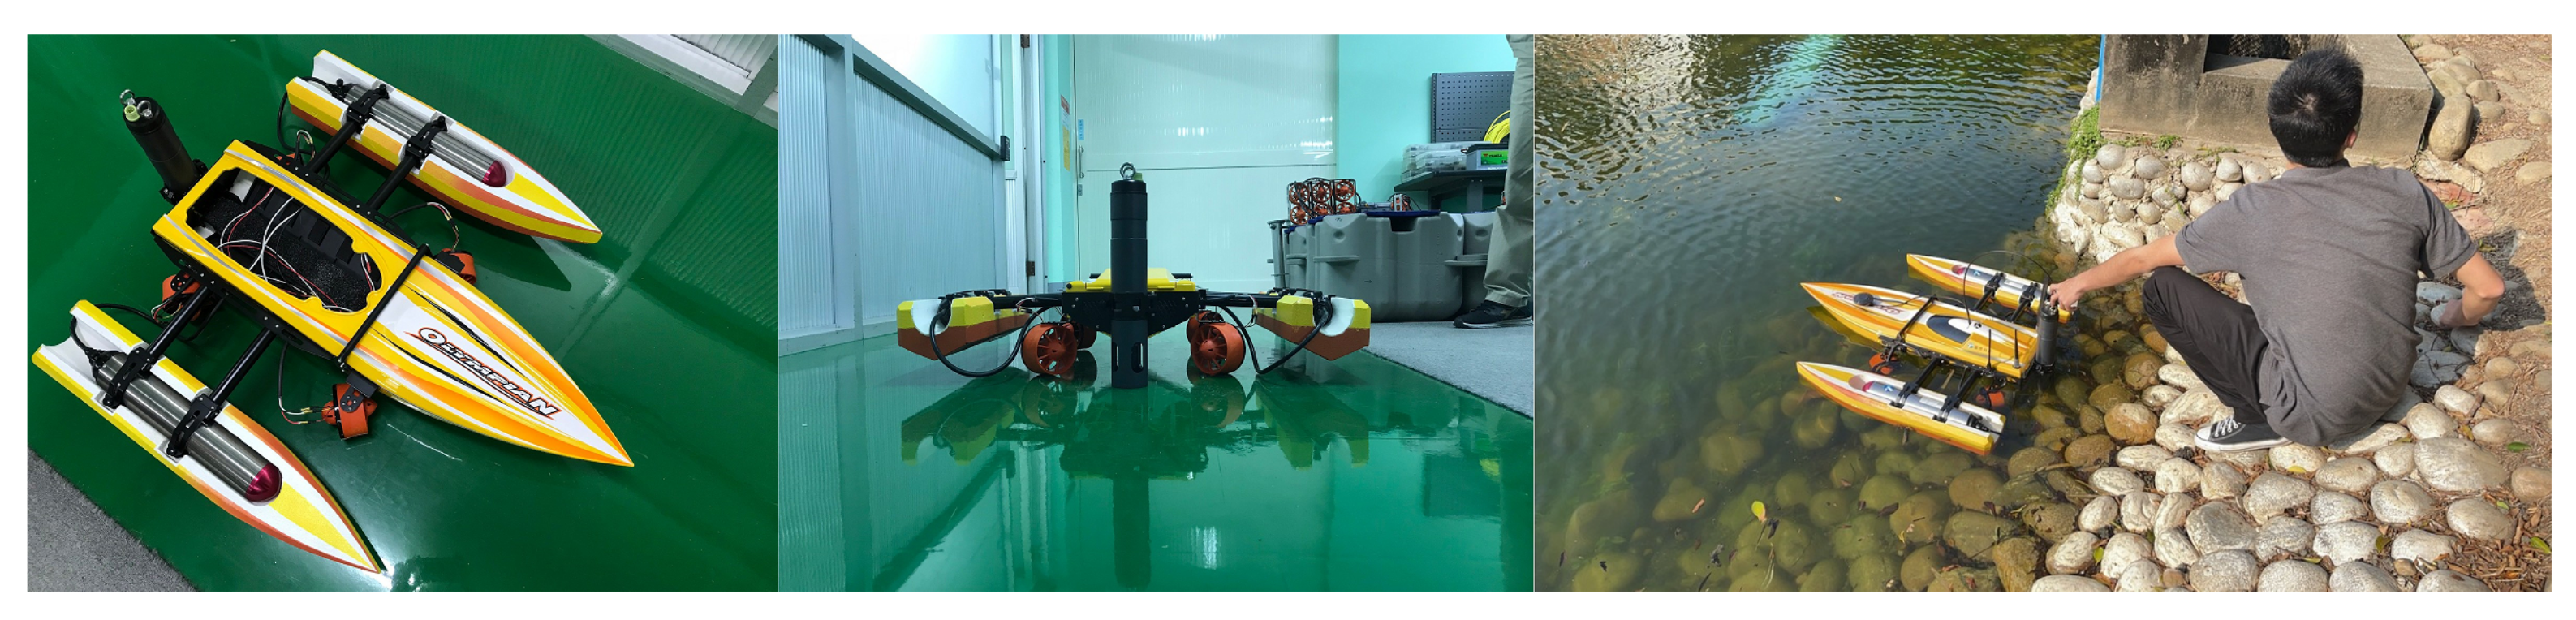
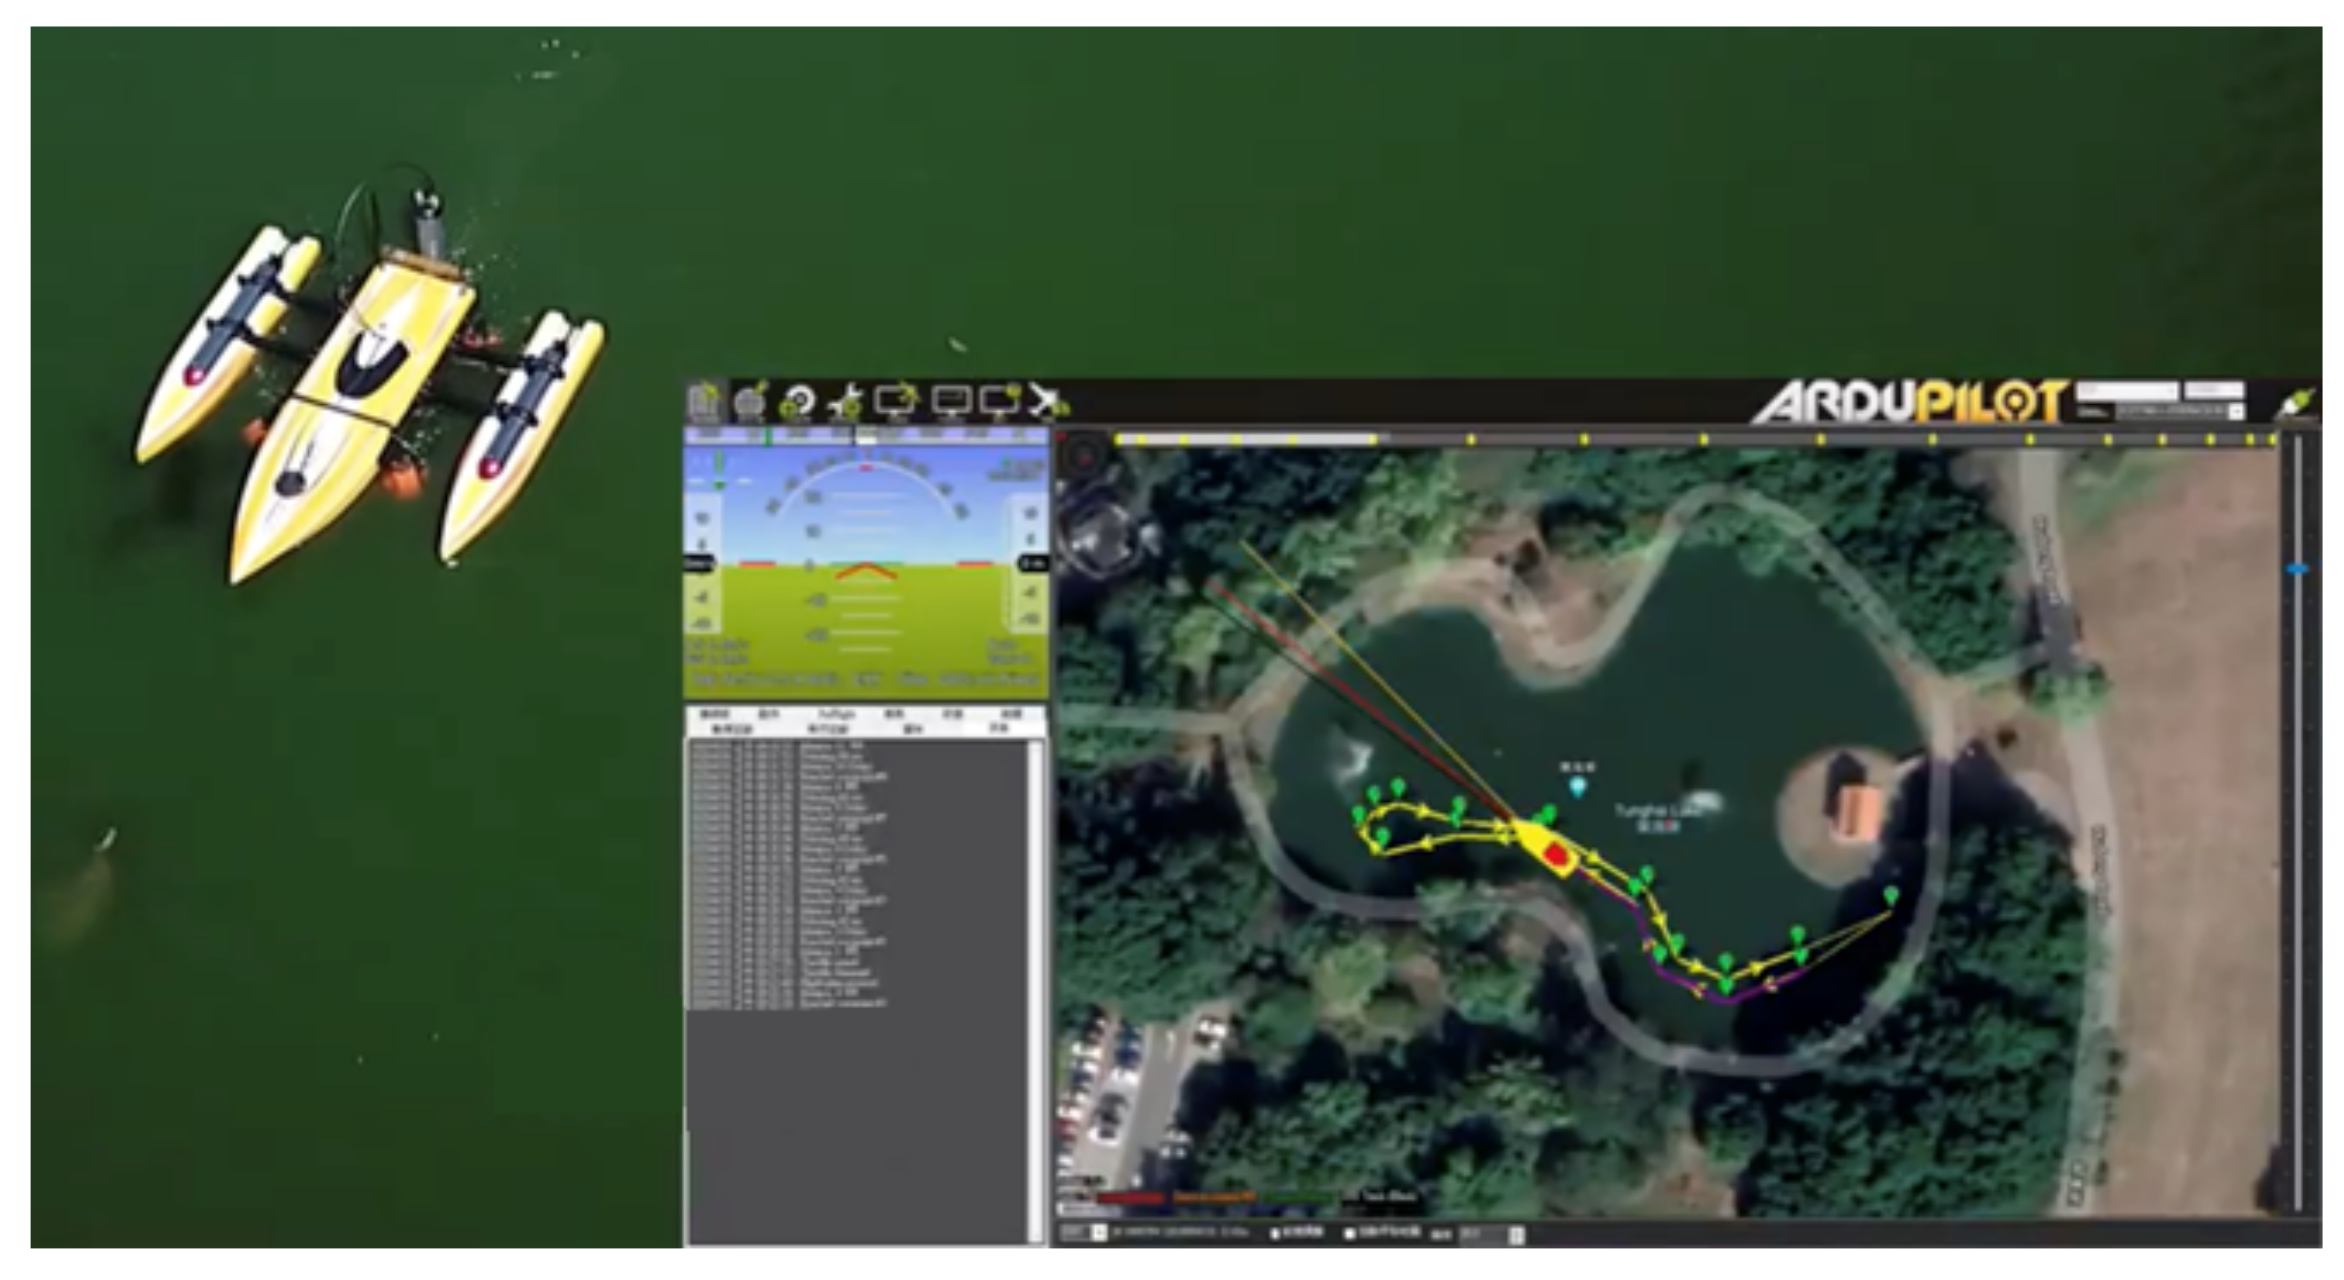
3.5.2. Water Monitoring Sensor and LoRa Deployment
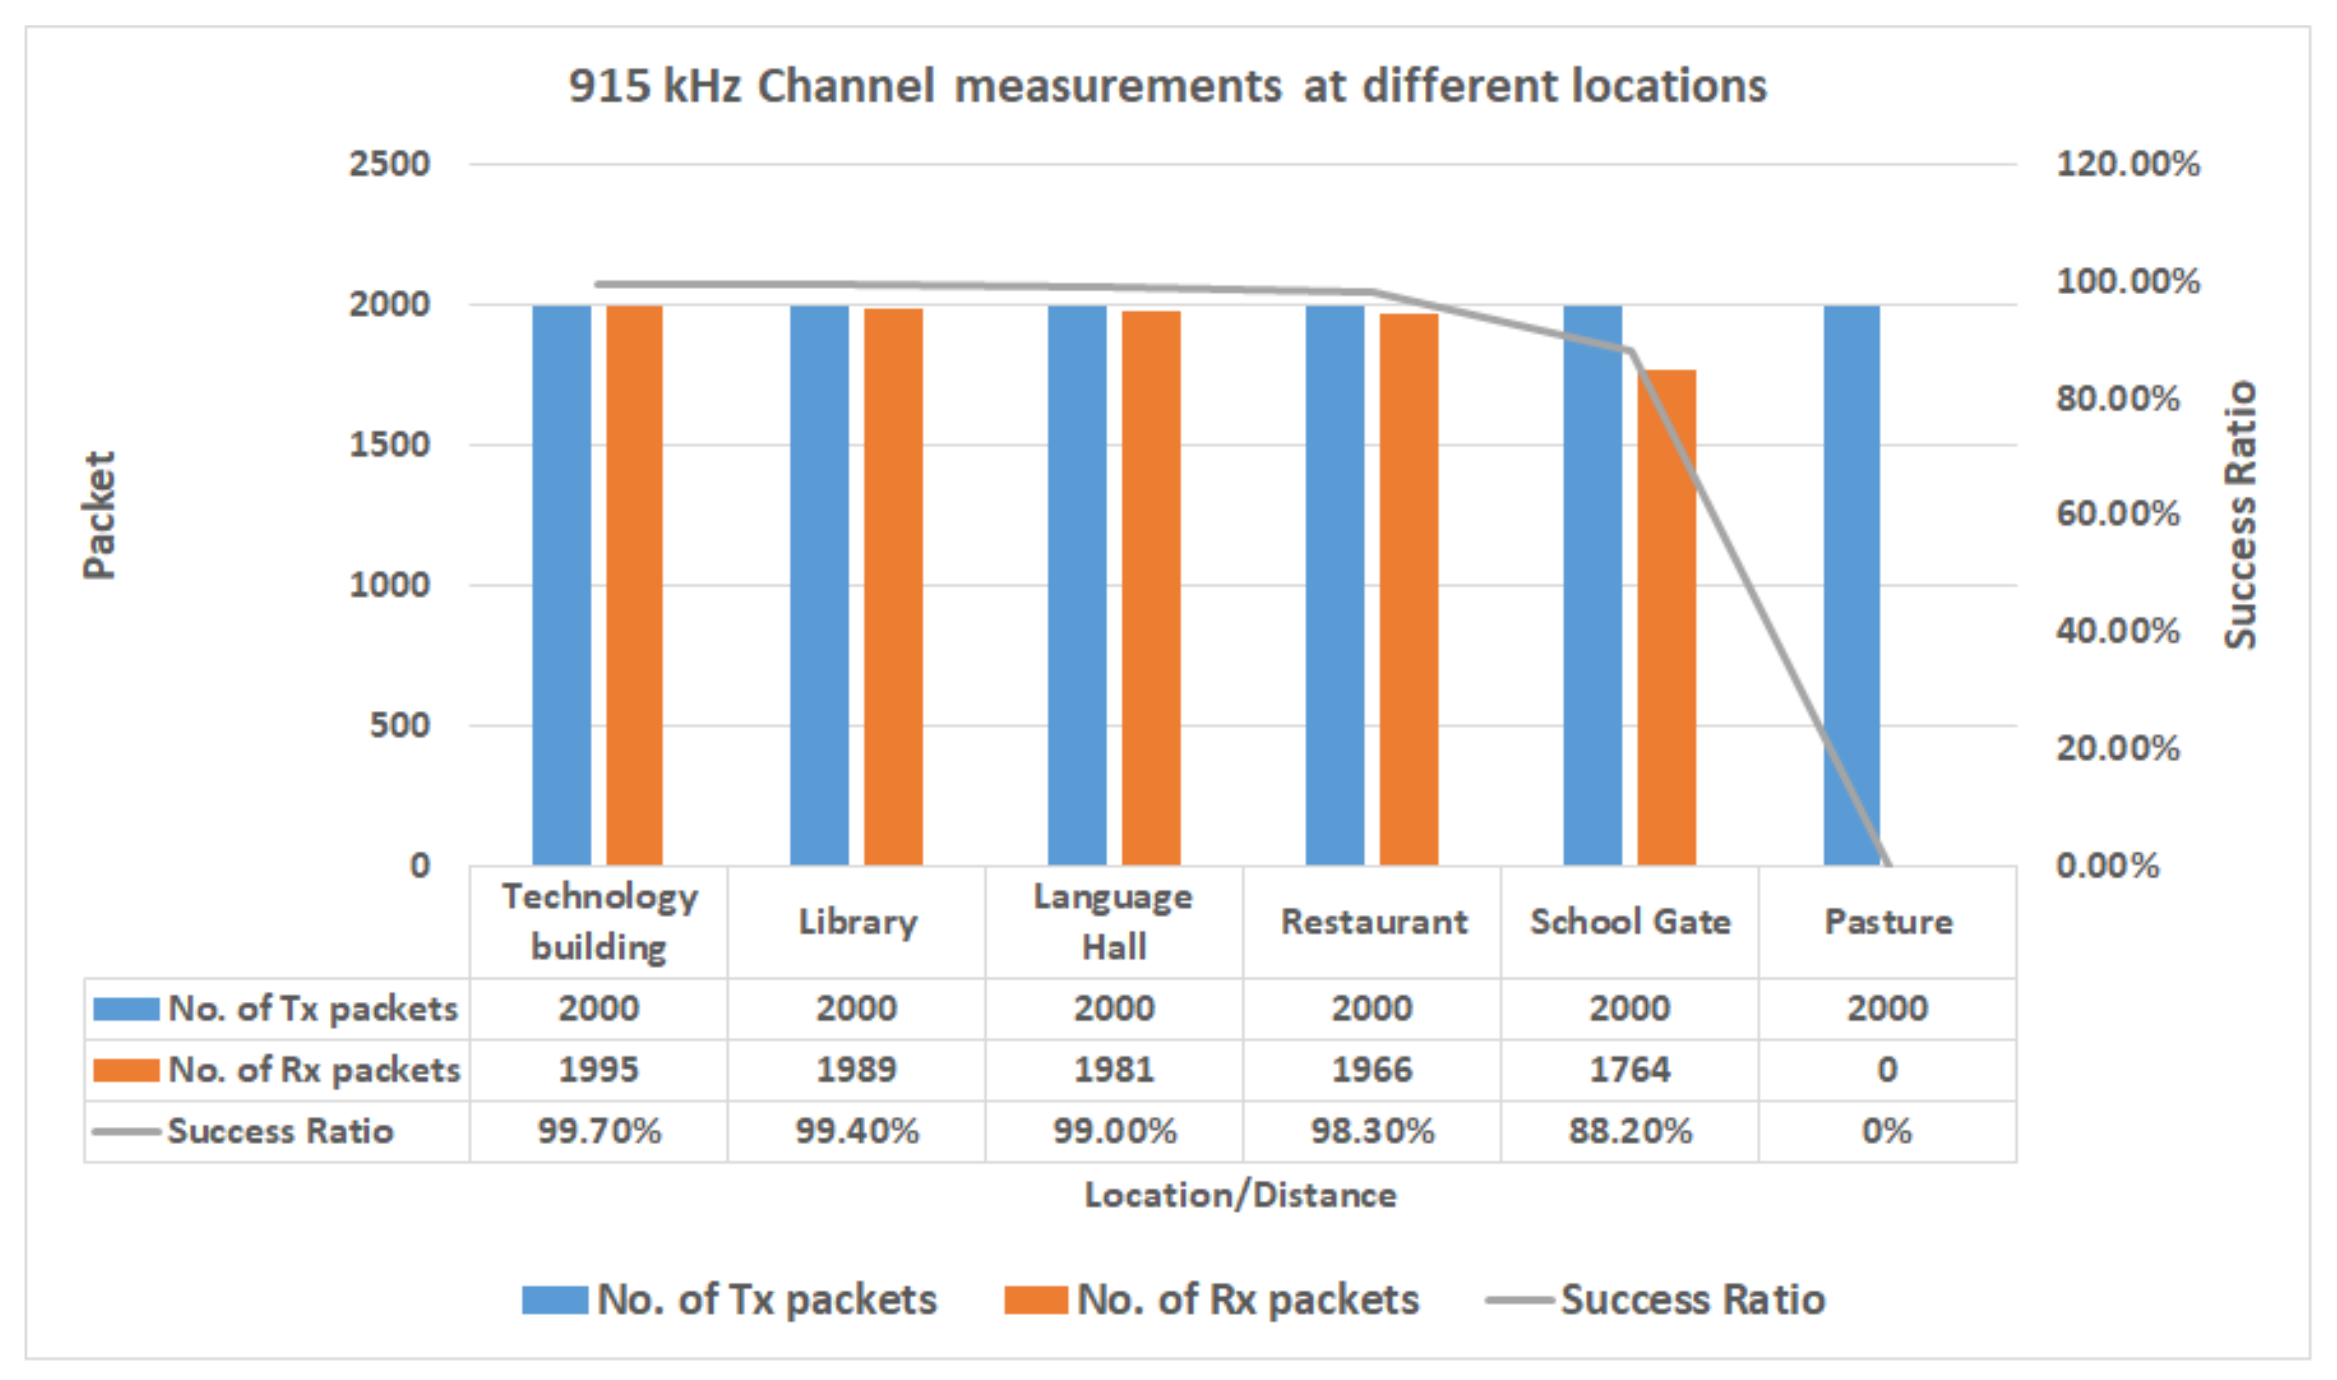
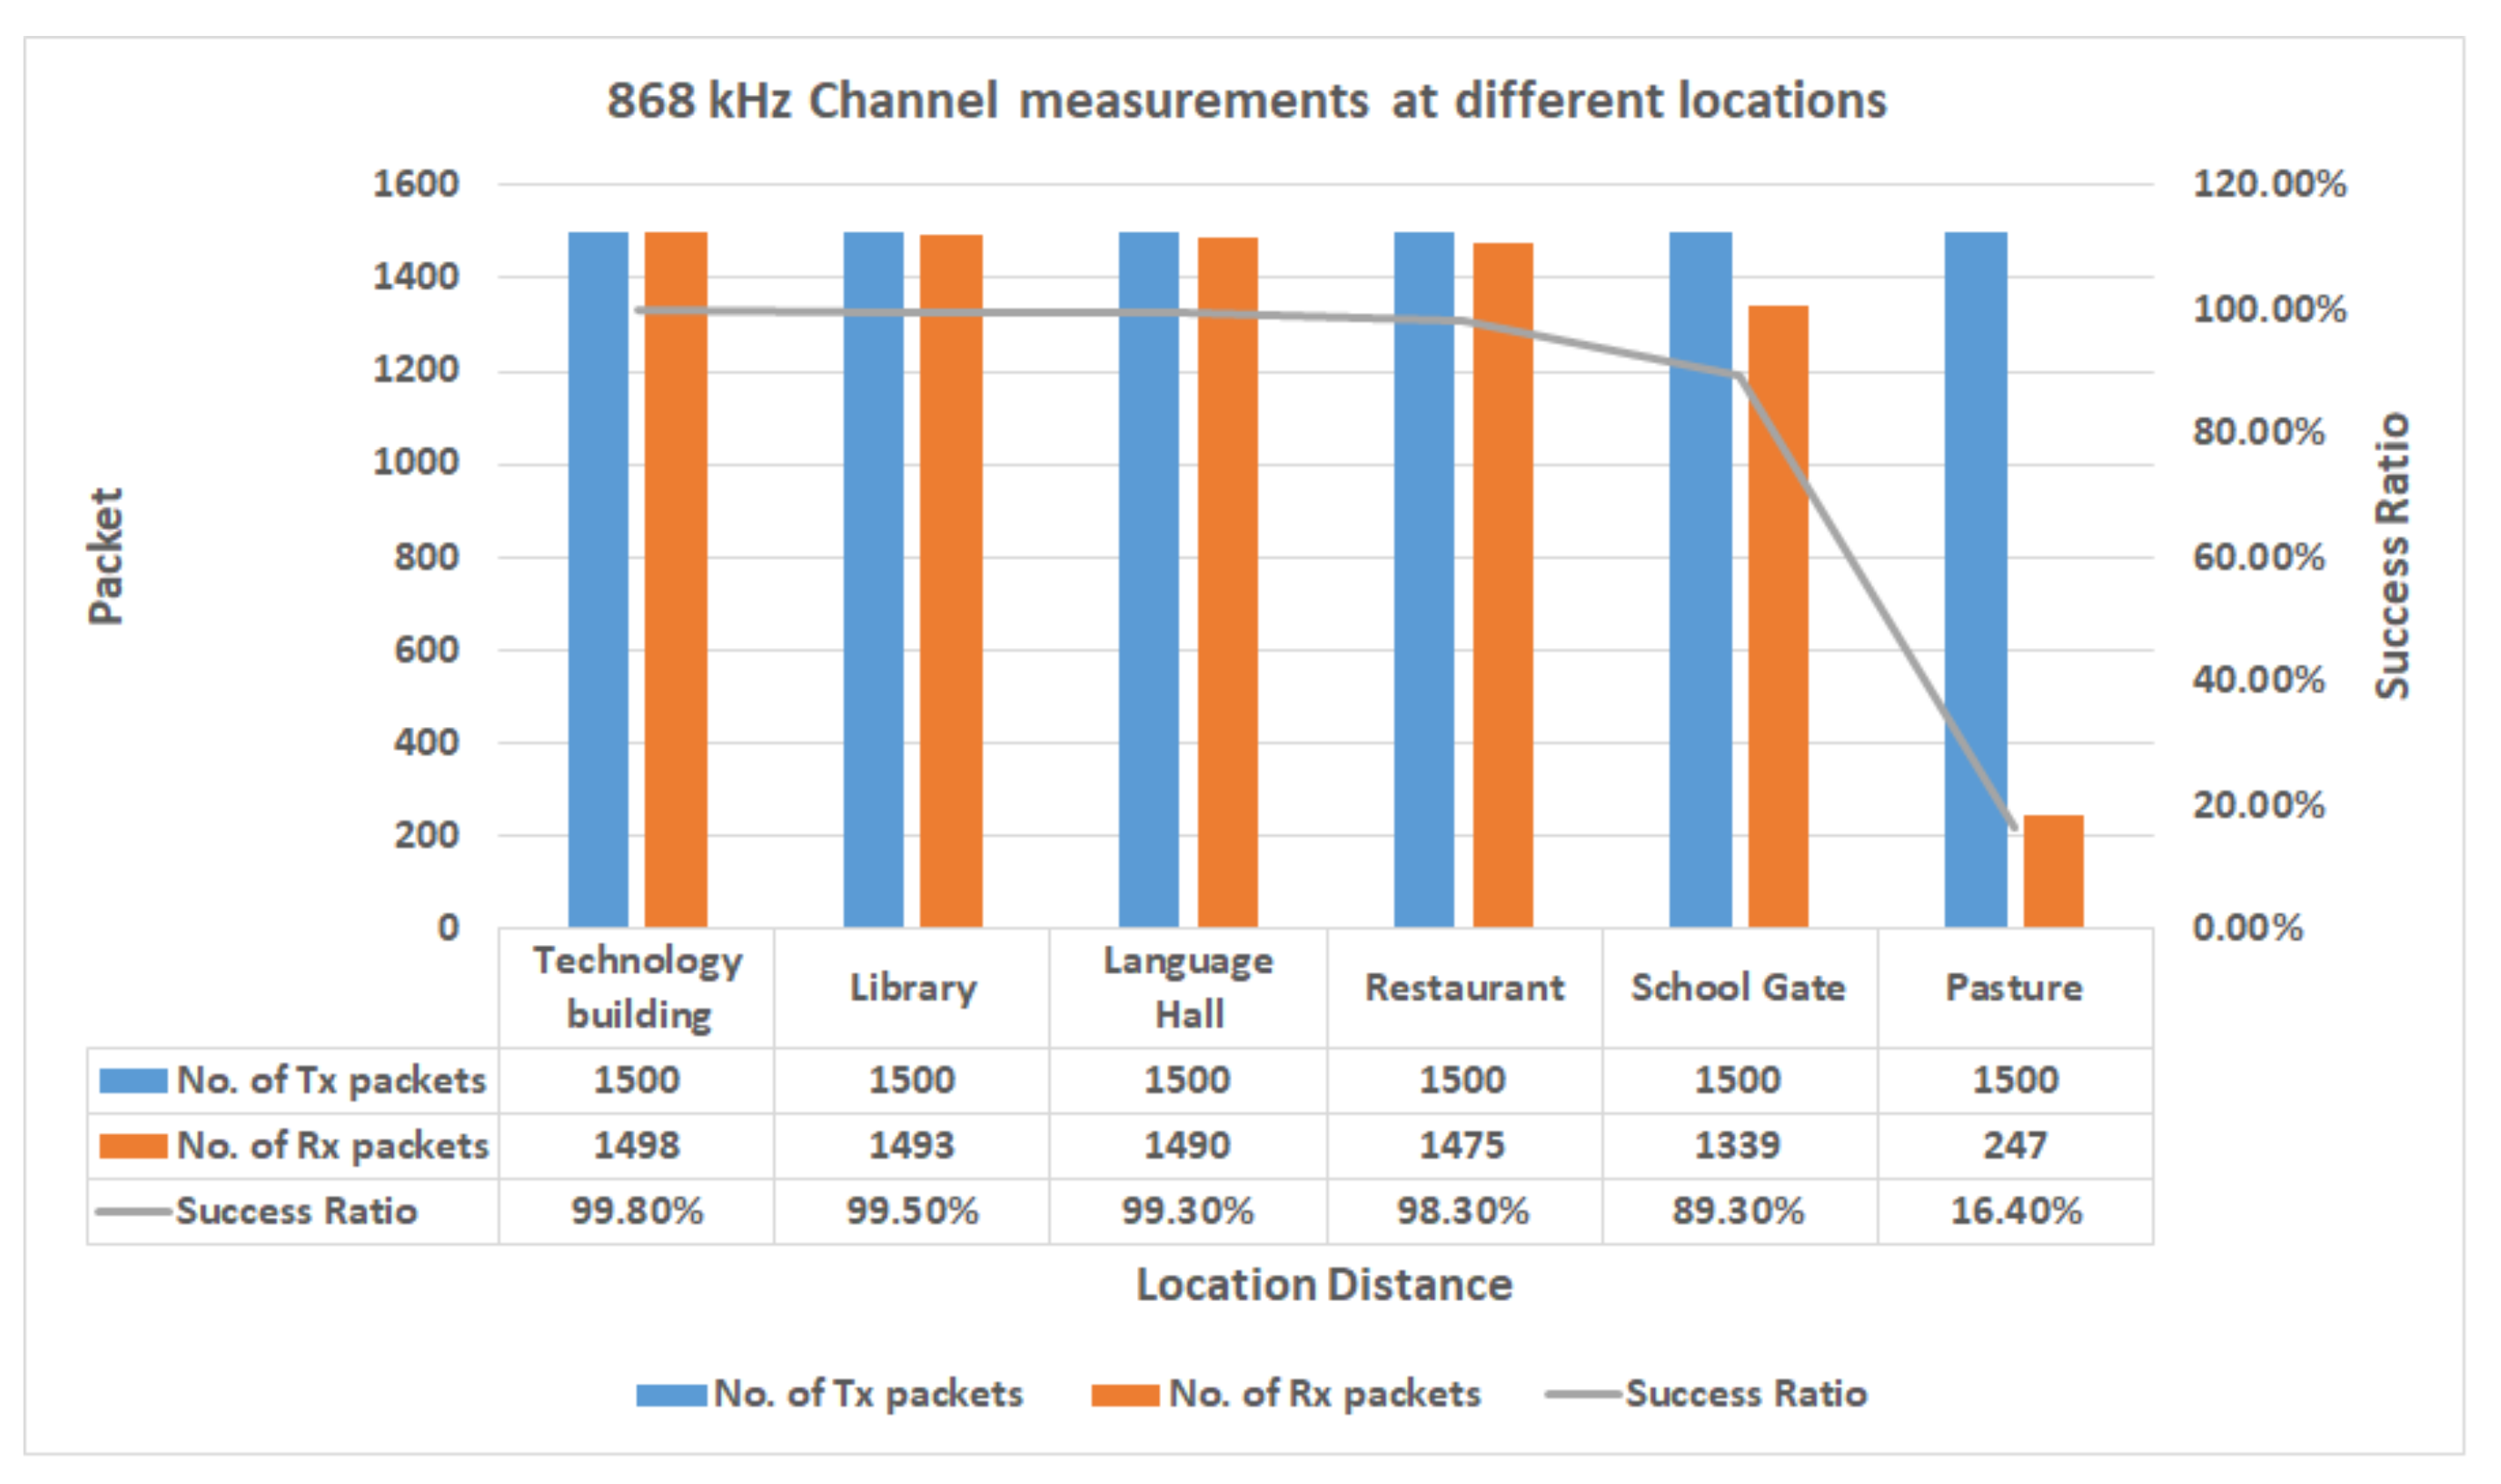
3.6. Packet Loss Rate Transmission
4. Experimental Results
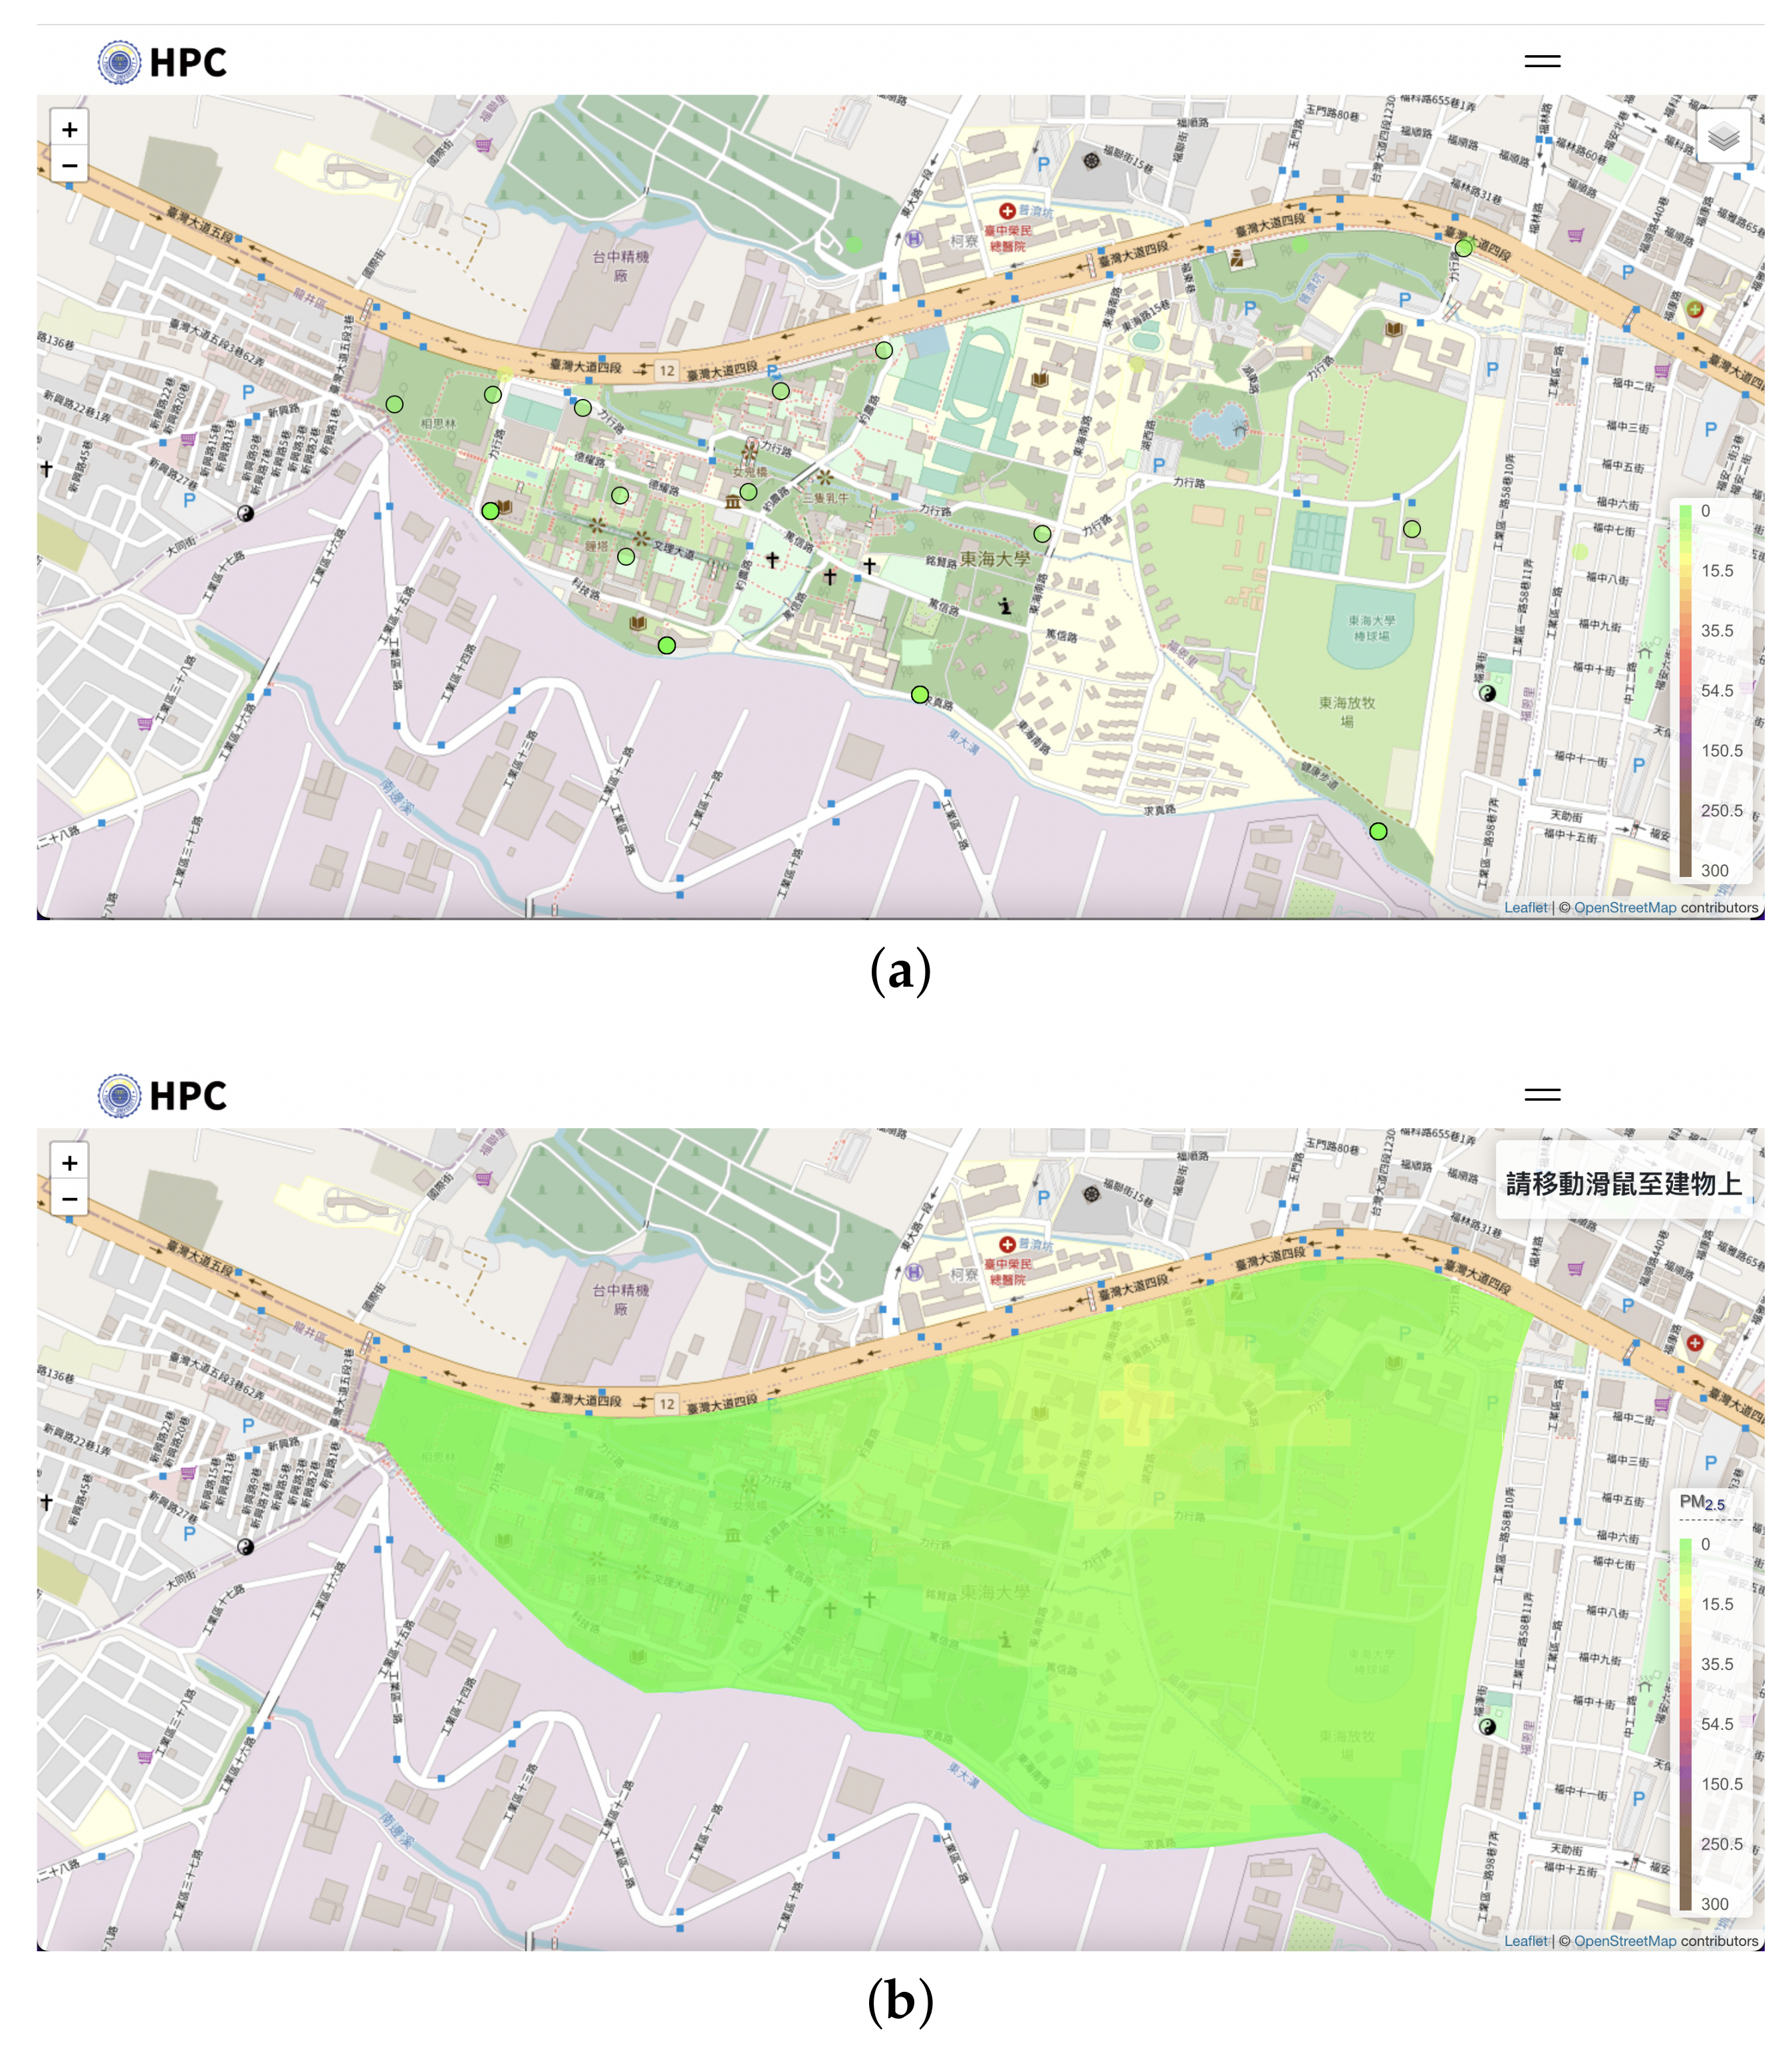
4.1. IDW Visualization
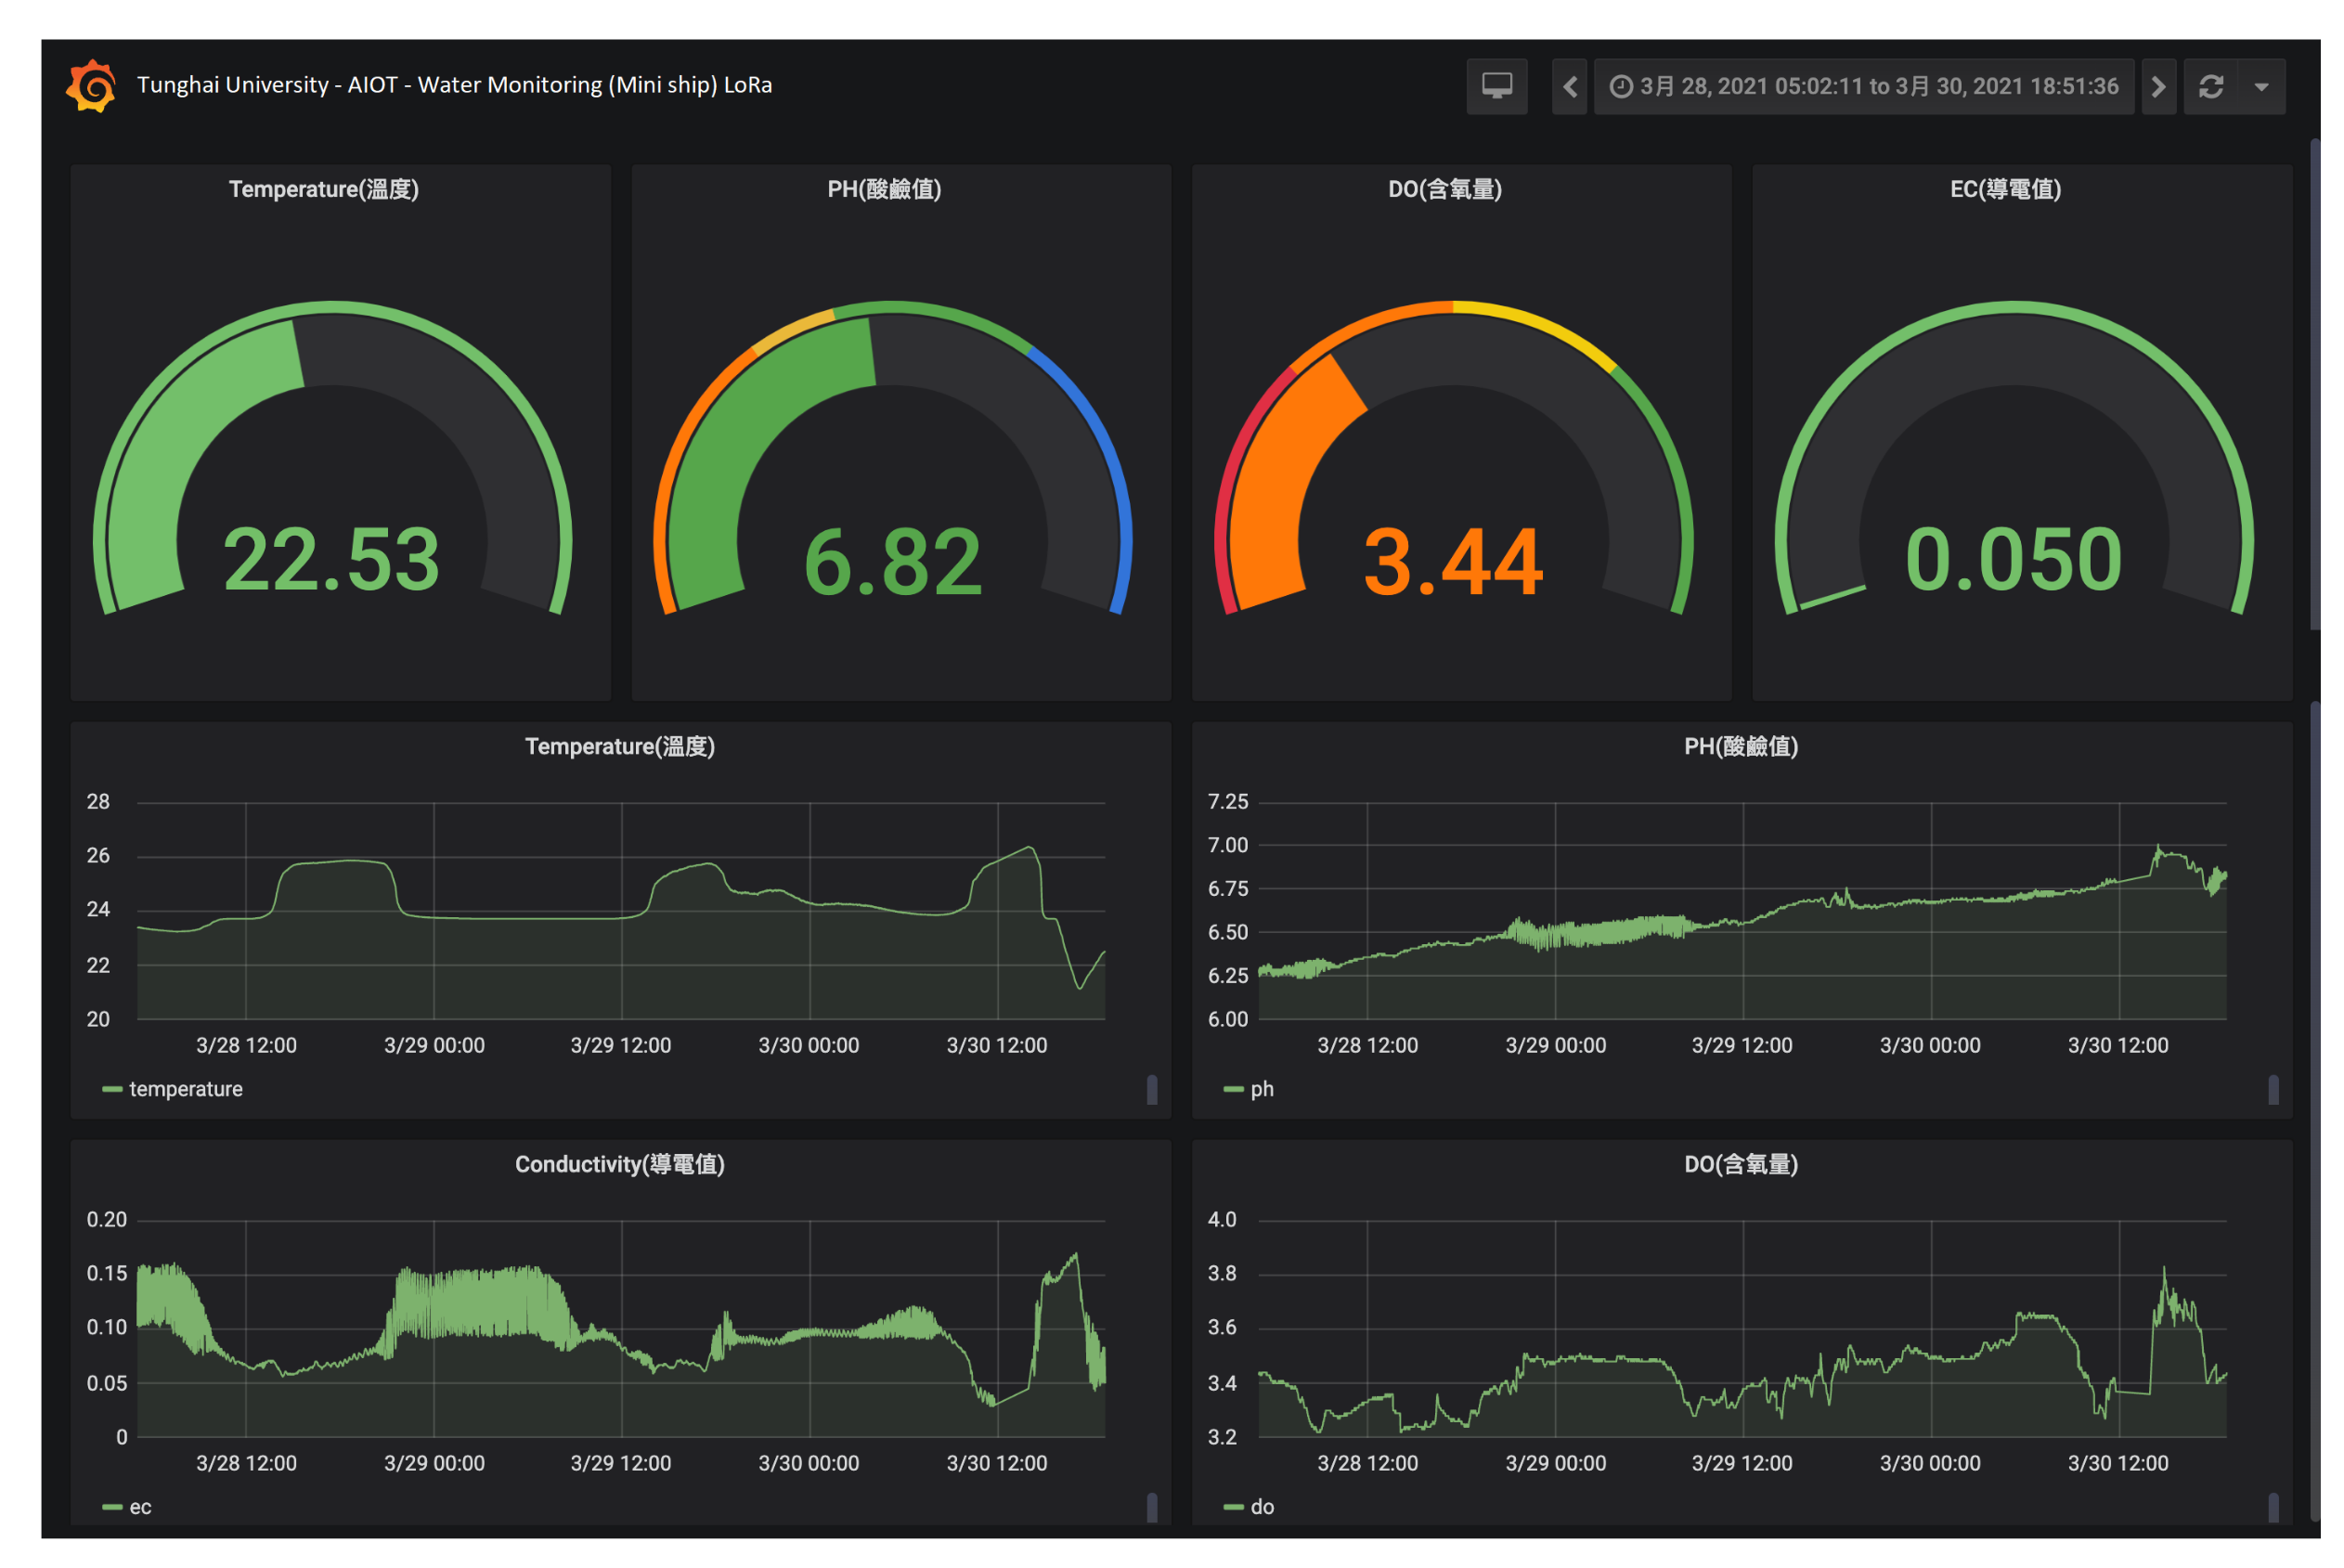
4.2. Historical Data ELK Stack Results
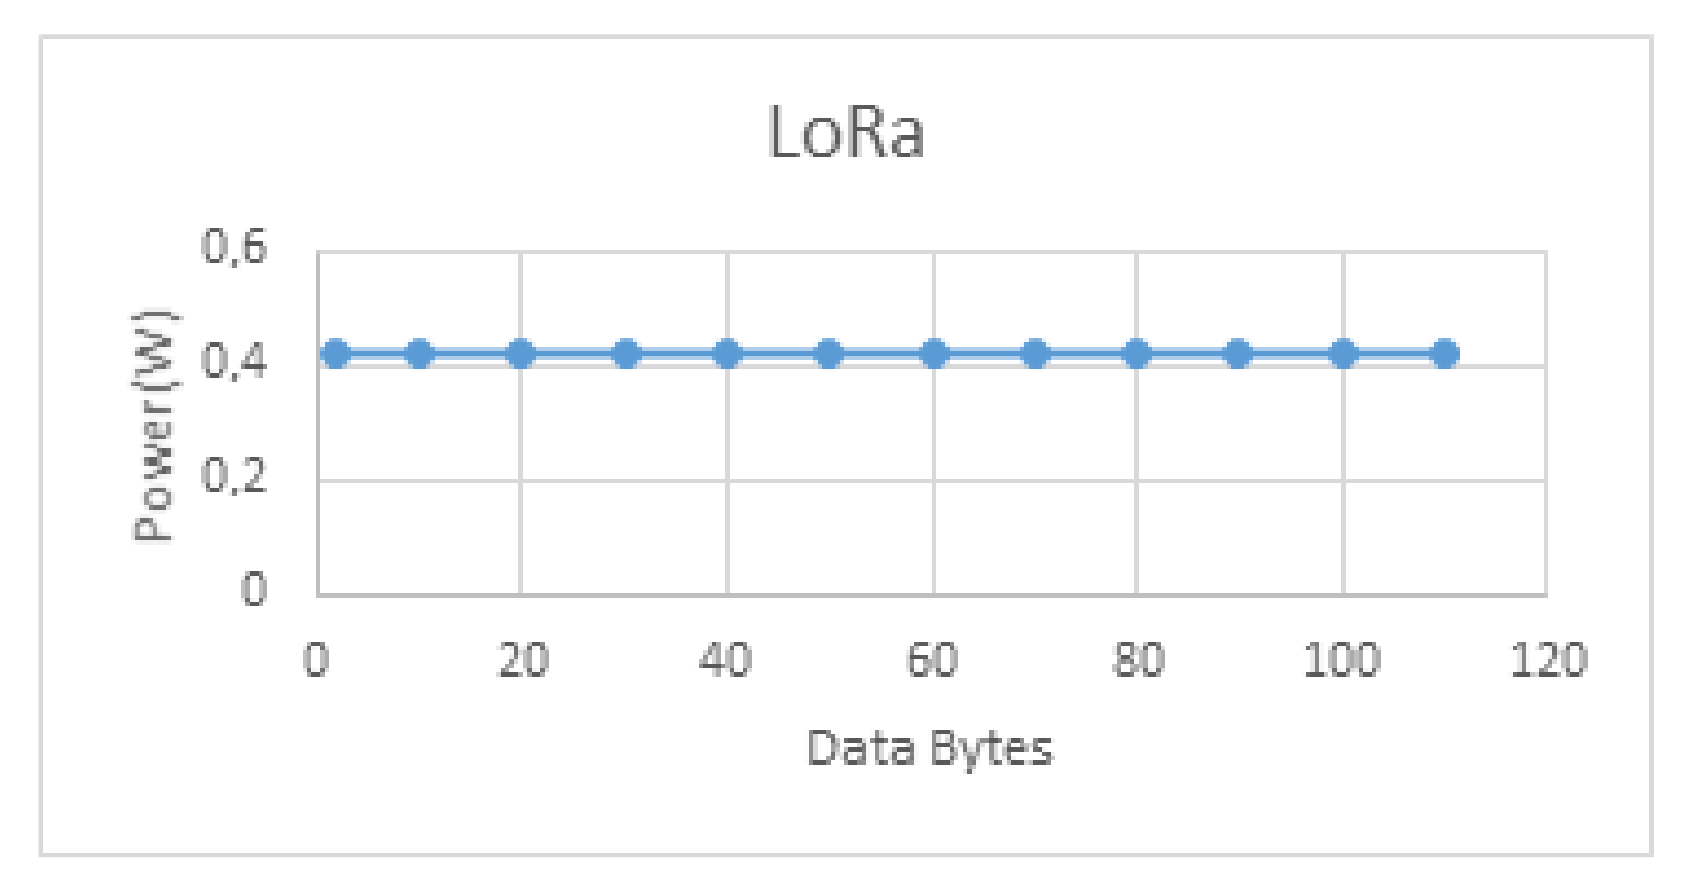
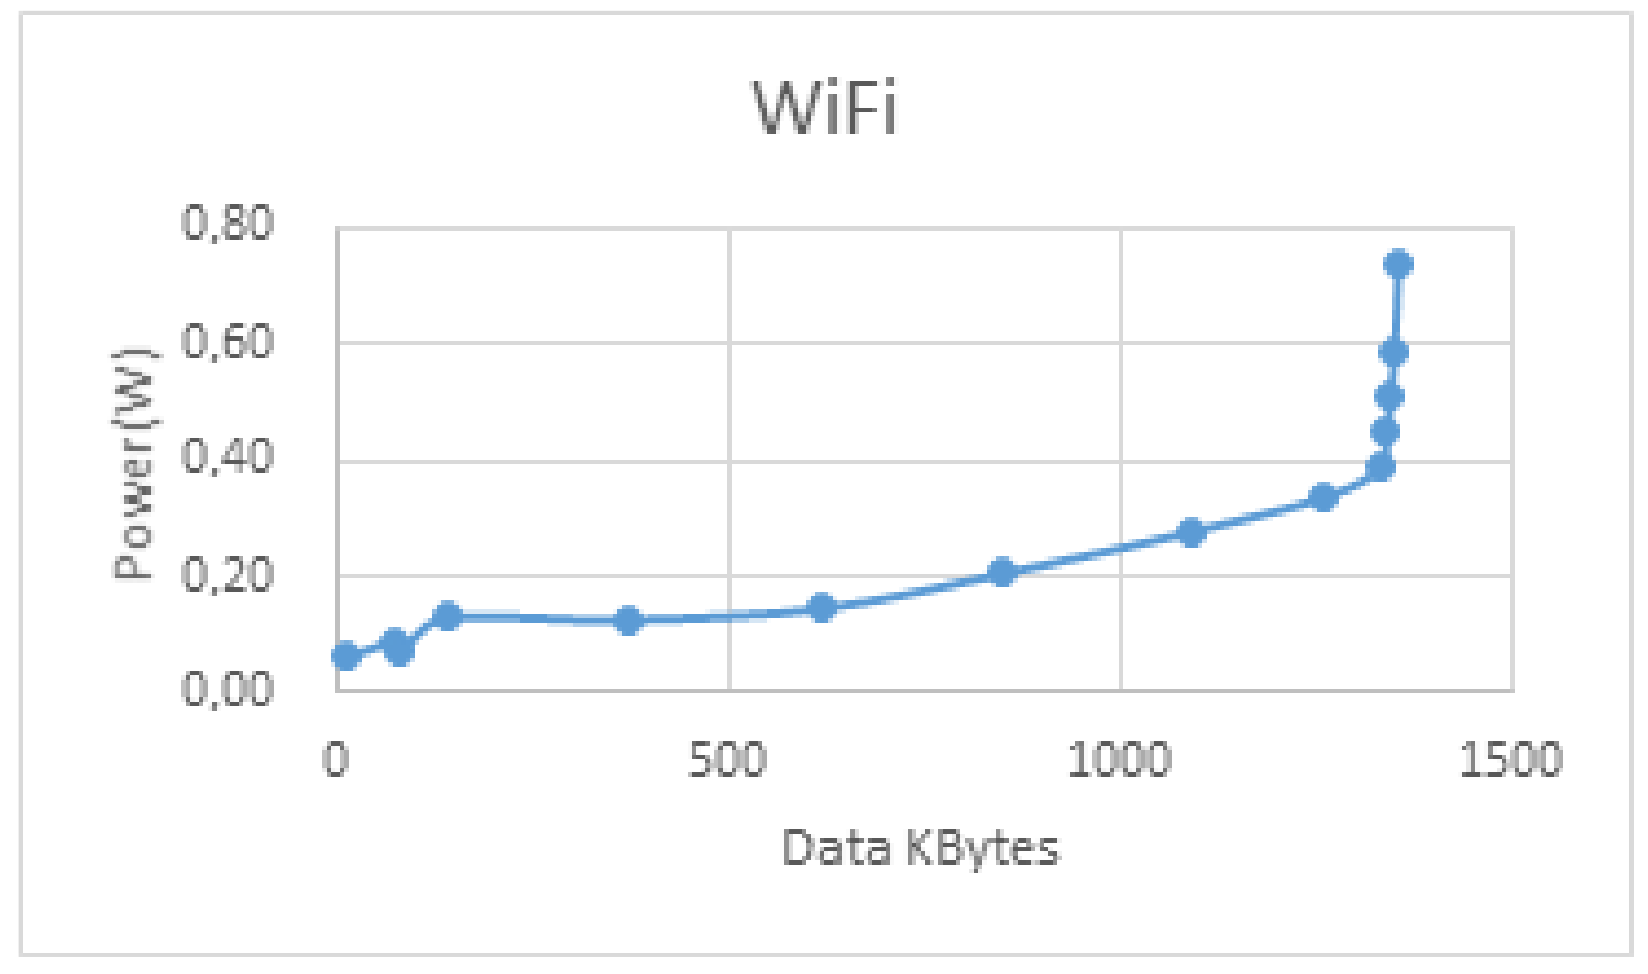
4.3. Energy Consumption Comparison with WiFi Data Transmission
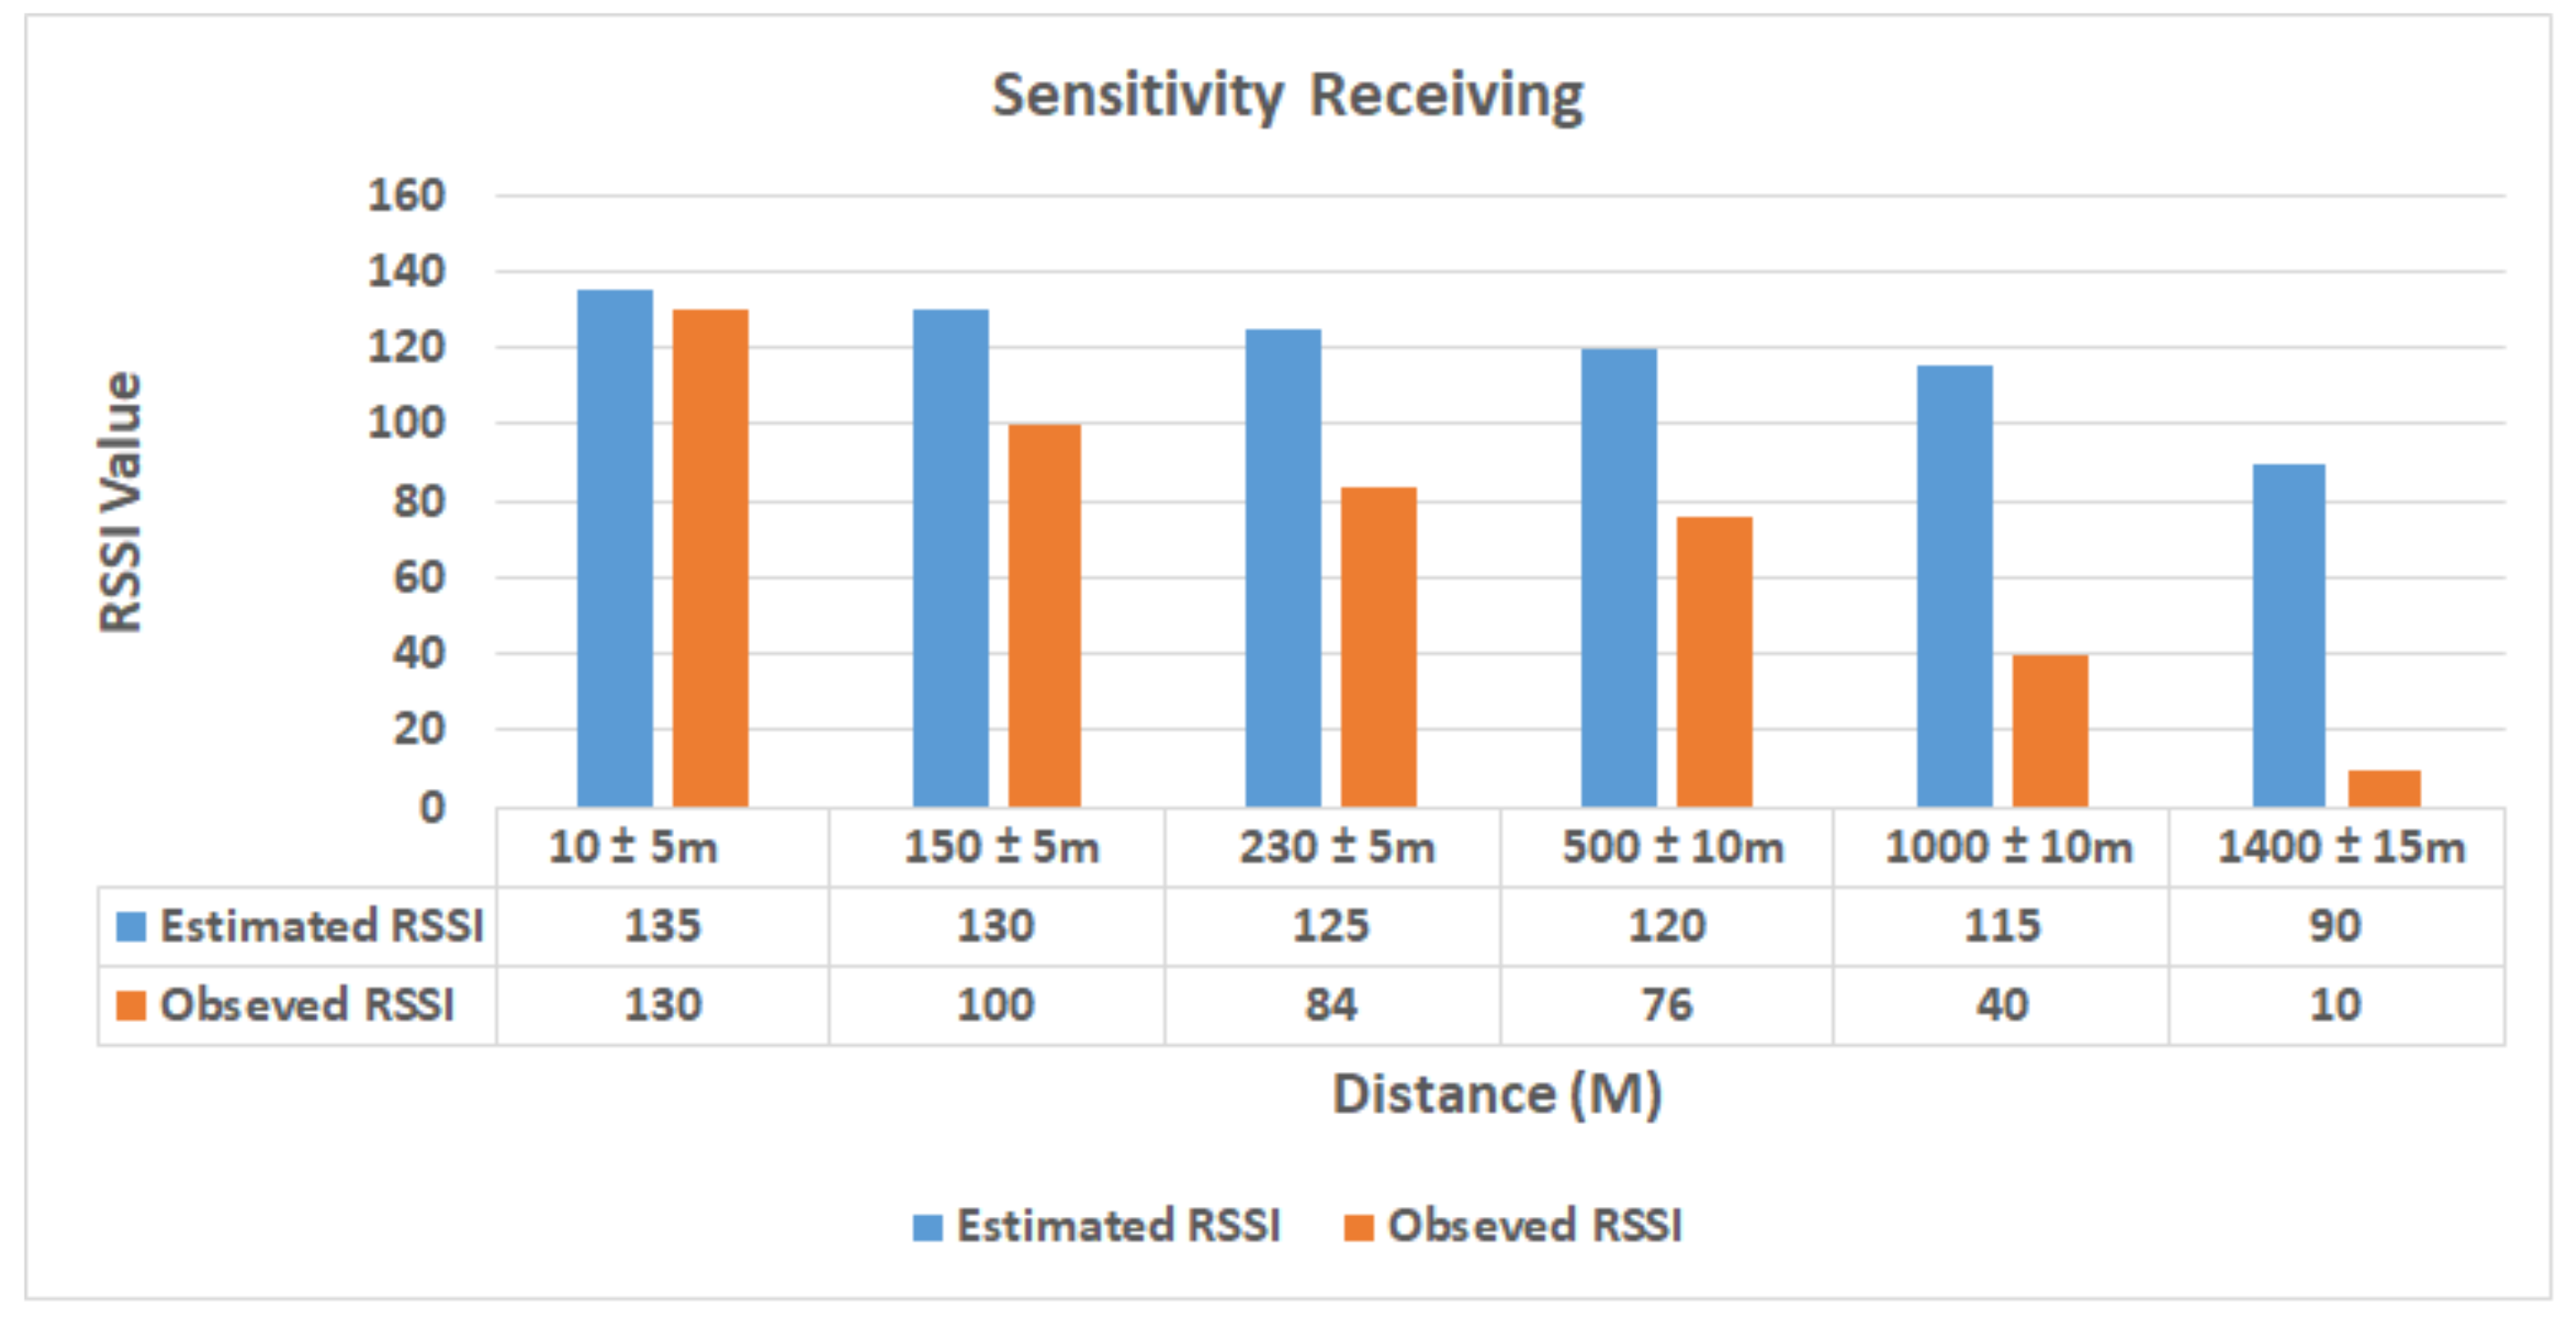
4.4. Gateway Receiving Sensitivity
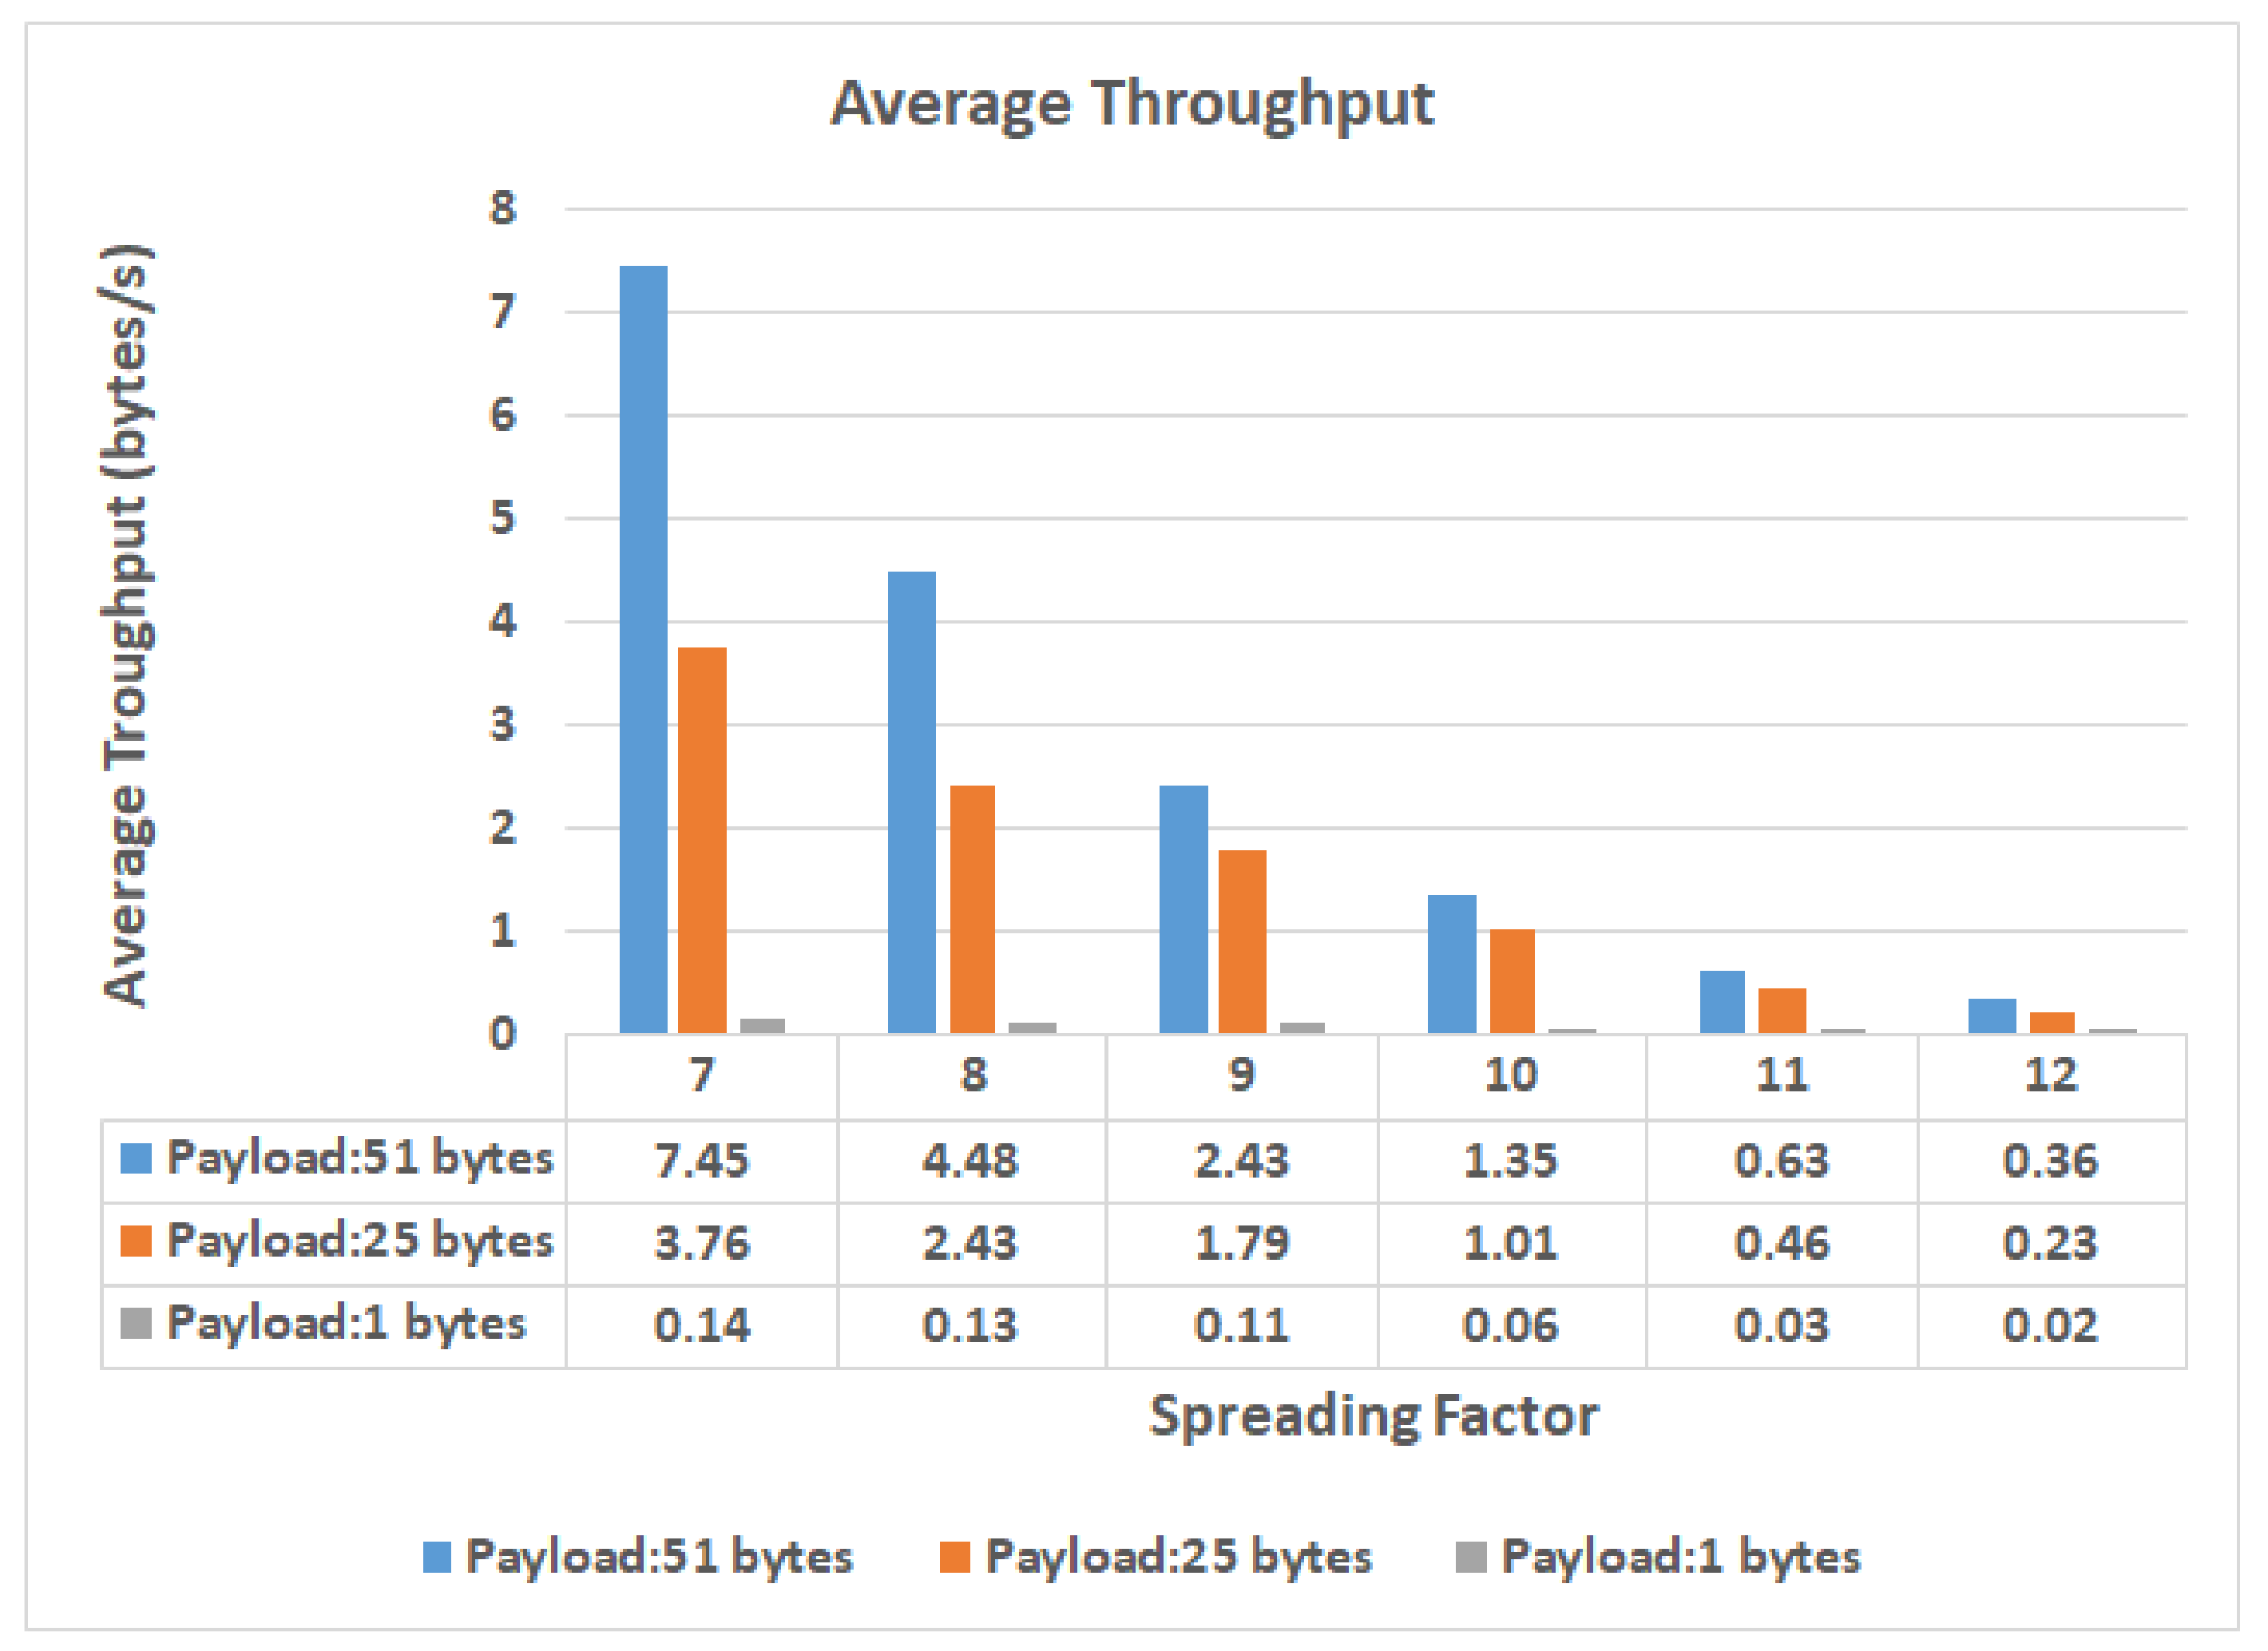
4.5. Single-Device Maximum Throughput
4.6. Discussion
5. Conclusions and Future Works
Author Contributions
Funding
Institutional Review Board Statement
Informed Consent Statement
Data Availability Statement
Conflicts of Interest
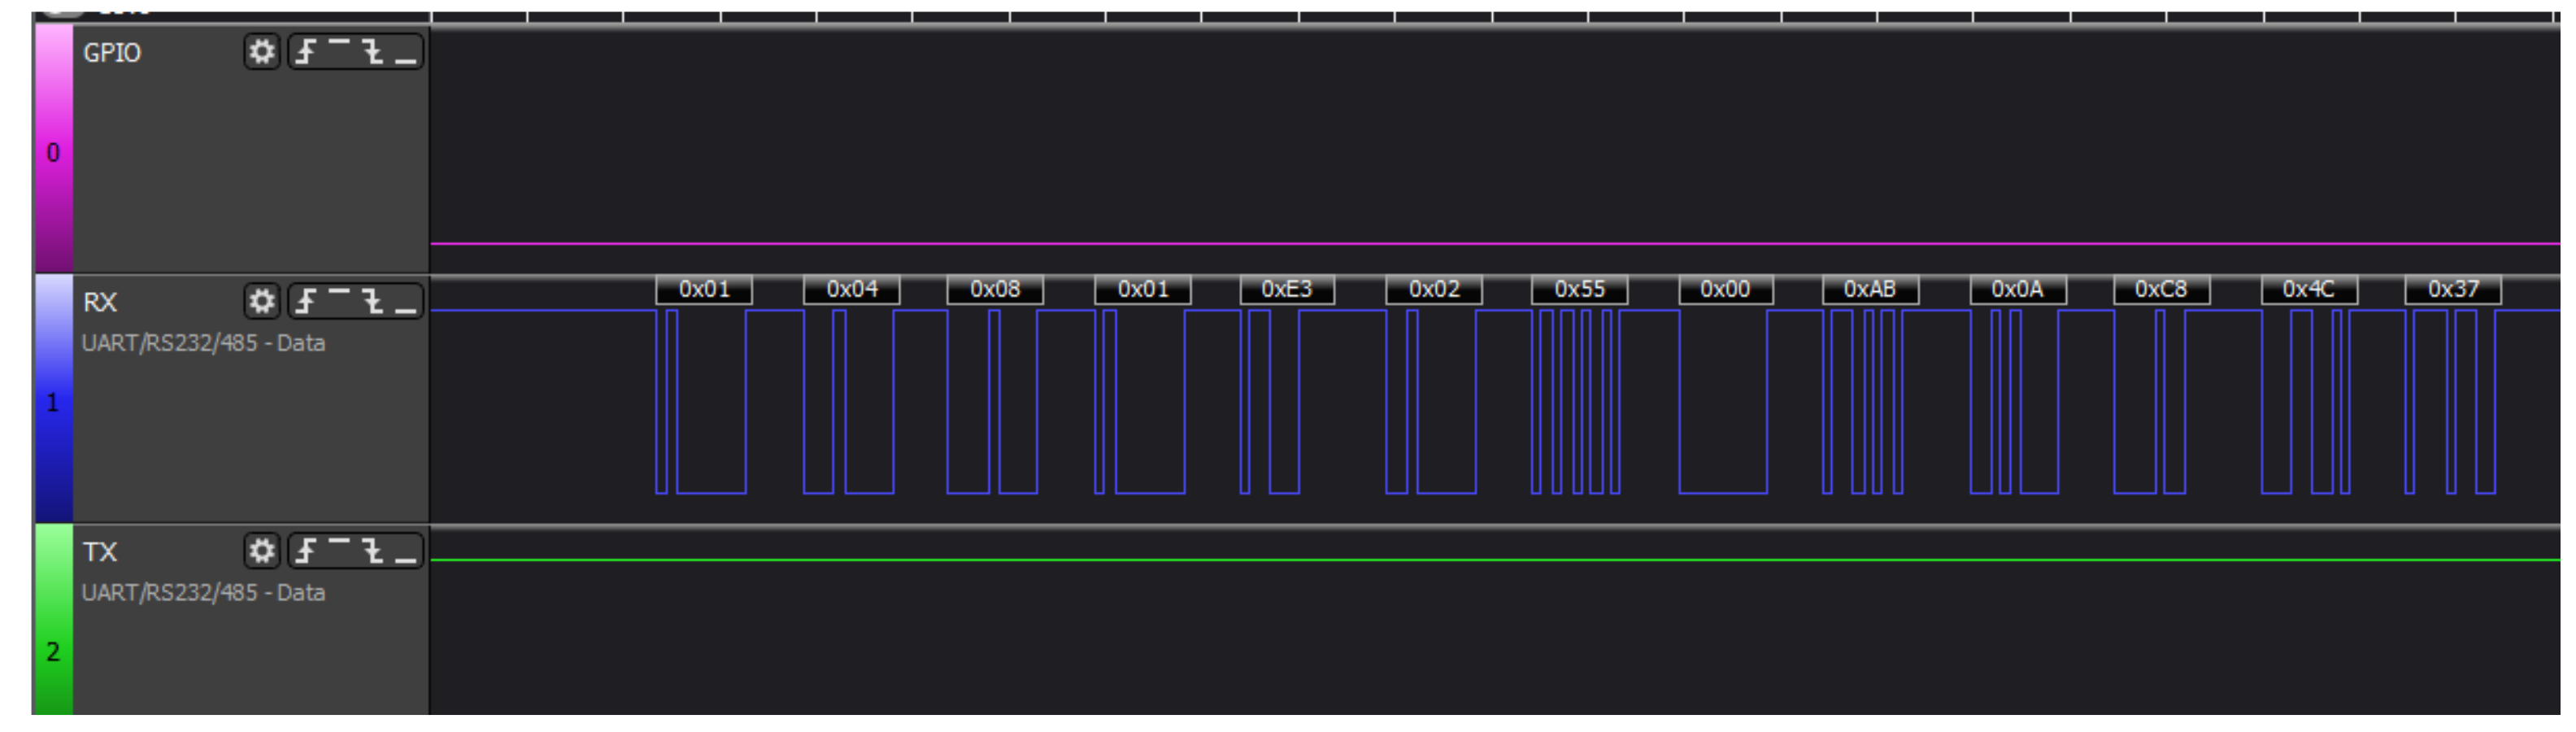
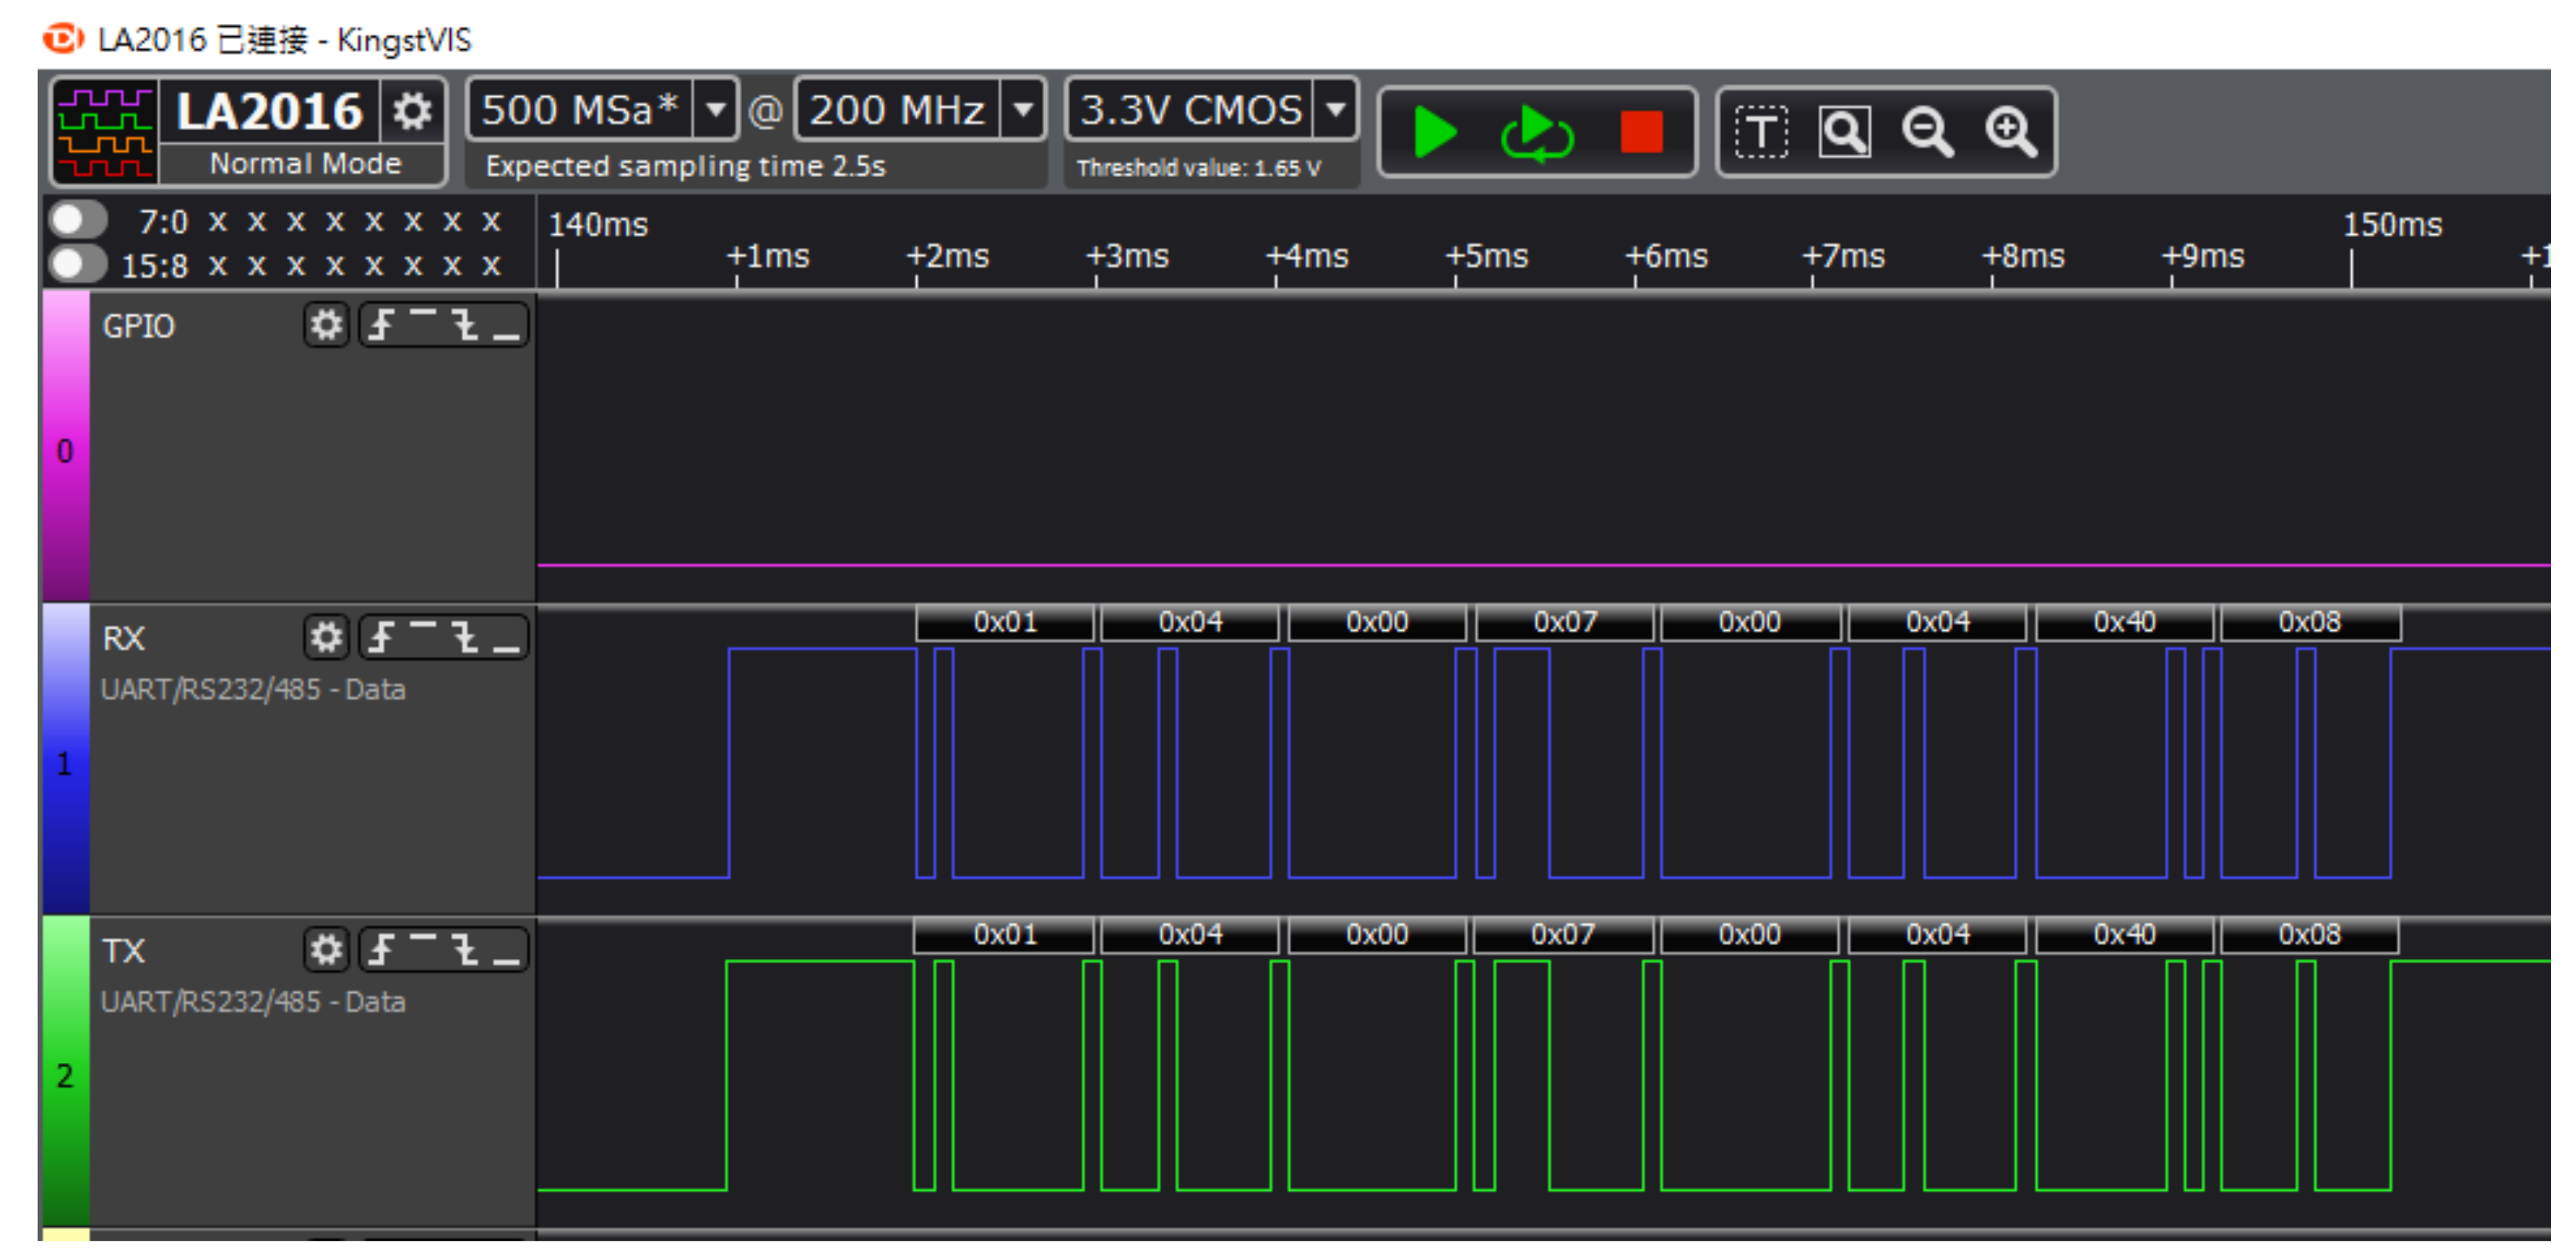
Appendix A. Tests between Rx64M and Sensors


| Address | Coding | Register High Bit (8 bit) | Register Low Bit (8 bit) | Number of Registered High Bit (8 bit) | Number of Registered Low Bit (8 bit) | CRC High Bit | CRC Low Bit |
|---|---|---|---|---|---|---|---|
| 0x01 | 0x04 | 0x00 | 0x07 | 0x00 | 0x05 | 0x81 | 0xC8 |
| Name | High Byte | Low Byte | Complete Value | Actual Value |
|---|---|---|---|---|
| pH | 0x01 | 0xE4 | 484 | 4.8 |
| DO | 0x02 | 0x4D | 589 | 5.89 |
| COND | 0x00 | 0xAF | 175 | 0.175 |
| Temp | 0x0A | 0x3A | 2618 | 26.18 |
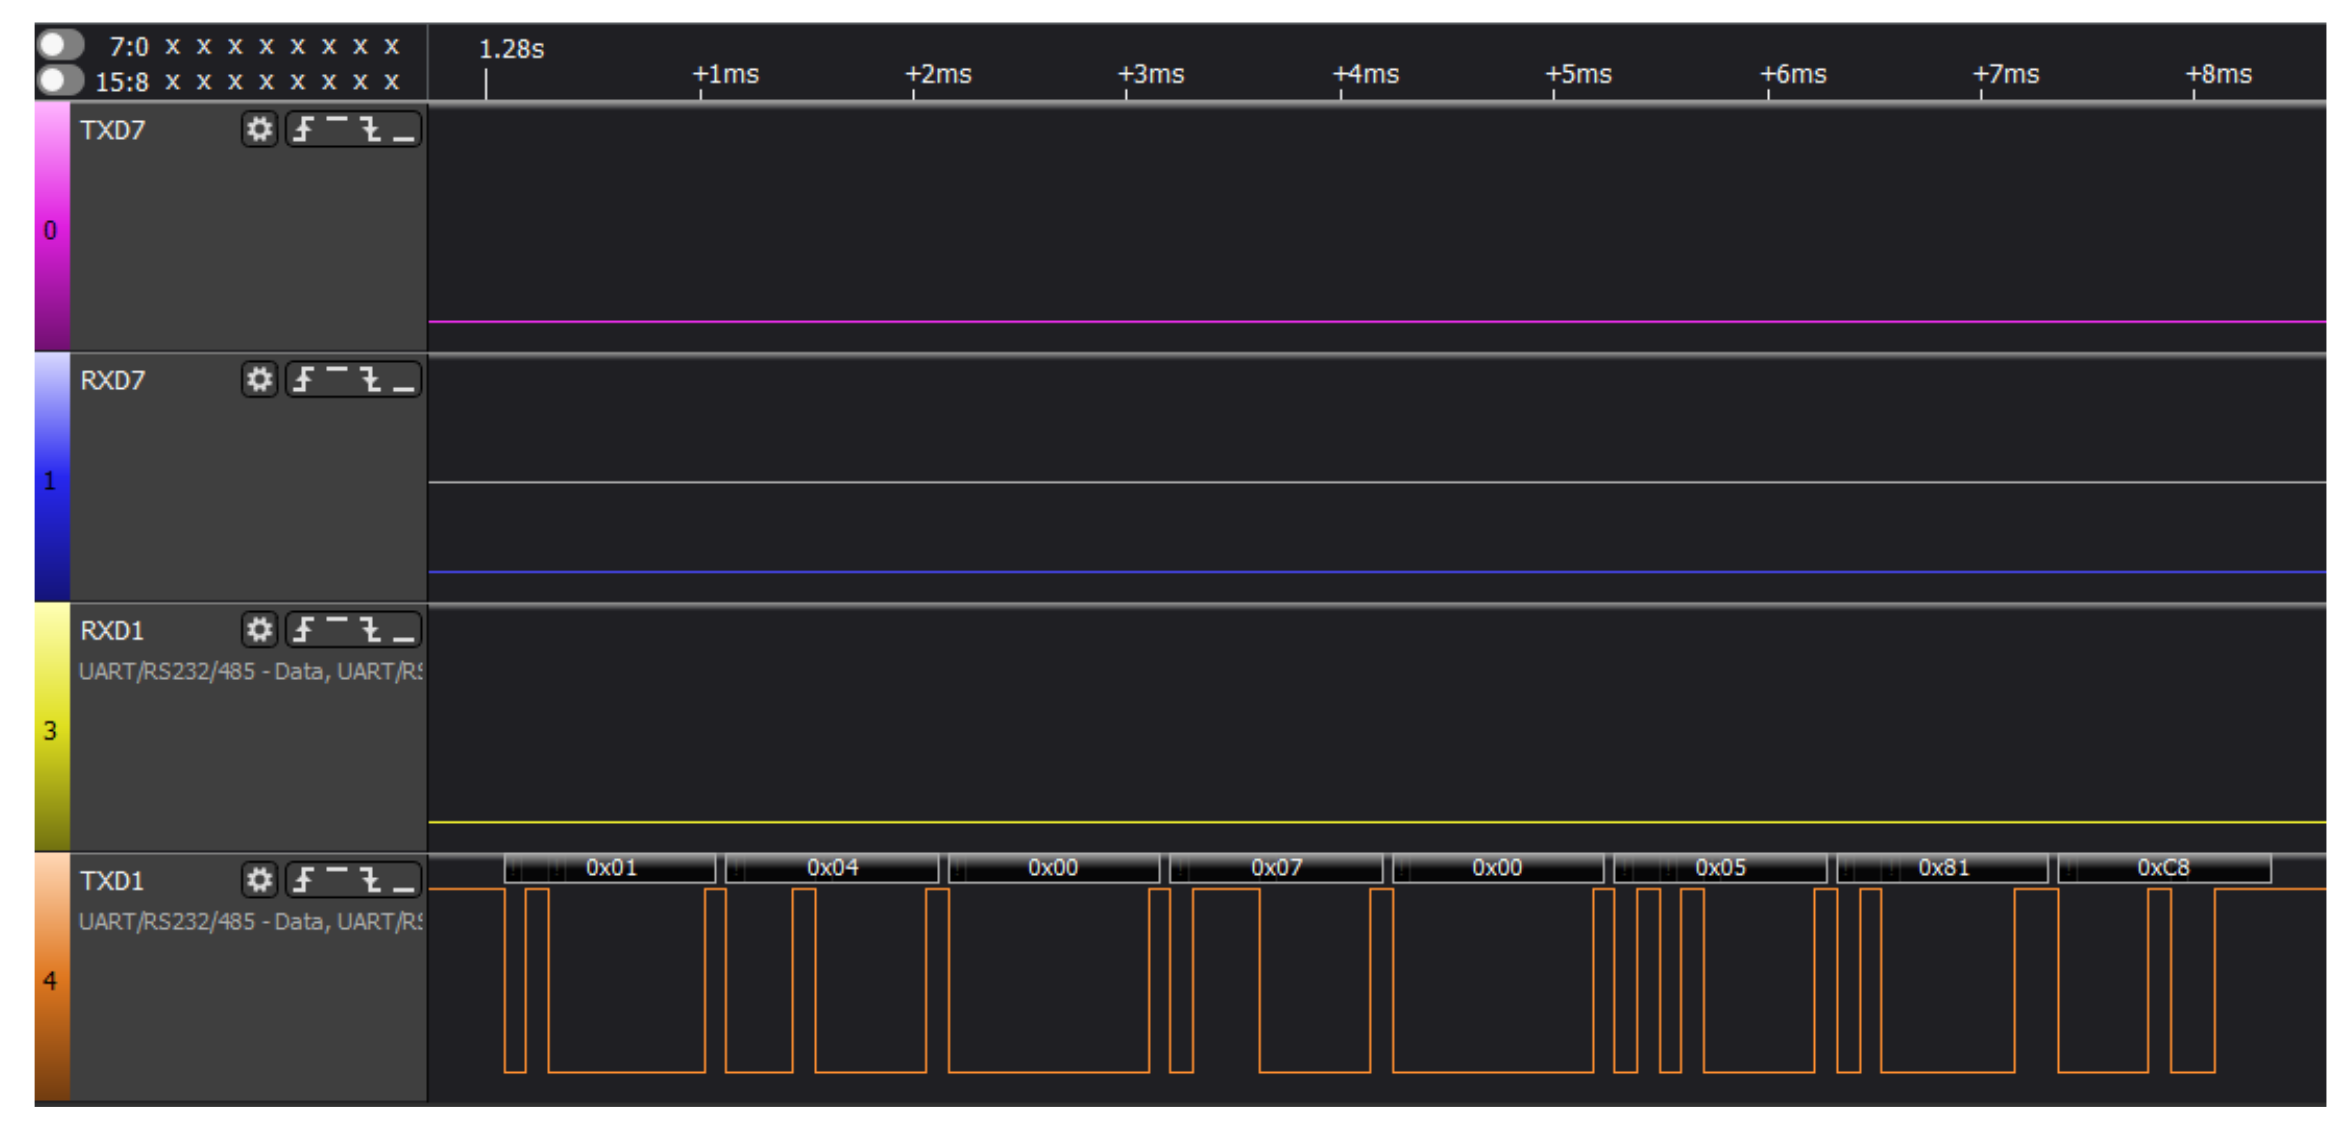
Appendix B. Tests between Rx64M and the LoRa Module of EK-S76SXB

| Address | Coding (8 bit) | Register High Bit (8 bit) | Register Low Bit (8 bit) | Number of Registered High Bits (8 bit) | Number of Registered Low Bits (8 bit) | CRC High Bit | CRC Low Bit |
|---|---|---|---|---|---|---|---|
| 0x01 | 0x06 | 0x00 | 0x02 | 0x00 | 0x05 | 0x29 | 0xCC |
| Address | Coding (8 bit) | Register High Bit (8 bit) | Register Low Bit (8 bit) | Number of Registered High Bits (8 bit) | Number of Registered Low Bits (8 bit) | CRC High Bit | CRC Low Bit |
|---|---|---|---|---|---|---|---|
| 0x01 | 0x04 | 0x00 | 0x07 | 0x00 | 0x05 | 0x81 | 0xC8 |
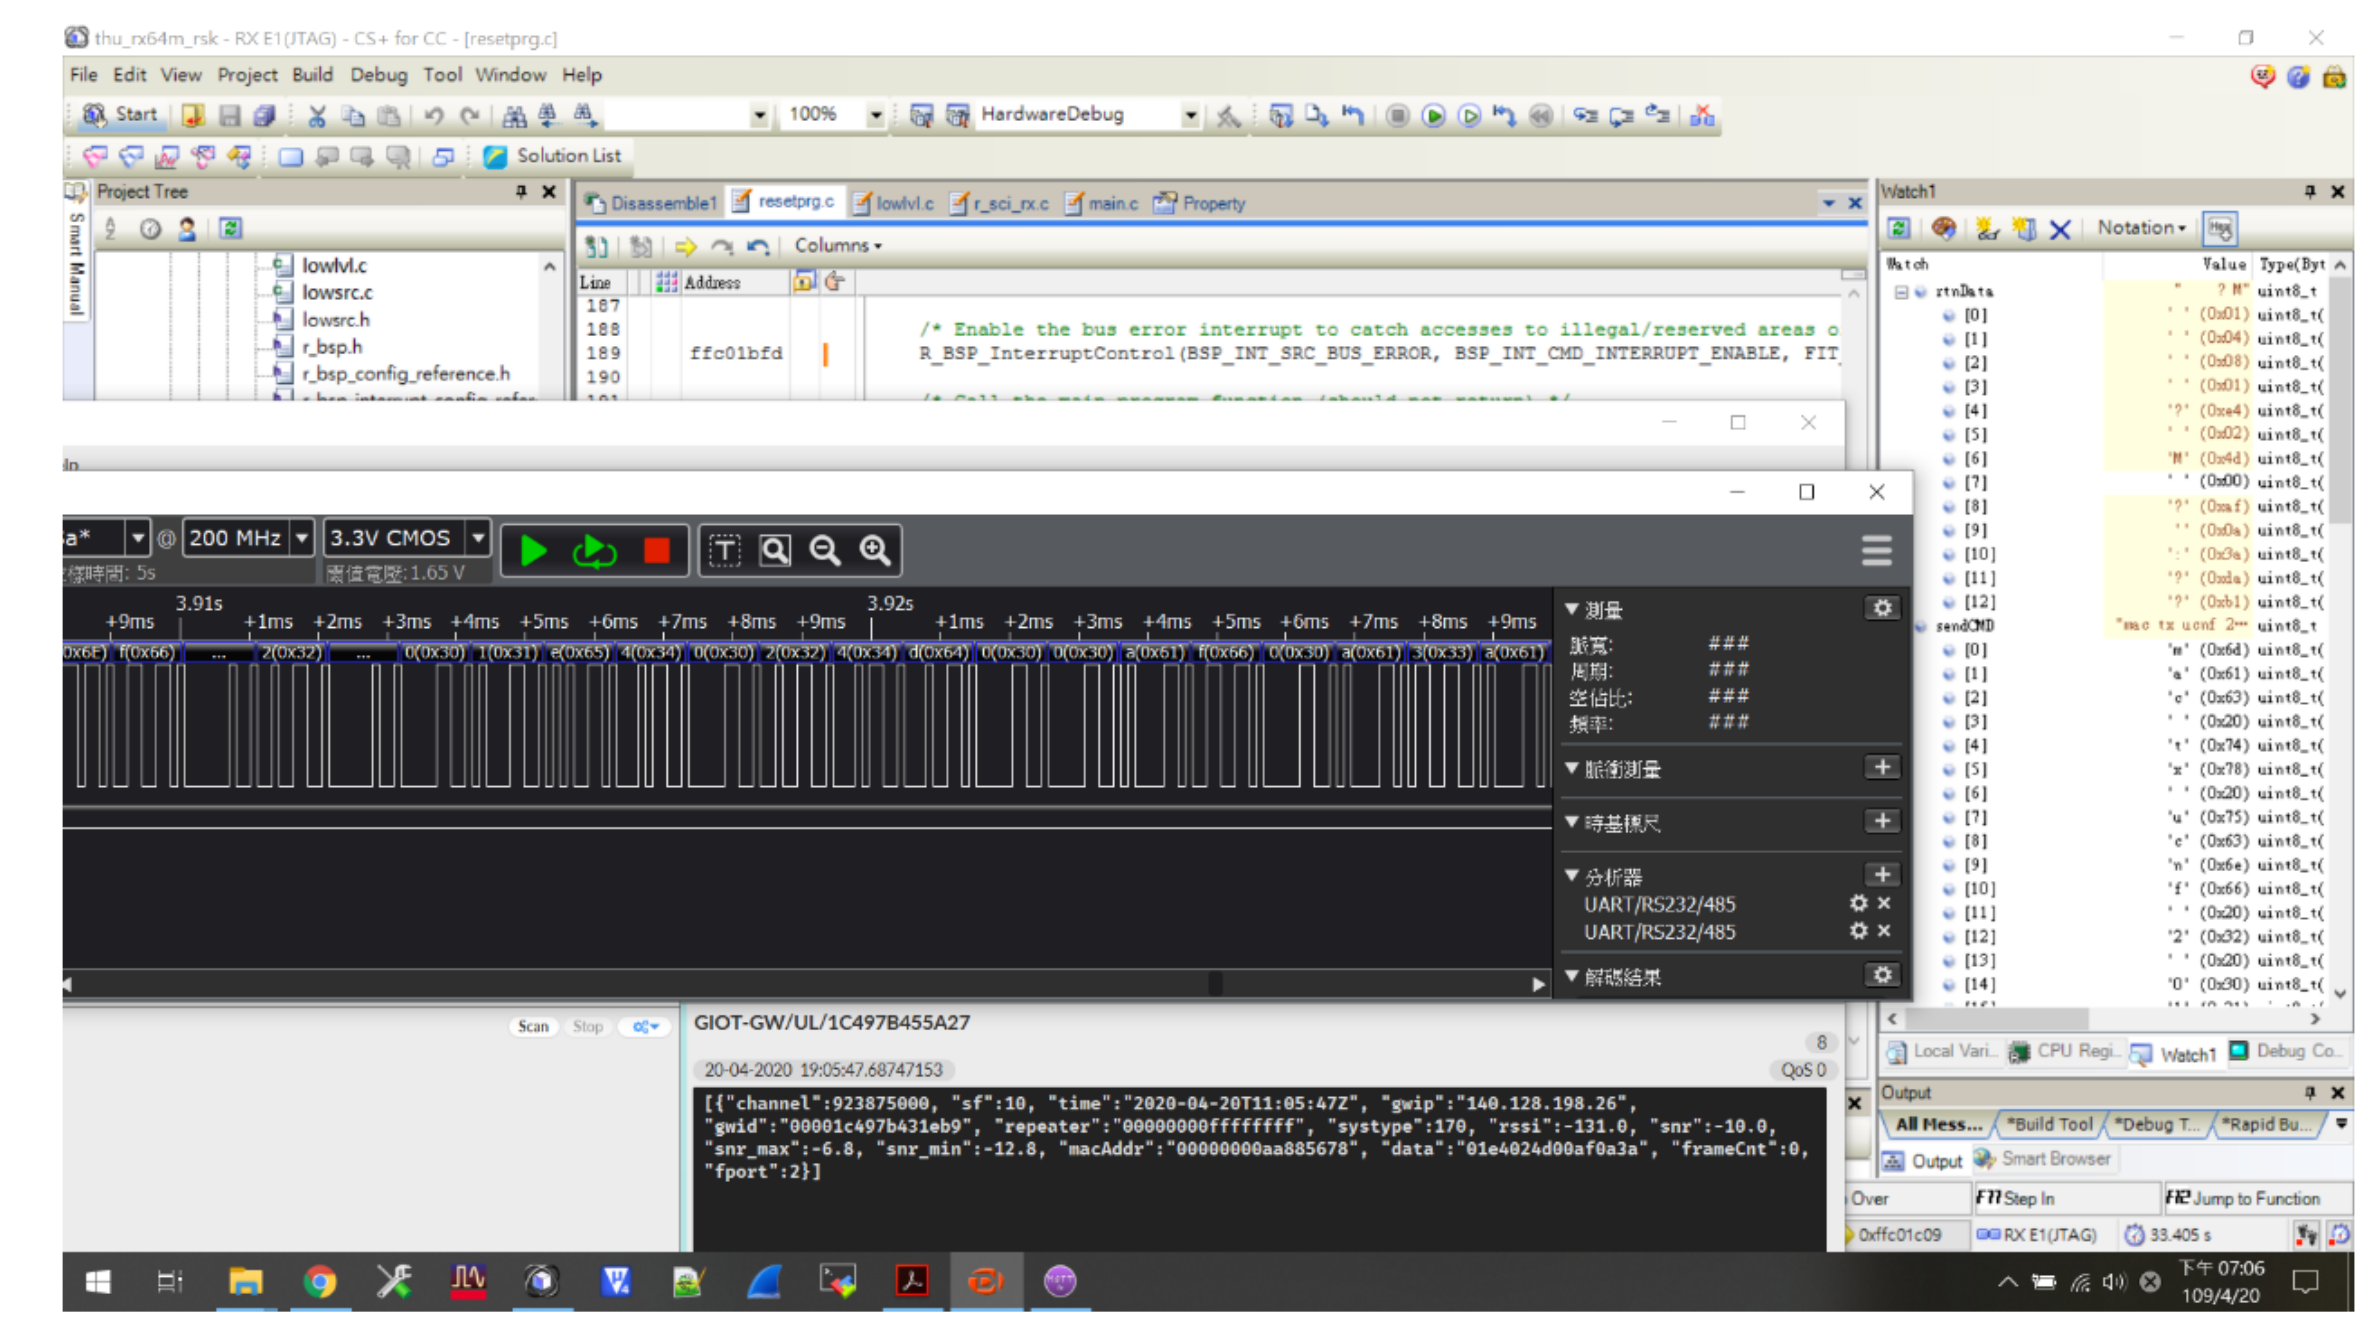
Appendix C. Tests between Water Sensor, Rx64M and LoRa Module of EK-S76SXB

References
- Yang, X.; Wang, S.; Zhang, W.; Zhan, D.; Li, J. The impact of anthropogenic emissions and meteorological conditions on the spatial variation of ambient SO2 concentrations: A panel study of 113 Chinese cities. Sci. Total Environ. 2017, 584–585, 318–328. [Google Scholar] [CrossRef] [PubMed]
- Kristiani, E.; Kuo, T.Y.; Yang, C.T.; Pai, K.C.; Huang, C.Y.; Nguyen, K.L.P. PM2.5 Forecasting Model Using a Combination of Deep Learning and Statistical Feature Selection. IEEE Access 2021, 9, 68573–68582. [Google Scholar] [CrossRef]
- Kristiani, E.; Chen, Y.A.; Yang, C.T.; Huang, C.Y.; Tsan, Y.T.; Chan, W.C. Using deep ensemble for influenza-like illness consultation rate prediction. Future Gener. Comput. Syst. 2021, 117, 369–386. [Google Scholar] [CrossRef]
- Yang, C.T.; Chen, H.W.; Chang, E.J.; Kristiani, E.; Nguyen, K.L.P.; Chang, J.S. Current Advances and Future Challenges of AIoT Applications in Particulate Matters (PM) Monitoring and Control. J. Hazard. Mater. 2021, 126442, 126442. [Google Scholar] [CrossRef] [PubMed]
- Bhardwaj, T.; Reyes, C.; Upadhyay, H.; Sharma, S.C.; Lagos, L. Cloudlet-enabled wireless body area networks (WBANs): A systematic review, architecture, and research directions for QoS improvement. Int. J. Syst. Assur. Eng. Manag. 2021, 1–25. [Google Scholar] [CrossRef]
- Bhardwaj, T.; Sharma, S.C. An autonomic resource provisioning framework for efficient data collection in cloudlet-enabled wireless body area networks: A fuzzy-based proactive approach. Soft Comput. 2019, 23, 10361–10383. [Google Scholar] [CrossRef]
- Alliance, L. LoRaWAN Coverage. Available online: https://lora-alliance.org/lorawan-coverage/ (accessed on 18 February 2022).
- Augustin, A.; Yi, J.; Clausen, T.; Townsley, W.M. A Study of LoRa: Long Range & Low Power Networks for the Internet of Things. Sensors 2016, 16, 1466. [Google Scholar] [CrossRef]
- Kristiani, E.; Yang, C.T.; Huang, C.Y.; Ko, P.C.; Fathoni, H. On Construction of Sensors, Edge, and Cloud (iSEC) Framework for Smart System Integration and Applications. IEEE Internet Things J. 2021, 8, 309–319. [Google Scholar] [CrossRef]
- Mikhaylov, K.; Petaejaejaervi, J.; Haenninen, T. Analysis of capacity and scalability of the LoRa low power wide area network technology. In Proceedings of the European Wireless 2016, 22th European Wireless Conference, Oulu, Finland, 18–20 May 2016; pp. 1–6. [Google Scholar]
- Hernandez, D.; Peralta, G.; Manero, L.; Gomez, R.; Bilbao, J.; Zubia, C. Energy and coverage study of LPWAN schemes for Industry 4.0. In Proceedings of the 2017 IEEE International Workshop of Electronics, Control, Measurement, Signals and Their Application to Mechatronics (ECMSM), Donostia, Spain, 24–26 May 2017; pp. 1–6. [Google Scholar]
- Petrić, T.; Goessens, M.; Nuaymi, L.; Toutain, L.; Pelov, A. Measurements, performance and analysis of LoRa FABIAN, a real-world implementation of LPWAN. In Proceedings of the 2016 IEEE 27th Annual International Symposium on Personal, Indoor, and Mobile Radio Communications (PIMRC), Valencia, Spain, 4–8 September 2016; pp. 1–7. [Google Scholar]
- Zheng, K.; Zhao, S.; Yang, Z.; Xiong, X.; Xiang, W. Design and implementation of LPWA-based air quality monitoring system. IEEE Access 2016, 4, 3238–3245. [Google Scholar] [CrossRef]
- Gokul, V.; Tadepalli, S. Implementation of a WiFi based plug and sense device for dedicated air pollution monitoring using IoT. In Proceedings of the 2016 Online International Conference on Green Engineering and Technologies (IC-GET), Coimbatore, India, 19 November 2016; pp. 1–7. [Google Scholar]
- Kim, D.H.; Lim, J.Y.; Kim, J.D. Low-power, long-range, high-data transmission using Wi-Fi and LoRa. In Proceedings of the 2016 6th International Conference on IT Convergence and Security (ICITCS), Prague, Czech Republic, 26–29 September 2016; pp. 1–3. [Google Scholar]
- Ke, K.H.; Liang, Q.W.; Zeng, G.J.; Lin, J.H.; Lee, H.C. Demo abstract: A LoRa wireless mesh networking module for campus-scale monitoring. In Proceedings of the 2017 16th ACM/IEEE International Conference on Information Processing in Sensor Networks (IPSN), Pittsburgh, PA, USA, 18–21 April 2017; pp. 259–260. [Google Scholar]
- Neumann, P.; Montavont, J.; Noel, T. Indoor deployment of low-power wide area networks (LPWAN): A LoRaWAN case study. In Proceedings of the 2016 IEEE 12th International Conference on Wireless and Mobile Computing, Networking and Communications (WiMob), New York, NY, USA, 17–19 October 2016; pp. 1–8. [Google Scholar]
- Ramachandran, G.S.; Yang, F.; Lawrence, P.; Michiels, S.; Joosen, W.; Hughes, D. μPnP-WAN: Experiences with LoRa and its deployment in DR Congo. In Proceedings of the 2017 9th International Conference on Communication Systems and Networks (COMSNETS), Bengaluru, India, 4–8 January 2017; pp. 63–70. [Google Scholar]
- Werme, M.; Eriksson, T.; Righard, T. Maintenance concept optimization—A new approach to LORA. In Proceedings of the 2017 Annual Reliability and Maintainability Symposium (RAMS), Orlando, FL, USA, 23–26 January 2017; pp. 1–6. [Google Scholar]
- Gregora, L.; Vojtech, L.; Neruda, M. Indoor signal propagation of LoRa technology. In Proceedings of the 2016 17th International Conference on Mechatronics–Mechatronika (ME), Prague, Czech Republic, 7–9 December 2016; pp. 1–4. [Google Scholar]
- Bonetto, R.; Bui, N.; Lakkundi, V.; Olivereau, A.; Serbanati, A.; Rossi, M. Secure communication for smart IoT objects: Protocol stacks, use cases and practical examples. In Proceedings of the 2012 IEEE International Symposium on a World of Wireless, Mobile and Multimedia Networks (WoWMoM), San Francisco, CA, USA, 25–28 June 2012; pp. 1–7. [Google Scholar]
- Bressan, N.; Bazzaco, L.; Bui, N.; Casari, P.; Vangelista, L.; Zorzi, M. The deployment of a smart monitoring system using wireless sensor and actuator networks. In Proceedings of the 2010 First IEEE International Conference on Smart Grid Communications, Gaithersburg, MD, USA, 4–6 October 2010; pp. 49–54. [Google Scholar]
- Petäjäjärvi, J.; Mikhaylov, K.; Hämäläinen, M.; Iinatti, J. Evaluation of LoRa LPWAN technology for remote health and wellbeing monitoring. In Proceedings of the 2016 10th International Symposium on Medical Information and Communication Technology (ISMICT), Worcester, MA, USA, 20–23 March 2016; pp. 1–5. [Google Scholar] [CrossRef]
- Zanella, A.; Bui, N.; Castellani, A.; Vangelista, L.; Zorzi, M. Internet of Things for Smart Cities. IEEE Internet Things J. 2014, 1, 22–32. [Google Scholar] [CrossRef]
- Lauridsen, M.; Vejlgaard, B.; Kovács, I.Z.; Nguyen, H.; Mogensen, P. Interference measurements in the European 868 MHz ISM band with focus on LoRa and SigFox. In Proceedings of the 2017 IEEE Wireless Communications and Networking Conference (WCNC), San Francisco, CA, USA, 19–22 March 2017; pp. 1–6. [Google Scholar]
- Bhardwaj, T.; Sharma, S.C. Cloud-WBAN: An experimental framework for cloud-enabled wireless body area network with efficient virtual resource utilization. Sustain. Comput. Inform. Syst. 2018, 20, 14–33. [Google Scholar] [CrossRef]
- Bhardwaj, T.; Sharma, S.C. Fuzzy logic-based elasticity controller for autonomic resource provisioning in parallel scientific applications: A cloud computing perspective. Comput. Electr. Eng. 2018, 70, 1049–1073. [Google Scholar] [CrossRef]
- Mukta, M.; Islam, S.; Barman, S.D.; Reza, A.W.; Khan, M.S.H. Iot based Smart Water Quality Monitoring System. In Proceedings of the 2019 IEEE 4th International Conference on Computer and Communication Systems (ICCCS), Singapore, 23–25 February 2019; pp. 669–673. [Google Scholar]
- Simitha, K.; Raj, S. IoT and WSN based water quality monitoring system. In Proceedings of the 2019 3rd International conference on Electronics, Communication and Aerospace Technology (ICECA), Coimbatore, India, 12–14 June 2019; pp. 205–210. [Google Scholar]
- Orozco-Lugo, A.G.; McLernon, D.C.; Lara, M.; Zaidi, S.A.R.; González, B.J.; Illescas, O.; Pérez-Macías, C.I.; Nájera-Bello, V.; Balderas, J.A.; Pizano-Escalante, J.L.; et al. Monitoring of water quality in a shrimp farm using a FANET. Internet Things 2020, 18, 100170. [Google Scholar] [CrossRef]
- Gangwani, P.; Perez-Pons, A.; Bhardwaj, T.; Upadhyay, H.; Joshi, S.; Lagos, L. Securing Environmental IoT Data Using Masked Authentication Messaging Protocol in a DAG-Based Blockchain: IOTA Tangle. Future Internet 2021, 13, 312. [Google Scholar] [CrossRef]
- Lee, S.; Yoon, D.; Ghosh, A. Intelligent parking lot application using wireless sensor networks. In Proceedings of the 2008 International Symposium on Collaborative Technologies and Systems, Irvine, CA, USA, 19–23 May 2008; pp. 48–57. [Google Scholar]
- Schaffers, H.; Komninos, N.; Pallot, M.; Trousse, B.; Nilsson, M.; Oliveira, A. Smart cities and the future internet: Towards cooperation frameworks for open innovation. In Future Internet Assembly; Springer: Berlin/Heidelberg, Germany, 2011; pp. 431–446. [Google Scholar]
- Sumaray, A.; Makki, S.K. A comparison of data serialization formats for optimal efficiency on a mobile platform. In Proceedings of the 6th International Conference on Ubiquitous Information Management and Communication, Seoul, Korea, 3–5 January 2012; pp. 1–6. [Google Scholar]
- Pitarma, R.; Marques, G.; Ferreira, B.R. Monitoring Indoor Air Quality for Enhanced Occupational Health. J. Med. Syst. 2017, 41, 1–8. [Google Scholar] [CrossRef] [PubMed]
- Yang, C.T.; Chen, S.T.; Liu, J.C.; Sun, P.L.; Yen, N.Y. On construction of the air pollution monitoring service with a hybrid database converter. Soft Comput. 2019, 24, 7955–7975. [Google Scholar] [CrossRef]
- Yang, C.T.; Chen, S.T.; Den, W.; Wang, Y.T.; Kristiani, E. Implementation of an intelligent indoor environmental monitoring and management system in cloud. Future Gener. Comput. Syst. 2019, 96, 731–749. [Google Scholar] [CrossRef]
- Yang, C.T.; Chen, C.J.; Tsan, Y.T.; Liu, P.Y.; Chan, Y.W.; Chan, W.C. An implementation of real-time air quality and influenza-like illness data storage and processing platform. Comput. Hum. Behav. 2019, 100, 266–274. [Google Scholar] [CrossRef] [PubMed]
- Renesas. High Performance 32-bit Microcontrollers Achieving 4.55CoreMark/MHz (546CoreMark) with RXv2 Core Employed. 2020. Available online: https://www.renesas.com/eu/en/products/microcontrollers-microprocessors/rx-32-bit-performance-efficiency-mcus/rx64m-high-performance-32-bit-microcontrollers-achieving-455/coremarkmhz-546coremark-rxv2-core-employed (accessed on 6 December 2020).
- Knovel. Control Techniques Drives and Controls Handbook (2nd Edition). 2020. Available online: https://app.knovel.com/web/toc.v/cid:kpCTDCHE08/viewerType:toc/root_slug:control-techniques-drives/url_slug:control-techniques-drives/? (accessed on 6 December 2020).
- Klimiashvili, G.; Tapparello, C.; Heinzelman, W. LoRa vs WiFi Ad Hoc: A Performance Analysis and Comparison. In In Proceedings of the 2020 International Conference on Computing, Networking and Communications (ICNC), Big Island, HI, USA, 17–20 February 2020; pp. 654–660. [Google Scholar]


| ID | Name | Quantity |
|---|---|---|
| 1 | LoRa Node | 6 |
| 2 | Arduino UNO | 6 |
| 3 | PMS5003T | 5 |
| 4 | Charge and discharge control board | 5 |
| 5 | Solar panels | 5 |
| 6 | Gateway | 1 |
| 7 | GE T6603-5 CO2 | 1 |
| ID | CPU | RAM | HDD | NIC |
|---|---|---|---|---|
| 1 | AMD Opteron Processor 6172@2.1GHz x24 | 40 GB DDR3 | 1TB | 4 GB Ethernet |
| ID | Location | Description |
|---|---|---|
| A | Technology building | Monitor road air quality |
| B | Library | Monitor the library room learning room air quality |
| C | Language Hall | Monitor air quality on campus |
| D | Restaurant | Monitor the air quality of the sports area on campus |
| E | School gate | Monitor road air quality |
| F | Pasture | Monitor the air quality of industrial areas |
Publisher’s Note: MDPI stays neutral with regard to jurisdictional claims in published maps and institutional affiliations. |
© 2022 by the authors. Licensee MDPI, Basel, Switzerland. This article is an open access article distributed under the terms and conditions of the Creative Commons Attribution (CC BY) license (https://creativecommons.org/licenses/by/4.0/).
Share and Cite
Miao, H.-Y.; Yang, C.-T.; Kristiani, E.; Fathoni, H.; Lin, Y.-S.; Chen, C.-Y. On Construction of a Campus Outdoor Air and Water Quality Monitoring System Using LoRaWAN. Appl. Sci. 2022, 12, 5018. https://doi.org/10.3390/app12105018
Miao H-Y, Yang C-T, Kristiani E, Fathoni H, Lin Y-S, Chen C-Y. On Construction of a Campus Outdoor Air and Water Quality Monitoring System Using LoRaWAN. Applied Sciences. 2022; 12(10):5018. https://doi.org/10.3390/app12105018
Chicago/Turabian StyleMiao, Hsin-Yuan, Chao-Tung Yang, Endah Kristiani, Halim Fathoni, Yu-Sheng Lin, and Chien-Yi Chen. 2022. "On Construction of a Campus Outdoor Air and Water Quality Monitoring System Using LoRaWAN" Applied Sciences 12, no. 10: 5018. https://doi.org/10.3390/app12105018
APA StyleMiao, H.-Y., Yang, C.-T., Kristiani, E., Fathoni, H., Lin, Y.-S., & Chen, C.-Y. (2022). On Construction of a Campus Outdoor Air and Water Quality Monitoring System Using LoRaWAN. Applied Sciences, 12(10), 5018. https://doi.org/10.3390/app12105018