1. Introduction
Magnesium oxychloride cement, also known as MOC or Sorel cement, was discovered in 1867 by Stanislas Sorel [
1] shortly after the discovery of the well-known Portland cement (PC). It can be obtained by mixing magnesium oxide with an aqueous solution of magnesium chloride in a certain ratio. Because MOC is a non-hydraulic binder, it does not need humid curing conditions.
Magnesium oxychloride cements have various superior properties compared to Portland cement. Firstly, the specific density is significantly lower giving the material higher compressive and flexural strengths. Moreover, it has elevated fire resistance [
2], good resistance to abrasions [
3], and low thermal conductivity, and it does not get affected by oils, grease, and paints. These properties are developed in a relatively short curing time, making the material suitable for quick repairs. The lower alkalinity (pH~10) allows the usage of MOC together with glass fibers, preventing the aging process. Moreover, the MOCs are suitable for use with a variety of aggregates [
4,
5] such as tire rubber [
6,
7], fly ash [
8], synthetic resin, and wood particles [
9]. A wide variety of applications for magnesium oxychloride cements were found, primarily as a flooring material for its elastic and acoustic properties, resistance to a charge accumulation, and decorative ivory-like appearance [
10]. Moreover, it was successfully used in fire protective systems [
11], grinding wheels [
12], decorative elements [
13], wall insulation [
14], ship decks, underground armament factories, and bunkers [
15].
Nevertheless, some difficulties were discovered in the use of MOC, especially for outdoor applications or any other applications where water contact is possible. Magnesium oxychloride cements show low water resistance; in fact, with longer exposure to water, the magnesium chloride is leached out from the structure leaving only hydrated brucite (Mg(OH)
2) as the binding phase. The magnesium chloride washed out from the binder is corrosive and can cause severe metal damage [
16]. There are numerous ways of improving the stability of Sorel cement in humid conditions. The most natural one is letting the surface of MOC react with CO
2 from air, forming magnesium chlorocarbonates [
17]. The water resistance can be also improved by a very small amount of additive, e.g., phosphoric acid and soluble phosphates, including ammonium, iron, aluminum, alkali metal, and alkali earth metal phosphates [
18,
19]. By adding the additives listed above, insoluble phosphate complexes are formed, resulting in the cement becoming waterproof [
19]. Another reported way to improve the water resistance property of MOC is the incorporation of fly ash or silica fume into the material [
20,
21].
Four main phases can be identified within the MgO–MgCl
2–H
2O system according to the ratio of the input compounds. Two of the hydrate phases, 3Mg(OH)
2∙MgCl
2∙8H
2O (Phase 3, MOC 3-1-8) and 5Mg(OH)
2∙MgCl
2∙8H
2O (Phase 5, MOC 5-1-8), can be prepared in ambient conditions and remain stable until the reaction with CO
2 or H
2O. These two phases are the fundamental products responsible for the hardness and strength of MOC [
22]. The great mechanical properties are a result of the needle-like structure of both Phase 3 and Phase 5 [
23]. Needles in the structure can be described as scroll-tubular whiskers which interlock in rapid growth, resulting in a very tough structure, which becomes denser due to the needle intergrowth when there is a lack of space for growth [
24]. The remaining two phases, 2Mg(OH)
2∙MgCl
2∙4H
2O (Phase 2, MOC 2-1-4) and 9Mg(OH)
2∙MgCl
2∙5H
2O (Phase 9, MOC 9-1-5), can be prepared and are also stable at a temperature of ~100 °C [
23,
25,
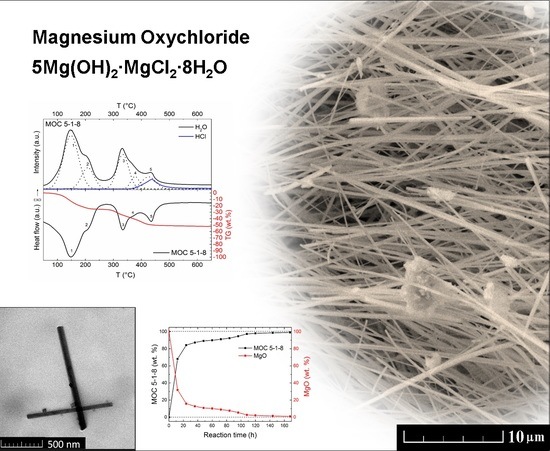
26]. In this contribution, the kinetics of formation and the thermal stability of the phase 5Mg(OH)
2∙MgCl
2∙8H
2O were studied, and novel observations concerning thermal behavior were obtained. In addition, the basic structural and mechanical parameters of MOC 5-1-8 phase were investigated as a function of exposure temperature. In this way, the results of simultaneous thermal analysis were linked with those of obtained from structural and mechanical tests.
2. Materials and Methods
The following chemicals were used for the synthesis: MgCl2∙6H2O (>99%, Penta s r.o., Prague, Czech Republic) and MgO (>98%, Penta s r.o., Prague, Czech Republic). Deionized water (16.8 MΩ) was used for all syntheses.
The stoichiometric ratio 5MgO to MgCl2∙6H2O was used for the synthesis of MOC phase with composition 5Mg(OH)2∙MgCl2∙8H2O (also known as Phase 5, MOC 5-1-8, and Mg3(OH)5Cl∙4H2O). According to the well-established notation, our sample was named MOC 5-1-8. To prepare the desired phase, we dissolved 15.32 g of MgCl2∙6H2O in 9.48 g of deionized water. Next, an amount of 15.18 g of magnesium oxide was added to the solution, and then the suspension was intensively stirred for five minutes. The suspension was then divided into two parts, where one was applied to the X-ray powder diffraction (XRD) holder for the analysis of kinetics of formation, and the other one was poured into a plastic beaker for other analyses.
The following equation (Equation (1)) summarizes the formation of MOC 5-1-8:
Scanning electron microscopy (SEM) was used to study the surface morphology (Tescan MAIA3, TESCAN Brno, s.r.o., Brno, Czech Republic). The elemental composition and mapping were characterized using an energy-dispersive spectroscopy (EDS) analyzer (X-Max150, Oxford Instruments, High Wycombe, UK) with a 20-mm2 SDD (silicon drift detector) detector and AZtecEnergy software (Oxford instruments, HighWycombe, UK). The sample was set on a carbon conductive tape in order to unsure the conductivity of the experiments. For both SEM and SEM-EDS analysis, the electron beam was set to 10 kV with 10-mm working distance.
Simultaneous thermal analysis (STA) was performed using the Setsys Evolution apparatus from Setaram in a temperature range up to 1300 °C. The measurements were performed in a dynamic helium atmosphere with a flow rate of 50 mL/min and a heating rate of 10 °C/min. The mass spectrometer OmniStarTM from Pffeifer Vacuum (Pffeifer Vacuum GmbH, Aßlar, Germany) was used in order to analyze gases that evolved during the heating.
X-ray powder diffraction (XRD) was carried out using a Bruker D2 Phaser, a powder diffractometer with Bragg–Brentano geometry, applying CuKα radiation (λ = 0.15418 nm, U = 30 kV, I = 10 mA) and rotation (five rounds per minute). The step size was set to of 0.02025° (2θ) and the overall data were acquired in the angular range of 5°–80°. The kinetics of formation of MOC 5-1-8 was determined by taking and analyzing a test sample every 12 h for seven days. X’Pert HighScore Plus software (PANalytical, Almelo, Netherlands) was applied to evaluate the obtained data including quantitative phase analysis using Rietveld refinement.
X-ray fluorescence (XRF) was used to determine the chemical composition of the sample with an Axios sequential WD-XRF spectrometer (PANalytical, Almelo, Netherlands) equipped with a Rh anode end-window X-ray tube fitted with a 50-μm beryllium window. To collect the measured data, the software SuperO was used. The sample was pressed (with no binding agents) on a pellet of H3BO3, where the total thickness was ~5 mm, and the diameter was 40 mm.
High-resolution transmission electron microscopy (HR-TEM) was performed using an EFTEM (energy-filtering transmission electron microscop) Jeol 2200 FS microscope (Jeol, Tokyo, Japan). A 200-keV acceleration voltage was used for measurement. Sample preparation was attained by drop-casting the suspension (1 mg/mL in ethanol) on a TEM grid (Cu; 400 mesh; carbon film) which was dried at 30 °C for 2 h.
Fourier-Transform infrared (FT-IR) spectroscopy using a Nicolet 6700 spectrometer (Thermo Fisher Scientific, Waltham, MA, USA) was used to explore the thermal stability of the prepared MOC 5-1-8 phase. Mid-infrared spectra were collected after 32 scans with wave numbers ranging from 7800 to 350 cm−1 and with a spectral resolution of 4 cm−1. Samples in powder form were prepared by homogenization in an agate grinding mortar and analyzed on diamond crystal using the ATR (attenuated total reflection) technique.
In order to support the STA data and assign the observed decomposition processes to the macro and micro parameters of the hardened MOC 5-1-8 phase, measurements of bulk density, specific density, porosity, pore size distribution, water absorption, and compressive strength were conducted for samples heated for 2 h at 150 °C, 250 °C, and 350 °C. For each test, five samples of a particular material were used. Before the thermal exposure, the samples were matured for 96 h in an air-conditioned laboratory at a temperature of 22 ± 2 °C and relative humidity (RH) of 30% ± 5%. The heating temperatures were chosen based on the results of STA. The only effect that was not considered in the testing of residual parameters of MOC 5-1-8 phase after heating was the release of hydrochloric acid at the peak temperature at 435 °C in order to avoid damage of the refractory lining of the testing furnace. For sample heating, an electric testing furnace Ht 60B Svoboda (Světice, Czech Republic) was used. The samples were 40 mm × 40 mm × 160 mm prisms. The bulk density
ρb (kg/m
3) was determined from the sample mass and its dimensions were in accordance with the EN 1015-10 [
27]. The expanded combined uncertainty of the bulk density test was 1.4%. The specific density
ρs (kg/m
3) was assessed using an automated temperature-controlled helium pycnometer Pycnomatic ATC (Thermo Scientific, Milan, Italy). The combined expanded uncertainty of this measurement was 1.2%. From the bulk density and specific density data, the porosity
ψ was calculated as introduced, e.g., in Reference [
28]. The expanded combined uncertainty of the total open porosity test was 1.8%. Water absorption
Wa by the specimens at atmospheric pressure was measured according to the standard EN 13,755 [
29]. The samples were 40-mm cubes cut from the originally casted prisms, and they were immersed in water for 24 h. The expanded combined uncertainty of the water absorption test was 1.2%. Following the European technical standard EN 1015-11 [
30], the compressive strength test was performed. The loading area was 40 mm × 40 mm. The relative expanded uncertainty of the compressive strength
fc (MPa) determination was 1.4%. Pore size distribution was measured using Thermo Scientific Pascal series mercury porosimeters Pascal 140 and Pascal 440 (Thermo Scientific, Milano, Italy). The mass of the specimens was typically 1.0–1.5 g. The following parameters were used in calculation of pore size distribution: Hg density = 13.5414 g/cm
3 at 22 °C, capillary radius = 1.5 mm, Hg contact angle = 130°, Hg surface tension 480 dyne/cm. Two specimens were tested for each tested material.
The propagation of cracks was well documented by an optical digital microscope Dino-Lite with a resolution of 5 Mpx (AnMo Electronics Corporation, Hsinch, Taiwan).
3. Results and Discussion
At the beginning, the kinetics of formation of MOC 5-1-8 was determined using the XRD analysis on the test samples taken every 12 h for seven days (see
Figure 1). The first measurement showed that only MgO (ICDD 01-075-0447) was present in the sample because of its insolubility in water, whereas magnesium chloride was completely dissolved. The reflections of MgO were found at 2
θ = 42.9 (reflection 400) and at 2
θ = 62.2 (reflection 440). The formation of Phase 5 (ICDD 00-007-0420) occurred rapidly; after 12 h, almost 69% of MgO already reacted. The strongest reflection (100) of MOC 5-1-8 was detected at 2
θ = 12.0.
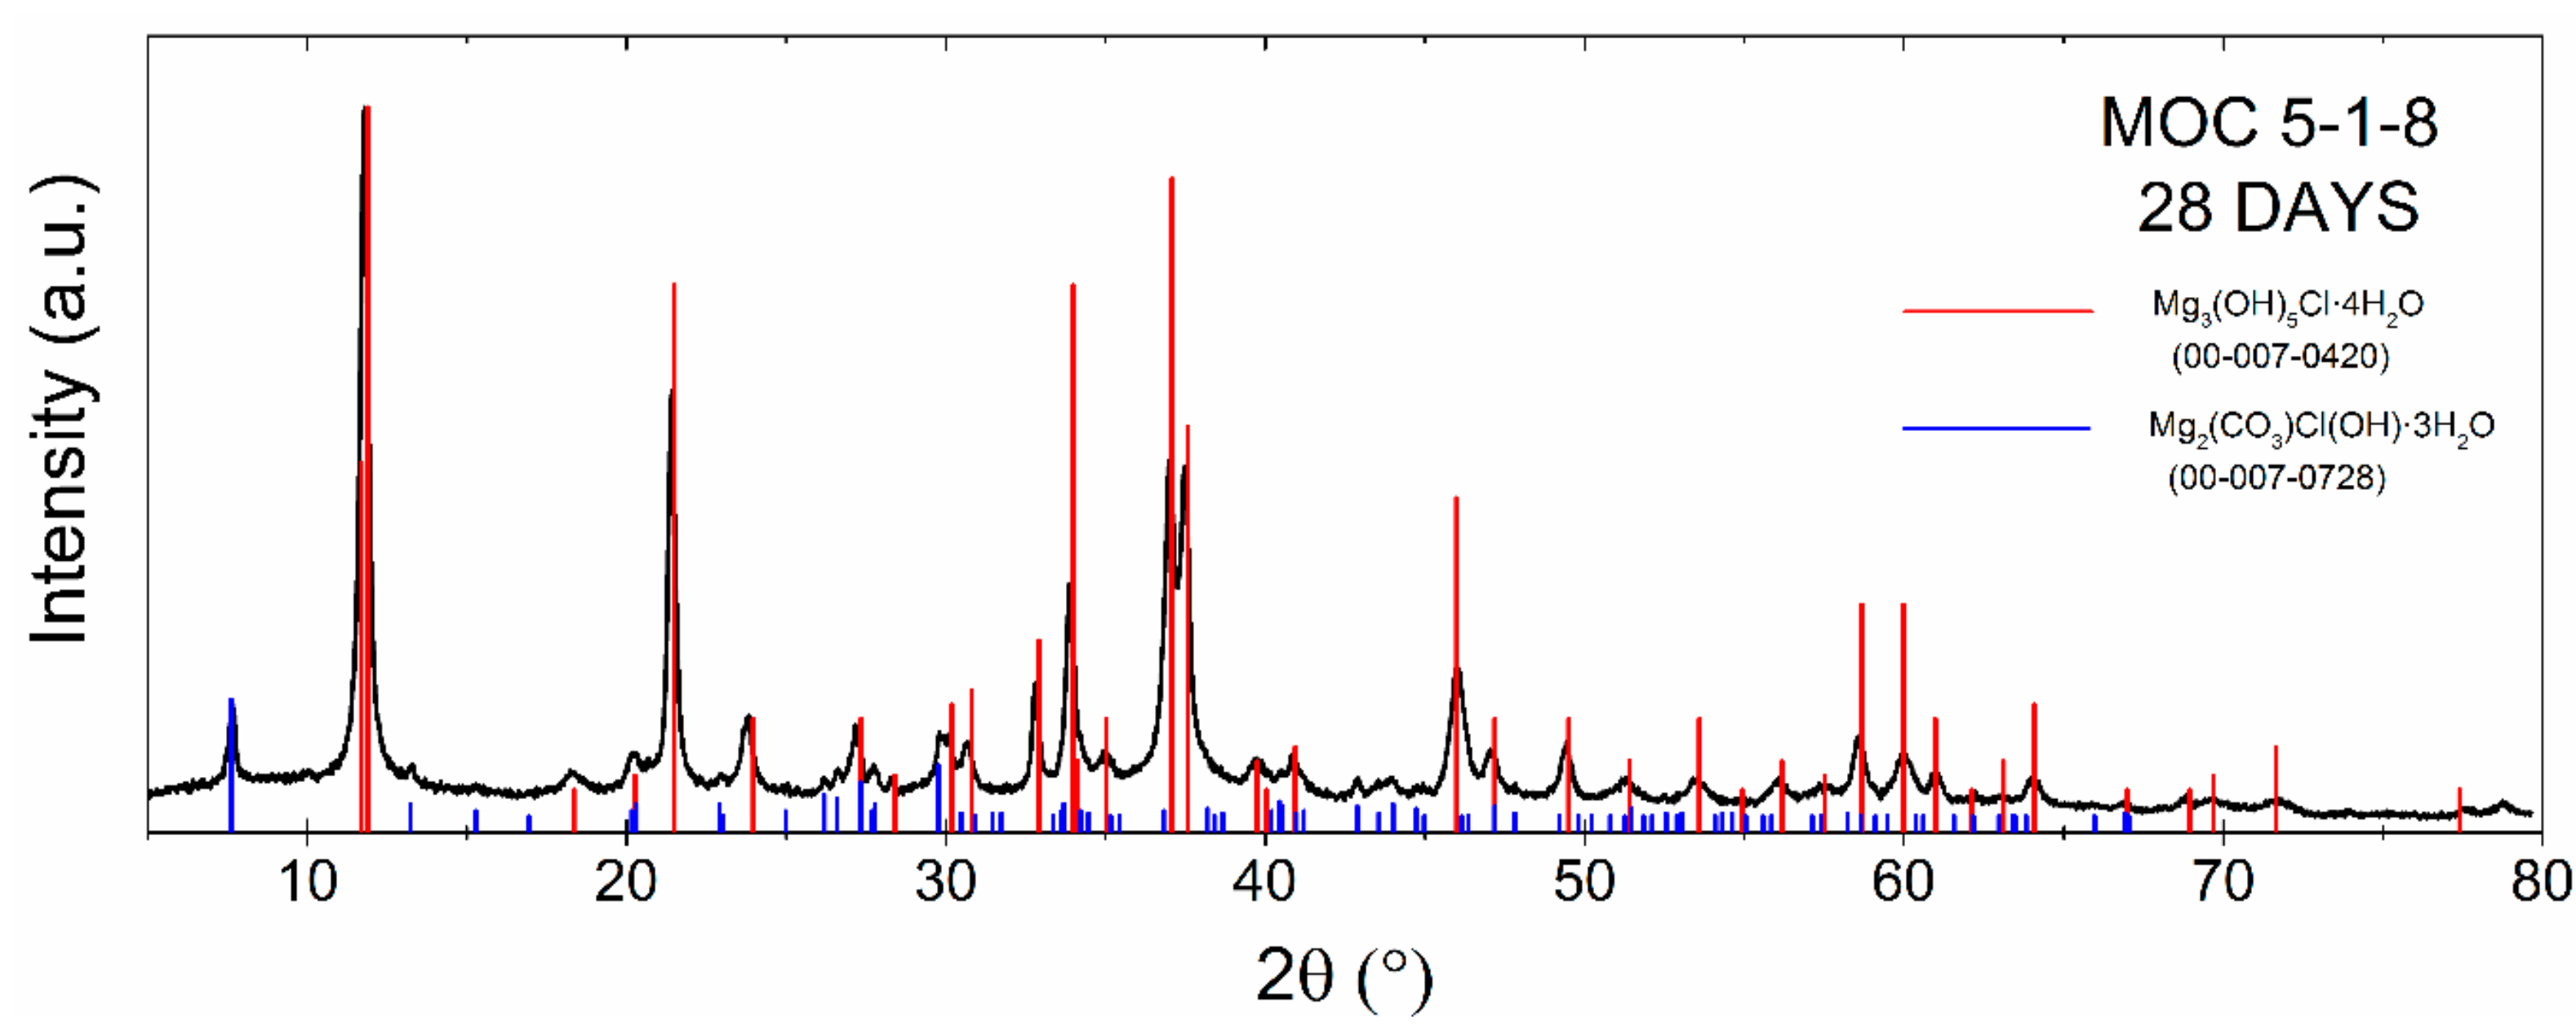
Figure 2 demonstrates a gradual decrease in MgO amount with increasing time, while the amount of phase MOC 5-1-8 increased. After 48 h, 89% of phase 5 was present in the sample. After 96 h, less than 5% MgO remained unreacted. Moreover, the sample was also subjected to phase analysis after 28 days, revealing the majority phase MOC 5-1-8 with a low amount of magnesium carbonate (2
θ = 7.8 for reflection 110; see
Figure 3). The presence of carbonate can be explained in terms of the MOC 5-1-8 surface reaction with CO
2 in air, resulting in a thin surface layer of this impurity phase.
The morphology and the chemical composition of the sample were characterized using SEM and EDS after 28 days. The typical needle-like crystalline structure of Phase 5 was observed by SEM at high magnification (see
Figure 4). The needles were 1–2 μm long and approximately 0.5 μm wide. For a detailed description of Phase 5 needles, TEM was used (see below). It is apparent from the SEM micrographs that this structure is very compact, which is further supported by the lack of defects detected in the sample. High purity of this sample was confirmed by EDS where only magnesium (29.9 wt. %), oxygen (46.5 wt. %), chlorine (14.2 wt. %), and carbon (9.3 wt. %) were detected. Carbon was present due to the reaction of Phase 5 with CO
2 forming magnesium carbonate. Moreover, the chemical composition was also determined by XRF, where 22.3 wt. % magnesium, 23.0 wt. % chlorine and 54.6 wt. % light elements (hydrogen, oxygen, and carbon) were detected. Impurities like sulfur and calcium were observed in very low amounts (lower than 0.05 wt. %).
Transmission electron microscopy was employed in order to determine the morphology of the selected needles that were seen in SEM micrographs. TEM confirmed the needle-like structure of MOC 5-1-8; the typical length of individual needles was 1–3 μm and the width was 50–150 nm (see
Figure 5).
Furthermore, we tested the reference sample and samples after thermal exposure in order to analyze the thermal stability of MOC 5-1-8 phase. The collected FT-IR spectra are presented in
Figure 6, and assignments of the major absorption bands of reference sample are summarized in
Table 1. It can be seen that the tested magnesium oxychloride cement phase 5-1-8 contains the bands from the fundamental vibrations of structural H
2O and the lattice vibrations of MgCl
2 and Mg(OH)
2. The absorption bands between 3700 and 3300 cm
−1 were assigned to the stretching modes of O–H bonds in hydroxyl groups and in water. The water release is clearly visible on the bands in the range of 2000–3700 cm
−1, which were contributed by the symmetric and asymmetric stretching mode of O–H bonds in H
2O and Mg(OH)
2 [
31] after thermal exposure. The band intensities at 3375, 1646, 1608, and 1157 cm
−1 were smaller and, finally, in the case of sample MOC 350, the band assignments to the stretching modes of H–O–H in H
2O were missing. The series of modes in the range of 1000–400 cm
−1 resulted from the lattice translation modes (Mg-OH) and vibrational modes of Mg–O/Mg
2+ and O/O–Mg–O/O–Mg
2+–O bonds [
32]. Lattice vibration modes of Mg–O/Mg–Cl bonds can be observed around 500 cm
−1.
Simultaneous thermal analysis combined with mass spectroscopy (STA–MS) was used to analyze the thermal stability of the material under study (see
Figure 7). The sample was gradually decomposed, and the final products were magnesium oxide, water, and hydrochloric acid, where H
2O and HCl molecules were released in a gaseous form. According to the heat flow signal, five main endothermic effects accompanied by weight loss (seen on thermogravimetric curve) were detected.
The first endothermic effect with a maximum at 145 °C was attributed to the release of six molecules of water. This process was also confirmed by MS and TG curves (Equation (2)).
The second effect (maximum at 205 °C) can be attributed to the release of two water molecules.
The third effect (maximum at 335 °C) can be attributed to the release of two water molecules.
The fourth effect (maximum at 370 °C) can be attributed to the release of one water molecule.
The last effect (maximum at 435 °C) can be attributed to two simultaneous effects, where one water molecule and two hydrochloric acids were released.
Let us note that the ratio of the released molecules of water in the overlapping peaks was determined by peak deconvolution. The final ratio of the individual steps was evaluated according to the ratio of surface areas of the deconvoluted peaks, as well as with regard to the TG curves. According to the literature, the mechanism for the last step of decomposition was described differently. Cole et al. [
17] reported that only hydrochloric acid is released; however, we clearly proved using MS that water is also released in this step.
The residual structural parameters of MOC 5-1-8 phase samples exposed to selected elevated temperatures are summarized in
Table 2, together with the water absorption and compressive strength data. The obtained data represent an average from five measured specimens. For comparison, the reference data obtained for samples cured at a laboratory temperature of 22 ± 2 °C are also given. These samples were labeled MOC 20. Symbols MOC 150, MOC 250, and MOC 350 stand for MOC samples heated for 2 h at 150 °C, 250 °C, and 350 °C, respectively.
The compressive strength of the reference material was similar for samples cured for 96 h to the 28-day compressive strength of Portland cement paste made of CEM I 42.5 and a water/cement ratio of 0.5 [
33]. As reported by Rahhal et al., the 28-day compressive strength of CEM 32.5 is ~48 MPa, which is significantly lower than that measured for MOC 20 and MOC 150 samples and similar to the strength of MOC 250. In the measurement of water absorption, MOC 20 samples dissolved in water. Due to that, the moisture content of specimens was not possible to measure. On the other hand, the heating of MOC samples at elevated temperatures increased the durability of these materials against disruptive moisture effects. In comparison with the reference samples (MOC 20), the release of six molecules of water at 145 °C led to a decrease in bulk density (7.8%) due to the water evaporation, an increase in specific density (5.2%) as a result of material shrinkage, and an increase in porosity of MOC 150 samples, which was 96.5% and corresponded to high water absorption. Surprisingly, the compressive strength remained almost unaffected by the material structural changes. The heating to 250 °C led to the loss of two other water molecules, which resulted in a significant drop in bulk density (25.4%), an increase in porosity (284%), and a loss of compressive strength (11.3%) of MOC 250 samples compared to the reference material. The water absorption of MOC 250 samples was high and was in agreement with the increased porosity. Although the structural changes were significant, the mechanical strength of MOC 250 samples was considered as good in general. On the other hand, samples exposed at 350 °C exhibited a significant drop in the compressive strength (78.9%) compared to the unheated samples. This was in agreement with the decrease in bulk density (35.5%) and increase in porosity (386%). The water absorption was about 41% higher compared to that measured for MOC 250.
The temperature-dependent compressive strength and porosity data are graphed for clarity in
Figure 8. Based on the plotted compressive strength and porosity curves, the critical temperature for the studied MOC 5-1-8 phase was identified at 250 °C. A higher temperature of exposure led to a significant drop in the compressive strength.
The pores size distribution is presented in
Figure 9 and summarized in
Table 3. The total open porosity measured by mercury intrusion porosimetry (MIP) (
ψMIP) was 12.7%, 22.3%, 43.5%, and 54.1% for MOC 20, MOC 150, MOC 250, and MOC 350, respectively. Taking into account the mass of analyzed specimens which was about 1.0–1.5 g, the porosity data measured by MIP were in quantitative agreement with those assessed from the bulk density and specific density measurements. Both average pore diameter and threshold pore diameter significantly increased with the increased temperature of exposure, which clearly documented an opening of the pore structure of the investigated MOC samples due to the elevated temperature effect. The measured pore size distribution was classified according to the IUPAC (International Union of Pure and Applied Chemistry) classification of pore size [
34]. IUPAC classifies pores as macro-pores (large capillaries > 0.05 μm), meso-pores (medium capillaries 0.05–0.002 μm), and micro-pores (small capillaries, fine pores < 0.002 μm). In our case, the pore size ranged from 0.0042 μm to 87.6 μm. The micro-pores were not identified, as the size of these pores was out of the measuring range of the Pascal 440 apparatus, which is able to detect a minimum pore size of 0.0036 μm. The temperature decomposition led to a notable increase in pore size. In MOC 20, most of the identified pores were in the meso-pore range. In MOC 150, meso-pores also prevailed, while, in MOC 250 and MOC 350, an increase in volume of macro-pores was observed, which was in a good agreement with the porosity data and loss of mechanical strength.
The loss of integrity of the studied MOC phase by the water release is well documented in
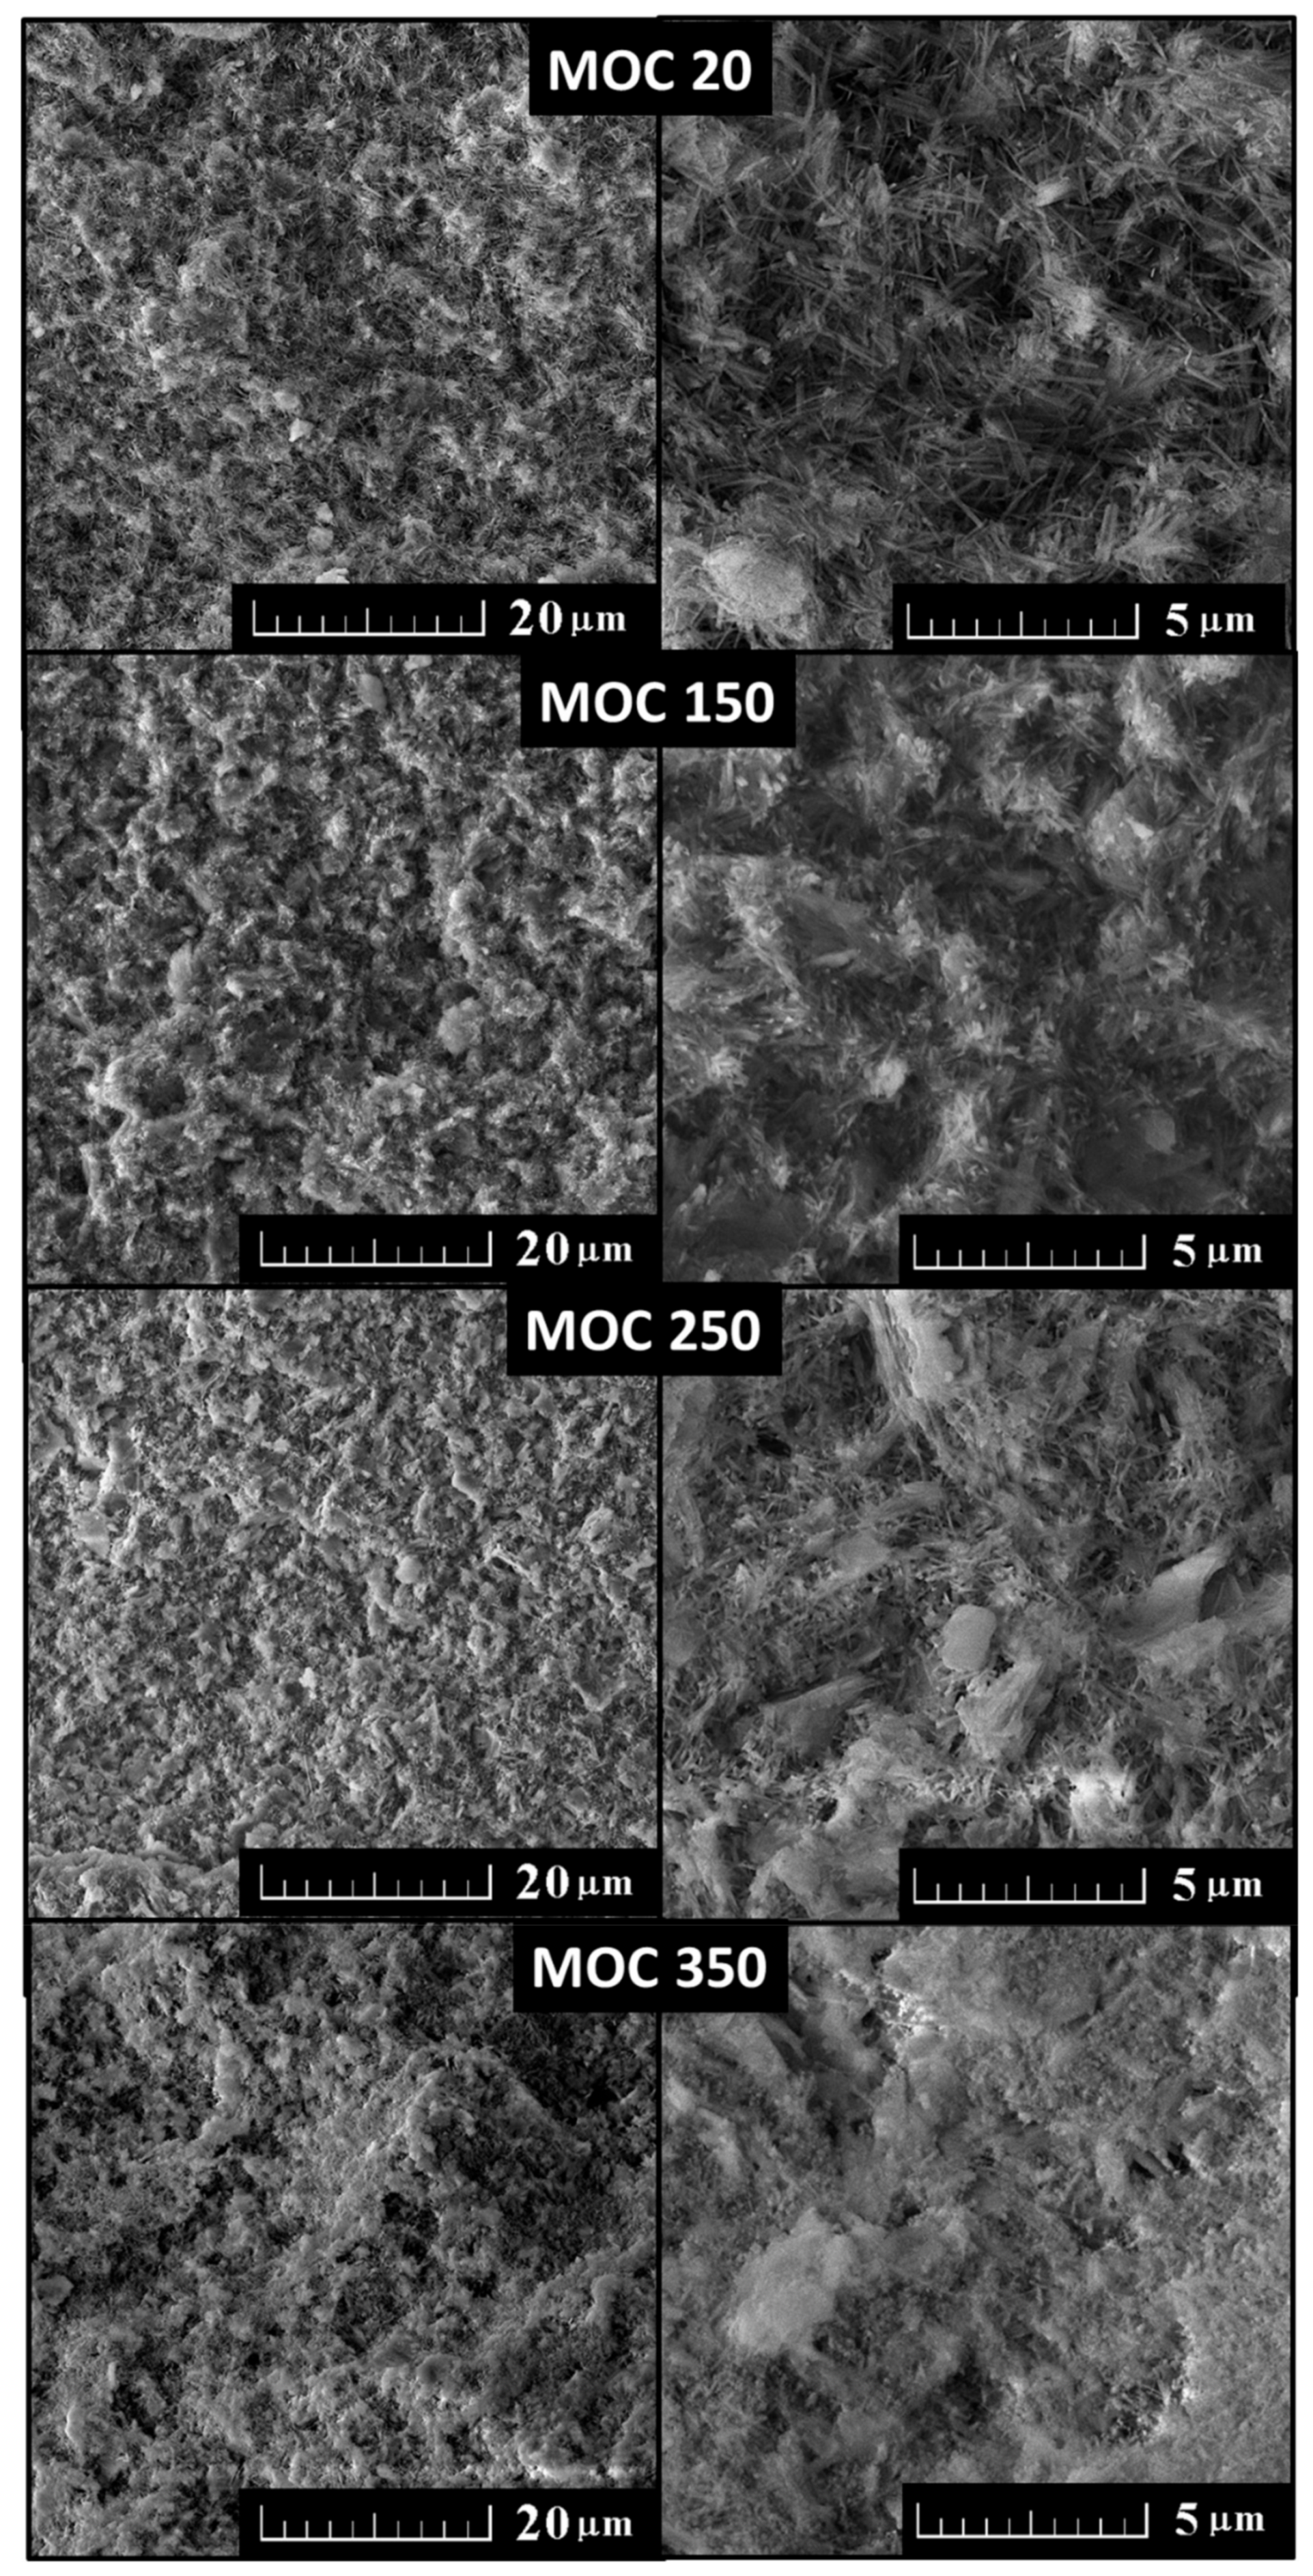
Figure 10. The MOC 150 sample remained almost unaffected by water loss, which was in agreement with the structural and mechanical parameter data. After exposure at 250 °C, the sample was broken into two parts. However, in both formed parts, no visible cracks and other deterioration were detected. By contrast, the MOC 350 sample was substantially cracked and damaged. These cracks were formed due to the water release and water vapor transport during heating. A closer look at the microstructure using SEM (
Figure 11) showed no visible microdefects. All micrographs are quite similar, where only the amount of needle-like grains (Phase 5) decreased with increasing temperature due to thermal degradation of MOC.
4. Conclusions
Throughout the world, concrete and cement-based composites are the most widespread materials for the building industry. With respect to sustainable development principles and the sustainability of materials for construction use, low-energy and low-carbon alternatives to Portland cement are being investigated. As MOC cements possess various superior properties to Portland cement, the kinetics of formation, thermal stability, and properties of MOC were the subject of our investigation in order to get detailed information for the design and development of advanced types of composite materials based on MOC comprising selected additives and admixtures for improvement of their specific functional properties. As only two hydrate phases of MOC can be prepared in ambient conditions and remain stable, which are crucial parameters for the casting of construction materials, MOC 5-1-8 phase (Phase 5) was examined.
The XRD measurements showed rapid formation of MOC 5-1-8 phase, which was almost completed after 96 h. This finding is promising for both in situ mixing of MOC 5-1-8-based materials and prefabrication of specific construction elements. The rapid formation of the MOC solid and dense structure and, thus, rapid achievement of mechanical strength compared to the much slower setting and hardening of Portland cement-based products is one of the favorable MOC properties which can be beneficially used in several practical applications, such as in flooring systems, rapid repairs, etc. Based on SEM and TEM data, the needle-like crystalline structure of Phase 5 was observed and it was obvious that this structure is highly compact and solid. This was confirmed by compressive strength measurement, which was ~55 MPa for the reference MOC 5-1-8 sample. This four-day compressive strength was similar to the 28-day compressive strength of Portland cement.
The thermal stability of Phase 5 is low, which was well documented by STA–MS analysis. All the observed disruptive processes induced by elevated temperatures were completed at temperatures lower than 470 °C. In the last step of the decomposition, we proved using MS, contrary to previously published works, that both hydrochloric acid and water were released. The thermal decomposition led to a significant increase in pore size, a reduction in bulk density, greater water absorption, and a drop in mechanical strength. Surprisingly, the exposure to elevated temperatures increased the durability of MOC 5-1-8 phase against water.

 ,
, 


