Article

A Novel Ensemble Framework Based on K-Means and Resampling for Imbalanced Data

1
School of Information Science and Engineering, Shandong Normal University, Jinan 250358, China
2
Basic education Department, Shandong Police College, Jinan 250014, China
*
Author to whom correspondence should be addressed.
Appl. Sci. 2020, 10(5), 1684; https://doi.org/10.3390/app10051684
Submission received: 30 November 2019 / Revised: 25 February 2020 / Accepted: 26 February 2020 / Published: 2 March 2020

Abstract

:
Imbalanced classification is one of the most important problems of machine learning and data mining, existing in many real datasets. In the past, many basic classifiers such as SVM, KNN, and so on have been used for imbalanced datasets in which the number of one sample is larger than that of another, but the classification effect is not ideal. Some data preprocessing methods have been proposed to reduce the imbalance ratio of data sets and combine with the basic classifiers to get better performance. In order to improve the whole classification accuracy, we propose a novel classifier ensemble framework based on K-means and resampling technique (EKR). First, we divide the data samples in the majority class into several sub-clusters using K-means, k-value is determined by Average Silhouette Coefficient, and then adjust the number of data samples of each sub-cluster to be the same as that of the minority classes through resampling technology, after that each adjusted sub-cluster and the minority class are combined into several balanced subsets, the base classifier is trained on each balanced subset separately, and finally integrated into a strong ensemble classifier. In this paper, the extensive experimental results on 16 imbalanced datasets demonstrate the effectiveness and feasibility of the proposed algorithm in terms of multiple evaluation criteria, and EKR can achieve better performance when compared with several classical imbalanced classification algorithms using different data preprocessing methods.

1. Introduction

Imbalanced classification is a research hotspot in the field of pattern recognition, machine learning and data mining in recent years [1], which has attracted widespread attention of many researchers. For binary classification, imbalanced datasets contain two classes of data samples, one of which has a large number of data samples, called majority class or negative class, while another class has a small number of data samples, called minority class or positive class. Class imbalance is closely related to the production and life of people, which exists in practical applications, such as disease diagnosis detection [2,3], Internet intrusion detection [4], fraud detection [5], and so on. In order to improve the overall classification accuracy, when dealing with imbalanced data, traditional base classifiers such as support vector machine, Naïve Bayes, and K-nearest neighbor will ignore the impact of the minority class so that they cannot be separated correctly, but the minority class is more important than the majority class because it contains more useful information. Hence, this problem is mainly solved from two aspects: data-level and algorithm-level.
Data-level ways basically use resampling strategy [6] for data preprocessing. The most common methods of resampling are oversampling and undersampling. Oversampling refers to increasing the number of data samples in the minority class to balance data, while undersampling means decreasing the number of data samples in the majority class. Sometimes the resampling methods will be combined with clustering strategy. Algorithm-level methods mainly include proposing a novel algorithm or improving proposed algorithms without changing datasets. Two of the most popular schemes are cost-sensitive model [7] and ensemble learning [8]. Traditional classification models assume that all misclassifications have the same cost, while cost-sensitive model assumes that different costs should be distributed to different classification models and data samples. The idea of ensemble learning is to combine several weak classifiers to get a better and more comprehensive ensemble classifier. Research suggests that the effect of ensemble learning is better than that of single classifier.
In many real imbalanced datasets, there are three characteristics including class overlap, small disjuncts and data skew distribution [9]. Class overlap means that data samples of two classes have similar attributes and overlap in a feature space, which can easily lead to misclassification. Small disjuncts is defined that the minority class is divided into several sub-concepts, each of which contains only a few data samples and they are distributed in different sub-regions of feature space. Data skew distribution means that the number of data samples varies greatly between the majority and minority classes. The imbalance ratio (IR) between the two classes can reach 1:100 or even larger, it will bring more difficulties and challenges to the research of classification problems undoubtedly, therefore, the imbalance ratio is a very important factor affecting the classification effect.
To decrease the imbalance ratio, this paper proposes a novel ensemble framework based on K-means and resampling technique (EKR). Because of the number of data samples in minority class is less, EKR only clusters the majority class into k sub-clusters. We use K-means [10,11,12,13,14] as the clustering algorithm and combine k sub-clusters with the minority class into k subsets separately. Then, if the number of data samples in sub-cluster is larger than that in the minority class, undersampling the sub-clusters so that the number is same as that in minority class. On the contrary, if the number of data samples in sub-cluster is smaller than that in the minority class, over-sampling the sub-cluster. Finally, each sub-cluster after resampling and the minority class are changed into several balanced subsets, base classifiers are trained on each balanced subset separately and integrated into a strong ensemble classifier. We have done a lot of experiments to prove the effectiveness of the proposed algorithm.
The contribution of this paper is mainly reflected in two aspects. First, we use K-means clustering algorithm and calculate the best k-value based on the Average Silhouette Coefficient before clustering. Because of the same k-value is not suitable for all datasets, we analyze each dataset to determine the best k-value for each dataset. Second, we propose a novel ensemble framework which uses clustering and resampling only for the majority class and retains all information of the minority class for the following training.
The remainder of this paper is organized as follows: Section 2 introduces related work and previous imbalanced classification methods have been done. In Section 3, we detailly describe the proposed EKR approach. The datasets used and the experimental results are analyzed and discussed in Section 4. Finally, Section 5 draws a conclusion.

2. Related Works

Over the years, the research on imbalanced classification mainly focuses on data resampling and ensemble learning. Data resampling belongs to data-level method, which consists of balancing the original datasets and using oversampling or undersampling strategy to reduce the imbalance ratio. Oversampling refers to generate minority class samples artificially to maintain data balance. The most well-known oversampling method is synthetic minority oversampling technique (SMOTE) proposed by Chawla et al. [15]. The main idea of SMOTE [15,16,17,18,19] is to identify k minority class neighbors close to each minority class sample, then randomly select a point between the sample and its neighbors as the synthetic sample. But SMOTE produces new samples with certain blindness and may make class overlapping more serious. After that, researchers combined many methods with SMOTE to improve the performance of the algorithm, such as Borderline-SMOTE [17] and so on. ADASYN (adaptive synthetic sampling) [18] is also an effective oversampling method, which is characterized by using a mechanism to automatically determine the number of synthetic samples needed for each minority sample, rather than synthesizing the same number of samples for each minority sample like SMOTE. Therefore, ADASYN is used as the oversampling method in this paper. Undersampling [12,13] maintains data balance by deleting the majority samples, such as RUS (Random Undersampling). The main idea of RUS is to randomly remove some samples from the majority samples, and then constitute a new training set with minority samples, but it is easy to lose important information in the data.
Clustering is a kind of unsupervised learning, which is used to process data by many researchers [10,11,12,13,14]. Ahmad et al. [10] proposed a clustering algorithm based on K-means paradigm, which is suitable for data with mixed numeric and categorical features. The combination of clustering and resampling [12,13,14,15] tends to produce better results. CBU (Clustering-based Undersampling) proposed by Lin et al. [12] combines K-means and undersampling strategy, K-means only clusters the majority class and the number of clusters is same as that of the minority samples, and then CBU uses the nearest neighbor of each cluster center to represent the whole cluster and combines them with the minority samples to form a balanced training set. Although it improves the classification results effectively, it may still ignore some information of the majority class because it only selects one sample of each cluster. In this paper, EKR is an improvement based on CBU and gets better performance than CBU.
Ensemble learning is one of the most popular methods at present. It has near-optimal classification methods for any problem, and it can achieve better generalization performance than a single classifier by training multiple individual classifiers and combining them together [8,20,21,22,23,24,25,26,27,28,29,30,31,32]. There are two main approaches of ensemble learning: Bagging and Boosting. Hamid et al. [22] proposed a novel classifier ensemble framework, named CSBC (classifier selection based on clustering), CSBC uses Bagging to produce base classifiers and partitions them by using a clustering algorithm. Then CSBC produces a final ensemble by selecting one classifier from each cluster. Minaei-Bidgoli [23] proposed an ensemble-based approach for feature selection in order to overcome the problem of parameter sensitivity of feature selection approaches. In many cases, it is better to combine resampling with ensemble learning [26,27,28,29,30,31,32]. Kang et al. [26] proposed EUS (ensemble undersampling), which selects the same number of samples from the majority class as the minority class to form several balanced subsets, and trains SVM-based classifiers for each subset to overcome the problem of information loss in undersampling to a certain extent. UnderBagging [29] is a combination of random undersampling and a bagging process, the majority class is undersampled and a balanced training set is used to construct a bagging-based ensemble. UnderBagging reduces the imbalance ratio effectively but random undersampling may select noise samples that are unfavorable for classification. SMOTEBagging [30] combines SMOTE with bagging-based ensemble classifiers. Different from SMOTEBagging, SMOTEBoost [31] uses AdaBoost instead of bagging algorithm, which makes the classifier pay more attention to the minority samples that are hard to distinguish. RUSBoost [32] proposed by Seiffert et al. is based on the SMOTEBoost algorithm, which uses random undersampling for the majority class to balance the dataset. In the training phase, boosting algorithm removes data samples from the majority class in each iteration, but need not to assign new weights to the data samples.
Although researchers have proposed a lot of algorithms and models using resampling and ensemble learning, the oversampling and undersampling used in the algorithm are random so that increasing or removing samples have certain blindness and randomness. Generating a large number of minority samples will lead to overfitting problem, and randomly deleting majority samples will easily lose important data information. Therefore, EKR algorithm is proposed in this paper, in which the majority samples will be oversampled or undersampled according to the distribution of the minority samples. The resampling method used in this paper is not random, but after the K-means clustering for the majority class, utilizing the similarity of samples in sub-clusters and the separability of samples between sub-clusters to select the most representative samples and combining it with the minority samples to form a balanced subset, this way not only avoids the blindness of random undersampling but also reduces the influence of imbalance ratio on classification.

3. The Proposed Approach EKR

In this section, we divide EKR into three parts to introduce step by step. First, K-means clustering and the determination of k-value are given in Section 3.1. Section 3.2 introduces resampling strategy for sub-clusters after clustering. In Section 3.3, we describe the procedure of the proposed EKR in detail.
In this paper, for the sake of easy understanding, we call the majority class the negative class, whereas the minority class is called the positive class. Training set is presented by T and the number of its samples is N. T N and T P are samples of the negative and positive classes respectively, where   T N T P = T , N N and N P represent the number of the negative and positive classes.

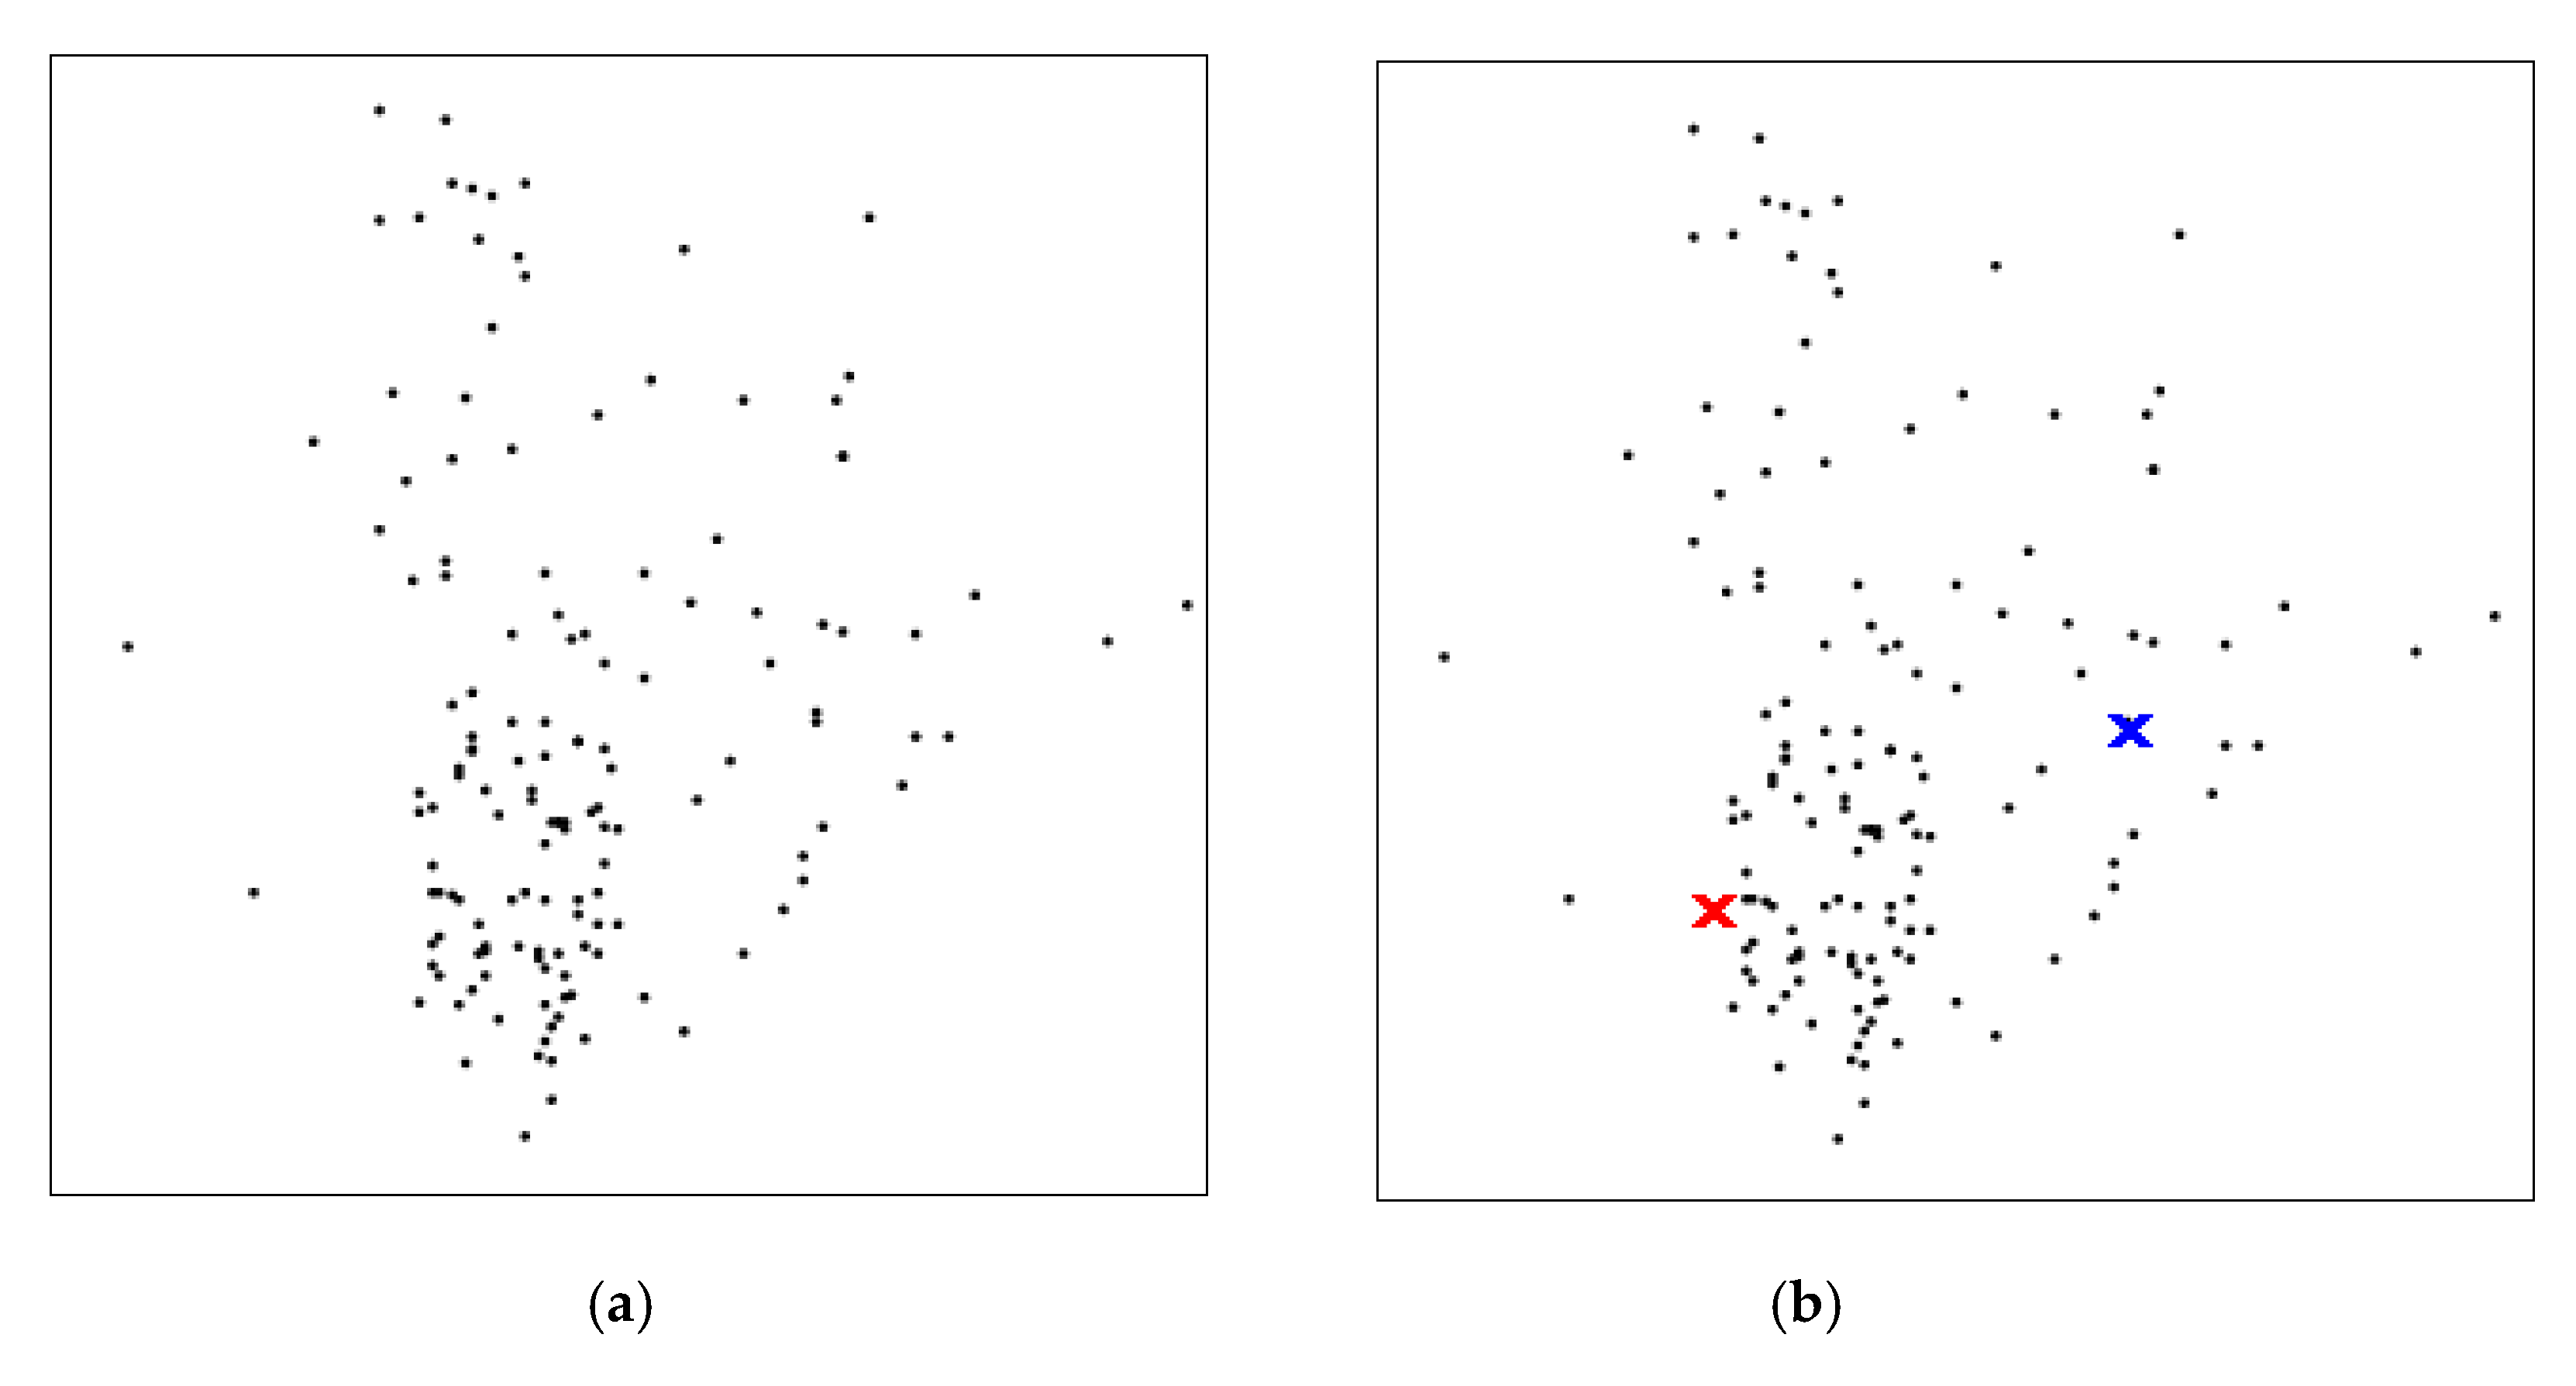
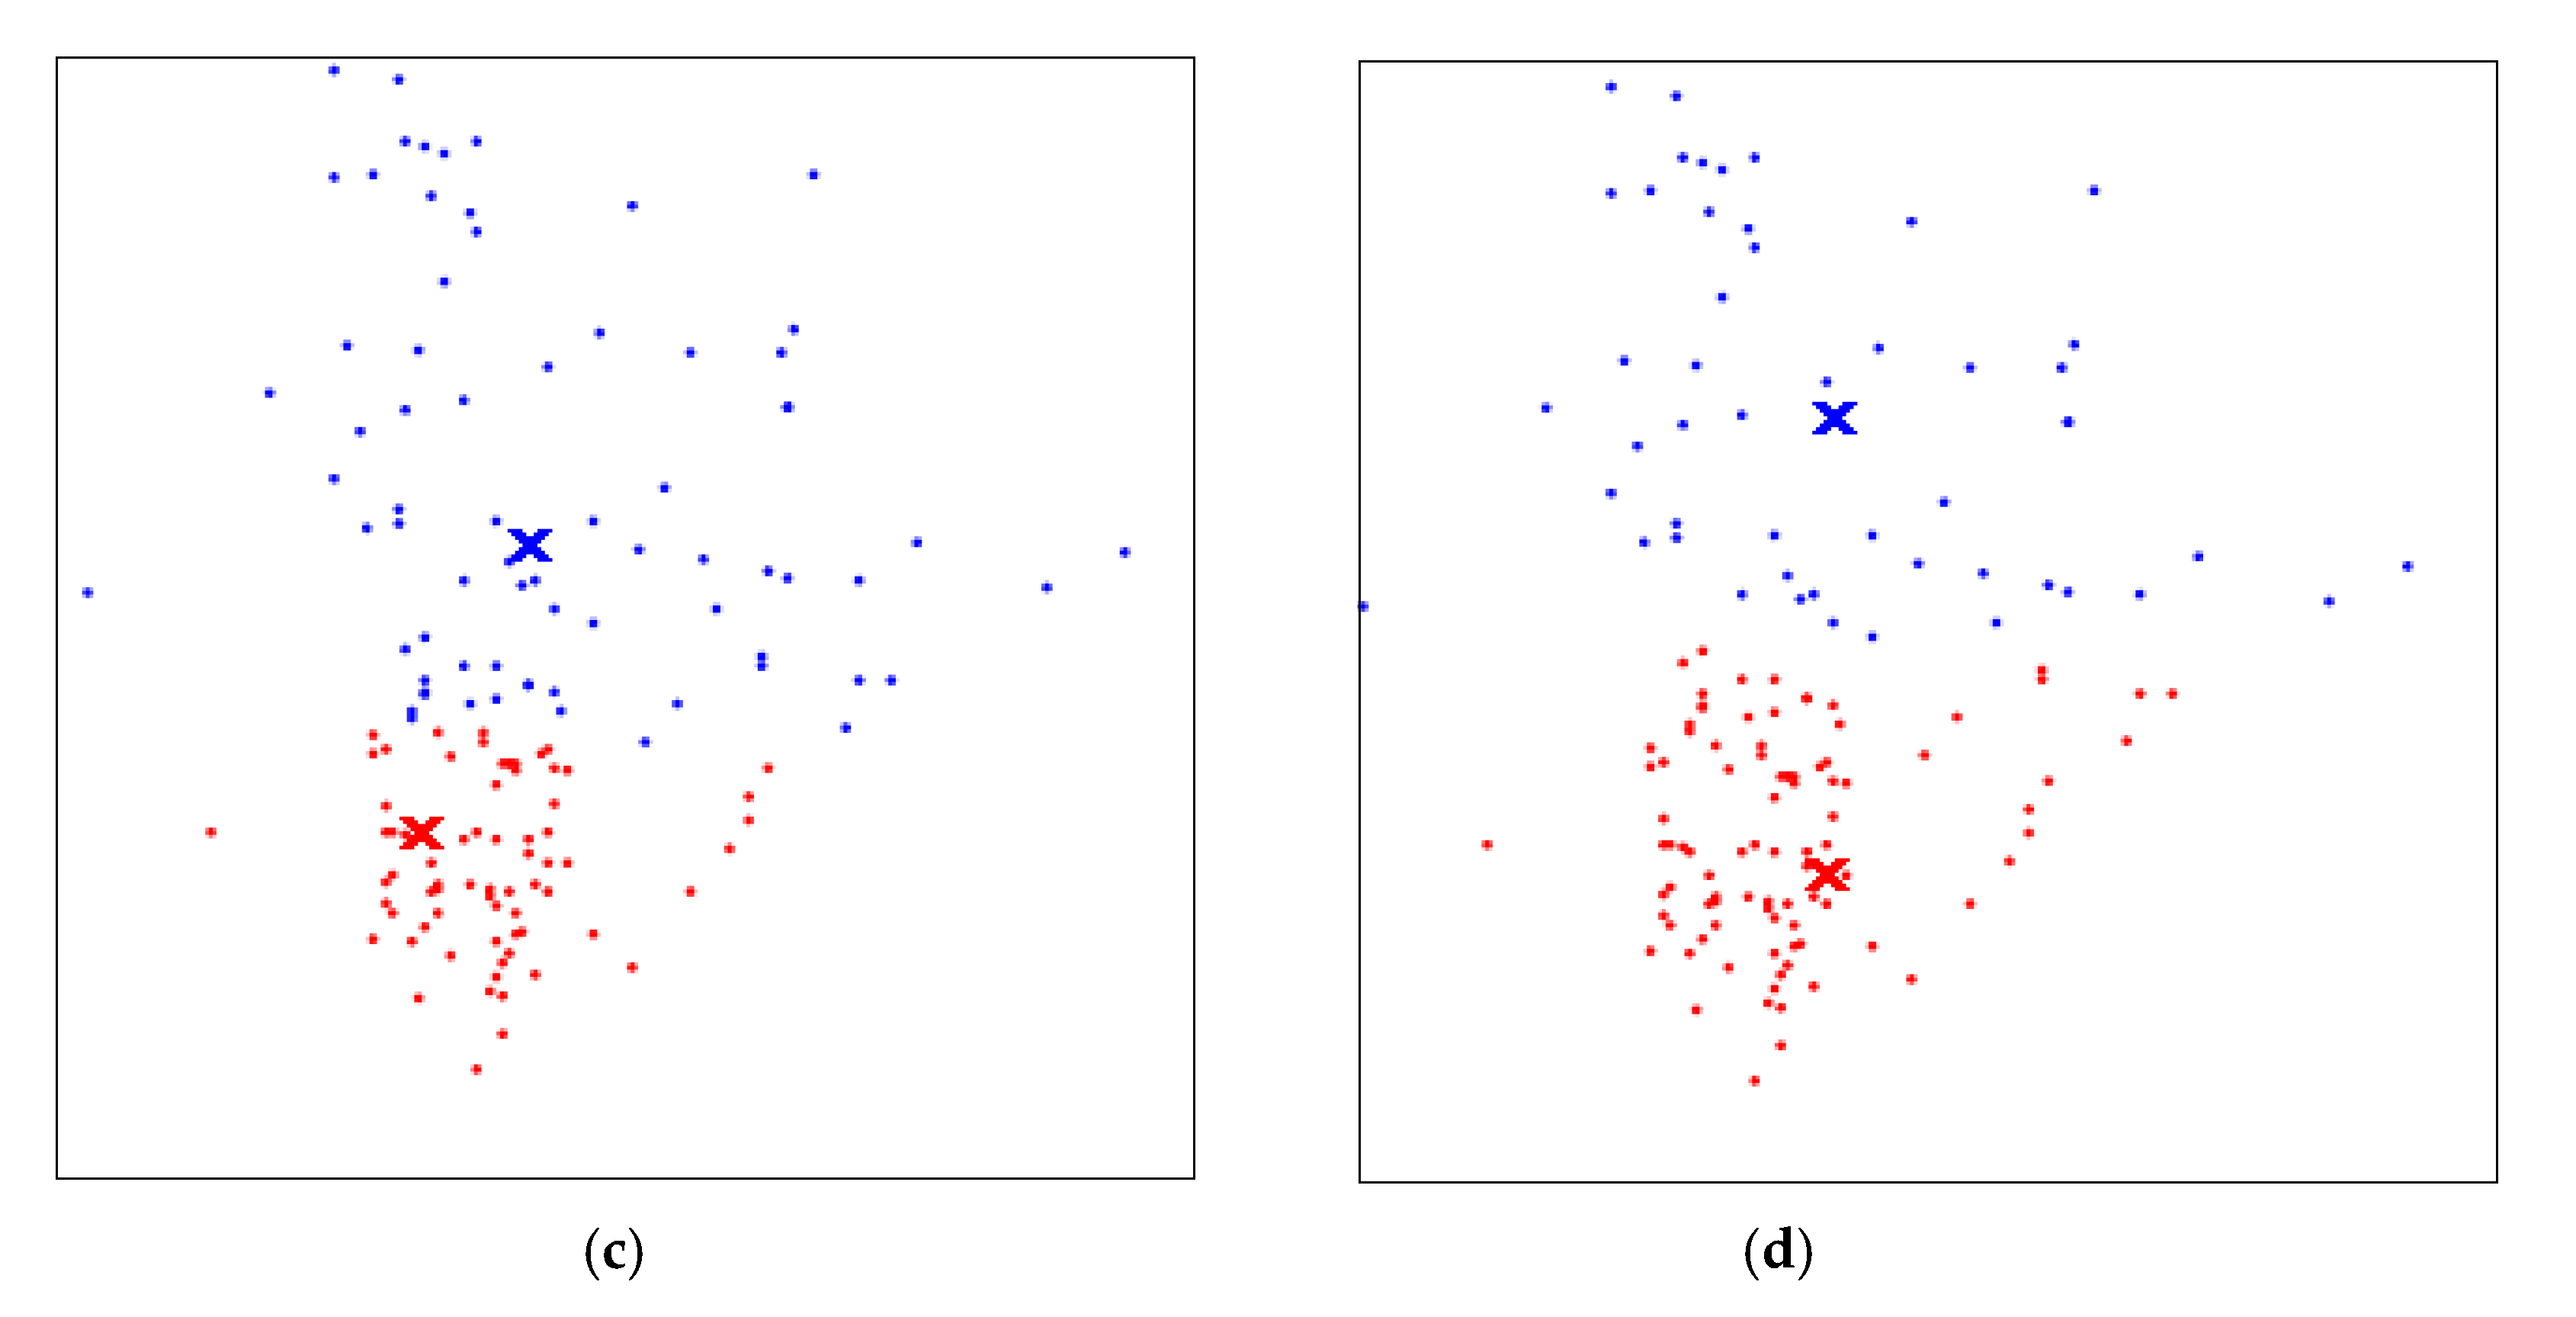
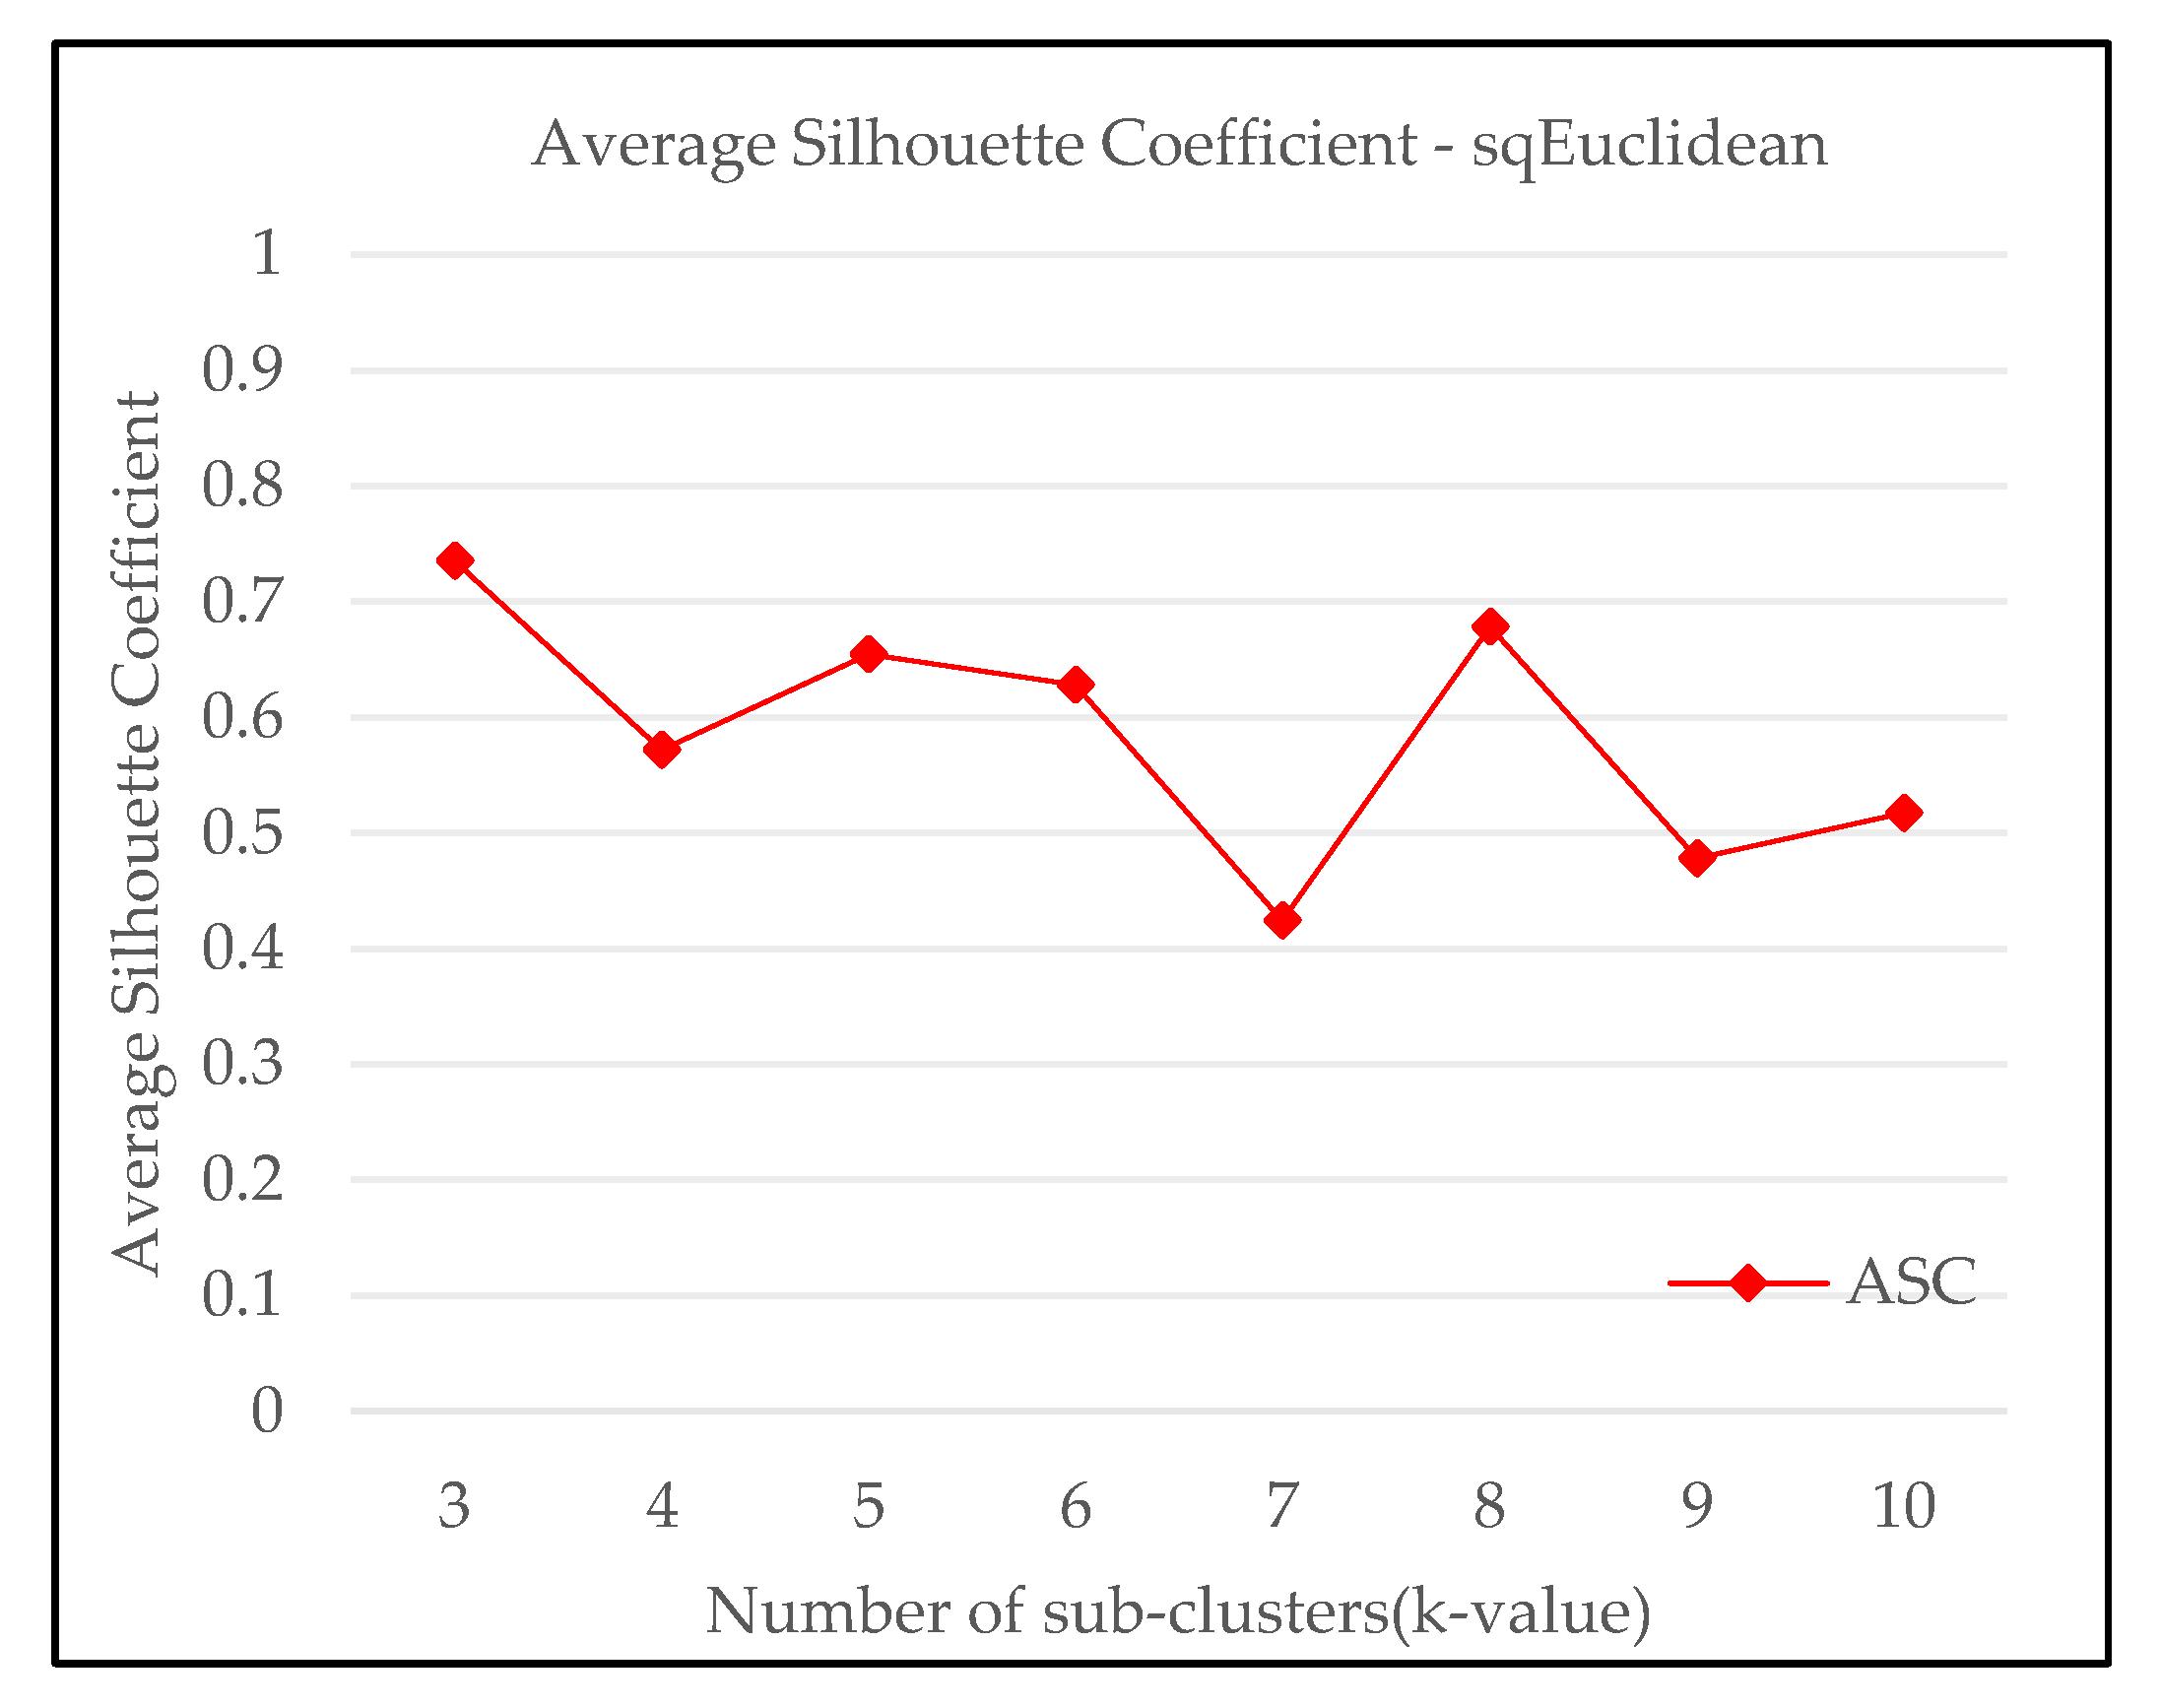
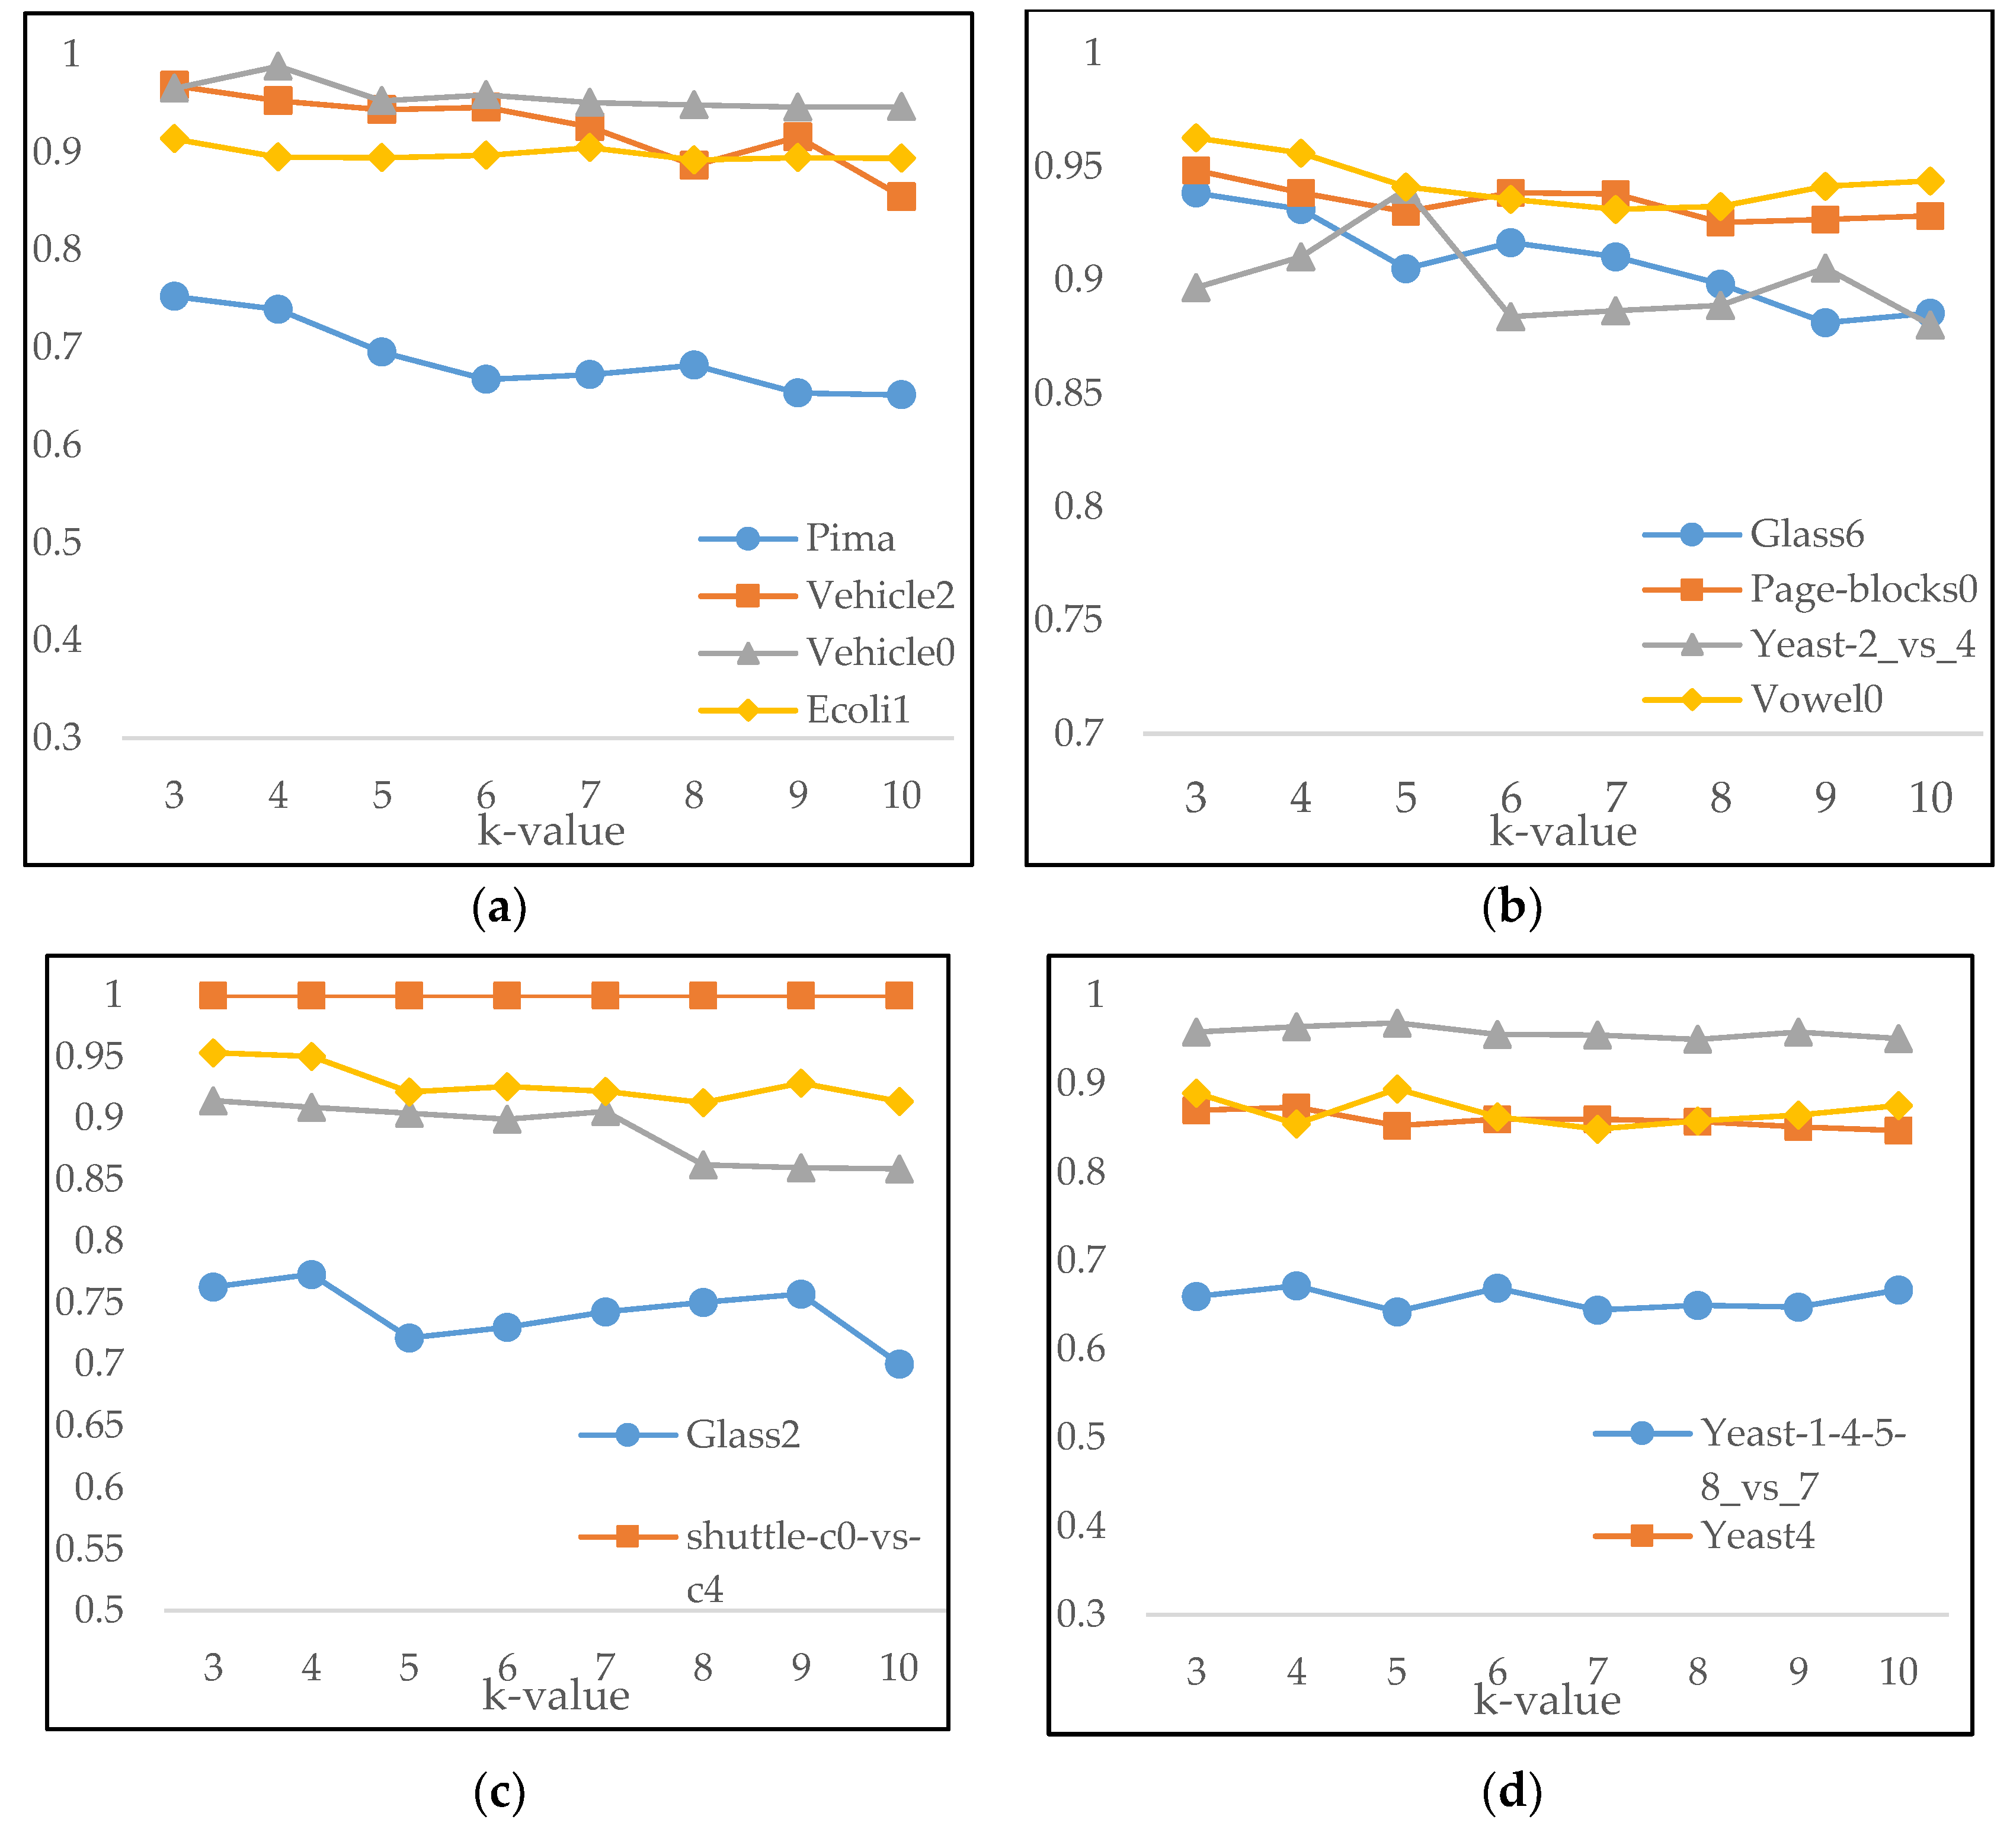
3.1. K-Means Clustering

Since there are fewer data samples in the positive class and it contains important information, EKR clusters only for the negative class. There are two reasons why we choose k-means as the clustering algorithm. On the one hand, K-means is a relatively low complexity algorithm, and it only needs to specify the parameter k-value. On the other hand, each sample only belongs to the cluster with the highest similarity after k-means, which can be better combined with the resampling method we proposed.
The process of K-means is as shown in Figure 1. Figure 1a gives an original dataset for clustering. First, the clustering number k is determined and k initial centroids are randomly selected. We use k = 2 as an example here. In Figure 1b, red and blue forks represent two random clustering centroids. Then the nearest centroid is found for each point, and each point is assigned to the cluster corresponding to the centroid, after that the centroid of each cluster is updated to the average of all points in the cluster, as shown in Figure 1c. Finally, the final cluster centroids and the determined sub-clusters are formed after several iterations as in Figure 1d.
However, K-means must determine k-value in advance, different k-value lead to different final classification results, so k-value cannot be determined blindly. In this paper, we utilize Average Silhouette Coefficient (ASC) to define k-value. Silhouette Coefficient combines Cohesion and Separation of clustering to evaluate the effect of clustering. Silhouette Coefficient of point i . is given in the follows equation:
S ( i ) = b ( i ) a ( i ) m a x { a ( i ) , b ( i ) }  
where a ( i ) . denotes the average of Euclidean distance between sample point i . and other points in the same sub-cluster, which is used to describe Cohesion within cluster. b ( i ) . is the average of Euclidean distance from point i to all points in the nearest sub-cluster, which quantifies separation between sub-clusters. Silhouette Coefficient is between −1 and 1. The larger the value is, the better the clustering effect will be. The average of Silhouette Coefficient of all points is Average Silhouette Coefficient. Hence, we choose the k-value that maximizes the Average Silhouette Coefficient. For example, we calculate Average Silhouette Coefficient of dataset in Figure 1a, as shown in Figure 2, when k = 3, Average Silhouette Coefficient reaches the maximum, so we choose k = 3 as the number of sub-clusters.

3.2. Resampling Strategy

After determining the k-value and clustering the negative class into k sub-clusters, T N = { C 1 , C 2 , , C k } where   c i is a sub-cluster, correspondingly, its cluster centroid is represented by   c i , and the number of data samples of C i . is N i . Then we combine k sub-clusters with the positive class into k subsets separately,   S i = C i T P ,   i = 1 , 2 , , k , where S i expresses a subset. The imbalance ratio of each sub-cluster is I R i , where I R i = N i / N P . Comparing the number of data samples of each sub-cluster with that of the positive class, namely, comparing   I R i with 1, there are three cases:
1. If I R i > 1 , we calculate the distance between c i . and all data samples in the same sub-cluster and sort from near to far, then select the nearest m neighbors to c i , where m = N p . This operate is equivalent to undersampling the sub-cluster. The reason for this is that these selected data samples have high similarity and represent the primary information of the sub-cluster. They are used to replace the whole sub-cluster and combined with the positive class to form a balanced subset.
2. If I R i < 1 , the negative class of the sub-cluster correspond to the minority class, because it is comparatively small in quantity. So in order to balance the subset, oversampling the negative class.
In this paper, we use ADASYN (adaptive synthetic sampling) as the oversampling method. ADASYN determines the number of synthetic data samples need to be generated according to the Equation (2):
G = ( N m i n N i ) × β  
where β denotes the desired balance after synthesizing data, β [ 0 , 1 ] , we need to achieve a balanced subset, so β = 1 . Then calculating n neighbors with Euclidean distance for each negative sple x i , p i is the number of the positive class among n neighbors, distribution Γ i is calculated as
Γ i = p i / n Z    
where Z is a normalization factor to ensure that Γ i can form a distribution. In this way, if there are more positive samples around a negative sample   x i , the higher Γ i is. Finally, the number of samples need to be synthesized for each negative sample x i is defined as
g i = Γ i × G  
ADASYN uses distribution Γ i to automatically determine the number of samples to be synthesized for each negative sample, which is equivalent to assigning a weight for each negative sample. For the negative samples that are difficult to learn, more synthetic data should be generated.
3. If I R i = 1 , we do not make any changes to the subset because it is balanced.
After the above resampling strategy, we can obtain k balanced subsets   { B S 1 , B S 2 , , B S k } , which can transform imbalanced classification into balanced classification and make the problem easier to solve.

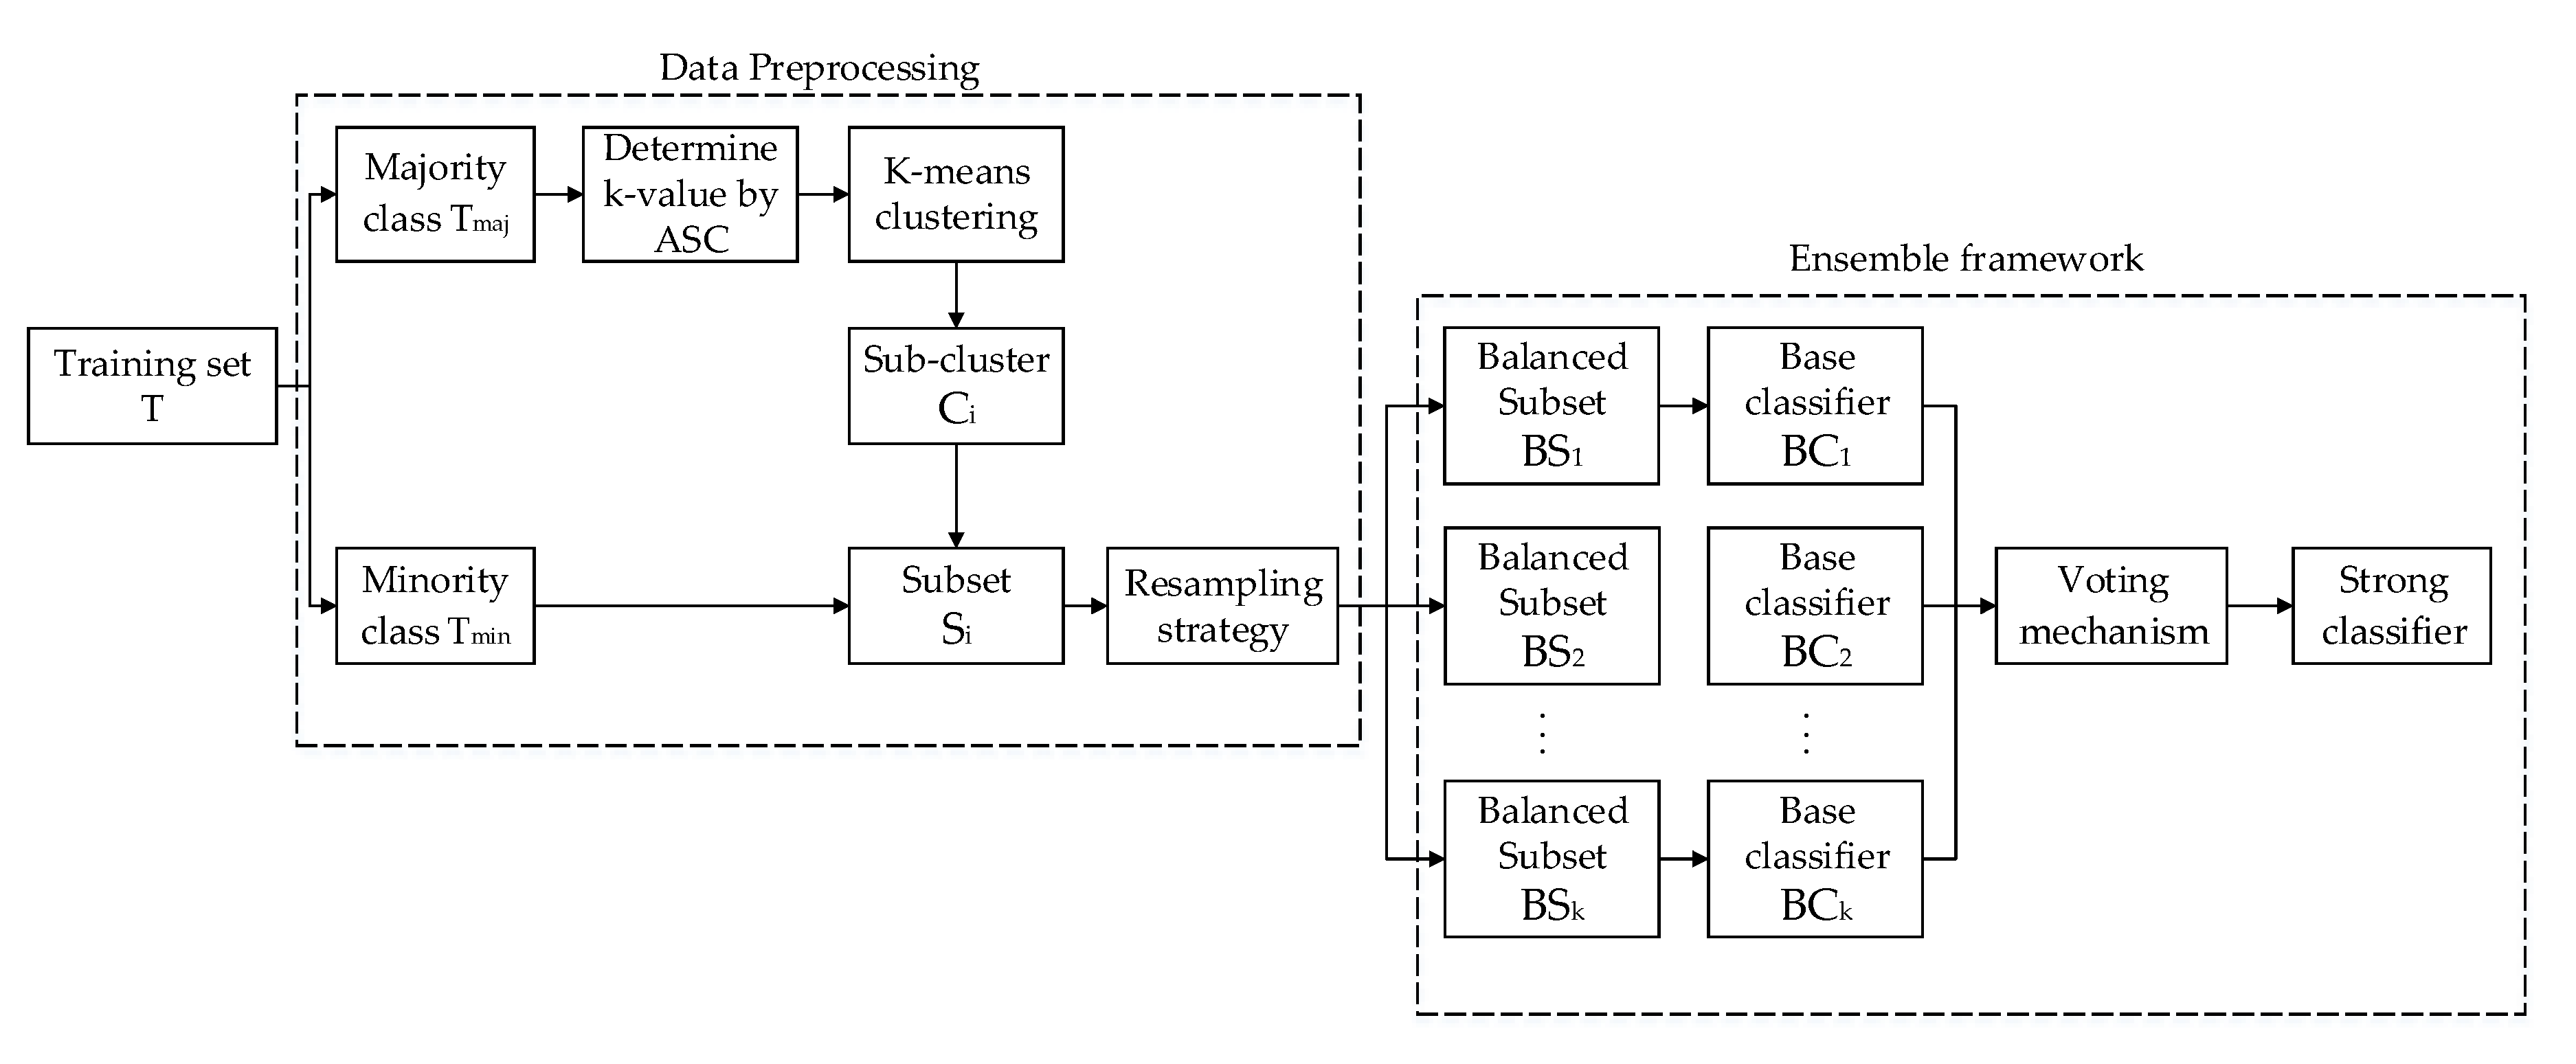
3.3. The Ensemble Framework based on K-Means and Resampling Technology

Eventually, after resampling the subsets and combining the sub-cluster and the minority class into k balanced subsets, base classifiers { B C 1 , B C 2 , , B C k } are trained on each balanced subset, and then integrated into a strong ensemble classifier by voting mechanism. Figure 3 gives the procedure of EKR. Data preprocessing contains K-means and resampling strategy, and ensemble framework refers to the process of training base classifiers on balanced subsets separately and combining them into a strong ensemble classifier.

4. Experiment Preparation and Result Analysis

4.1. Datasets

To verify the effectiveness and reliability of the proposed algorithm EKR for imbalanced classification, we use 16 imbalanced datasets from KEEL dataset repository, Table 1 introduces the selected datasets in detail, including the number of features (#Features), the number of data samples (#Samples), the imbalance ratio (IR), and the optimal k-value calculating by Average Silhouette Coefficient for each dataset. The imbalance ratio of these datasets are between 1.87 and 41.4 with the number of data samples ranging from 214 to 5472.

4.2. Metrics for Performance Evaluation

In machine learning, in order to evaluate the classification performance of a model, some evaluation metrics have been introduced including Accuracy, F1-score, G-mean, and AUC. The definition of these evaluation metrics needs to use the confusion matrix that introduces connection of actual and predicted classifications given in Table 2.
Accuracy means the proportion of correctly predicted samples to total samples, which is calculated as Equation (5):
A c c u r a c y = T P + T N T P + T N + F P + F N  
F1-score takes into account both the Precision and Recall of the classification model, which is the harmonic average of Precision and Recall, F1-score of the positive data is as follows:
P r e c i s i o n P = T P T P + F P  
R e c a l l P = T P T P + F N  
F 1 s c o r e P = 2 × P r e c i s i o n P × R e c a l l P P r e c i s i o n P + R e c a l l P  
Similarly, for the negative samples, F1-score is calculated as:
P r e c i s i o n N = T N T N + F N  
R e c a l l N = T N T N + F P  
F 1 s c o r e N = 2 × P r e c i s i o n N × R e c a l l N P r e c i s i o n N + R e c a l l N  
Therefore, for the entire data, synthetic Precision, Recall, and F1-score are calculated as:
P r e c i s i o n = P r e c i s i o n P + P r e c i s i o n N 2  
R e c a l l = R e c a l l P + R e c a l l N 2  
F 1 s c o r e = F 1 s c o r e P + F 1 s c o r e N 2  
G-mean can be used to evaluate the comprehensive performance of an algorithm, which is defined as Equation (17):
G m e a n = T P R × T N R  
T P R = T P T P + F N  
T N R = T N F P + T N
G-mean uses TPR and TNR to measure the classification performance of positive and negative classes. If one of both is very small, the G-mean is not ideal.
AUC (area under curve) is also a very reliable classification evaluation criteria, which represents the area under the ROC (receiver operating characteristic). The ROC can visualize the trade-off between TPR and FPR. The range of AUC is from 0 to 1. The larger the AUC is, the better the performance of the algorithm is.

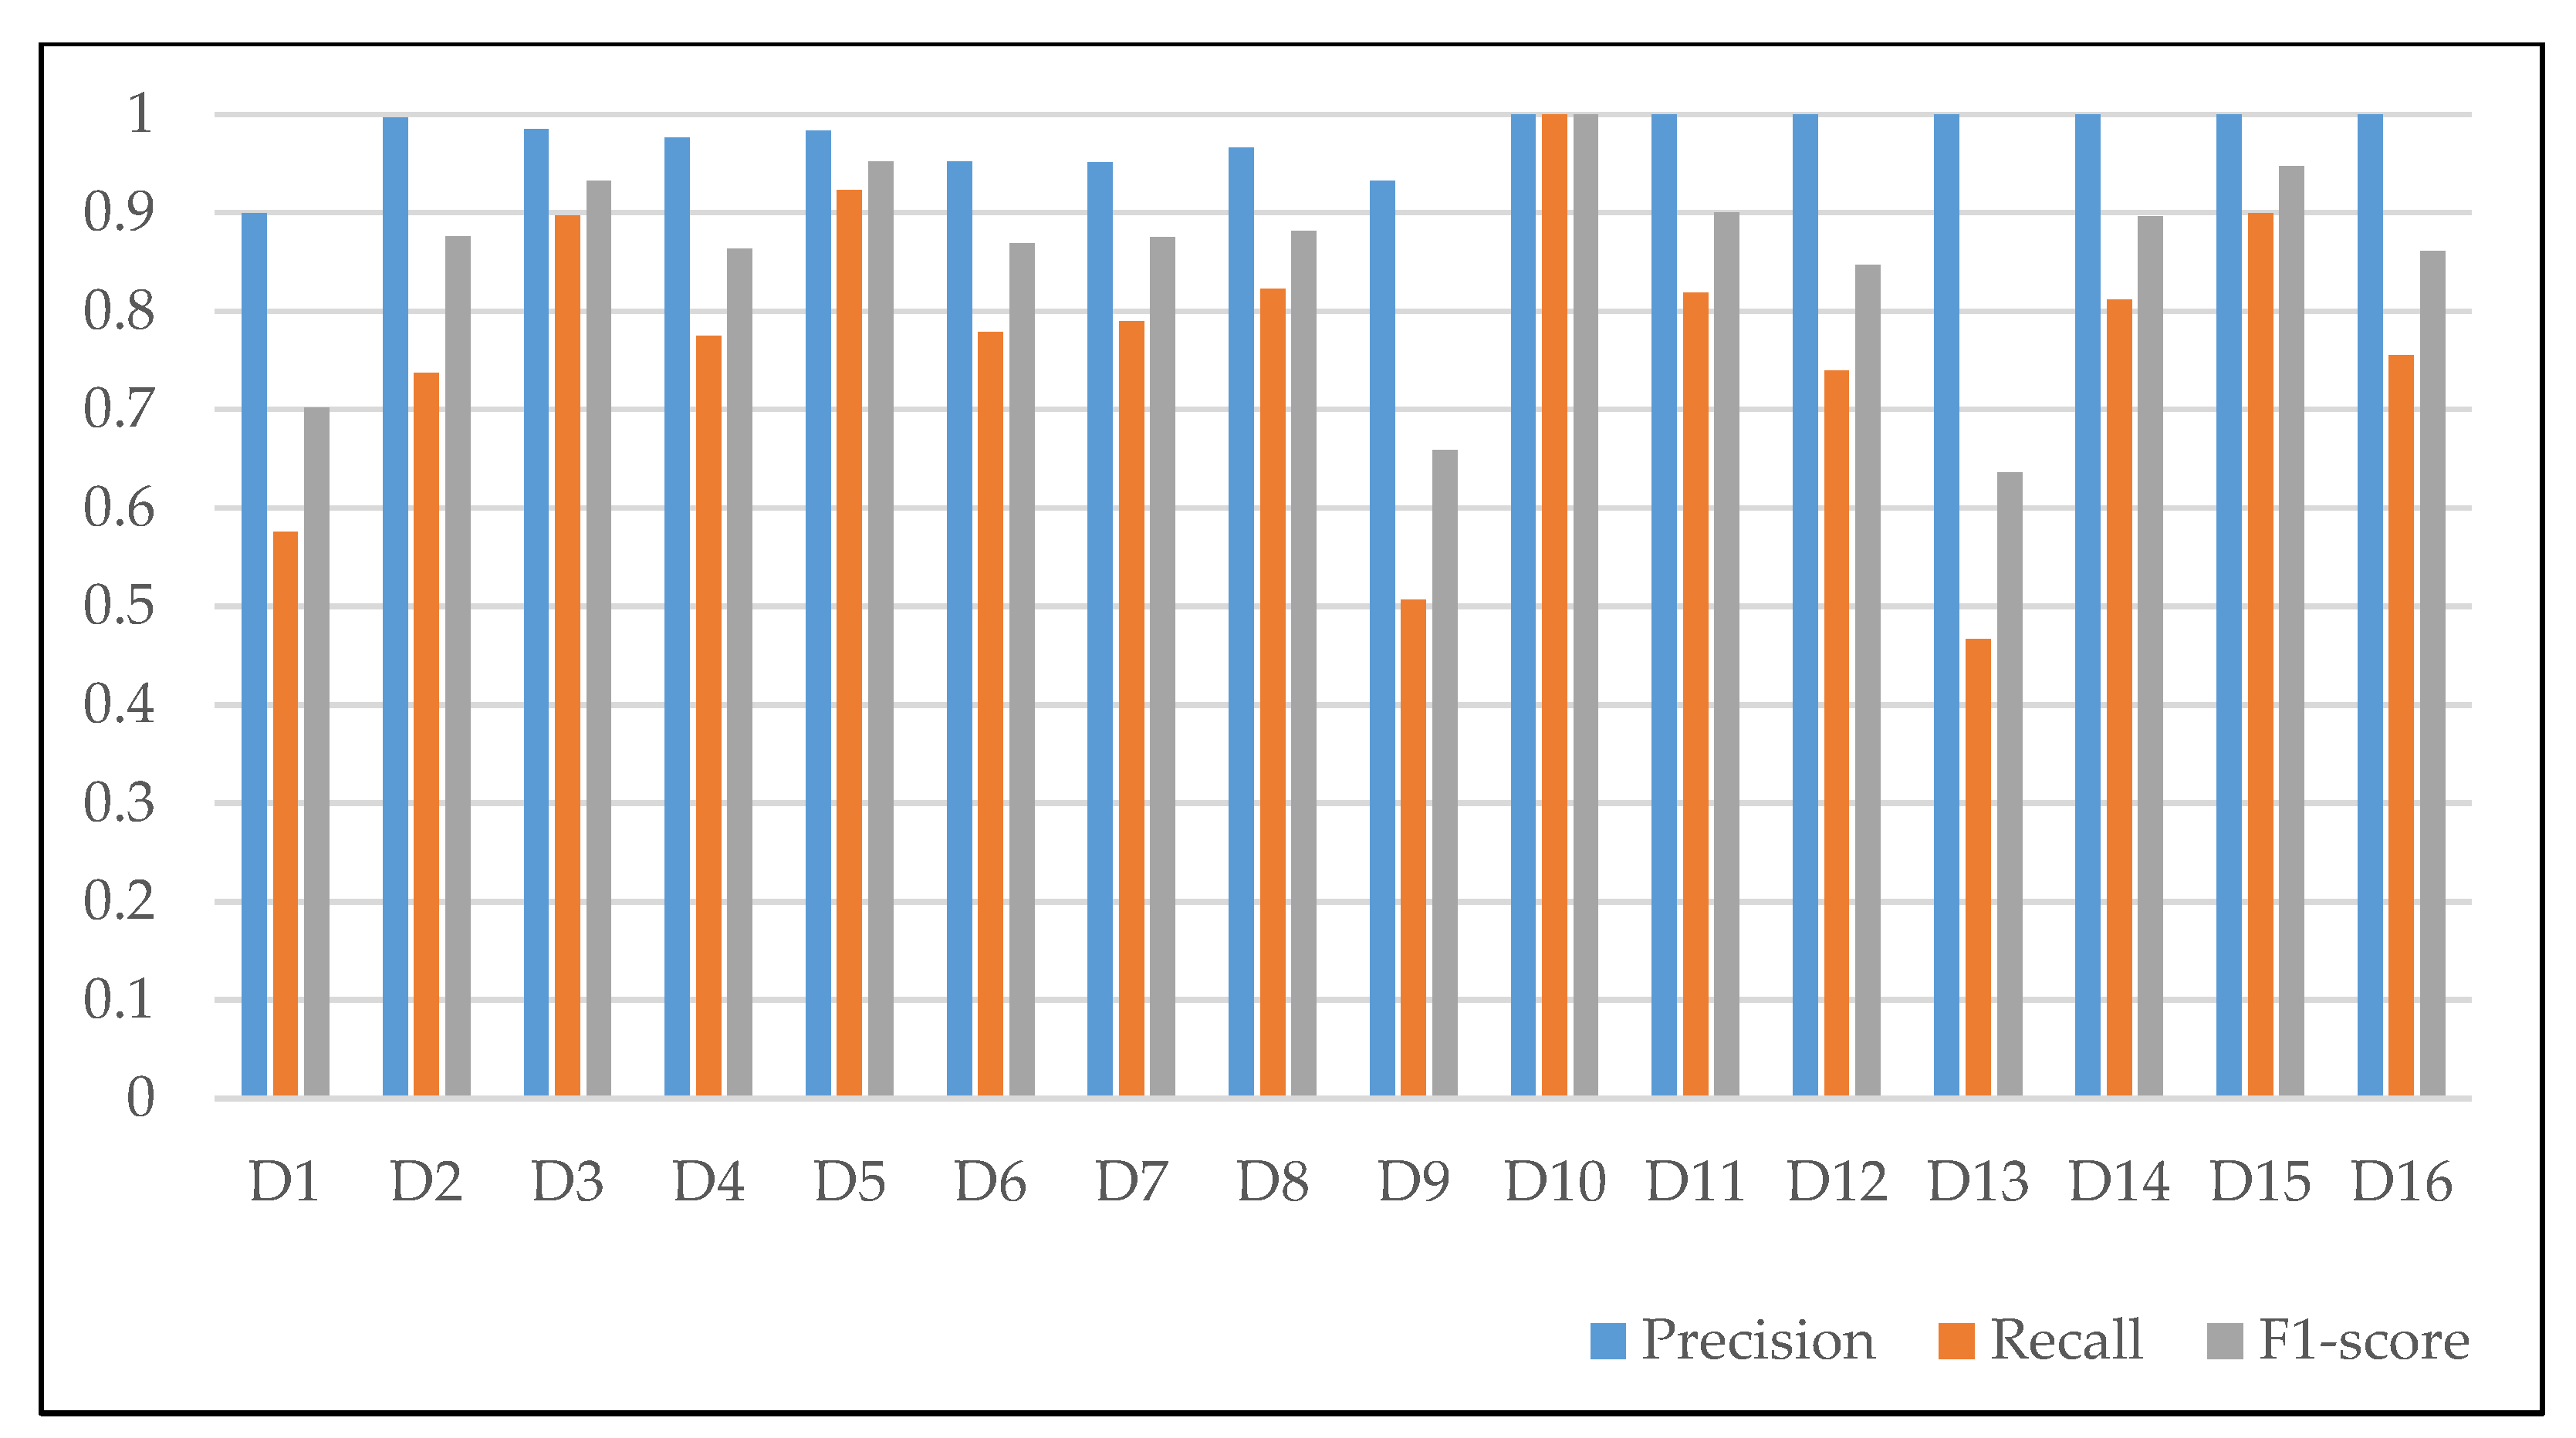
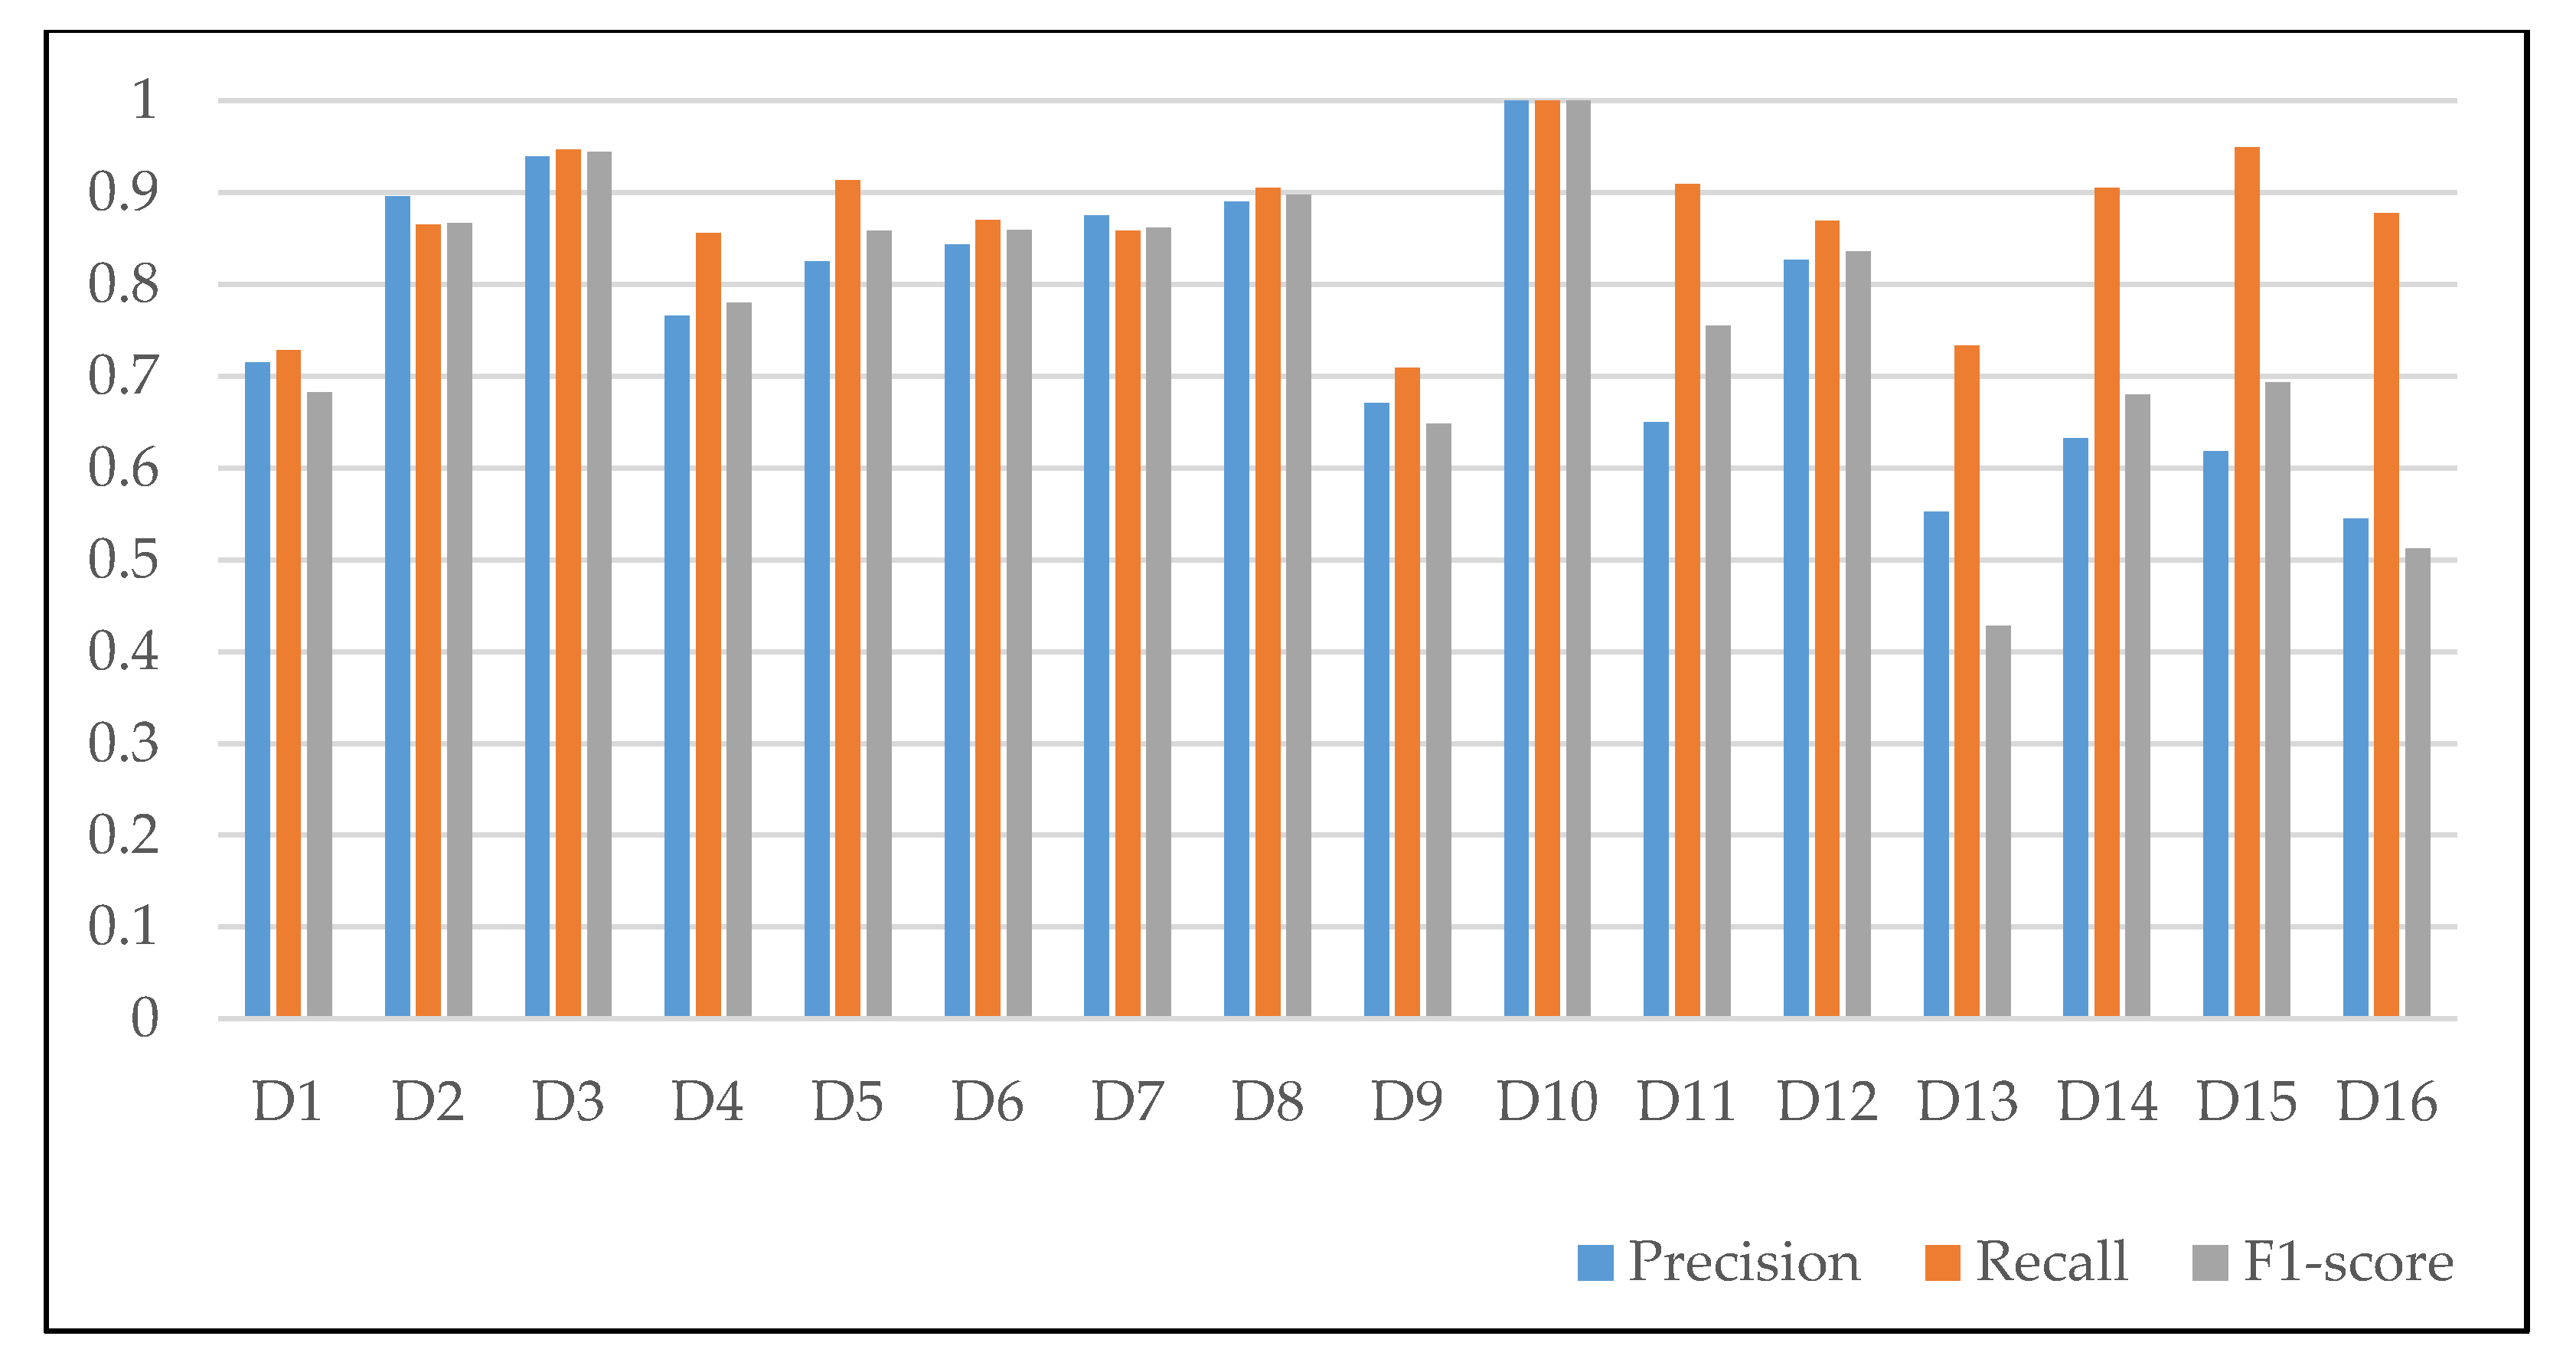
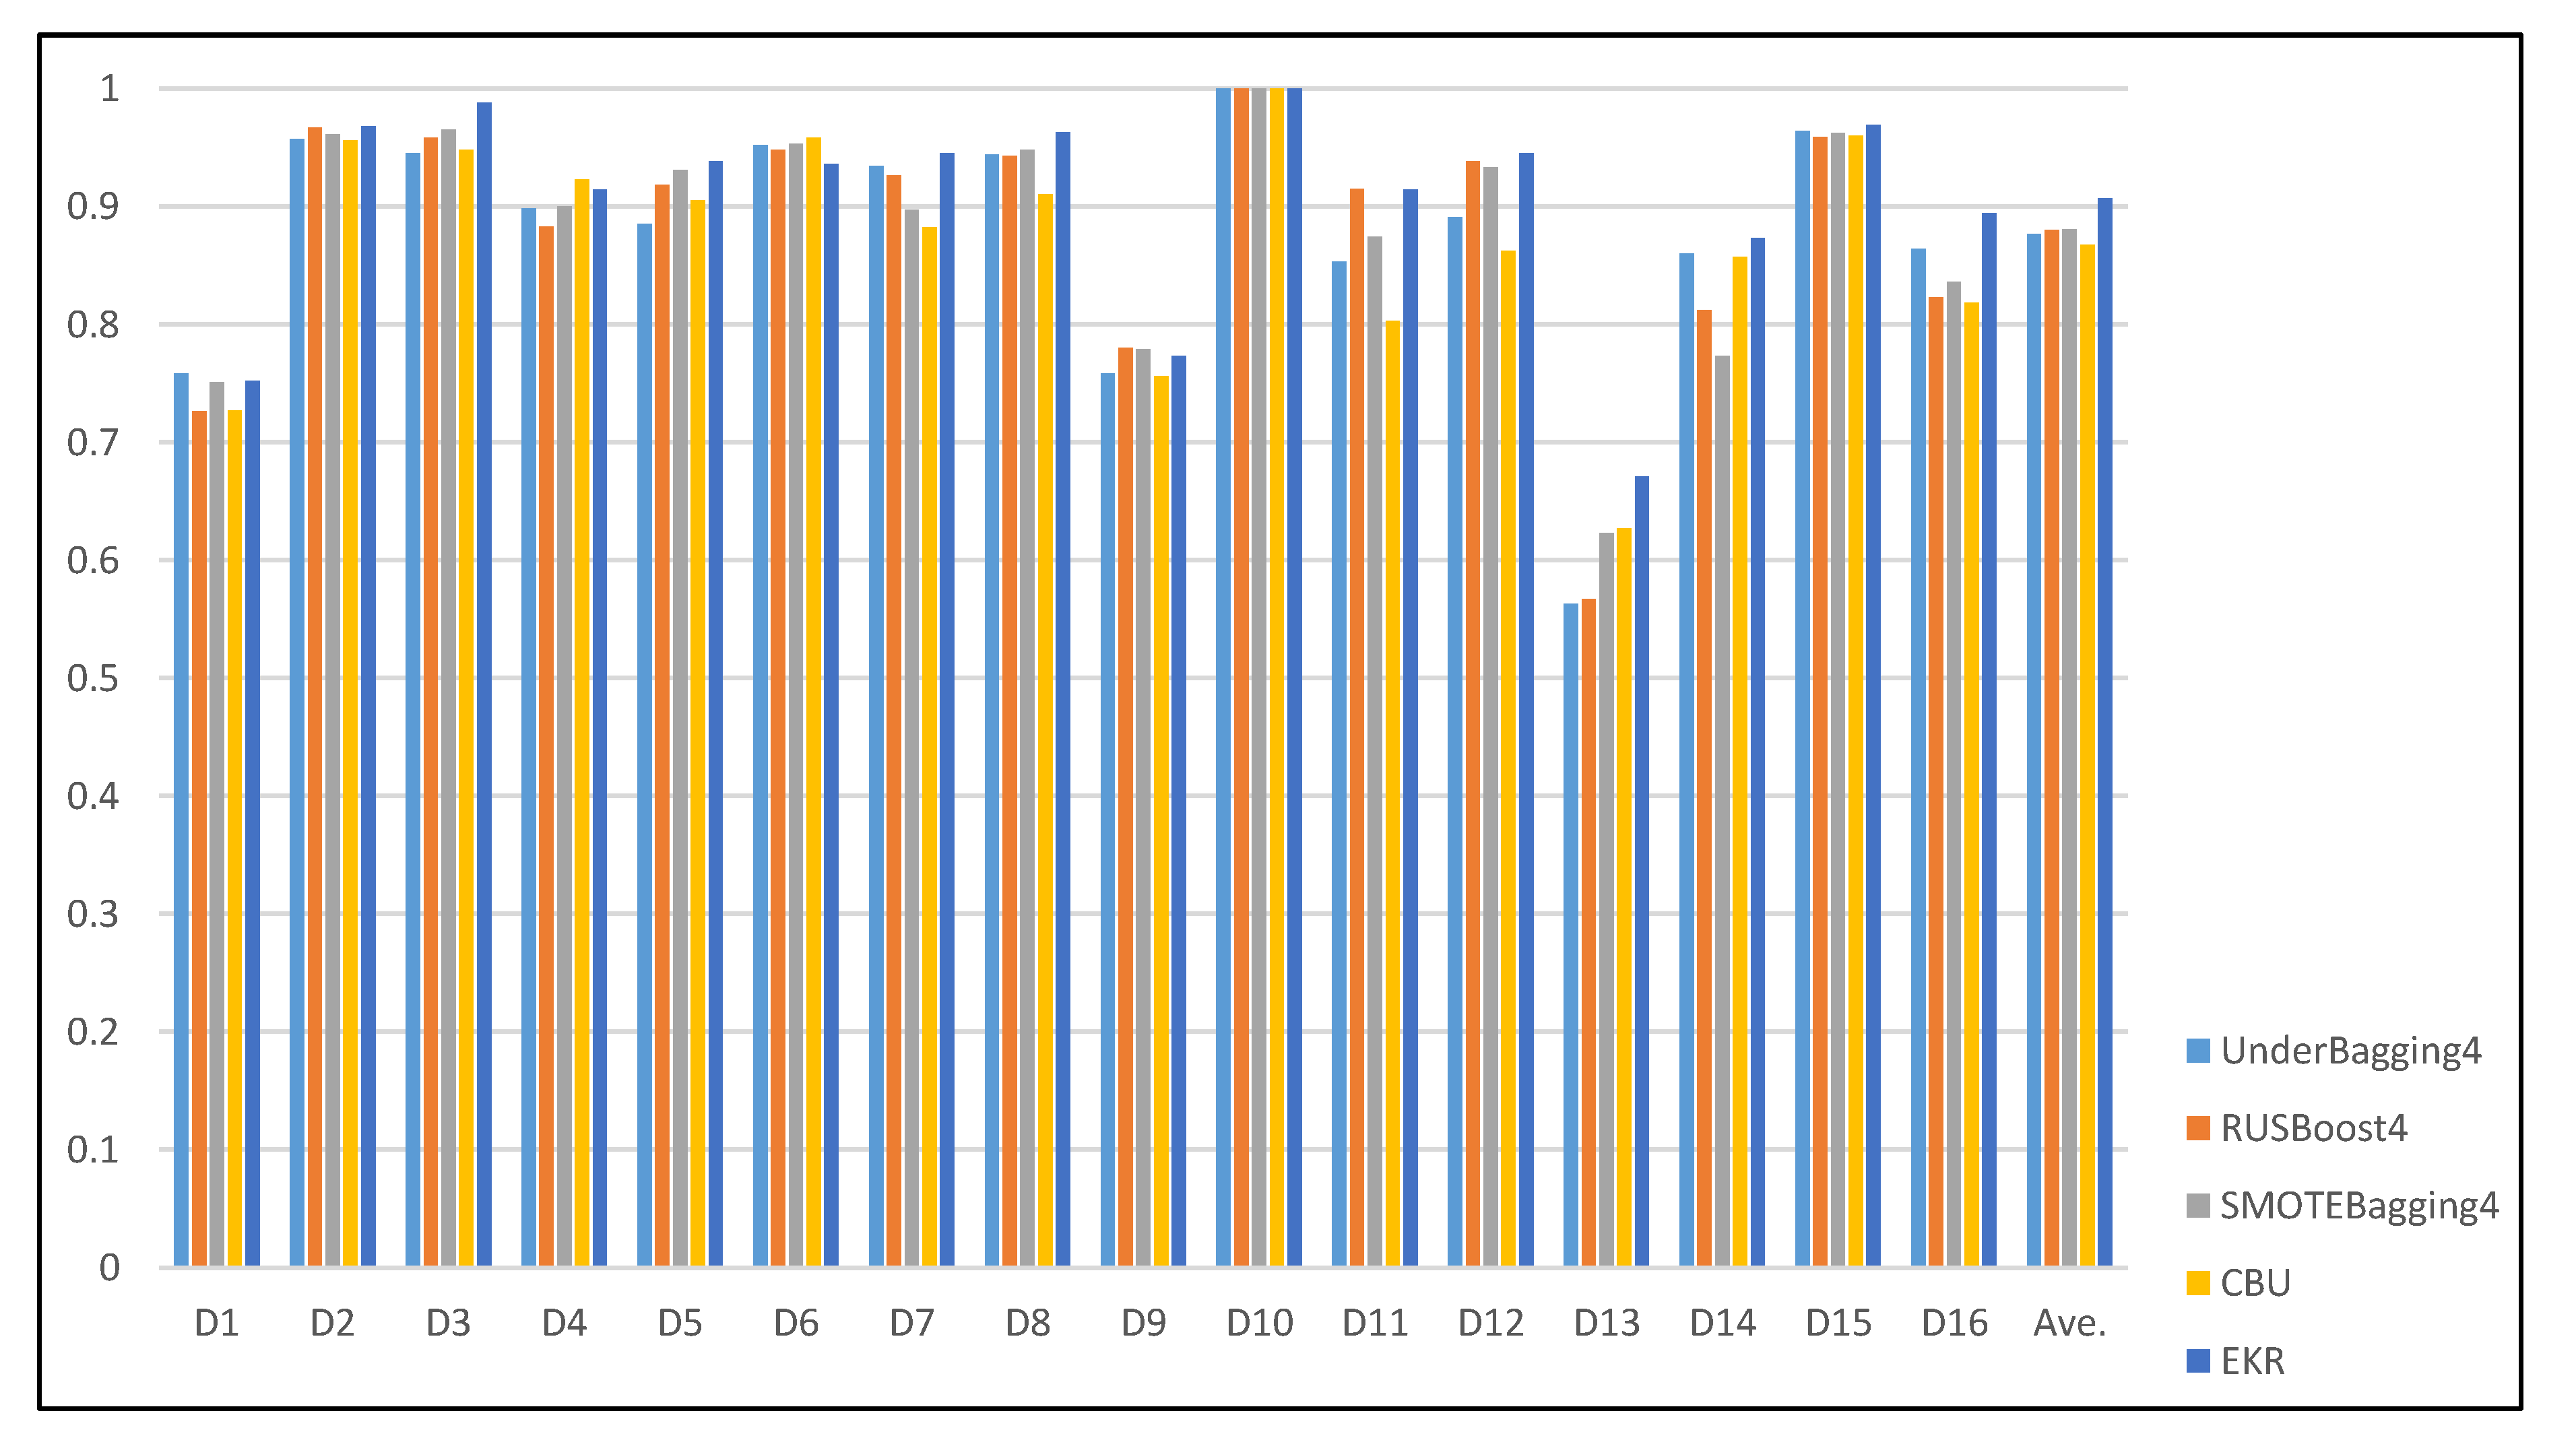
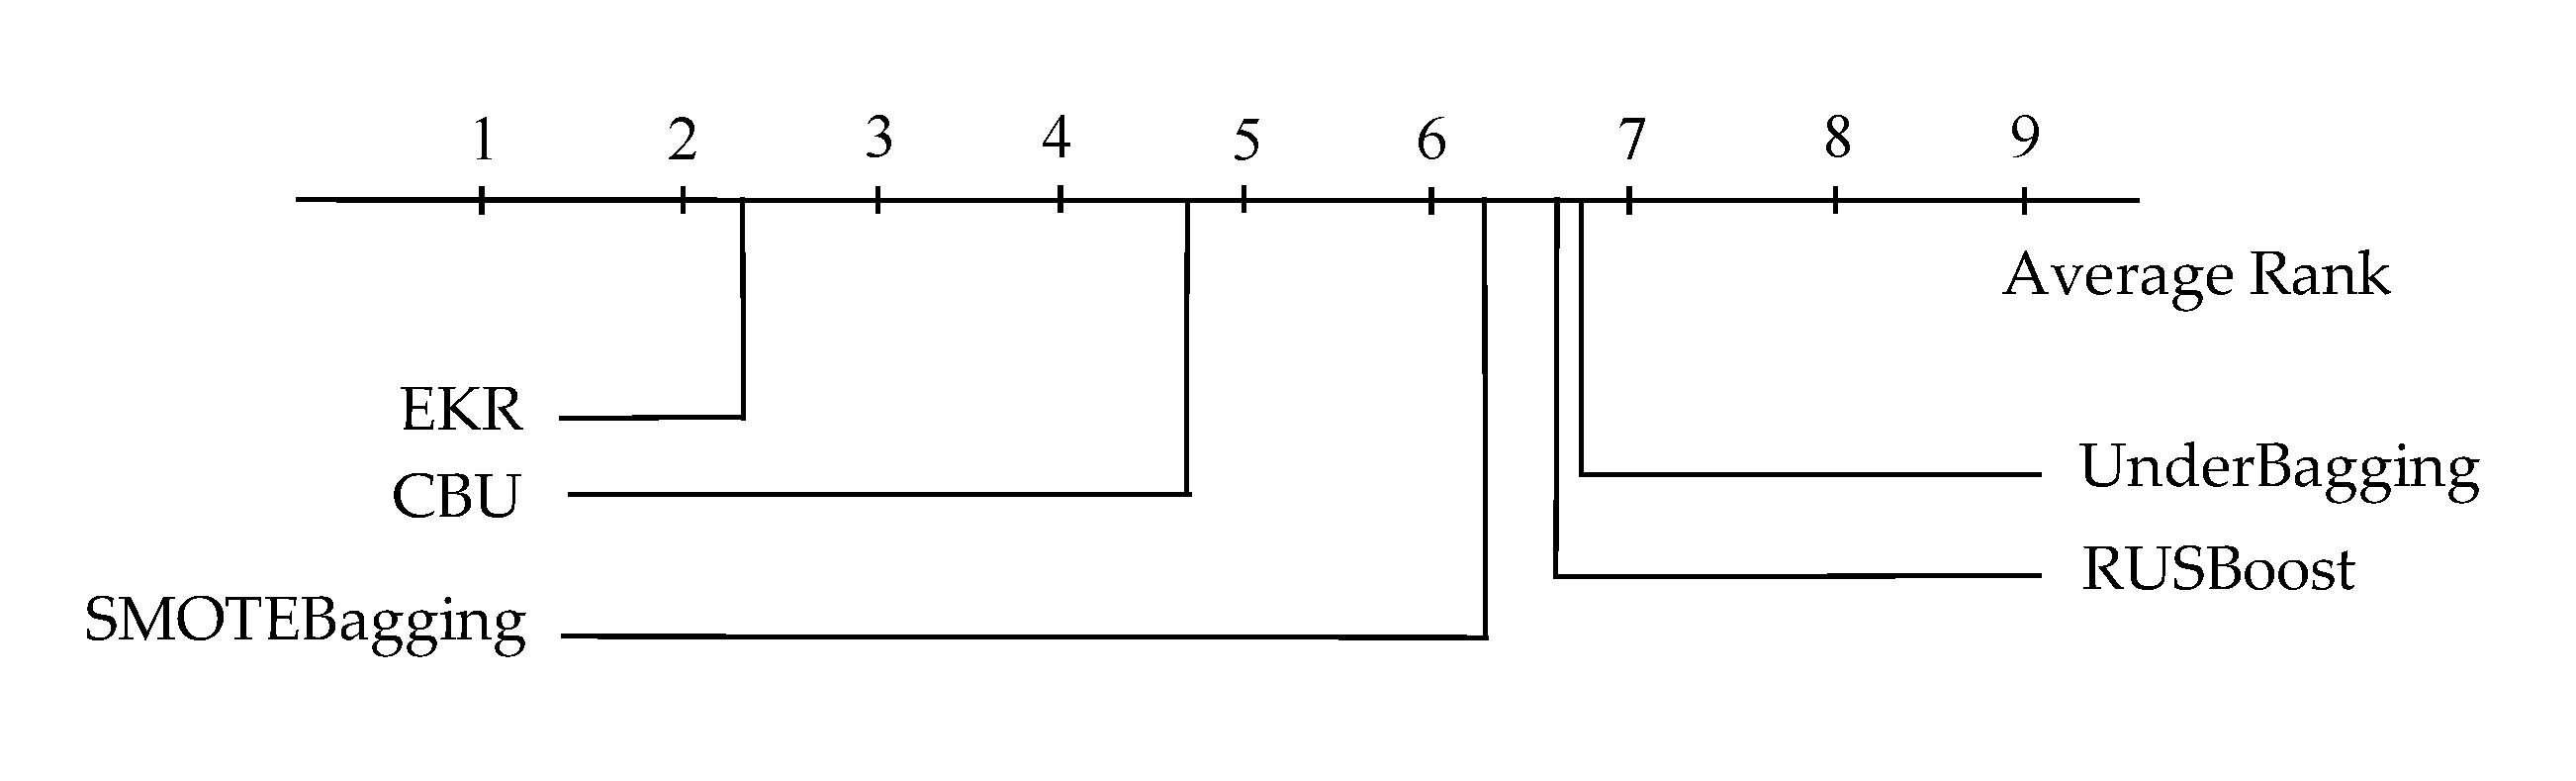
4.3. Experimental Results and Analysis

In order to ensure the fairness of the results, this paper adopts five-fold cross validation to divide the datasets into five parts on average, 80% of which is the training set, the rest is the test set, and the average of ten experimental results is taken as the final result. An important theme to notice, if cross validation is used, the optimal k-valve need be calculated several times and the can be different for different folds. So for each dataset, we calculate the Average Silhouette Coefficient on each fold for 50 times, which is 250 times in total, then recording the times of corresponding k-value when the Average Silhouette Coefficient reaches the highest, and selecting the best k-value by the principle that the minority is subordinate to the majority. The process of k-value determination and data training is independent.
Table 3 shows the classification performance of EKR with different base classifiers on 16 datasets. We compared the performance of three base classifiers for EKR, including SVM, Naïve Bayes, KNN and C4.5, and recorded Accuracy, F1-score, G-mean, and AUC of EKR with four base classifiers. When the data is extremely imbalanced, Accuracy cannot objectively evaluate the algorithm, it can only be used as a reference index. F1-score, G-mean, and AUC are used to evaluate the comprehensive performance of the algorithm, which are more proper evaluation metrics. As the results shown, we can find that C4.5 produces the highest average on all the evaluation metrics, and it maintains the most winner times, followed by SVM, KNN, and Naïve Bayes. However, C4.5 does not obtain the best performance on all datasets. On each dataset, we mark the highest value of each evaluation metrics in bold, C4.5 wins the most times. C4.5 can use the unique feature selection method to deal with data samples with more features. SVM can map data to high-dimensional feature space, so it can solve the problem of linear indivisibility in the original space. KNN is the simplest algorithm in machine learning, but it is easy to be affected by surrounding samples when classifying. In this experiment, the kernel function used in SVM is Gaussian radial basis kernel function   K ( x , y ) =   e | | x y | | 2 2 . We set K in KNN to 15. Naïve Bayes is not very sensitive to the data with missing features, so the classification effect is poor.
As shown in Figure 4, Figure 5 and Figure 6, we recorded Precision, Recall, and F1-score of EKR with C4.5 for positive samples, negative samples, and overall samples respectively. For positive samples, Recall is higher than Precision, and Recall is more than 89% or even 100% in many datasets, which shows that EKR is suitable for the classification of positive samples. Simultaneously, for negative samples, Precision is higher than Recall, and F1-score of negative samples is better than that of positive samples. Precision and Recall are mutually exclusive, one rise often leads to another fall. For the overall sample of most datasets, there is little difference among Precision, Recall, and F1-score. As for datasets D11, D13, D14, D15, and D16, Recall is much higher than Precision obviously. Figure 4, Figure 5 and Figure 6 prove that the classification ability of EKR for imbalanced datasets.
Four approaches have been used as the baseline for comparison with EKR, including UnderBagging4, RUSBoost4, SMOTEBagging4, and Clustering-based Undersampling (CBU), where the numbers 4 mean the numbers of base classifiers used in these ensemble approaches. Figure 7 shows AUC comparisons of four baseline models and EKR using C4.5 as base classifier in the form of histogram. As indicated by the results, the proposed EKR demonstrated the highest average AUC of 0.9068, followed by SMOTEBagging4, RUSBoost4, UnderBagging4, and CBU, average AUC of which are 0.8807, 0.8799, 0.8763, and 0.8672 respectively. Compared with the four baseline approaches, the average AUC of EKR increased by 0.0261, 0.0269, 0.0305, and 0.0396 separately. Except for datasets D4, D6, D9, and D11, EKR obtains the highest AUC. EKR is better than other algorithms. The resampling methods adopted by the four algorithms have their own limitations. The common point of CBU and EKR is to cluster the negative samples, but the k-value of CBU is determined by the number of positive samples, finally, only the nearest neighbor of cluster centroid is selected in each cluster to represent the whole cluster, which is combined with positive samples to form a balanced dataset. In this way, although the imbalance ratio of the data is reduced, only one classifier is trained. Though the effect of CBU is better than that of random sampling, the classifier lacks diversity. Therefore, inspired by CBU, EKR selects several representative samples from the sub-cluster and forms several balanced subsets with the positive samples, which increases the diversity of classifiers and improves the classification effect. SMOTEBagging4 uses SMOTE as the oversampling method to generate a large number of positive samples that are similar to the existing samples, which can cause overfitting problem. Random undersampling4 used in RUSBoost4 and UnderBagging4 may select unrepresentative samples or noise samples so that the information is beneficial to classification. EKR use Average Silhouette Coefficient to determine the optimal k-value before K-means for each dataset, this makes each sample closest to all samples in its sub-cluster and furthest from samples in other sub-clusters. EKR integrates the classification results on many balanced subsets, especially when the number of negative class samples in the subset is more than that of positive class samples, we use the resampling strategy introduced in Section 3.2, and select the most representative negative samples in each sub-cluster to replace the whole sub-cluster, and combine them with the positive samples to form the balanced subset. The resampling method proposed in this paper avoids the influence of blind random sampling on classification results.
Figure 7 clearly shows the advantages of EKR in AUC index. In order to prove the significant difference between EKR and other algorithms, we use the Friedman test, which is a non-parametric statistical test. We assume that the performances of all of the algorithms for comparison are the same and set the p-value at 0.05. The experimental results reject the initial hypothesis, and the p-value is less than the given significance level (p < 0.05). To further demonstrate the differences between the comparison algorithms, the Nemenyi post-hoc test is also applied for this experiment. On the premise that the hypothesis has been rejected, the Nemenyi test can compare the algorithm in pairs and show the differences between the algorithms more intuitively. Figure 8 shows the Nemenyi test results, where CD = 1.525. When the rank gap between two different algorithms exceeds CD, the performance of these two algorithms can be viewed as significantly different. Therefore, there are significant differences between EKR and other algorithms.
Figure 9 shows AUC comparison of different k-values on 16 datasets, k-value is from 3 to 10. The k-value of K-means clustering cannot be set too large, otherwise it may cause the sample not matching the most appropriate sub-cluster, so we use the Average Silhouette Coefficient to calculate the k-value, which ensures the large Cohesion within the sub-cluster and the large separation between sub-clusters. The results show that the most appropriate k-value is basically between 3 and 5 in all datasets, and the AUC value corresponding to the optimal k-value is the highest.

5. Conclusions and Future Works

As a research hotspot of machine learning, imbalanced classification has attracted the attention of many scholars. In this paper, we propose a novel ensemble framework based on K-means and resampling called EKR to alleviate the adverse effect of imbalanced datasets. On 16 datasets with different imbalance ratios from 1.87 to 41.4, we tested EKR in all aspects and proved the validity and superiority of EKR.
In order to retain the effective information of positive samples, EKR only uses K-means to cluster negative samples into several sub-clusters, the optimal k-value is determined by the Average Silhouette Coefficient of each dataset. Then each sub-cluster is combined with the positive samples to form a subset, and the subset is balanced by resampling negative samples. Particularly, when the number of negative samples is more than that of the positive samples, EKR selects negative samples that are closest to the clustering center, because these samples can represent the whole sub-cluster. We evaluated EKR with six different metrics, including Accuracy, Precision, Recall, F1-score, G-mean, and AUC, and the compared AUC of EKR with four baseline models, EKR shows better performance, which indicates that EKR is effective for imbalanced classification.
Some datasets have fewer positive samples, so the number of samples in the subset may also be less, which has a certain impact on the classification effect of the classifier. However, oversampling the positive samples may lead to class overlapping. Therefore, in future research work, we need to further improve the algorithm in detail to avoid class overlapping and increase the number of samples of a subset. In addition, we will pay more attention to the multi-classification task and design the algorithm suitable for multi-classification.

Author Contributions

Conceptualization, H.D.; methodology, H.D.; software, H.D.; validation, H.D.; formal analysis, H.D.; investigation, H.D.; resources, H.D.; writing—original draft preparation, H.D.; writing—review and editing, H.D., H.Y.; funding acquisition, Y.W., P.L. All authors have read and agreed to the published version of the manuscript.

Funding

This research was funded by the National Social Science Fund (19BYY076), the Science Foundation of the Ministry of Education of China (No. 14YJC860042), and the Shandong Provincial Social Science Planning Project (No. 9BJCJ51/18CXWJ01/18BJYJ04).

Acknowledgments

Thanks to all commenters for their valuable and constructive comments.

Conflicts of Interest

The authors declare no conflict of interest.

References

  1. He, H.; Garcia, E.A. Learning from imbalanced data. IEEE Trans. Knowl. Data Eng. 2009, 21, 1263–1284. [Google Scholar]
  2. Kourou, K.; Exarchos, T.P.; Exarchos, K.P.; Karamouzis, M.V.; Fotiadis, D.I. Machine learning applications in cancer prognosis and prediction. Comput. Struct. Biotechnol. J. 2015, 13, 8–17. [Google Scholar] [CrossRef] [PubMed] [Green Version]
  3. Parvin, H.; Minaei-Bidgoli, B.; Alinejad-Rokny, H. A new imbalanced learning and dictions tree method for breast cancer diagnosis. J. Bionanosci. 2013, 7, 673–678. [Google Scholar] [CrossRef]
  4. Tsai, C.F.; Hsu, Y.F.; Lin, C.Y.; Lin, W.Y. Intrusion detection by machine learning: A review. Expert Syst. Appl. 2009, 36, 11994–12000. [Google Scholar] [CrossRef]
  5. West, J.; Bhattacharya, M. Intelligent Financial Fraud Detection: A Comprehensive Review. Comput. Secur. 2015, 57, 47–66. [Google Scholar] [CrossRef]
  6. Barandelaa, R.; Sanchez, J.S.; Garcia, V. Strategies for learning in class imbalance problems. Pattern Recognit. 2003, 36, 849–851. [Google Scholar] [CrossRef]
  7. Zhou, Z.H.; Liu, X.Y. Training cost-sensitive neural networks with methods addressing the class imbalance problem. IEEE Trans. Knowl. Data Eng. 2006, 18, 63–77. [Google Scholar] [CrossRef]
  8. Nikulin, V.; Mclachlan, G.J.; Ng, S.K. Ensemble Approach for the Classification of Imbalanced Data. In Proceedings of the Australasian Joint Conference on Advances in Artificial Intelligence, Melbourne, Australia, 1–4 December 2009; Springer: Berlin/Heidelberg, Germany, 2009; pp. 291–300. [Google Scholar]
  9. Batista, G.E.A.P.A.; Prati, R.C.; Monard, M.C. A study of the behavior of several methods for balancing machine learning training data. ACM SIGKDD Explor. Newsl. 2004, 6, 20. [Google Scholar] [CrossRef]
  10. Ahmad, A.; Dey, L. A k-mean clustering algorithm for mixed numeric and categorical data. Data Knowl. Eng. 2007, 63, 503–527. [Google Scholar] [CrossRef]
  11. You, C.; Li, C.; Robinson, D.P. René Vidal A Scalable Exemplar-Based Subspace Clustering Algorithm for Class-Imbalanced Data. In Proceedings of the 15th European Conference on Computer Vision (ECCV), Munich, Germany, 8–14 September 2018. [Google Scholar]
  12. Lin, W.C.; Tsai, C.F.; Hu, Y.H.; Jhang, J.S. Clustering-based undersampling in class-imbalanced data. Inf. Sci. 2017, 409, 17–26. [Google Scholar] [CrossRef]
  13. Tsai, C.F.; Lin, W.C.; Hu, Y.H.; Yao, G.T. Under-sampling class imbalanced datasets by combining clustering analysis and instance selection. Inf. Sci. 2018, 477, 47–54. [Google Scholar] [CrossRef]
  14. Ofek, N.; Rokach, L.; Stern, R.; Shabtai, A. Fast-CBUS: A fast clustering-based undersampling method for addressing the class imbalance problem. Neurocomputing 2017, 243, 88–102. [Google Scholar] [CrossRef]
  15. Chawla, N.V.; Bowyer, K.W.; Hall, L.O.; Kegelmeyer, W.P. SMOTE: Synthetic minority over-sampling technique. J. Artif. Intell. Res. 2002, 16, 321–357. [Google Scholar] [CrossRef]
  16. Georgios, D.; Fernando, B.; Felix, L. Improving imbalanced learning through a heuristic oversampling method based on K-means and smote. Inf. Sci. 2018, 465, 1–20. [Google Scholar]
  17. Han, H.; Wang, W.Y.; Mao, B.H. Borderline-smote: A new over-sampling method in imbalanced data sets learning. In Proceedings of the International Conference on Intelligent Computing, Hefei, China, 23–26 August 2005; Springer: Berlin/Heidelberg, Germany, 2005; pp. 878–887. [Google Scholar]
  18. He, H.; Bai, Y.; Garcia, E.A.; Li, S. ADASYN: Adaptive Synthetic Sampling Approach for Imbalanced Learning. In Proceedings of the 2008 IEEE International Joint Conference on Neural Networks (IEEE World Congress on Computational Intelligence), Hong Kong, China, 1–8 June 2008; pp. 1322–1328. [Google Scholar]
  19. Ma, L.; Fan, S. CURE-SMOTE algorithm and hybrid algorithm for feature selection and parameter optimization based on random forests. BMC Bioinform. 2017, 18, 169. [Google Scholar] [CrossRef] [PubMed] [Green Version]
  20. Bolón-Canedo, V.; Alonso-Betanzos, A. Ensembles for feature selection: A review and future trends. Inf. Fusion 2019, 52, 1–12. [Google Scholar] [CrossRef]
  21. Nejatian, S.; Parvin, H.; Faraji, E. Using sub-sampling and ensemble clustering techniques to improve performance of imbalanced classification. Neurocomputing 2018, 276, 55–66. [Google Scholar] [CrossRef]
  22. Parvin, H.; Mirnabibaboli, M.; Alinejad-Rokny, H. Proposing a classifier ensemble framework based on classifier selection and decision tree. Eng. Appl. Artif. Intell. 2015, 37, 34–42. [Google Scholar] [CrossRef]
  23. Minaei-Bidgoli, B.; Asadi, M.; Parvin, H. An ensemble based approach for feature selection. Eng. Appl. Neural Netw. 2011, 363, 240–246. [Google Scholar]
  24. Li, F.L.; Zhang, X.Y.; Zhang, X.Q.; Du, C.L.; Xu, Y.; Tian, Y.C. Cost-sensitive and hybrid-attribute measure multi-decision tree over imbalanced datasets. Inf. Sci. 2018, 422, 242–256. [Google Scholar] [CrossRef]
  25. Qian, Y.; Liang, Y.; Li, M.; Feng, G.; Shi, X. A resampling ensemble algorithm for classification of imbalance problems. Neurocomputing 2014, 143, 57–67. [Google Scholar] [CrossRef]
  26. Kang, P.; Cho, S. EUS SVMs: Ensemble of Under-Sampled SVMs for Data Imbalance Problems. In Proceedings of the International Conference on Neural Information Processing, Hong Kong, China, 3–6 October 2006; Springer: Berlin/Heidelberg, Germany, 2006; pp. 837–846. [Google Scholar]
  27. Lu, W.; Li, Z.; Chu, J. Adaptive ensemble undersampling-boost: A novel learning framework for imbalanced data. J. Syst. Softw. 2019, 132, 272–282. [Google Scholar] [CrossRef]
  28. Sun, B.; Chen, H.; Wang, J.; Xie, H. Evolutionary under-sampling based bagging ensemble method for imbalanced data classification. Front. Comput. Sci. 2017, 12, 331–350. [Google Scholar] [CrossRef]
  29. Barandela, R.; Valdovinos, R.M.; Sánchez, J.S. New applications of ensembles of classifiers. Pattern Anal. Appl. 2003, 6, 245–256. [Google Scholar] [CrossRef]
  30. Wang, S.; Yao, X. Diversity Analysis on Imbalanced Data Sets by Using Ensemble Models. In Proceedings of the IEEE Symposium on Computational Intelligence and Data Mining, Nashville, TN, USA, 30 March–2 April 2009. [Google Scholar]
  31. Chawla, N.V.; Lazarevic, A.; Hall, L.O.; Bowyer, K.W. SMOTEBoost: Improving Prediction of the Minority Class in Boosting. In Proceedings of the European Conference on Principles and Practice of Knowledge Discovery in Databases, Cavtat-Dubrovnik, Croatia, 22–26 September 2003; Springer: Berlin/Heidelberg, Germany, 2003; pp. 107–119. [Google Scholar]
  32. Seiffert, C.; Khoshgoftaar, T.M.; Hulse, J.V.; Napolitano, A. RUSBoost: A hybrid approach to alleviating class imbalance. IEEE Trans. Syst. Man Cybern. Part A Syst. Hum. 2010, 40, 185–197. [Google Scholar] [CrossRef]
Figure 1. The process of K-means. (a) An original dataset; (b) randomly selecting two points as cluster centroids; (c) updating cluster centroid; (d) determining the final cluster centroids and two sub-clusters after iterations.
Applsci 10 01684 g001aApplsci 10 01684 g001b
Figure 2. Average Silhouette Coefficient curve.
Applsci 10 01684 g002
Figure 3. The procedure of EKR (The ensemble framework based on K-means and resampling).
Applsci 10 01684 g003
Figure 4. Precision, Recall, and F1-score for the positive samples of 16 datasets.
Applsci 10 01684 g004
Figure 5. Precision, Recall, and F1-score for the negative samples of 16 datasets.
Applsci 10 01684 g005
Figure 6. Precision, Recall, and F1-score for the overall samples of 16 datasets.
Applsci 10 01684 g006
Figure 7. Area under curve (AUC) comparisons of four baseline models and EKR.
Applsci 10 01684 g007
Figure 8. The Nemenyi test results. CD = 1.525.
Applsci 10 01684 g008
Figure 9. (a) AUC comparison of different k-values on D1–D4; (b) AUC comparison of different k-values on D5–D8; (c) AUC comparison of different k-values on D9–D12; (d) AUC comparison of different k-values on D13–D16.
Applsci 10 01684 g009
Table 1. Summary of 16 imbalanced datasets.
#No.#Datasets#Features#SamplesIRk-Value
D1Pima97681.873
D2Vehicle2188462.883
D3Vehicle0188463.254
D4Ecoli173363.363
D5Glass692146.383
D6Page-blocks01054728.793
D7Yeast-2_vs_485149.085
D8Vowel099889.983
D9Glass2921411.594
D10Shuttle-c0-vs-c49182913.875
D11Glass4921415.473
D12Ecoli4733615.83
D13Yeast-1-4-5-8_vs_7869322.14
D14Yeast48148428.414
D15Yeast58148432.735
D16Yeast68148441.45
Table 2. Confusion matrix.
Confusion MatrixPredicted Labels
PositiveNegative
Actual labelsPositiveTPFN
NegativeFPTN
True Positive (TP) is the number of positive samples predicted as “positive.” False negative (FN) is the number of positive samples predicted as “negative.” False positive (FP) is the number of negative samples predicted as “positive.” True negative (TN) is the number of negative samples predicted as “negative.”
Table 3. Classification performance of EKR with different base classifiers.
DatasetsBase Classifiers Used by EKR
SVMNaïve BayesKNNC4.5
AccF1GMAUCAcc F1GMAUCAcc F1GMAUCAcc F1GMAUC
D10.71970.68070.72570.75200.70500.67100.70200.73300.72940.68240.74300.76150.72550.69000.74140.7594
D20.93140.86650.94690.96800.92200.85500.94500.96400.91240.84970.93020.95270.94130.86700.95100.9706
D30.98110.94470.96240.98800.94900.93700.94600.94500.97550.94290.95060.96210.97920.94500.95990.9914
D40.84030.77970.88760.91400.81400.71900.86900.87800.84440.78010.89110.89670.85290.78600.91220.9267
D50.93410.85850.93650.93800.85300.83400.91100.91500.89200.82300.89720.89930.92860.86100.93570.9409
D60.94930.84830.92400.93400.95300.85600.93400.93500.95720.85940.93590.94840.96380.87200.94670.9573
D70.90220.85440.92150.94000.88400.84200.93300.93600.93070.86180.93720.93830.92540.85300.92770.9326
D80.93550.89810.94170.96300.92900.89500.93800.95400.92580.88740.93850.94880.94110.91000.93690.9640
D90.68220.63080.73460.77300.65900.58600.70700.74500.67400.64840.72250.76180.68360.64700.73580.7683
D101.00001.00001.0001.00000.99700.98100.99900.99900.99670.97630.99450.99431.00001.00001.00001.0000
D110.83940.74160.87970.91400.82200.75500.87600.91300.83430.73880.86280.91150.84240.75300.89310.9212
D120.89710.81920.92590.94500.85100.79000.91700.92100.91180.83600.93120.95310.90760.83800.93660.9519
D130.53960.42830.65470.67100.51500.41000.64900.66000.50360.41240.63640.65070.53320.43200.65870.6826
D140.82830.67980.85480.87300.80800.67200.84300.87200.79120.66390.86100.86970.84050.68600.87410.8798
D150.92910.6930.96290.96900.92600.67800.96100.96200.91580.67950.95380.95660.93340.71800.96510.9770
D160.87480.50430.89120.89400.89600.51300.88500.89100.85190.48620.87690.87150.87870.51600.88810.8846
Ave.0.86150.76420.88440.90200.84300.75200.87600.88900.85290.75900.87890.89230.86730.77400.89400.9068
Winner41541100322210141112

