Abstract
The mobility of data factors and the adoption of a collaborative innovation framework are key drivers influencing the gaps in total factor productivity (TFP) among enterprises in the digital economy. Using panel data from Chinese A-share listed companies between 2006 and 2022, this study empirically demonstrates how data factor flow reduces TFP gaps. The findings reveal that data factor flow enhances TFP convergence by facilitating knowledge diffusion, improving information transmission, and boosting innovation efficiency. However, the heterogeneity in enterprise RD efforts limits this convergence effect, highlighting the importance of collaborative innovation. The study further shows that the impact of data factor flow is more significant in smaller, privately owned enterprises in the eastern regions and in industries with low to high technology intensity and high market concentration. Key insights include (1) a positive synergy between government data openness policies and enterprise data flow, which reinforces the narrowing of TFP gaps; (2) a nonlinear relationship between data flow and TFP gaps, suggesting an optimal range for its maximum impact. The study concludes that an integrated framework optimizing both data governance and collaborative innovation ecosystems can foster innovation diffusion and support productivity-based competition. These findings provide valuable insights for innovation policy formulation and strategic decision-making in the digital economy.
Keywords:
data factor flow; inter-enterprise productivity gap; collaborative innovation; panel threshold model JEL Classification:
O33; O47; R11; C23; O18
1. Introduction
As the world’s second-largest economy, China is committed to shifting from extensive, factor-driven growth toward high-quality development characterized by higher efficiency, innovation-driven upgrading, and more balanced growth. Enterprises, as the fundamental units of economic activity, play a central role in driving this high-quality transformation. Total Factor Productivity (TFP), widely recognized as a critical indicator for evaluating resource allocation efficiency, has been regarded as a benchmark for assessing economic development quality (Krugman, 1999). However, significant gaps in TFP levels persist across Chinese enterprises, with issues of unbalanced and inadequate growth remaining prominent.
Simultaneously, rapid advancements in digital technologies have propelled the digital economy’s expansion. According to the China Digital Economy Development Research Report (2024), the digital economy in China grew 3.8-fold between 2002 and 2023, outpacing GDP growth during the same period. Big data, as a foundational and strategic new production factor within the digital economy, has integrated into production systems, thereby driving technological and economic paradigm shifts (Lema & Perez, 2024) and fostering economic growth (Goldfarb & Tucker, 2019). This integration also enables enterprises to enhance quality and efficiency, facilitating their advancement along the mid-to-high segments of the value chain. Recent profound transformations in production methods and economic operation modes have created a conducive environment for data factor flow to realize its value creation potential. The “Data Factor ×” Three-Year Action Plan (2024–2026) emphasizes promoting data circulation and improving data utilization efficiency, supporting data factor flow beyond resource constraints, and facilitating the efficient movement of information, talent, and capital, thereby stimulating productivity effects derived from data factors. The plan, jointly issued by the National Data Administration and multiple ministries, aims to leverage the “multiplier effect” of data factors by expanding application scenarios and improving mechanisms for data circulation and utilization across key sectors. Nevertheless, heterogeneity in resource endowments, innovation diffusion, and industrial policy support has led to a bifurcation of enterprise productivity into frontier and non-frontier groups. In this study, frontier firms are defined as those with the highest annual TFP, and non-frontier firms refer to all other firms observed in the same year.
Accordingly, this study addresses two research questions: Does data factor flow contribute to narrowing enterprise productivity gaps (i.e., promoting productivity convergence)? Through which channels—especially collaborative innovation-related mechanisms and policy complementarity—does data factor flow affect productivity gap dynamics? This study aims to address these questions. The existing literature primarily focuses on digital transformation and its impact on TFP improvement, emphasizing the role of digital technologies in enhancing productivity; however, the role of data factor flow within a collaborative innovation framework, particularly its effects on TFP and productivity gaps, remains underexplored.
Since Solow (1957) introduced the concept of Total Factor Productivity (TFP), it has remained a central topic in academic literature, with the reduction in productivity gaps becoming a core focus of research in this field. From a cross-national perspective, gaps in information technology penetration and economic globalization have been identified as key factors explaining the TFP gap between OECD economies and the United States (Ng & Ng, 2016), with mismatches in technology and capabilities also playing a significant role (Acemoglu & Zilibotti, 1998). From an industry-level viewpoint, TFP growth is closely linked to technological catch-up between old and new technologies and is significantly shaped by developments at the technological frontier (Mc Morrow et al., 2008, 2010). Importantly, this perspective highlights that productivity dynamics are driven not only by frontier expansion but also by the ability of non-frontier firms to narrow the gap through catch-up processes, which provides a conceptual basis for our focus on productivity gap convergence. In this process, growth in leading countries often plays a dominant role (Radicic et al., 2023).
While macro-level and industry-level studies tend to concentrate on productivity gaps in relation to the ‘frontier’ and ‘technology’, the determinants of enterprise-level productivity gaps remain an open question. Autor et al. (2020) attribute the widening productivity gap among enterprises to the rise in ‘superstar enterprises’, characterized by increased industry concentration and shifts in labor share. This perspective is supported by research emphasizing the complementary relationship among digitalization, R&D activities, and product innovation (Torrent-Sellens et al., 2022). Both Song et al. (2025) and Chu et al. (2025) show that digital transformation improves total factor productivity, with Chu et al. highlighting the role of green innovation in enhancing ESG performance, while Song et al. emphasizing ESG performance as an important channel for improving TFP. Additionally, studies suggest that formalization helps reduce the productivity gap between formal and informal micro-enterprises (Gutierrez & Rodriguez-Lesmes, 2023). Importantly, the widening productivity gap is not due to shortcomings of frontier enterprises but rather stems from the inability of non-frontier enterprises to approach the productivity frontier owing to challenges in innovation diffusion (Berlingieri et al., 2017; Cette et al., 2016). Therefore, investigating the relationship between data factor flow and enterprise productivity gaps within a collaborative innovation framework is of particular importance.
Data, as a strategic resource, is increasingly recognized for its continuously unfolding value. It serves as a new driving force for economic development and industrial revitalization. Data factors not only reduce enterprises’ information acquisition costs and mitigate information asymmetry (Cong et al., 2022), but also generate synergistic effects among production factors (Yang et al., 2023), thereby enhancing both external transaction efficiency and internal resource allocation within enterprises (Dai et al., 2024). Furthermore, improvements in data processing can reduce risks and uncertainties associated with production activities (Farboodi & Veldkamp, 2020). While traditional factor mobility contributes to improved allocation efficiency (X. Huang et al., 2017), the mobility of data as a production factor plays a critical role in enterprise production by fostering knowledge accumulation and technological innovation, lowering consumer privacy costs, and promoting data reuse (Cong & Mayer, 2023), ultimately boosting enterprise productivity. Data-driven green innovation, as highlighted by Ma et al. (2025), also plays a key role in reducing carbon emissions while enhancing productivity. Related studies have demonstrated the productivity effects of various manifestations of the digital economy from different perspectives, including computational power deployment (Xu et al., 2025) and artificial intelligence applications (R. Huang et al., 2024). Among these, digital transformation has attracted the most attention: Cheng et al. (2023) clarified the productivity impacts of digital transformation in traditional industries, while Aly (2022) explored its effects on enterprise-level total factor productivity in developing countries. This raises the question of whether, when data factor flow is fully leveraged, non-frontier enterprises can achieve economies of scale in productivity to catch up with or converge toward frontier enterprises. In the process of transforming raw data into productive inputs, firms may restrict sharing and hoard data to protect competitive advantage and reduce the risk of being displaced by data-enabled imitation—an instance of creative destruction in which new data-driven innovations can erode incumbents’ rents (Jones & Tonetti, 2020). Such strategic withholding can lead to underutilization of data that would otherwise be reusable and non-rival. The diversity and complexity of such regulatory measures constrain the value of data factor flow, underscoring the practical significance of investigating how to overcome barriers to data factor flow.
Investigating the relationship between data factor flow and enterprise productivity gaps provides a critical lens for assessing whether digital economy development promotes inclusive and balanced growth rather than reinforcing performance disparities among firms. While a growing body of literature links digital economy development to productivity improvement, relatively limited attention has been paid to how data-related mechanisms shape productivity gaps and convergence dynamics across heterogeneous enterprises. To address this gap, this study conducts an enterprise-level empirical analysis based on panel data from Chinese A-share listed firms over the period 2006–2022. By focusing on productivity gaps and explicitly examining data factor flow and its interaction with institutional and innovation-related mechanisms, the study advances existing research beyond level-based productivity analyses and offers three interrelated marginal contributions.
First, this study provides enterprise-level evidence on the relationship between data factor flow and productivity gap dynamics, complementing prior macro- and industry-level work that has paid relatively limited attention to firm-level disparities (e.g., Ng & Ng, 2016; Mc Morrow et al., 2010; Radicic et al., 2023; Gutierrez & Rodriguez-Lesmes, 2023). It further examines whether government data openness strengthens this association, offering a policy-relevant extension to the digital economy–productivity literature (Zheng et al., 2024).
Second, the paper extends mechanism-based explanations by framing data factor flow as a cross-firm circulation process and examining its role within a collaborative innovation framework. Specifically, we operationalize collaborative innovation through measurable channels—information transmission, knowledge diffusion, and innovation efficiency/autonomous innovation—which map directly to the mediating variables in our empirical model (Chesbrough, 2003; Guo & Li, 2025; A. Zhang & Sun, 2025).
Third, the study explores heterogeneity in the effect of data factor flow by testing potential nonlinearities under China’s institutional context. Using threshold effect models, we document an “optimal interval” pattern and related spillover features, providing additional nuance beyond linear specifications commonly used in firm-level analyses (Gao et al., 2025).
Our empirical evidence is based on Chinese A-share listed firms (2006–2022); conclusions should be interpreted within this sample scope.
2. Theoretical Analysis
2.1. Analytical Framework
This study is theoretically anchored in the resource-based view (RBV) as the overarching grand theory and is complemented by information economics (Stiglitz, 2000) and endogenous growth theory (Romer, 1990) to explain how data factor flow affects productivity gap convergence. Building on the resource-based view (RBV) (Barney, 1991), firm performance differences are traditionally attributed to the possession of strategic resources. In the digital economy, the nature of such resources has evolved. Data is characterized by non-rivalry, scalability, and strong complementarities, and its value increasingly depends on mobility and cross-organizational utilization rather than exclusive ownership. Recent studies extend the RBV by conceptualizing data and digital capabilities as strategic resources whose productivity effects rely on effective allocation and inter-firm circulation (Jones & Tonetti, 2020).This perspective is further supported by recent meta-analytic evidence showing that knowledge-based resources exhibit the strongest and most consistent association with firm performance outcomes, outperforming other types of strategic resources and serving as a foundational asset that enhances the value of complementary resources (Bergh et al., 2025).
Enterprise productivity gaps manifest primarily between frontier and non-frontier enterprises. Data, as a zero-cost mobile factor, can directly facilitate productivity catch-up for non-frontier enterprises by enhancing resource allocation efficiency, improving production functions, expanding economies of scale, and generating technological spillover effects. Within the neoclassical economic framework, information flow is regarded as a crucial factor in improving market efficiency and reducing resource misallocation (Stiglitz, 2000). The mobility of data factors enables resource sharing and information convergence, alleviating information asymmetry, thereby assisting enterprises in more effective resource allocation and optimizing production decisions.
Under conditions of information flow, the barriers for non-frontier enterprises to access market information and technological resources are lowered, allowing them to acquire external technologies, production techniques, and managerial experience. This corresponds to technological progress in the production function. According to externality theory, technological advancement and innovation can diffuse across enterprises within and beyond industries via data factor flow. Openness and sharing of data promote knowledge dissemination and accelerate technology adoption, such that technological progress is no longer confined to frontier enterprises. Consequently, small- and medium-sized enterprises in non-frontier positions can adopt more advanced production methods and improve innovation performance.
Chesbrough (2003) provides the foundational theoretical rationale for open innovation, emphasizing that cross-organizational knowledge flows are essential for enhancing innovation performance, which directly informs our conceptualization of collaborative innovation as a key channel through which data factor flow facilitates productivity convergence. With digitalization, open innovation has evolved toward a data-driven collaborative model, where data sharing, digital platforms, and network infrastructures play a central role. Recent empirical evidence further shows that collaborative innovation systems exhibit clear convergence dynamics, with performance gaps gradually narrowing over time through knowledge diffusion and technological spillovers (Fan et al., 2025).
Simultaneously, the mobility of data factors helps non-frontier enterprises reduce costs arising from information asymmetry and contract enforcement in market transactions through internal organizational coordination. This enables more efficient alignment of internal resources and market exchanges, allowing enterprises to benefit from economies of scale and achieve cost advantages (Williamson, 1975), thus enhancing production capacity. Against this backdrop, promoting data factor flow constitutes an effective pathway to narrowing productivity gaps.
These grand-theory foundations jointly motivate the hypotheses by linking data factor flow (as a strategic and mobile resource) to reduced information frictions, knowledge diffusion, and collaborative innovation, thereby facilitating productivity catch-up for non-frontier firms. Overall, this study extends classic resource-based and open innovation theories within the digital economy by conceptualizing data factor flow as the mechanism linking resource heterogeneity and collaborative innovation. By integrating data governance, inter-firm collaboration, and productivity convergence into a unified framework, this paper bridges foundational theory with contemporary research on digital transformation.
In this study, “collaborative innovation models” refer to organized patterns of innovation collaboration in which firms exchange information and knowledge, coordinate complementary resources, and jointly generate or adopt technologies across organizational boundaries. Such collaboration can take multiple forms in practice, including R&D alliances and joint projects, platform- or ecosystem-based collaboration enabled by digital infrastructures, supply-chain innovation partnerships, and industry–university–research cooperation. Our empirical focus is not on classifying organizational forms, but on the collaborative innovation process through which data factor flow facilitates cross-firm interaction and diffusion. Accordingly, we operationalize the collaborative innovation framework using observable firm-level channels that capture (i) information transmission, (ii) knowledge diffusion, and (iii) innovation efficiency/innovation-driven performance, which map directly to the mediating variables tested in Section 4.6.
The theoretical framework of this study is presented in Figure 1. Solid arrows denote direct and mediating effects, whereas dashed arrows represent moderating and threshold effects.
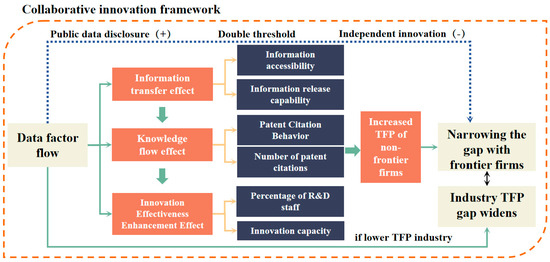
Figure 1.
Analytical Framework of Data Factor Flow and enterprise Productivity Gap.
2.2. Mathematical Derivation
2.2.1. Direct Effects of Data Factor Flow on Enterprise Productivity Gap
Consumer Preferences and Inverse Demand
We assume the market consists of heterogeneous consumer groups, where consumer preferences are a linear combination of differentiated products. Given the substitutability between different products in the market, this section will provide a detailed derivation of the relationship between consumer demand and price. Suppose there are n homogeneous consumers in the market, and their preferences for a set of differentiated products are represented by a linear–quadratic form (Song et al., 2025):
where sents the consumption quantity of the variety, , , denotes the preference and substitution parameters, and is the exogenous benchmark product. By maximizing utility, we derive the firm’s inverse demand function, which describes the relationship between product price and sales volume:
In the equation, represents the price, is the number of product varieties in the market, is the number of product categories, and denotes the average price. This inverse demand function reveals how price affects demand in a competitive market with multiple products, and is closely related to the competitive intensity of other products in the market. In other words, and together determine the intensity of market competition and influence the firm’s marginal revenue.
Enterprise Production and Data Factor Flow
This paper adopts a Cobb–Douglas production function for the enterprise, considering the inputs of capital and labor. The output of enterprise can be expressed as:
where and represent capital and labor inputs, respectively, and is the total factor productivity (), which depends on the data flow level and the enterprise’s internal data utilization intensity . Here, data flow not only directly impacts the enterprise’s production efficiency but also enhances its productivity by promoting the effective use of data. To describe the relationship between data flow and enterprise productivity, we assume the impact of data flow on productivity takes the following form:
where represents the response coefficient of data flow to enterprise productivity, which increases as rises, indicating that the enterprise’s efficiency in utilizing data improves. represents the enterprise’s internal management and technology utilization level. indicates that more abundant data flow amplifies the impact of a given unit of on productivity, thereby increasing the absorptive capacity. The fixed costs include , the entry cost, and data utilization involves convex costs.
In Equation (5), can represent either the market size or the ability to share fixed costs due to network externalities.
Profit Maximization and Entry Barriers
Considering the profit-maximizing behavior of the enterprise, the profit function of enterprise can be expressed as:
where represents the unit cost, is the fixed entry cost, and is the fixed cost of data utilization. By maximizing profit, we can derive the optimal data utilization intensity and further derive the entry threshold condition for market entry. At this point, the enterprise’s productivity gap is not only determined by the inputs of capital and labor but also influenced by data flow. To solve for the optimal data utilization level, we differentiate the profit function with respect to , yielding:
Under the “small response” approximation , the optimal data utilization is given by:
By deriving from , we obtain . Substituting back into the profit function and applying the zero-profit entry condition , we obtain the entry threshold condition:
Data flow improves and reduces effective costs, thereby relaxing the entry constraint.
TFP Gap and Comparative Static
The TFP gap is defined as the ratio of the total factor productivity (TFP) between two firms. It can be further derived as follows:
where and represent the total factor productivity (TFP) of firms and at the data flow level s, respectively. and represent the response capabilities of firms and to data flow, i.e., the sensitivity to data flow. and represent the data utilization levels of firms and , respectively.
In comparative static analysis, we focus on how the TFP gap changes with data flow. First, by deriving the optimal data utilization level through the profit maximization condition, we find that it increases as data flow increases (). Next, the TFP gap is defined as the ratio of the total factor productivity between firm and firm . By differentiating the TFP gap formula with respect to data flow , we conclude that data flow accelerates the productivity improvement of non-frontier firms, especially when the response capability of non-frontier firms is strong. As a result, the TFP gap will gradually narrow (). Therefore, data flow not only directly boosts enterprise productivity but also accelerates the catch-up of non-frontier firms by improving data utilization efficiency. Based on this, we propose Hypothesis 1:
Hypothesis 1.
Data factor flow contributes to the improvement of enterprise total factor productivity and the narrowing of productivity gaps between enterprises.
2.2.2. Indirect Effects of Data Factor Flow on Enterprise Productivity Gap
As a key production factor in the modern economy, data factor flow influences enterprise productivity gaps through a multifaceted and complex mechanism. First, in the data economy, transactions of goods and services generate information that can be stored, traded, and depreciated (Farboodi & Veldkamp, 2021). High-quality information positively impacts enterprise performance (Fosso et al., 2019). Data flow alleviates information asymmetry, enhances Pareto efficiency in resource allocation, and facilitates the effective circulation of production factors among enterprises (Stiglitz, 2017). Timely information transmission not only optimizes enterprise decision-making processes but also reduces the lag costs faced by non-frontier enterprises in responding to market changes, thereby narrowing the productivity gap with frontier enterprises. Second, knowledge diffusion, as a carrier of technological spillovers, is realized through data sharing across organizations and regions. This enhances non-frontier enterprises’ absorptive capacity and technological imitation abilities, accelerating their technological advancement (Cohen & Levinthal, 1990). Finally, from the perspective of endogenous growth theory, data flow stimulates collaborative innovation mechanisms that overcome the innovation bottlenecks of individual enterprises. Through open innovation platforms, it strengthens R&D collaboration and knowledge integration, accelerating the diffusion and application of technological innovations (Teece, 1986; Baldwin et al., 2024). These three effects jointly form a dynamic feedback loop, promoting synchronous technological and innovation diffusion, which drives the productivity convergence of non-frontier enterprises toward frontier enterprises, achieving spatial and structural equilibrium in productivity. Based on this, data factor flow is not only a critical variable in information economics but also a core mechanism driving productivity convergence in innovation and organizational economics.
From a mathematical perspective, building upon Hypothesis 1, data factor flow not only directly improves cost efficiency but also indirectly influences the convergence of the TFP gap by enhancing external information and knowledge environments. Based on the research context of this paper, we summarize the mechanisms as information transmission , knowledge diffusion , and innovation-driven mechanisms , and incorporate these three mechanisms into the enterprise’s total factor productivity (TFP) function:
where represents the firm’s response capability to mechanism ; represents the efficiency of the mechanism, which increases as data flow rises, with .
Next, substituting Equation (11) into the TFP gap Formula (10) gives Equation (12), and differentiating with respect to yields Equation (13). The expressions for Equations (12) and (13) are:
By differentiating the TFP gap formula, we can obtain the sensitivity of the TFP gap to data flow and analyze how data flow impacts the productivity differences between firms. Specifically, when non-frontier firms have a stronger absorptive capacity in a certain mechanism , data flow accelerates the convergence of the productivity gap . In the static model, the stable state of the TFP gap depends on each firm’s response capability to data flow. The final stable TFP gap is represented as . If = , the productivity gap remains at a fixed value. If ≠ , the productivity gap between the two firms converges to 1. If considering a dynamic model and incorporating the time variable , the same derivation can be made to yield the same conclusions. Based on this, we propose Hypothesis 2a:
Hypothesis 2a.
Data factor flow improves information transmission efficiency, promotes knowledge diffusion, and enhances innovation capability, thereby enabling non-frontier enterprises to increase productivity and narrow the productivity gap with frontier enterprises.
Although enterprise autonomous innovation contributes to the improvement of technological capabilities, it inhibits the role of data factor flow in narrowing productivity gaps. First, from a resource competition perspective, innovation requires substantial scarce resources, and enterprises tend to prioritize internal R&D, reducing their reliance on and utilization of external data. This weakens the sharing effects of data flow and obstructs resource convergence (Barney, 1991). Second, due to technological path dependence and intellectual property protection, frontier enterprises restrict the diffusion of technology and data through patents and other means, limiting data openness and suppressing technological spillovers to non-frontier enterprises (Arthur, 1989; Levin et al., 1987). Third, information asymmetry and innovation uncertainty cause enterprises to be cautious in data sharing, diminishing the positive incentives associated with data flow and hindering the absorption of advanced technologies by non-frontier enterprises (Cohen & Levinthal, 1990). Finally, excessive emphasis on autonomous innovation may lead to decreased efficiency in the allocation of innovation resources, weakening the economies of scale and collaborative innovation potential generated by data flow (Teece, 1986). In summary, under the influences of resource constraints, property rights protection, and information mechanisms, enterprise autonomous innovation negatively moderates the positive effect of data factor flow on narrowing productivity gaps, reflecting an intrinsic contradiction between autonomous innovation strategies and data sharing.
From a mathematical perspective, we introduce a negative adjustment factor to represent the effect of enterprise independent innovation on data flow dynamics. This factor weakens the productivity-enhancing effect brought about by data flow. Specifically: represents the degree to which the factor A weakens the positive effect of data flow on productivity. When , there is no interference from innovation. When , innovation completely hinders the effect of data flow and data flow no longer has any positive effect on productivity.
Considering the impact of enterprise independent innovation, we adjust the productivity model by introducing an adjustment factor to represent the negative moderating effect of innovation on the convergence of the TFP gap. The adjusted enterprise productivity function is as follows:
This means that independent innovation weakens the impact of data flow on productivity. The larger the value of , the more the positive effect of data flow is suppressed. In other words, as the level of innovation increases, firms are less reliant on external data flow, thereby diminishing the productivity gains that data flow can bring. Based on this, Hypothesis 2b is proposed:
Hypothesis 2b.
Enterprise autonomous innovation negatively moderates the effect of data factor flow on narrowing enterprise productivity gaps.
The framework of the research hypotheses in this study is summarized in Figure 2.
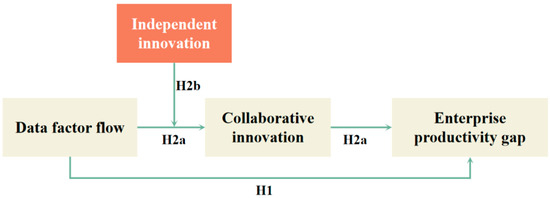
Figure 2.
Research Hypotheses Framework.
3. Research Design
3.1. Model Specification
To scientifically identify the causal relationship between data factor flow and enterprise productivity gap, this study constructs the following econometric model for estimation:
where denotes the enterprise productivity gap, and represents the degree of data factor flow. includes control variables at the enterprise and city levels relevant to this study. represents enterprise-level individual fixed effects, denotes the interaction term between provincial fixed effects and enterprise fixed effects, is the time fixed effect, and is the random error term. Robust standard errors are clustered at the enterprise level. The coefficient of primary interest is , which is expected to be negative, indicating that data factor flow narrows the enterprise productivity gap.
3.2. Variable Definitions and Descriptions
3.2.1. Dependent Variable: Enterprise Productivity Gap
Drawing on related studies measuring county-level productivity gaps (Gong, 2022; G. Zhang et al., 2024) and enterprise-level productivity gaps (Zheng et al., 2024), this paper defines the enterprise productivity gap as the ratio of the total factor productivity (TFP) of frontier enterprises to that of individual enterprises. Frontier enterprises are defined as those with the highest annual TFP. For clarity, the construction of the dependent variable is summarized in Table 1.

Table 1.
TFP measurement method.
Regarding TFP measurement, various methods exist in the literature and differ in applicability and accuracy. Traditional approaches such as Ordinary Least Squares (OLS) and Fixed Effects (FE) are operationally straightforward but do not adequately address the endogeneity between inputs and productivity, potentially resulting in systematic bias (Wang & Lu, 2019). The Generalized Method of Moments (GMM) can mitigate endogeneity issues, yet its performance depends heavily on the length of panel data, which may limit its suitability in short panels (Lu & Lian, 2012). In contrast, the Levinsohn–Petrin (LP) and Olley–Pakes (OP) methods offer notable advantages. The LP method introduces intermediate inputs as proxies for productivity, avoiding sample loss caused by excluding zero-investment enterprises in the OP approach and mitigating potential survival bias (Levinsohn & Petrin, 2003). The OP method uses firms’ dynamic investment behavior and semi-parametric estimation to better capture time-varying productivity (Olley & Pakes, 1992). Based on these considerations and common practice in the literature, this study adopts the LP method as the baseline estimator and uses the OP method for robustness checks, constructing _LP and _OP, respectively.
3.2.2. Key Explanatory Variable: Data Factor Flow
To scientifically measure the impact of data factor flow on enterprises, this study adopts a composite index construction method. It integrates two dimensions: policy regulation intensity (Regulation) and enterprise digital capability (Digital) (Gao et al., 2025). The degree of data factor flow is quantified as the product of (1 − data policy regulation intensity) and the extent of enterprise digital transformation, as shown in Equation (9). The measurement process is illustrated in Figure 3.
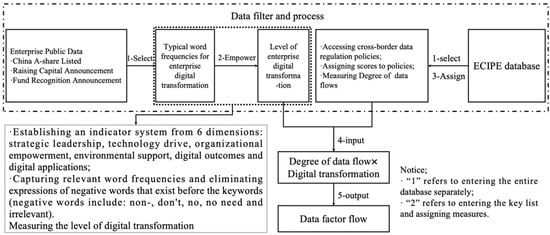
Figure 3.
Schematic Diagram of Quantitative Method for Assessing Data Factor Flow.
The measurement logic of this approach is scientifically grounded. The policy-regulation component (Regulation) is proxied by the Digital Trade Restrictiveness Index (DTRI) from ECIPE’s Digital Trade Estimates (DTE) project, which provides a structured inventory and scoring of digital-trade related regulatory measures covering multiple policy domains (e.g., restrictions relevant to data movement and use, establishment requirements, and other digital trade frictions). A higher DTRI indicates a more restrictive institutional environment and thus stronger barriers to data circulation. Accordingly, we use (1 − DTRI) to capture policy openness that is conducive to data factor flow. Importantly, DTRI primarily reflects restrictive barriers to data flows, while pro-circulation policies such as government public data openness are examined separately (Ferracane et al., 2018). Specifically, in Appendix B.1 we introduce a government public data openness measure (Open) and estimate an interaction term DataFlow × Open to test whether institutional data supply complements firm-level data factor flow in narrowing productivity gaps.
3.2.3. Control Variables
This study draws on existing research (Ren et al., 2023; Cheng et al., 2023) and selects control variables at both the enterprise and city levels. The enterprise-level control variables include: debt-to-asset ratio, return on equity, gross profit margin, cash flow ratio, board size, proportion of independent directors, CEO duality, ownership concentration, and enterprise age. The city-level control variables comprise: average annual number of employees, fixed investment level, degree of government intervention, industrial structure, human capital level, financial development, and healthcare provision. The detailed definitions of the variables are presented in Table 2.
Table 2.
Descriptive Statistics of Variables.
3.3. Sample Selection and Data Sources
This study utilizes an unbalanced panel dataset of Chinese A-share listed companies from 2006 to 2023, excluding samples marked as ST or ST* due to their limited reference value. Financial data at the enterprise level were sourced from the China Stock Market & Accounting Research (CSMAR) database. The degree of enterprise digital transformation was derived through text mining of annual reports. The China Digital Trade Restriction Index was obtained from the European Center for International Political Economy (ECIPE). Patent and R&D data were collected from the China National Research Data Service (CNRDS) database, while employee structure data were acquired from the WIND database. Other control variables were drawn from the CSMAR database and enterprises’ annual reports.
4. Empirical Results and Analysis
4.1. Trend Analysis
Figure 4 illustrates the trend of average TFP gaps between enterprises with high and low levels of data factor flow from 2006 to 2022. The figure shows that enterprises in the high data factor flow group generally exhibit higher productivity gaps compared to those in the low flow group, with gaps widening in certain years. This preliminary observation suggests a complex relationship between data factor flow and enterprise productivity gaps. Notably, after 2019, the productivity gap in the high data factor flow group narrows below that of the low flow group. A possible explanation is that although enterprises with high data flow initially display larger productivity gaps, over time, data factor flow facilitates resource mobility that enables low-productivity enterprises to rapidly improve efficiency, leading to productivity convergence. It is important to emphasize that the trend depicted in the figure is descriptive and does not reveal the causal effect or dynamic mechanisms of data flow on productivity gaps. Therefore, this study proceeds with panel data econometric modeling to rigorously investigate the impact and mechanisms of data factor flow on enterprise productivity gaps, aiming to provide theoretical foundations and empirical evidence to inform relevant policy formulation.
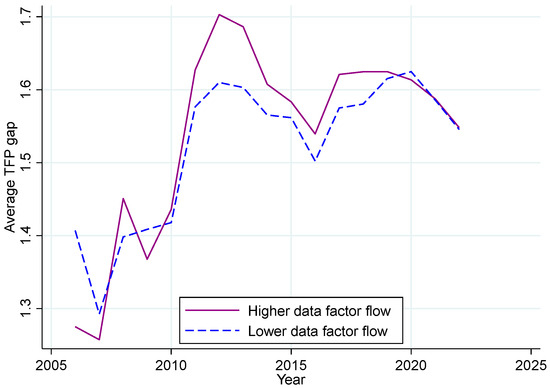
Figure 4.
Annual Trend of Average TFP Gap.
4.2. Overall Impact of Data Factor Flow
Table 3 presents the core findings of this study by analyzing the impact of data factor flow on enterprise productivity gaps using fixed effects models. In Column (1), the coefficient of the key explanatory variable (Data Flow) is significantly positive, which contradicts expectations. To mitigate issues such as autocorrelation and heteroscedasticity, enterprise and year fixed effects were included in Columns (2) and (4), with robust standard errors clustered at the enterprise level. In Column (2), the coefficient of Data Flow passes the significance test at the 1% level, indicating a strong association between data factor flow and enterprise productivity gaps.To further minimize potential confounding effects from other economic and social development factors, Columns (3) and (4) include a series of control variables. The results show that after controlling for these variables and fixed effects, the coefficient of Data Flow becomes negative and remains statistically significant at the 1% level. These results consistently support the hypothesis that data factor flow contributes to narrowing enterprise productivity gaps, thus providing empirical evidence in favor of Hypothesis 1.
Table 3.
Estimation Results of the Impact of Data Factor Flow on Enterprise Productivity Gap.
4.3. Endogeneity Treatment
When examining the impact of data factor flow on narrowing enterprise productivity gaps, endogeneity issues such as omitted variables and bidirectional causality arise. High-productivity enterprises may inherently attract more data factor flow, or unobserved policy and technological environment factors may simultaneously affect both data factor flow and productivity gaps, thereby confounding causal identification. To mitigate estimation bias and accurately capture the true effect of data factor flow, this study employs an instrumental variable approach using two-stage least squares (2SLS). Considering the limited validity of a single instrument, this paper adopts a dual instrumental variable strategy: a spatial instrument based on weighted distances to top-ranked universities in Computer Science and Technology, and an institutional instrument based on the “Broadband China” pilot policy. First, to characterize the exogenous support of technical talent on which enterprise data factor flow relies, we follow Gao et al. (2025) by constructing a spatial instrument based on the geographic association between enterprise office locations and high-quality Computer Science departments at universities. Specifically, we select the Computer Science and Technology discipline rankings from the Ministry of Education’s third national discipline assessment in 2012, and use the discipline scores () of 120 universities combined with the spherical geographic distance () between enterprise offices and university main campuses to create a weighted measure. Given possible talent agglomeration effects and the spatial characteristics of digital knowledge spillovers, the instrument is further adjusted by the number of listed companies in the enterprise’s city () to reflect the actual intensity of regional digital talent supply. This weighting design captures variations in the quality of talent training at universities, where greater distance implies weaker external support for enterprises to access high-quality digital talent, thereby constraining their digital transformation. The instrument, negatively correlated with data factor flow, is defined as () in Equation (10):
Second, in August 2013, the State Council issued the “Broadband China” strategic implementation plan. Subsequently, three rounds of pilot city selections were conducted in 2014, 2015, and 2016, ultimately designating 120 cities as priority development zones for the “Broadband China” strategy demonstration. On one hand, this policy significantly enhanced the conditions for data factor flow by improving network infrastructure, making it strongly correlated with data factor flow. On the other hand, the policy’s formulation and implementation exhibited regional-level uniformity and did not directly target enterprise productivity gaps, satisfying the exogeneity assumption of an instrumental variable. This policy is thus incorporated into the model as an instrumental variable (), where cities designated as “Broadband China” pilot zones are coded as 1, and others as 0.
Table 4 reports the results of estimating the impact of data factor flow on enterprise productivity gaps using the instrumental variable approach (2SLS). The first-stage results indicate that both the spherical distance to universities with strong Computer Science programs and the “Broadband China” pilot policy are significantly positively correlated with data factor flow, conenterpriseing the relevance of these instruments as expected. In the second stage, the estimated coefficient of data factor flow is significantly negative, demonstrating that after controlling for endogeneity, data factor flow significantly contributes to narrowing productivity gaps among enterprises. The LM and Wald-F tests conenterprise the absence of weak instrument problems, while the Durbin–Wu–Hausman (DWH) test fails to reject the null hypothesis of consistency in the OLS estimator, suggesting that endogeneity is not severe. Overall, the instrumental variable selection is appropriate, and the regression results are robust, supporting the causal effect of data factor flow in converging enterprise productivity gaps.
Table 4.
Results of 2SLS Instrumental Variable Test.
4.4. Robustness Checks
Table A1 (Appendix A) reports a series of robustness checks to verify that our baseline result—that data factor flow significantly narrows enterprise productivity gaps—is not driven by specific variable constructions, alternative proxy choices, omitted time-varying regional shocks, dynamic persistence, outliers, or sample composition. Specifically, Columns (1)–(3) replace the dependent variable using alternative definitions of the productivity gap. In Column (1), we re-estimate TFP using the Levinsohn–Petrin method and construct the gap based on TFP_LP (Gap#). In Column (2), we construct the gap as the difference between the frontier firm’s TFP_LP and the focal firm’s TFP_LP (Gap##). In Column (3), we estimate TFP using the Olley–Pakes method and similarly construct the frontier–firm difference (Gap###). The coefficient of Data Flow remains negative and statistically significant across these alternative gap measures.
Columns (4)–(5) replace the core explanatory variable by using alternative text-based measures of firms’ digital transformation to construct data factor flow. Following Wu et al. (2021), Column (4) uses the frequency of 76 digital-related keywords across five dimensions to compute Data Flow#; following Zhao et al. (2021), Column (5) uses 99 digital-related keywords across four dimensions to compute Data Flow##. The estimated effects remain negative and statistically significant under both alternative proxies.
Columns (6)–(9) implement additional robustness tests. Column (6) uses a one-period lag of the core explanatory and control variables to mitigate concerns about contemporaneous reverse causality and examine lagged effects. Column (7) further controls for time-varying regional heterogeneity by adding province fixed effects and province-by-year interaction fixed effects. Column (8) applies a two-sided 1% winsorization to reduce the influence of extreme values. Column (9) excludes firms observed only once to ensure identification from within-firm variation in the fixed-effects setting. Across Columns (6)–(9), the coefficient on data factor flow remains negative and statistically significant, confirming the reliability and stability of our baseline findings.
4.5. Heterogeneity Analysis
4.5.1. Enterprise Heterogeneity
Enterprise Size. Based on the median registered capital, enterprises are classified into large-scale and small-scale enterprises. Results in Columns (1) and (2) of Table A2 and Table A3 (Appendix A) indicate that the effect of data factor flow on narrowing productivity gaps is slightly weaker for large-scale enterprises compared to small-scale ones. Small-scale enterprises often face greater resource constraints, particularly in digital transformation and data utilization. These enterprises tend to rely more heavily on external data to compensate for deficiencies in technology and information, making the marginal effect of data factor flow more pronounced. In contrast, large-scale enterprises generally possess stronger R&D capabilities and data processing capacities, enabling them to independently acquire and utilize data without full dependence on external data factor flow. Therefore, the benefits of data factor flow for large-scale enterprises are relatively smaller, resulting in a weaker convergence effect on productivity gaps.
Ownership Type. Enterprises are classified into state-owned enterprises (SOEs) and private enterprises based on ownership type. Results in Columns (3) and (4) of Table A2 (Appendix A) show that data factor flow has a stronger effect in narrowing productivity gaps among private enterprises compared to SOEs. Private enterprises typically face greater market competition pressure and urgently need to enhance competitiveness by optimizing resource allocation and improving efficiency. Due to their greater flexibility and innovation capacity, private enterprises can more rapidly adapt to external data factor flow, resulting in a stronger convergence effect on productivity gaps. In contrast, SOEs are often constrained by management systems and administrative regulations, leading to potentially centralized or delayed information flow. Although data factor flow can improve efficiency to some extent, institutional constraints may limit its full potential, thereby weakening its effect on productivity gap convergence.
Regional Heterogeneity. Given the varying endowments of digital resources across regions, the sample is divided into eastern, central, and western regions. Columns (5) to (7) reveal that data factor flow has the strongest effect in narrowing productivity gaps in the eastern region, while the convergence effect is relatively weaker in the central and western regions. The eastern region typically benefits from more developed digital infrastructure and market mechanisms, enabling non-frontier enterprises to better leverage opportunities arising from data factor flow. Consequently, enterprises in the eastern region experience a stronger convergence effect on productivity gaps. In contrast, limitations related to resource availability, information access, and technological capacity in the central and western regions may constrain the value realization of data factor flow, resulting in a comparatively weaker convergence effect on productivity gaps.
4.5.2. Industry Heterogeneity
Industry Type. First, this study examines the differential effects of data factor flow on productivity gap convergence between manufacturing and non-manufacturing enterprises. Results in Columns (8) and (9) indicate that, compared to manufacturing, data factor flow exerts a stronger convergence effect on productivity gaps in non-manufacturing sectors. This difference primarily stems from variations in technological dependence and production modes. Manufacturing typically focuses on optimizing raw materials, production equipment, labor, and processes. Although data factor flow can improve supply chain collaboration and production efficiency, its impact on productivity gap convergence is relatively limited. Particularly in traditional manufacturing with lower technological requirements, the marginal effect of data flow is constrained by factors such as equipment upgrades and production line modifications, resulting in weaker convergence effects. In contrast, non-manufacturing industries—especially services and information sectors—rely heavily on data circulation and market feedback. Data factor flow significantly enhances enterprises’ capabilities in information acquisition and resource allocation, leading to a more pronounced convergence effect on productivity gaps. Second, considering the distinction between high-tech and non-high-tech industries, Columns (10) and (11) demonstrate that data factor flow plays a more significant role in non-high-tech industries. This may be attributed to the relative disadvantages of non-high-tech industries in technological accumulation and R&D investment, resulting in greater dependence on external data resources. Conversely, high-tech industries possess stronger inherent innovation capabilities, making the impact of data flow on their productivity gaps comparatively limited. These findings suggest that the effect of data factor flow is industry-specific, highlighting the need for targeted policies that address data resource access and utilization particularly in non-high-tech industries.
Industry Barriers. First, drawing on existing research (Di et al., 2025), this study defines industry skill intensity as the proportion of employees with postgraduate degrees or above within an industry, serving as a proxy for technological entry barriers. Results in Columns (12) and (13) indicate that data factor flow has a stronger convergence effect on productivity gaps in high-skill intensity industries compared to low-skill intensity industries. Enterprises in high-skill intensity sectors typically possess stronger technological innovation and data processing capabilities, enabling them to efficiently absorb and utilize resources facilitated by data flow, thereby significantly enhancing productivity and narrowing productivity gaps. In contrast, enterprises in low-skill intensity industries exhibit weaker dependence on data flow, and thus data factor flow has a smaller impact on productivity gaps. These industries tend to rely more on traditional resource optimization and labor-intensive production methods, where the role of data flow is often supplanted by other factors, resulting in weaker convergence effects. Second, this study calculates the Herfindahl–Hirschman Index (HHI) for each industry to measure industry concentration and divides industries into high- and low-concentration groups based on the median. Columns (14) and (15) show that data factor flow plays a more prominent role in high-concentration industries. In such industries, data factor flow can rapidly disseminate through leading enterprises’ technological advantages and resource integration, enhancing overall industry productivity and thereby narrowing productivity gaps among enterprises. The smaller number of enterprises and higher collaboration efficiency within these industries allow data flow to generate more significant benefits in a shorter period. Conversely, in low-concentration industries, where enterprise numbers are greater and competition is more intense, the benefits of data flow are relatively dispersed, leading to weaker convergence effects on productivity gaps.
4.6. Analysis of Impact Mechanisms Under the Collaborative Innovation Framework
In our setting, these three dimensions constitute the measurable components of the collaborative innovation framework, and the corresponding mediating variables provide an empirical mapping from “collaborative innovation models” to the regression specifications. The baseline regression results indicate that data factor flow has a significant effect on narrowing enterprise productivity gaps, providing preliminary support for Hypothesis 1. However, the underlying mechanisms through which this effect occurs have not yet been empirically tested. Through what specific channels does data factor flow influence enterprise productivity gaps? This section draws on the analytical framework of (Du & Xue, 2024), which examines the mechanisms linking R&D alliances and enterprise productivity. Inspired by their tri-dimensional mechanism design—”information transmission–resource allocation–innovation capability”—this study adapts the framework to the context of data factor flow and enterprise productivity gaps. As established in the theoretical analysis, data factor flow can promote productivity convergence by facilitating knowledge diffusion, enhancing information transmission, and strengthening innovation performance. To empirically examine these mechanisms, we modify Equation (1) and specify a mechanism testing model, presented as Equation (5).
In this specification, denotes the set of mediating variables under the collaborative innovation framework, including knowledge diffusion effects, information transmission effects, and innovation-driven effects. The primary focus of this model is the coefficient . If is statistically significant, it indicates that the mechanism through which data factor flow influences enterprise productivity gaps is valid. All other model specifications remain consistent with those in Equation (1).
4.6.1. Information Transmission Effect
To determine whether information transmission serves as a key mediating pathway through which data factor flow affects enterprise productivity gaps, this study draws on the methodology proposed by (Du & Xue, 2024) for measuring information flow in collaborative innovation. Specifically, we construct a proxy variable to capture the degree of enterprise information disclosure. Following Zhou et al. (2014), we measure enterprise visibility based on the number of research reports focused on the enterprise, adding one and taking the natural logarithm. This reflects the level of transparency toward external investors and markets and serves as a proxy for the enterprise’s external information dissemination capability. In the context of the digital economy, information functions as a production factor, and its accessibility directly influences a enterprise’s ability to identify, absorb, and utilize external resources. The richness and accessibility of industry information thus form critical external conditions for enhancing a enterprise’s dynamic capabilities and innovation responsiveness (Barney, 1991). Based on this logic, we further construct an industry-level information sharing indicator by summing the research report attention scores of all other enterprises in the same industry (excluding the target enterprise), adding one, and taking the natural logarithm. This serves as a proxy for a enterprise’s ability to access external information. The empirical results are presented in Table 5. Column (1) shows that data factor flow significantly promotes enterprises’ information dissemination capability. Column (2) reports a negative and statistically significant coefficient at the 10% level, indicating that strengthened information transmission in the process of data factor allocation improves enterprises’ responsiveness in collaborative innovation and resource integration. Furthermore, when the overall level of information transparency improves within an industry, it not only facilitates more effective information output from individual enterprises but also enhances access to richer and more actionable external information, thereby forming a bidirectional information exchange channel.
Table 5.
Mechanism Analysis of Information Transmission.
4.6.2. Knowledge Diffusion Effect
Patent citation is widely regarded as a key indicator of the extent of knowledge diffusion between countries or enterprises, and is currently the mainstream method for measuring knowledge diffusion paths (R. Zhang, 2024). To determine whether data factor flow influences enterprise productivity gaps through knowledge diffusion, this study utilizes patent citation data for mechanism testing. Specifically, two measurement variables are constructed: First, the natural logarithm of the sum of a enterprise’s external patent citations and its patents cited by others is used as an indicator of patent utilization intensity. A higher value represents more active knowledge exchange between enterprises. Second, a binary dummy variable is set, assigning a value of 1 if a enterprise engages in patent citation behavior and 0 otherwise. The related regression results are shown in Table 6. Column (1) reveals that the coefficient of data factor flow (Data Flow) in relation to reciprocal patent citation behavior is significantly positive at the 1% level, indicating that data factor flow significantly enhances the frequency of knowledge interaction between enterprises. In Column (2), the positive effect of data factor flow on patent citation behavior is significant at the 10% level, further conenterpriseing its key role in promoting knowledge diffusion. In conclusion, data factor flow strengthens the knowledge linkages between enterprises, contributing to the narrowing of productivity gaps in total factor productivity.
Table 6.
Mechanism Analysis of Knowledge Diffusion.
4.6.3. Innovation-Driven Effect
To examine whether data factor flow enhances enterprise innovation performance and whether innovation-driven effects serve as a mechanism through which data factor flow reduces total factor productivity (TFP) gaps among enterprises, this study employs two measures. First, innovation efficiency is proxied by the proportion of R&D personnel to total employees. Second, drawing on Hall et al. (2001) and (Du & Xue, 2024), we adjust enterprise patent invention counts by year and technology category, and measure innovation efficiency as the share of a enterprise’s patent inventions relative to the total number of patents filed by all enterprises in the same industry and year. In Table 7, Columns (1) and (2) show that the coefficients of data factor flow are statistically significant at the 5% level, indicating that data factor flow promotes enterprise innovation efficiency, which in turn contributes to the narrowing of productivity gaps. Taken together, these results empirically validate Hypothesis 2a proposed in this study.
Table 7.
Mechanism Analysis of Innovation Efficiency.
4.7. Testing the Moderating Role of Enterprise Autonomous Innovation
Data factors, as key elements in collaborative innovation, provide the foundational conditions for technological diffusion and information sharing between enterprises. However, whether enterprises can benefit from external data largely depends on their internal knowledge absorption and integration capabilities. R&D investment has long been regarded as an effective measure of a enterprise’s absorptive capacity, representing its potential to recognize information, integrate knowledge, and transform technology. This study measures enterprise autonomous innovation level using the following variables: the ratio of R&D expenditure to total assets in the current period, the ratio of R&D expenditure to operating revenue, the ratio of R&D expenditure to total assets in the previous period, and the ratio of R&D expenditure to operating revenue in the previous period. These variables are then interacted with Data Flow and included in the regression model, as shown in Equation (6). The coefficient of primary interest in this section is , which is expected to be positive.
Results in Table 8 show that the interaction terms between data factor flow and enterprise R&D investment are positive, indicating that the marginal benefits of data factor flow are higher in enterprises with substantial R&D input. This may, in turn, further widen the productivity gap between high- and low-R&D enterprises. This finding reveals the heterogeneity of data factor flow effects across enterprises with different innovation capacities. It also highlights the need for policy frameworks to focus on enhancing the data absorption capabilities of low-R&D enterprises and strengthening collaborative innovation between enterprises at varying technological levels. Such measures are essential to prevent the concentration of digital dividends among frontier enterprises and to mitigate the risk of “digital divergence.”
Table 8.
Moderating Effect of Autonomous Innovation.
Based on the ordinary least squares (OLS) regression results, this study adjusts the mean value of data factor flow by one standard deviation above and below to generate high and low levels of data flow, respectively. A moderating effect diagram is then plotted to compare the effect curves under high and low data flow conditions, as shown in Figure 5. The figure clearly shows that, under all four measures of R&D investment, higher R&D intensity weakens the effectiveness of data factor flow in narrowing productivity gaps.
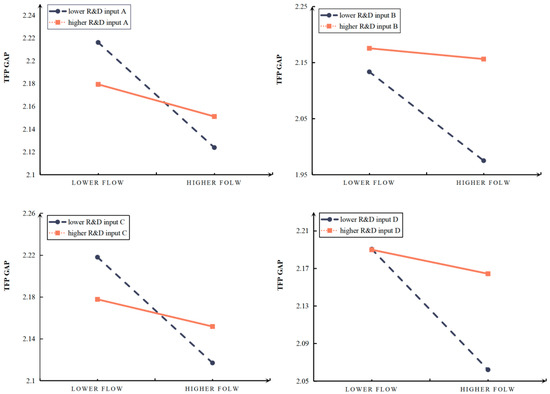
Figure 5.
Illustration of the Moderating Effect of Enterprise Autonomous Innovation.
To improve readability, additional analyses are reported in Appendix B. The results indicate that government public data openness strengthens the gap-narrowing effect of data factor flow, and the effect of data factor flow is heterogeneous with respect to firms’ autonomous innovation intensity. Detailed specifications and results are provided in Appendix B (Table A4, Table A5 and Table A6; Figure A1).
5. Conclusions and Policy Recommendations
This study examines how data factor flow affects enterprise productivity gaps in the digital economy under a collaborative innovation perspective. Using an unbalanced panel of Chinese A-share listed firms from 2006 to 2022, we test the convergence effect, explore mechanisms, and conduct robustness checks. Our conclusions are drawn from Chinese A-share listed firms and may not directly generalize to non-listed firms.
The main conclusions are as follows:
First, data factor flow significantly reduces productivity gaps between enterprises, with more pronounced effects observed in small-scale, private, and eastern-region enterprises, as well as in manufacturing industries, low-tech and high-tech intensity sectors, and industries with high concentration.
Second, data factor flow achieves this primarily by promoting information transmission, facilitating knowledge diffusion, and enhancing innovation efficiency within a collaborative innovation framework. However, heterogeneity in enterprises’ autonomous innovation behavior hampers the gap-narrowing effect, underscoring the critical role of collaborative innovation.
Third, government data openness policies exhibit a synergistic relationship with enterprise data factor flow, positively reinforcing its convergence effect on productivity gaps.
Fourth, the relationship between data factor flow and productivity gaps is nonlinear, characterized by a double-threshold effect, indicating the presence of an “optimal interval” for data flow.
Policy implications derived from this research include:
First, strengthening government data openness to promote data circulation. Governments can move beyond general “platform building” by prioritizing interoperability and usability: publish unified standards (schemas/metadata), provide catalog and API-based access with clear licensing, and institutionalize data-quality and update governance (validation, version control, and update frequency commitments). A tiered-access design with privacy/security safeguards and usage-oriented evaluation (e.g., enterprise adoption and feedback loops) can further ensure that openness translates into effective data circulation and productivity convergence.
Second, supporting enterprise digital transformation to improve data absorption capacity. Rather than broad subsidies, policy tools can be designed around verifiable implementation: SME diagnostics and benchmarking, milestone-based vouchers or matching grants for core digital systems and data management, and targeted tax incentives linked to qualified digital investment. Complementary capacity building on data governance, cybersecurity, and analytics can help firms integrate external data and benefit from data factor flow.
Third, promoting cross-industry collaborative innovation to amplify spillovers. Policymakers can operationalize collaboration by establishing cross-industry consortia and co-funding joint R&D and demonstration pilots that require data sharing and joint problem solving. Standardized data-sharing agreements, shared testbeds (or “data sandboxes”), and outcome-oriented evaluation (e.g., diffusion speed and joint innovation outputs) can reduce coordination frictions and strengthen technology spillovers across industries.
Author Contributions
Conceptualization, L.L. and Y.Y.; methodology, L.L. and Y.Y.; software, L.L. and Y.Y.; validation, L.L. and X.Z.; formal analysis, X.Z.; investigation, Y.L.; resources, L.F. All authors have read and agreed to the published version of the manuscript.
Funding
This research was funded by [the National Social Science Fund Post-Financing Project] grant number [23FJYB036], [the Major Project of the Key Research Base for Humanities and Social Sciences of the Ministry of Education] grant number [22JJD790052] and [the Third Comprehensive Scientific Investigation Project] grant number [2022xjkk0300].
Institutional Review Board Statement
Not applicable.
Informed Consent Statement
Not applicable.
Data Availability Statement
Data is available if request.
Conflicts of Interest
We declare that we have no financial and personal relationships with other people or organizations that can inappropriately influence our work, there is no professional or other personal interest of any nature or kind in any product, service and/or company that could be construed as influencing the position presented in, or the review of, the manuscript entitled.
Appendix A
Table A1.
Robustness Checks.
Table A1.
Robustness Checks.
| Variable | (1) | (2) | (3) | (4) | (5) | (6) | (7) | (8) | (9) |
|---|---|---|---|---|---|---|---|---|---|
| Replacing the Dependent Variable | Replacing the Explanatory Variable | Controlling for Fixed Effects | Two-Sided Winsorization | Dropping Samples Observed Once | |||||
| Gap# | Gap## | Gap### | Gap | Gap | Gap | Gap | Gap | Gap | |
| Data Flow | −0.094 *** | −0.458 *** | −0.275 *** | −0.080 *** | −0.131 *** | −0.131 *** | |||
| (0.019) | (0.103) | (0.093) | (0.024) | (0.026) | (0.026) | ||||
| Data Flow# | −0.083 *** | ||||||||
| (0.024) | |||||||||
| Data Flow## | −0.083 *** | ||||||||
| (0.024) | |||||||||
| L.Data Flow | −0.048 *** | ||||||||
| (0.015) | |||||||||
| Intercept | 2.021 *** | 6.498 *** | 5.925 *** | 2.146 *** | 2.146 *** | 1.833 *** | 2.263 *** | 2.185 *** | 2.185 *** |
| (0.159) | (0.952) | (0.903) | (0.192) | (0.192) | (0.063) | (0.263) | (0.197) | (0.197) | |
| Control Variables | YES | YES | YES | YES | YES | YES | YES | YES | YES |
| Enterprise Fixed Effects | YES | YES | YES | YES | YES | YES | YES | YES | YES |
| Year Fixed Effects | YES | YES | YES | YES | YES | YES | YES | YES | YES |
| Province Fixed Effects | NO | NO | NO | NO | NO | NO | YES | NO | NO |
| Province-by-Year Interaction Fixed Effects | NO | NO | NO | NO | NO | NO | YES | NO | NO |
| Observations | 14,757 | 14,757 | 14,757 | 14,757 | 14,092 | 14,748 | 14,757 | 14,757 | 14,757 |
| R2 | 0.906 | 0.922 | 0.907 | 0.890 | 0.890 | 0.878 | 0.896 | 0.898 | 0.898 |
Note: *** indicate significant at the 1%, respectively, with standard errors adjusted for clustering at the enterprise level in parentheses, the same as below.
Table A2.
Heterogeneity Analysis I (Enterprise and Regional Levels).
Table A2.
Heterogeneity Analysis I (Enterprise and Regional Levels).
| Variable | (1) | (2) | (3) | (4) | (5) | (6) | (7) |
|---|---|---|---|---|---|---|---|
| Enterprise Size | Ownership Type | Region | |||||
| Small | Large | State-Owned | Private | Eastern | Central | Western | |
| Data Flow | −0.134 *** | −0.086 *** | −0.102 * | −0.120 *** | −0.173 *** | −0.072 | −0.061 |
| (0.035) | (0.033) | (0.057) | (0.030) | (0.035) | (0.092) | (0.064) | |
| Control Variables | YES | YES | YES | YES | YES | YES | YES |
| Enterprise Fixed Effects | YES | YES | YES | YES | YES | YES | YES |
| Year Fixed Effects | YES | YES | YES | YES | YES | YES | YES |
| Intercept | 1.661 *** | 2.105 *** | 2.077 *** | 2.075 *** | 2.256 *** | 2.944 *** | 3.694 *** |
| (0.262) | (0.245) | (0.281) | (0.262) | (0.302) | (1.034) | (0.565) | |
| Observations | 7416 | 7481 | 5318 | 9314 | 15,435 | 2324 | 3516 |
| R2 | 0.887 | 0.910 | 0.910 | 0.883 | 0.938 | 0.939 | 0.928 |
Note: *** and * indicate significant at the 1% and 10%, respectively, with standard errors adjusted for clustering at the enterprise level in parentheses, the same as below.
Table A3.
Heterogeneity Analysis II (Industry Level).
Table A3.
Heterogeneity Analysis II (Industry Level).
| Variable | (8) | (9) | (10) | (11) | (12) | (13) | (14) | (15) |
|---|---|---|---|---|---|---|---|---|
| Industry Type | Industry Barriers | |||||||
| Manufacturing | Non-Manufacturing | High-Tech | Non-High -Tech | High Skill Intensity | Low Skill Intensity | High Concentration | Low Concentration | |
| Data Flow | −0.055 * | −0.089 *** | −0.091 *** | −0.308 *** | −0.121 *** | −0.072 ** | −0.228 *** | −0.066 *** |
| (0.030) | (0.037) | (0.026) | (0.089) | (0.030) | (0.032) | (0.053) | (0.025) | |
| Control Variables | YES | YES | YES | YES | YES | YES | YES | YES |
| Enterprise Fixed Effects | YES | YES | YES | YES | YES | YES | YES | YES |
| Year Fixed Effects | YES | YES | YES | YES | YES | YES | YES | YES |
| Intercept | 2.393 *** | 1.646 *** | 2.229 *** | 1.894 *** | 2.186 *** | 2.538 *** | 2.422 *** | 2.480 *** |
| (0.226) | (0.366) | (0.238) | (0.338) | (0.234) | (0.290) | (0.633) | (0.247) | |
| Observations | 9482 | 5537 | 9409 | 5608 | 5336 | 6746 | 8471 | 8533 |
| R2 | 0.905 | 0.906 | 0.899 | 0.908 | 0.930 | 0.922 | 0.954 | 0.922 |
Note: ***, ** and * indicate significant at the 1%, 5% and 10%, respectively, with standard errors adjusted for clustering at the enterprise level in parentheses, the same as below.
Appendix B. Further Analysis (Additional Tests)
Appendix B.1. Policy Synergy: Government Public Data Openness
Testing the Guiding Role of Government Public Data Openness Policy
Data are continuously generated and time-sensitive, largely non-rival and reusable, and often involve separable and contractible rights over access, processing, and use, while their effective production and circulation are shaped by policy and governance arrangements (Cong et al., 2021). Since the introduction of the Action Plan for Promoting Big Data Development in 2015, which called for public data openness, the government has continuously advanced relevant institutional frameworks, with various regions launching data openness platforms and forming a relatively complete policy system. To identify the synergy between institutional supply and market mechanisms, this study introduces public data openness policy as an institutional moderating variable to explore its impact on the relationship between data factor flow and enterprise productivity gaps. Table A4 presents the test results, showing that the coefficient of the interaction term is statistically significant at the 5% level, indicating the existence of a synergistic effect. Specifically, in regions with higher levels of public data openness, the effect of data factor flow on narrowing productivity gaps is more pronounced. Institutional data supply helps strengthen the efficiency-enhancing pathway for data resource allocation.
Table A4.
Test Results of the Synergistic Effect of Government Data Openness Policy.
Table A4.
Test Results of the Synergistic Effect of Government Data Openness Policy.
| Variable | Gap |
|---|---|
| Data Flow | −0.102 *** |
| (0.031) | |
| Government Data Openness | 0.002 |
| (0.007) | |
| Government Data Openness Data Flow | −0.060 ** |
| (0.029) | |
| Control Variables | YES |
| Enterprise Fixed Effects | YES |
| Year Fixed Effects | YES |
| Cluster (Enterprise) | YES |
| Intercept | 2.168 *** |
| (0.188) | |
| Observations | 14,757 |
| R2 | 0.899 |
Note: *** and ** indicate significant at the 1% and 5%, respectively, with standard errors adjusted for clustering at the enterprise level in parentheses, the same as below.
Using a more intuitive approach, the analysis shows that in cities without public data openness pilot programs, the productivity gap convergence effect of data factor flow is significantly stronger in cities that have implemented such pilots. This suggests that under the guidance of public data openness, a synergistic policy environment is formed, which more effectively unlocks the value of data factor flow and supports non-frontier enterprises in catching up in terms of productivity.

Figure A1.
Illustration of the Synergistic Effect of Government Data Openness Policy.
Figure A1.
Illustration of the Synergistic Effect of Government Data Openness Policy.

This result reflects the operation of multiple underlying mechanisms. First, government-led data openness policies typically provide high-quality administrative data through standardized, structured, and frequently updated formats, significantly reducing the marginal cost of data acquisition for enterprises. This expands the breadth and depth of data circulation and enhances enterprises’ efficiency in utilizing external information and resources. Second, public data openness helps to bridge the gap between small- and medium-sized enterprises (SMEs) and leading enterprises in terms of data infrastructure and platform access capabilities, thereby offering lower-productivity enterprises access to external data resources necessary for catching up with frontier enterprises. This contributes to narrowing information and capability gaps across enterprises. Third, the establishment of local data platforms and sharing mechanisms under policy support enhances enterprises’ ability to access and match multi-source heterogeneous data, improving the overall liquidity and transparency of the data factor market. Public data openness, as an institutional supply, not only strengthens the foundational capacity of enterprises to utilize data but also fundamentally enhances the efficiency of data factor flow. As a result, the convergence of enterprise productivity gaps is accelerated. This finding underscores the foundational role of institutional development in the digital economy and provides empirical support for the formation of a more coordinated and effective data governance system.
Appendix B.2. Testing the Nonlinear Relationship Between Data Factor Flow and Enterprise Productivity Gap
Appendix B.2.1. Revealing the Nonlinear Relationship
In the previous analysis, this study assumed a linear relationship between data factor flow and enterprise productivity gaps. However, considering the inherent economic characteristics of data—such as its network effects, platform dependency, and diminishing marginal returns—the impact mechanism may not be monotonic or stable. Specifically, at low levels of data factor flow, enterprises may lack the capacity to effectively acquire and utilize data, thereby failing to realize substantial efficiency gains. As the degree of data factor flow increases, enterprises may experience improvements in information access, resource allocation, and innovation efficiency, resulting in a noticeable convergence of productivity gaps. However, when data factor flow becomes overly concentrated among leading enterprises or platforms, a “digital Matthew effect” or resource siphoning may emerge, whereby stronger enterprises become stronger and weaker enterprises are further marginalized, ultimately leading to a widening of productivity gaps once again. Therefore, it is necessary to incorporate nonlinear terms into the empirical analysis to examine whether a “turning point” or “threshold effect” exists, in order to gain a more comprehensive understanding of the mechanism and provide more targeted insights for policymaking. To this end, this study augments the baseline regression model with a squared term of the core explanatory variable. The results, presented in Table A5, show that the coefficient of Data Flow remains significantly negative, while its squared term is significantly positive at the 5% level, indicating a nonlinear relationship between data factor flow and enterprise productivity gaps.
Table A5.
Preliminary Test of the Nonlinear Relationship.
Table A5.
Preliminary Test of the Nonlinear Relationship.
| Variable | TFP Gap |
|---|---|
| Data Flow | −0.238 *** |
| (0.061) | |
| (Data Flow)2 | 0.180 ** |
| (0.083) | |
| Control Variables | YES |
| Enterprise Fixed Effects | YES |
| Year Fixed Effects | YES |
| Cluster (Enterprise) | YES |
| Intercept | 2.189 *** |
| (0.197) | |
| Observations | 15,030 |
| R2 | 0.899 |
Note: *** and ** indicate significant at the 1% and 5%, respectively, with standard errors adjusted for clustering at the enterprise level in parentheses, the same as below.
Appendix B.2.2. Threshold Effect Test
Although the results in Table A5 preliminarily reveal a nonlinear pattern, polynomial models have inherent limitations in capturing the precise boundaries of marginal effect variation and may struggle to clearly identify structural breaks in the underlying mechanisms. Therefore, this study further employs a panel threshold regression model, using the level of data factor flow as the threshold variable to identify its segmented effects on enterprise productivity gaps across different regimes. This approach enables a more precise depiction of the potential nonlinear impact pathways. The model is specified in Equation (13), with the coefficient of interest denoted as , which is expected to be positive.
The results presented in Table A6 indicate that the impact of data factor flow on enterprise productivity gaps is not monotonically increasing, but instead exhibits a significant double-threshold effect. When data factor flow is at a moderate level, its effect on narrowing productivity gaps is most pronounced; however, when the flow is either too low or excessively high, the convergence effect weakens. This finding reveals the existence of an “optimal range” in data factor allocation, suggesting that moderate levels of data factor flow contribute to fostering a more inclusive and equitable environment for efficiency improvement. It also highlights the need for policymakers to consider marginal effects and structural imbalances when designing data governance strategies.
Table A6.
Threshold Effect Test Results.
Table A6.
Threshold Effect Test Results.
| Panel A | ||||
| Variable | (1) | (2) | ||
| Single Threshold | Double Threshold | |||
| 0. Data Flow | −0.010 *** | −0.010 *** | ||
| (0.003) | (0.003) | |||
| 1. Data Flow | −0.011 *** | −0.015 *** | ||
| (0.004) | (0.004) | |||
| 2. Data Flow | −0.008 * | |||
| (0.004) | ||||
| Control Variables | YES | YES | ||
| Enterprise Fixed Effects | YES | YES | ||
| Year Fixed Effects | YES | YES | ||
| Cluster (Enterprise) | YES | YES | ||
| Intercept | 2.064 *** | 2.019 *** | ||
| (0.272) | (0.271) | |||
| Observations | 3841 | 3841 | ||
| R2 | 0.214 | 0.220 | ||
| Panel B | ||||
| Type | Threshold | p | Confidence Interval | Bootstrap |
| Threshold-1 | −5.417 | 0.000 | [−5.426, −5.417] | 300 |
| Threshold-21 | −5.417 | 0.000 | [−5.426, −5.378] | 300 |
| Threshold-22 | −5.378 | [−5.378, −5.071] | 300 | |
Note: *** and * indicate significant at the 1% and 10%, respectively, with standard errors adjusted for clustering at the enterprise level in parentheses, the same as below.
References
- Acemoglu, D., & Zilibotti, F. (1998). TFP differences (Working Paper No. 98-15). Department of Economics, Massachusetts Institute of Technology. [Google Scholar]
- Aly, H. (2022). Digital transformation, development and productivity in developing countries: Is artificial intelligence a curse or a blessing? Review of Economics and Political Science, 7(4), 238–256. [Google Scholar] [CrossRef]
- Arthur, W. B. (1989). Competing technologies, increasing returns, and lock-in by historical events. The Economic Journal, 99(394), 116–131. [Google Scholar] [CrossRef]
- Autor, D., Dorn, D., Katz, L. F., Patterson, C., & Van Reenen, J. (2020). The fall of the labor share and the rise of superstar firms. The Quarterly Journal of Economics, 135(2), 645–709. [Google Scholar] [CrossRef]
- Baldwin, C. Y., Bogers, M. L. A. M., Kapoor, R., & West, J. (2024). Focusing the ecosystem lens on innovation studies. Research Policy, 53(3), 104949. [Google Scholar] [CrossRef]
- Barney, J. (1991). Firm resources and sustained competitive advantage. Journal of Management, 17(1), 99–120. [Google Scholar] [CrossRef]
- Bergh, D. D., D’Oria, L., Crook, T. R., & Roccapriore, A. (2025). Is knowledge really the most important strategic resource? A meta-analytic review. Strategic Management Journal, 46(1), 3–18. [Google Scholar] [CrossRef]
- Berlingieri, G., Blanchenay, P., & Criscuolo, C. (2017). The great divergence(s). OECD. [Google Scholar]
- Cette, G., Fernald, J., & Mojon, B. (2016). The pre-Great Recession slowdown in productivity. European Economic Review, 88, 3–20. [Google Scholar] [CrossRef]
- Cheng, Y., Zhou, X., & Li, Y. (2023). The effect of digital transformation on real economy enterprises’ total factor productivity. International Review of Economics & Finance, 85, 488–501. [Google Scholar] [CrossRef]
- Chesbrough, H. W. (2003). Open innovation: The new imperative for creating and profiting from technology. Harvard Business Press. [Google Scholar]
- Chu, H., Niu, X., Li, M., & Wei, L. (2025). Research on the impact of new quality productivity on enterprise ESG performance. International Review of Economics & Finance, 99, 104009. [Google Scholar] [CrossRef]
- Cohen, W. M., & Levinthal, D. A. (1990). Absorptive capacity: A new perspective on learning and innovation. Administrative Science Quarterly, 35(1), 128–152. [Google Scholar] [CrossRef]
- Cong, L. W., & Mayer, S. (2023). Data union and regulation in a data economy. National Bureau of Economic Research. [Google Scholar]
- Cong, L. W., Wei, W., Xie, D., & Zhang, L. (2022). Endogenous growth under multiple uses of data. Journal of Economic Dynamics and Control, 141, 104395. [Google Scholar] [CrossRef]
- Cong, L. W., Xie, D., & Zhang, L. (2021). Knowledge accumulation, privacy, and growth in a data economy. Management Science, 67(10), 6480–6492. [Google Scholar] [CrossRef]
- Dai, K., Huang, Z., & Liang, Y. (2024). Data factors and the development of service-oriented manufacturing. Economic Research Journal, 59(12), 95–112. Available online: https://erj.ajcass.com/#/issue?id=117587&year=2024&issue=12 (accessed on 9 January 2026).
- Di, J., Sun, P., & Yuan, C. (2025). Digital economy development drives entrepreneurial activity—Based on a quasi-natural experiment from the national big data comprehensive pilot area. Quantitative Economic and Technical Economic Research, 42(01), 157–177. [Google Scholar] [CrossRef]
- Du, C., & Xue, Y. (2024). R&D alliances, collaborative innovation, and improvement of enterprise total factor productivity. Quantitative Economic and Technical Economic Research, 41(12), 111–132. [Google Scholar] [CrossRef]
- Fan, F., Yang, B., & Wang, S. (2025). The convergence mechanism and spatial spillover effects of urban industry-university-research collaborative innovation performance in China. Technology Analysis & Strategic Management, 37(5), 551–567. [Google Scholar]
- Farboodi, M., & Veldkamp, L. (2020). Long-run growth of financial data technology. American Economic Review, 110(8), 2485–2523. [Google Scholar] [CrossRef]
- Farboodi, M., & Veldkamp, L. (2021). A model of the data economy. National Bureau of Economic Research. [Google Scholar]
- Ferracane, M. F., Lee-Makiyama, H., & van der Marel, E. (2018). Digital trade restrictiveness index (p. 5). European Center for International Political Economy. [Google Scholar]
- Fosso Wamba, S., Akter, S., Trinchera, L., & De Bourmont, M. (2019). Turning information quality into firm performance in the big data economy. Management Decision, 57(8), 1756–1783. [Google Scholar] [CrossRef]
- Gao, Y., Lu, Z., & Xiang, H. (2025). Enterprise digitalization and technology adoption: Exploring China’s overall technological upgrade path. Economic Research, 60(1), 143–159. Available online: https://erj.ajcass.com/#/issue?id=118054&year=2025&issue=1 (accessed on 9 January 2026).
- Goldfarb, A., & Tucker, C. (2019). Digital economics. Journal of Economic Literature, 57(1), 3–43. [Google Scholar] [CrossRef]
- Gong, B. (2022). Agricultural technology diffusion and regional productivity gaps in China. Economic Research, 57(11), 102–120. Available online: https://erj.ajcass.com/#/issue?id=109134&year=2022&issue=11 (accessed on 9 January 2026).
- Guo, S., & Li, X. (2025). Cross-border data flow in China: Shifting from restriction to relaxation? Computer Law & Security Review, 56, 106079. [Google Scholar]
- Gutierrez, L. H., & Rodriguez-Lesmes, P. (2023). Productivity Gaps at formal and informal microfirms. World Development, 165, 106205. [Google Scholar] [CrossRef]
- Hall, B. H., Jaffe, A. B., & Trajtenberg, M. (2001). The NBER patent citation data file: Lessons, insights and methodological tools (NBER Working Paper, No. 8498). NBER. [Google Scholar]
- Huang, R., Shen, Z., & Yao, X. (2024). How does industrial intelligence affect total-factor energy productivity? Evidence from China’s manufacturing industry. Computers & Industrial Engineering, 188, 109901. [Google Scholar]
- Huang, X., Jin, Z., & Yu, L. (2017). Factor flow and total factor productivity growth: Empirical evidence from state-owned sector reform. Economic Research, 52(12), 62–75. Available online: https://erj.ajcass.com/#/issue?id=109542&year=2017&issue=12 (accessed on 9 January 2026).
- Jones, C. I., & Tonetti, C. (2020). Nonrivalry and the economics of data. American Economic Review, 110(9), 2819–2858. [Google Scholar] [CrossRef]
- Krugman, P. (1999). Depression economics returns. Foreign Affairs, 78(1), 56–74. [Google Scholar] [CrossRef]
- Lema, R., & Perez, C. (2024). The green transformation as a new direction for techno-economic development. United Nations University—Maastricht Economic and Social Research Institute on Innovation and Technology (MERIT). [Google Scholar]
- Levin, R. C., Klevorick, A. K., Nelson, R. R., & Winter, S. (1987). Appropriating the returns from industrial research and development. Brookings Papers on Economic Activity, 18(3), 783–831. [Google Scholar] [CrossRef]
- Levinsohn, J., & Petrin, A. (2003). Estimating production functions using inputs to control for unobservables. The Review of Economic Studies, 70(2), 317–341. [Google Scholar] [CrossRef]
- Lu, X., & Lian, Y. (2012). Estimation of total factor productivity of Chinese industrial enterprises: 1999–2007. Economics (Quarterly), 11(2), 541–558. [Google Scholar]
- Ma, Z., Xiao, H., Li, J., Chen, H., & Chen, W. (2025). Study on how the digital economy affects urban carbon emissions. Renewable and Sustainable Energy Reviews, 207, 114910. [Google Scholar] [CrossRef]
- Mc Morrow, K., Röger, W., & Turrini, A. (2008). The EU-US total factor productivity Gap: An industry perspective. European Economy Research Letter, 2(3), 339. [Google Scholar]
- Mc Morrow, K., Röger, W., & Turrini, A. (2010). Determinants of TFP growth: A close look at industries driving the EU–US TFP Gap. Structural Change and Economic Dynamics, 21(3), 165–180. [Google Scholar] [CrossRef]
- Ng, E. C. Y., & Ng, Y. C. (2016). What explains the total factor productivity Gap between OECD economies and the US? Applied Economics, 48(32), 3005–3019. [Google Scholar] [CrossRef]
- Olley, S., & Pakes, A. (1992). The dynamics of productivity in the telecommunications equipment industry. National Bureau of Economic Research. [Google Scholar]
- Radicic, D., Borovic, Z., & Trivic, J. (2023). Total factor productivity gap between the “New” and “Old” Europe: An industry-level perspective. Post-Communist Economies, 35(7), 770–795. [Google Scholar] [CrossRef]
- Ren, X., Jin, C., & Lin, R. (2023). Oil price uncertainty and enterprise total factor productivity: Evidence from China. International Review of Economics & Finance, 83, 201–218. [Google Scholar]
- Romer, P. M. (1990). Endogenous technological change. Journal of Political Economy, 98(5), S71–S102. [Google Scholar] [CrossRef]
- Solow, R. M. (1957). Technical change and the aggregate production function. The Review of Economics and Statistics, 39(3), 312–320. [Google Scholar] [CrossRef]
- Song, C., Han, M., & Yuan, H. (2025). The impact of digital transformation on firm productivity: From the perspective of sustainable development. Finance Research Letters, 75, 106912. [Google Scholar] [CrossRef]
- Stiglitz, J. E. (2000). The contributions of the economics of information to twentieth century economics. The Quarterly Journal of Economics, 115(4), 1441–1478. [Google Scholar] [CrossRef]
- Stiglitz, J. E. (2017). The revolution of information economics: The past and the future. National Bureau of Economic Research. [Google Scholar]
- Teece, D. J. (1986). Profiting from technological innovation: Implications for integration, collaboration, licensing and public policy. Research Policy, 15(6), 285–305. [Google Scholar] [CrossRef]
- Torrent-Sellens, J., Díaz-Chao, Á., Miró-Pérez, A. P., & Sainz, J. (2022). Towards the Tyrell corporation? Digitisation, firm-size and productivity divergence in Spain. Journal of Innovation & Knowledge, 7(2), 100185. [Google Scholar] [CrossRef]
- Wang, G., & Lu, X. (2019). The Belt and Road Initiative and the upgrading of Chinese enterprises. China Industrial Economics, (3), 43–61. [Google Scholar] [CrossRef]
- Williamson, O. E. (1975). Markets and hierarchies: Analysis and antitrust implications: A study in the economics of internal organization. University of Illinois at Urbana-Champaign’s Academy for Entrepreneurial Leadership Historical Research Reference in Entrepreneurship. The Free Press. [Google Scholar]
- Wu, F., Hu, H., Lin, H., & Ren, X. (2021). Enterprise digital transformation and capital market performance—Empirical evidence from stock liquidity. Management World, 37(7), 130–144+10. [Google Scholar]
- Xu, N., Mao, J., Mao, X., & Wang, Y. (2025). Computing power deployment, cross-domain data flows, and firms’ total factor productivity: Evidence from intelligent computing centers. China Industrial Economics, (4), 61–79. [Google Scholar] [CrossRef]
- Yang, R., Li, Y., & Meng, S. (2023). Enterprise digital development, total factor productivity, and industrial chain spillover effects. Economic Research, 58(11), 44–61. Available online: https://erj.ajcass.com/#/issue?id=108976&year=2023&issue=11 (accessed on 9 January 2026).
- Zhang, A., & Sun, J. (2025). Data flow, data factorization, and the operation of the digital economy. Studies in Science of Science, 43(11), 2438–2446. [Google Scholar] [CrossRef]
- Zhang, G., Yan, P., & Li, X. (2024). Big data factor aggregation, technology capability gap, and regional productivity differences. China Industrial Economics, (10), 118–136. [Google Scholar] [CrossRef]
- Zhang, R. (2024). R&D alliances, knowledge diffusion, and enterprise digital technology innovation. Journal of Beijing Normal University (Social Sciences), (2), 142–153. Available online: https://wkxb.bnu.edu.cn/CN/Y2024/V0/I2/142 (accessed on 9 January 2026).
- Zhao, C., Wang, W., & Li, X. (2021). How does digital transformation affect enterprise total factor productivity? Finance and Trade Economics, 42(7), 114–129. [Google Scholar] [CrossRef]
- Zheng, F., Liu, M., He, X., & Lu, R. (2024). The impact of intelligent manufacturing on the productivity gap between enterprises—Based on the moderating effect of managers’ time orientation. Management Journal, 37(3), 78–94. [Google Scholar] [CrossRef]
- Zhou, K., Ying, Q., & Chen, X. (2014). Media attention, analyst attention, and earnings forecast accuracy. Financial Research, (2), 139–152. Available online: https://kns.cnki.net/kcms2/article/abstract?v=-djcopRf0qEUtd2KMF6mOdl9wZKkCv6fzJzQ9wM8iY8xeZgPvKhLoaVHDMPCap6XDymjlHTecbmxJ72JNCqeQcKoMaeJNTb8jpFWVrr53PHrFQYNX40Xa8gpr5Meay6Am2fHWO1K6lqsgiuIA7ix-hE-qQnCTr8aNlddp6sUlTldtH3HJcFKqg==&uniplatform=NZKPT&language=CHS (accessed on 9 January 2026).


Disclaimer/Publisher’s Note: The statements, opinions and data contained in all publications are solely those of the individual author(s) and contributor(s) and not of MDPI and/or the editor(s). MDPI and/or the editor(s) disclaim responsibility for any injury to people or property resulting from any ideas, methods, instructions or products referred to in the content. |
© 2026 by the authors. Licensee MDPI, Basel, Switzerland. This article is an open access article distributed under the terms and conditions of the Creative Commons Attribution (CC BY) license.