


Abstract
In the context of green energy, the use of lake reeds is becoming an increasingly important factor. Therefore, research into the availability of reeds, determining their area in lakes, predicting the potential biomass volume and calculating the carbon footprint are important. Currently, there have been no significant research results on the availability of reeds and the assessment of the sustainability of reed products in Latvia. However, these aspects are crucial for the development of reed products, as they help to assess their market potential and environmental impact. The main goal of this work is to develop a method for modeling the distribution of lake reeds in order to predict their availability in the future, which would allow assessment of the volume of biomass and its impact on the environment. This research develops an integrated GIS–LCA framework that combines Sentinel-2 satellite data, machine learning-based classification, biomass estimation, and carbon footprint modeling. Using Lake Cirma as a case study, the classification results show that reed stands occupy 2.18–3.51 percent of the lake area in certain years, corresponding to approximately 1158–1861 tons of biomass. The framework enables quantification of harvesting potential while considering ecological constraints that limit annual extraction to approximately 50% of total biomass. The proposed GIS–LCA framework provides a replicable methodology for assessing reed biomass availability and environmental performance across lake ecosystems. It supports evidence-based decision-making for sustainable reed resource management and contributes to the development of low-carbon bioeconomy pathways in line with EU climate and bioeconomy strategies.
1. Introduction
The grass family Poaceae is a wetland grass and has a worldwide distribution [1]. Phragmites is a Poaceae genus of four species of large perennial reed grasses. Phragmites australis (Cav.) Trin. ex Steudel is a tall perennial grass commonly known as the common reed. In botanical nomenclature, the author citation shows who originally described the species and who later reclassified it into the current genus. (Cav.)—Antonio José Cavanilles, Spanish botanist who first described a species (in another genus) (1799). Trin.—Carl Bernhard von Trinius, a botanist who transferred the species to the genus Phragmites, but the publication was not fully formally validated (early 1800s). ex Steud—Ernst Gottlieb von Steudel, German botanist who formally published and validated the name (1854).
Taxonomy classifies the following Phragmites species:
- Phragmites australis subsp. Americanus—the North American genotype has been described as a distinct species;
- Phragmites australis subsp. Australis—the Eurasian genotype—common reed;
- Phragmites australis subsp. Berlandieri;
- Phragmites australis subsp. Isiacus.
The common reed is gaining attention as a potential feedstock for renewable energy and bioproducts due to its wide distribution, rapid growth, and low competition with food crops [2]. Reeds have been evaluated for applications including solid biofuel production (e.g., pellets) and cellulosic bioethanol, demonstrating feasible calorific properties and potentially favorable climate impacts compared with conventional fossil alternatives [3,4]. Studies have demonstrated that the common reed can be processed into bio-based building panels with thermal and acoustic performance comparable to conventional insulation materials, showing additional valorization pathways [5].
Reed is a widespread plant also in Latvia, which until now was considered mainly as a nuisance due to its rapid spread. The possibilities for the wider use of reed are described in [6].
With ongoing economic development, the demand for renewable energy continues to grow due to its sustainability and lower environmental impact compared to fossil fuels. Among the various renewable energy sources, biomass is one of the most widely utilized. Currently, attention is increasingly directed toward non-traditional biomass resources, such as cultivated energy crops, wood residues, and lake reeds. Rising fossil fuel prices and the environmental pollution associated with their use have further intensified interest in local biomass as an alternative energy source. As a result, the rational and efficient utilization of reed resources has become an important topic of discussion [7].
Reeds simultaneously function as both a potential bioresource and a factor in ecosystem degradation, which requires targeted management, especially in shallow coastal lakes and wetland areas. Reed management also in protected areas does not contradict nature conservation goals, but rather serves as a tool for improving the quality of habitats and sustainable use of bioresources [8]. The lake nature conservation plans emphasize that a thick layer of dead reeds forms in unmanaged areas, which makes further maintenance of the areas difficult and degrades them, while regular management allows for the restoration of coastal grasslands, improvement of water exchange, and maintenance of the landscape, which is essential for many protected species. At the same time, the plans provide that, subject to seasonal restrictions and other nature conservation requirements, reed aboveground biomass can also be obtained in commercially significant volumes—in densely overgrown areas, mowing is planned over an area of hundreds of hectares, which simultaneously reduces overgrowth and ensures the extraction of a renewable resource.
The study on the use of controlled burning for reed bed restoration around Lake Neusiedl provides a timely and empirically grounded perspective on reed management in the context of climate change. The authors analyze a pilot project demonstrating that targeted burning can effectively reduce accumulated reed biomass while preserving soil carbon stocks. A key strength of the study lies in its methodological versatility: field sampling is successfully combined with LiDAR data, enabling the spatially precise identification of burned areas and the assessment of fire effects. The findings indicate that fire primarily affects the upper layers of the reed, which are critical for habitat restoration [9].
To assess the potential for reed utilization, it is essential to determine the spatial extent of reed beds within a specific lake and to analyze changes in their coverage over time. Such analysis enables the prediction of trends in reed expansion or decline. In this context, the application of GIS is crucial, as it allows for the comparison of satellite data across different time periods, the calculation of reed-covered areas for defined reference intervals, and the forecasting of future dynamics in reed distribution.
Research on reedbed ecosystems using high-resolution drone RGB imagery combined with deep learning-based semantic segmentation reveals detailed spatial and seasonal dynamics that traditional satellite-based approaches cannot capture. The study shows that integrating drone imagery with advanced deep learning methods enables a significantly more precise assessment of ecosystem changes [10].
Controlling the spread of reeds and ensuring effective monitoring in large water bodies is an important challenge for both ecological assessment and nature conservation management. The study provides a practically applicable methodology by combining Sentinel satellite data with orthophotos for validation. This approach is methodologically well grounded, as satellite imagery offers broad spatial coverage while orthophotos supply the necessary high-resolution detail [11].
The spread of the invasive giant reed species along riverbanks poses a notable hydrological risk, while also offering potential opportunities for biomass utilization in biogas production. Uncontrolled vegetation reduces river flow capacity and increases flood risk, a particularly relevant issue in Mediterranean regions during episodes of extreme precipitation. To analyze vegetation distribution, the study employs Sentinel satellite imagery with favourable spectral resolution, using combinations of three spectral bands [12].
Monitoring the degradation and changing distribution of aquatic reeds in European lakes presents a significant ecological challenge. Traditional monitoring methods are often costly and time-consuming, whereas Green LiDAR technology can substantially improve both efficiency and accuracy. This is especially important for smaller lakes, where satellite imagery lacks sufficient resolution [13].
Assessing the biomass potential of common reed in the wetlands of the Syr Darya Delta region of Kazakhstan involves the use of remote sensing data combined with Random Forest machine learning models. By integrating field measurements with high-resolution Sentinel satellite imagery, the study produces a detailed biomass map and estimates resource volumes under the arid climatic conditions near the former Aral Sea. The methodological design—linking precise field data with satellite imagery and enhanced regression models—ensures reliable biomass estimates. Strong model performance indicators further confirm high predictive accuracy, with the largest biomass concentrations found along river branches and lake shorelines where water availability remains stable [14].
Although biomass production from naturally occurring reeds does not require cultivation inputs, emissions associated with harvest, transport, processing, and end-use must be comprehensively accounted for to assess climate performance. Assessment of physical and chemical fuel properties further suggests reed biomass can meet solid biofuel quality requirements, reinforcing its suitability for energy applications [3].
The life cycle assessment (LCA) study has demonstrated that alternative biomass pellet feedstocks can achieve competitiveness with conventional wood pellets in decentralized heating systems, highlighting the importance of pathway evaluation case-specific data [15]. The LCA methods are essential for quantifying greenhouse gas (GHG) emissions of bio-based value chains from biomass harvest through product delivery, enabling comparisons across utilization pathways and informing sustainable resource use decisions. The carbon footprint evaluation revealed that transport intensity and harvest logistics are significant determinants of emissions [4]. However, these assessments often rely on assumed biomass quantities in the absence of spatially explicit resource data, limiting their environmental relevance for regional planning.
Remote sensing studies have demonstrated that Sentinel-based imagery combined with classification algorithms (e.g., Random Forest) can map reed distribution and estimate aboveground biomass with reasonably high accuracy, enabling the quantification of spatial biomass patterns over wetland areas [16]. While remote sensing, GIS analysis, and LCA are well-established approaches individually, their integration into a coherent, operational framework for reed biomass applications remains limited. Existing studies typically apply these methods in isolation or rely on static assumptions regarding biomass availability in LCA models.
The goal of this study is to establish an integrated methodological framework for the remote spatial quantification of reed biomass in lake systems with cradle-to-gate carbon footprint modeling, supporting evidence-based assessment of sustainable reed valorization pathways within a Latvian bioeconomy context. The framework allows the explicit evaluation of logistical parameters, such as transport distance, and their interaction with biomass availability and processing pathways, thereby supporting more realistic and regionally grounded bioeconomy planning. For the case of Latvia, this integration is particularly relevant in the context of the European Union Bioeconomy Strategy [17] and the European Green Deal [18], which emphasize sustainable biomass mobilization, climate neutrality by 2050, and avoidance of environmental burden shifting. The EU Climate Law [19] and Fit-for-55 [20] package require robust accounting of GHGs across sectors, including land use and bio-based value chains.
This article has the following structure. Section 2 presents the materials and methods of research. Section 3 provides a first stage of research—classification. Section 4 provides a second stage of research—method validation. The evaluation and analysis of the results are provided. Section 5 shows the determination of reed biomass. Section 6 provides the carbon footprint of the use of reed products. Section 7 and Section 8 present a discussion and general conclusions.
2. Materials and Methods
2.1. Satellite Data
The study used data from the Copernicus Sentinel satellites, which are among the most valuable free approaches to Earth observation resources in the world [21].
Sentinel is the European Union Copernicus program’s satellite series. The Sentinel satellite missions have been specially designed for the Copernicus Project. Sentinel-1, Sentinel-2, Sentinel-3, and Sentinel-6 are dedicated satellite missions, whereas Sentinel-4 and Sentinel-5 consist of instruments mounted on EUMETSAT meteorological satellites.
Each satellite is intended for a specific Sentinel-2 application sphere: agriculture, vegetation, land coverage, and fires. Mapping with Sentinel-2 is one of the most powerful opportunities that currently offers free satellite data.
Satellite data provide valuable information that supports service providers, government agencies, and other organizations in data acquisition and analysis. These information services are openly accessible and available free of charge, facilitating their widespread use across various sectors. The data are of high spatial resolution (Sentinel-2: 10–20 m). Data from satellites are regularly updated (Sentinel-2 every 5 days).
Copernicus is the European Union’s Earth observation program that monitors the planet and provides information services using data collected by Earth-observing satellites.
The Copernicus project is based on a string of satellites that carry out Earth ecosystem observations [22]. Copernicus’ technological opportunities, especially in terms of accessibility and access, have made Copernicus the most popular space data provider in the world.
Sentinel-2 imagery with 10 m spatial resolution provides sufficient detail for detecting larger reed belts along lake shorelines, particularly in large lake ecosystems where reed stands typically form spatially continuous patches. Although smaller or fragmented reed areas may not be fully captured at this resolution, Sentinel-2 data offer an effective compromise between spatial resolution, temporal frequency, and free accessibility for regional-scale environmental monitoring. Similar approaches using Sentinel-2 imagery have been successfully applied in previous wetland and reed mapping studies.
In a study of the lake, Sentinel-2 satellites were used to obtain reed data. Maps containing specific lakes were searched for, which were then processed using QGIS 3.44 capabilities. Manual object marking was performed to classify map objects (reed, water, forests, meadows, etc.). All satellite data were acquired in the month of October.
2.2. Use of GIS
QGIS [23] is a free, open-source geographic information system (GIS) that allows users to view, edit, and analyze spatial data; create maps; process satellite imagery; and perform spatial analysis and modeling. It is a powerful cartographic and geospatial data processing tool with extensive plugin support. QGIS allows users to create maps from raster and vector layers and supports a wide range of formats through open-source libraries.
QGIS is one of the most popular GIS tools in the world because it has no license fees, has a very wide range of plugins, runs on the most popular operating systems, and supports various data formats. Of the many QGIS plugins, the Semi-Automatic Classification Plugin (SCP), Segmap, and QLEARN were used in this research.
SCP is one of the most powerful and popular QGIS plugins for working with Sentinel-2 satellite data. In our research, it was used for classification purposes to distinguish reeds from other objects.
SegMap is a QGIS plugin that uses machine learning capabilities for rapid map digitization. The plugin integrates artificial intelligence capabilities with QGIS to enable efficient land-cover mapping, infrastructure monitoring, and environmental analysis.
QLEARN is a QGIS plugin that enables classification using modern machine learning algorithms. It is integrated into the QGIS environment and was used in our study to train and predict existing classified features.
To identify reeds in lakes using GIS, it is necessary to combine several methods. First, satellite data is used to identify various objects in the surrounding field. Second, these objects are classified to distinguish reeds.
The QLEARN 1.0 plugin was used to test the model, which simplifies model training tasks by allowing you to train a neural network model for segmenting and classifying any type of raster geospatial data using a GUI interface in the QGIS environment.
The object classification created with the SCP extension can be used to train a neural network, which helps to avoid initial object recognition and apply the trained model to any other areas on the map.
The training process involves marking the desired object areas with the aim of training the model to recognize only the desired range of objects (this time, only reeds).
The previously trained neural network model can be used to classify objects in other regions. To begin, a map fragment for the selected area must be prepared by cutting out satellite images. QLEARN contains a module that performs classification for another area (Lake Cirma) based on the trained model.
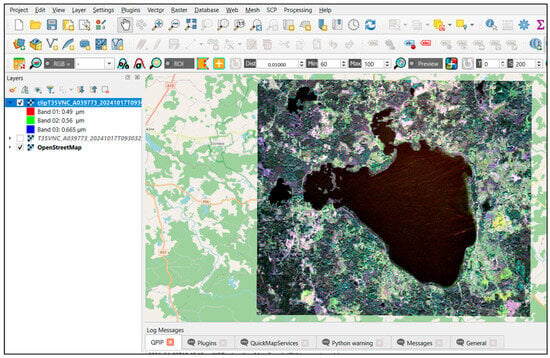
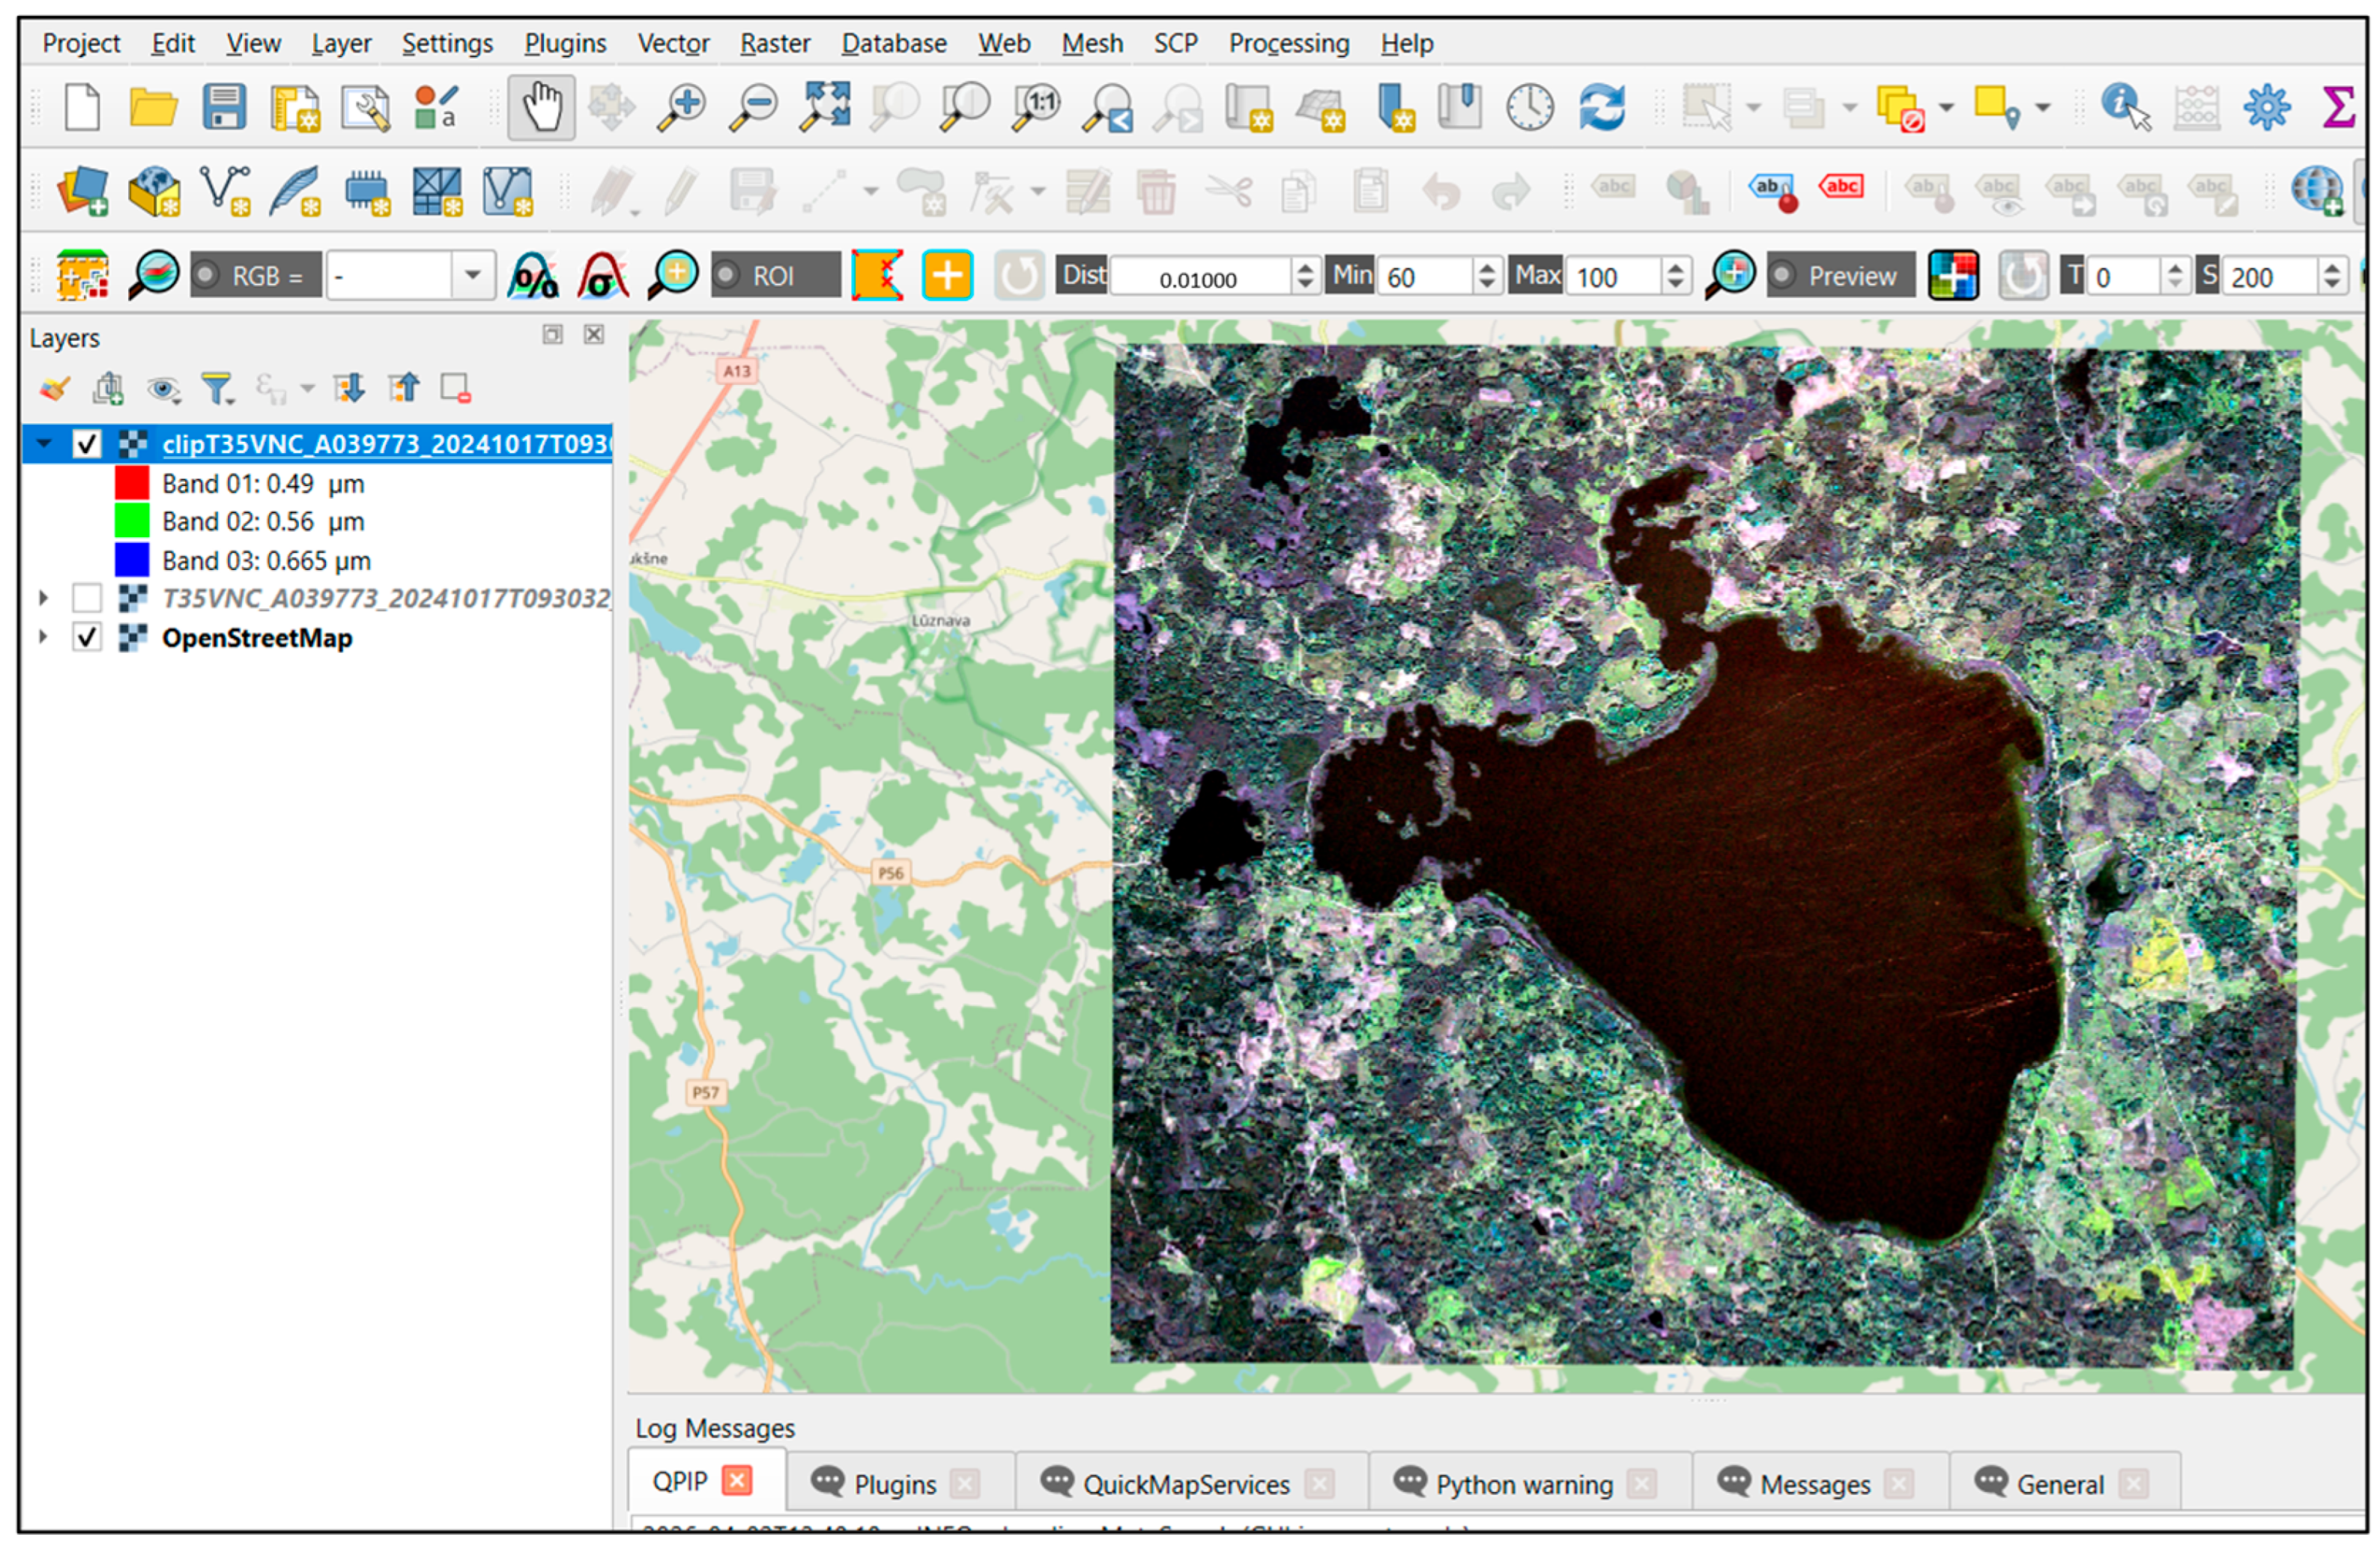
A fragment of the Lake Rāzna map in the QGIS environment is shown in Figure 1.
Figure 1.
Lake Rāzna map fragment in the QGIS environment.
2.3. Carbon Footprint Evaluation
The carbon footprint modeling components build upon the satellite data and GIS approach to quantify GHG emissions related to potential reed valorization pathways within bioeconomy strategies. The carbon footprint modeling is compliant with Life Cycle Assessment, which is a standardized methodological framework used to evaluate the environmental impacts associated with all stages of a product’s life cycle, from raw material extraction through production, use, and end-of-life management. The methodological framework of LCA is internationally standardized under ISO 14040 and ISO 14044, which define its principles, structure, and reporting requirements [24,25].
The primary objective of the carbon footprint assessment within the context of the study is to assess and compare different reed valorization pathways. The scope of the carbon footprint model is structured to represent distinct stages of the reed-based product with a clearly defined set of processes and input parameters from raw material acquisition to final product delivery to the customer. The reed products included in this model are:
- Reed-based pellets;
- Reed-based bioethanol;
- Reed insulation panels;
- Reed roofing materials (reed thatching).
Within the context of this research, climate change is the primary impact category, and GHGs were expressed in kilograms or tonnes of CO2 equivalents, using characterization factors consistent with IPCC global warming potentials over a 100-year time horizon without biogenic carbon accounting [26], in line with ISO 14067 [27] that defines requirements and guidelines for quantification. of carbon footprint of products. Under cradle-to-gate boundaries, including biogenic carbon uptake without accounting for the subsequent release of that carbon at the end of life would lead to an incomplete and potentially misleading representation of the carbon balance. For products used for fuel, most of the biogenic carbon stored in the biomass would be released during use. In contrast, construction products such as insulation panels or roofing materials may store biogenic carbon for extended periods, with emissions occurring later or under different end-of-life scenarios. These end-of-life dynamics differ fundamentally between fuel and material pathways and are outside the scope of the present study. While this limitation may influence the absolute comparison of different valorization pathways, the selected boundary allows for a consistent and focused evaluation of upstream processes directly linked to spatial biomass availability and logistics. In particular, the approach enables the analysis of how variations in reed distribution, biomass quantity, and transport distance affect the carbon footprint of early-stage bioeconomy value chains.
Uncertainty is inherent in the estimation of peatland GHG emissions and arises from several sources. These include potential errors in land-cover classification from satellite imagery, particularly due to spectral similarity between peatland types and the use of single-date data. Additional uncertainty is related to the assignment of emission factors, which may not fully reflect site-specific conditions such as groundwater level and peat characteristics. Simplified assumptions, including homogeneous emission behavior within classes and the exclusion of temporal variability, further contribute to uncertainty. While these factors may influence absolute emission values, they do not affect the relative spatial patterns identified, and the results remain robust for comparative analysis and decision-support purposes.
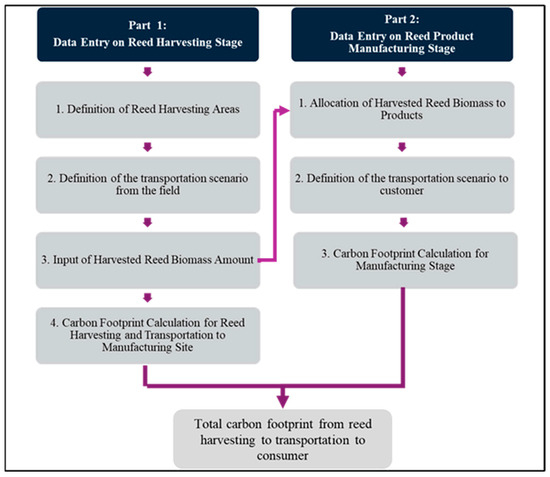
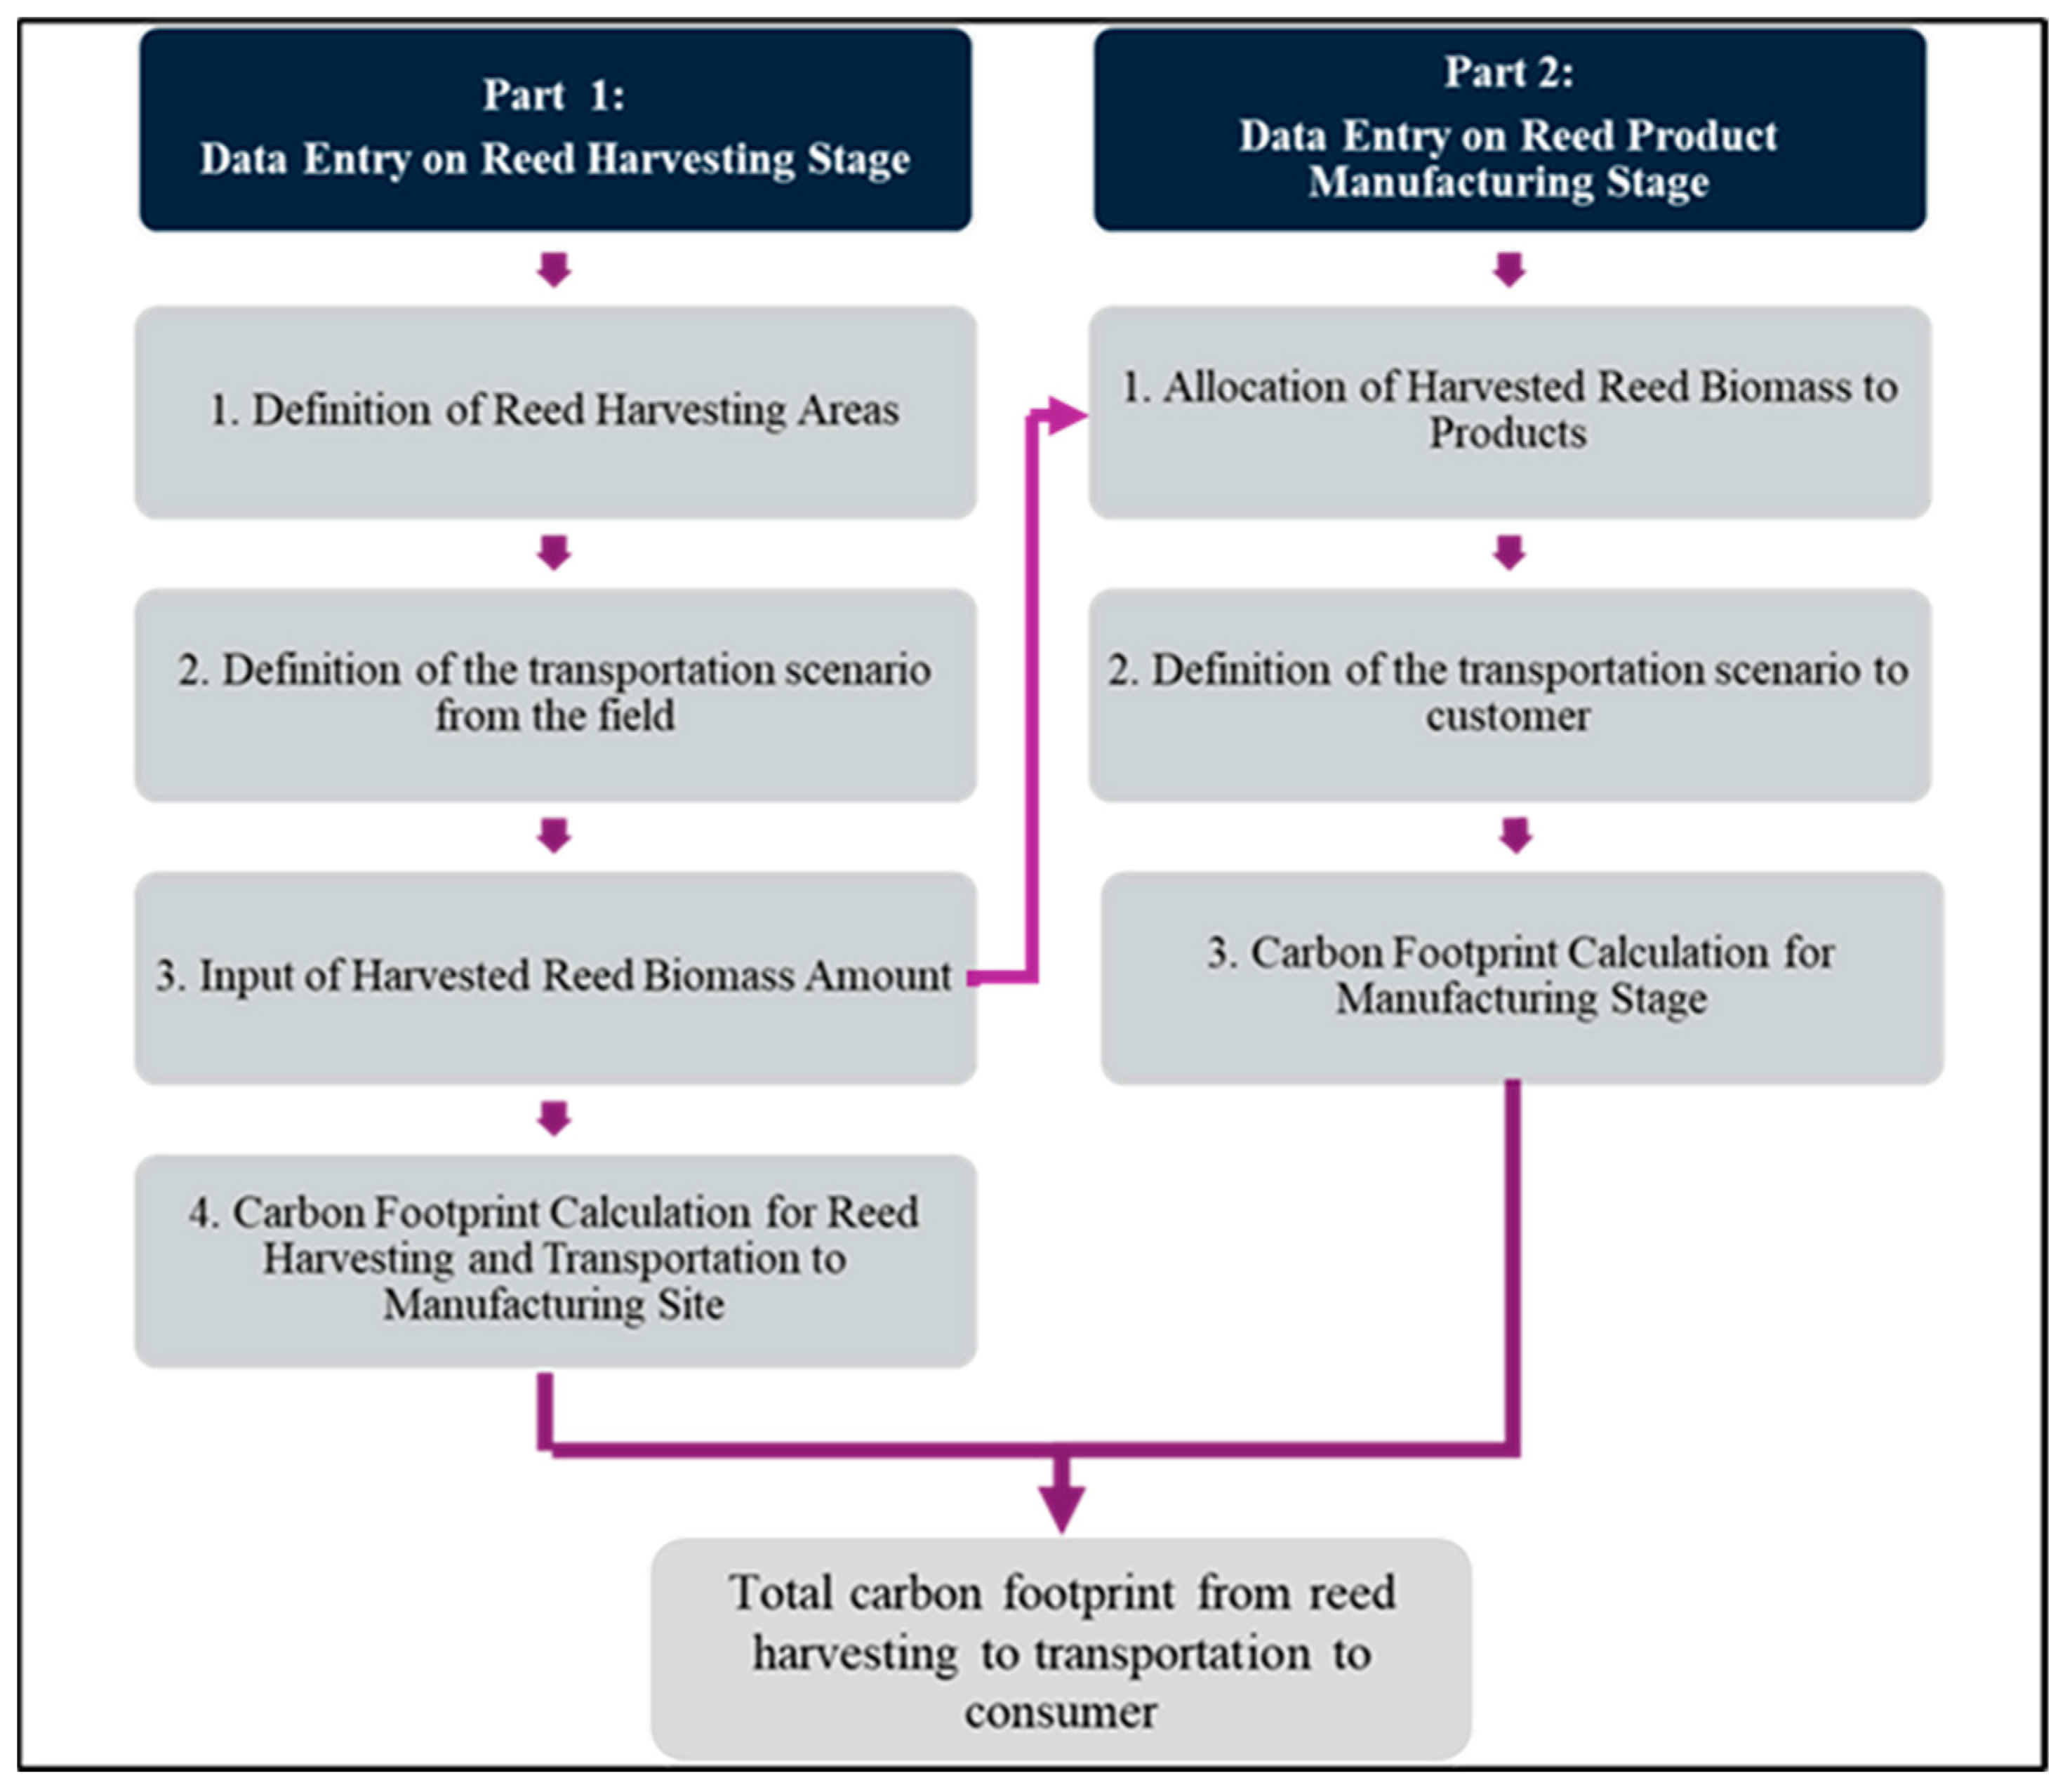
The most appropriate reference functional unit for accounting the carbon footprint for different reed valorization pathways is 1 tonne of dry reed biomass available for valorization. The functional unit ensures comparability across valorization options. The developed carbon footprint model structure is presented in Figure 2.
Figure 2.
Structure of carbon footprint evaluation model for reed-based products.
In part 1, the reed harvesting stage includes the transportation of harvested reed biomass (see Table 1). Reed harvesting areas are derived from Satellite and GIS data and represent the spatial units of biomass production in hectares (ha). Multiple harvesting areas can be defined to reflect spatial variability in reed availability, harvesting intensity, and local logistical conditions. This is followed by the definition of the transportation scenario from the field, where users select the transport mode and specify the transport distance associated with moving harvested reed biomass to the processing location. The input for harvested reed biomass quantities corresponds to each harvesting area in tons of reed, estimated based on a satellite data model. The reed amount represents the harvested dry biomass used to calculate transport emissions as transported mass per distance. Based on these inputs, the carbon footprint calculation is performed, accounting for emissions from harvesting operations and transport activities.
Table 1.
Inventory data of reed harvesting and transportation.
Further, in part 2, the model considers the allocation of harvested reed biomass to specific reed-based products. This allocation step is directly linked to the total harvested biomass calculated in the harvesting stage and is subject to a mass balance check to ensure consistency between the two parts. For each valorization pathway, the user-defined reed amount (in tonnes of dry biomass) is multiplied by pathway-specific cradle-to-gate emission factors derived from dedicated LCA studies of pellet, bioethanol, insulation panel, and roof thatching production to quantify the manufacturing-stage carbon footprint per tonne of reed input as given in Table 2.
Table 2.
Inventory data of reed-based product manufacturing.
The transportation scenario to the customer is defined for each product, including the selection of transport mode and transport distance. Transport to the customer is modeled using the same Ecoinvent-based emission coefficients (kg CO2 eq per tkm) as applied for the harvesting-stage transport, ensuring methodological consistency across upstream and downstream logistics within the cradle-to-gate system boundary.
In order to assess the influence of logistical parameters on the overall carbon footprint, a sensitivity analysis was performed focusing on transportation distance between reed harvesting sites and processing facilities. Transport distances of 10, 20, 30, 40, and 50 km were considered as representative regional scenarios for Latvia.
For each distance, total GHG emissions were calculated for all reed valorization pathways (pellets, bioethanol, insulation panels, and roof thatching) by combining emissions from harvesting, transportation, and production stages. Transportation emissions were estimated using tonne-kilometer-based emission factors from the Ecoinvent database, while keeping all other parameters constant.
From a resource management perspective, spatial planning becomes a key factor in ensuring both environmental and economic sustainability. The results of this study indicate that transport distance significantly influences the overall carbon footprint, particularly for low-emission pathways. This implies that decentralized or regionally optimized processing systems may enhance both environmental performance and economic feasibility by reducing logistical costs and emissions. Although a detailed techno-economic analysis was not performed in this study, the integrated GIS-LCA framework provides a foundation for future assessments that combine environmental impacts with economic indicators, supporting more comprehensive decision-making for sustainable reed resource utilization.
Reed biomass harvested in autumn and winter is suitable for both solid fuel and bioethanol production. Reed green mass is suitable for biogas production, but harvesting reeds in summer cannot ensure their sustainability—reed stands may disappear.
It is not recommended to harvest all reed areas every year, as this causes changes in the structure of the reed stands and can have a negative impact on the populations of living organisms living in the stands. In order not to have a negative impact on the reed stands and the living organisms living in them, in practice, no more than 50% of the total volume can be harvested each year. An additional factor is that reed stands are often located within specially protected natural areas, where economic activity is prohibited.
3. The First Stage of Research—Classification
3.1. Research Object for First Stage
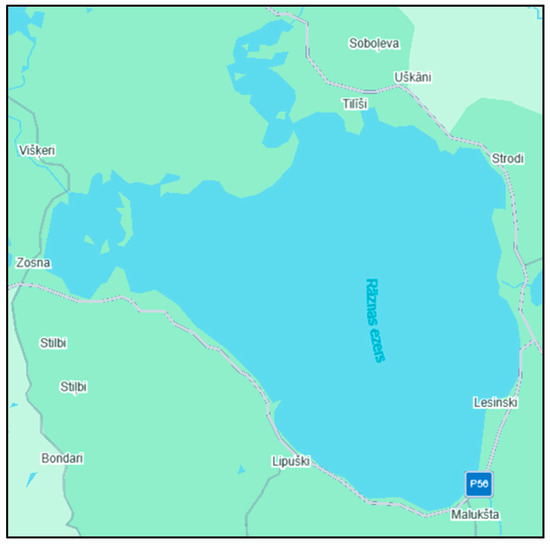
In the first stage of the research, Lake Rāzna (Figure 3) was selected as the research object—the second largest lake in Latvia and the largest by volume [28]. The characteristics of the lake are shown in Table 3.
Figure 3.
Location and satellite image of Lake Rāzna used for reed classification analysis.
Table 3.
Lake Rāzna characteristics.
3.2. Classification Methods
Training samples (regions of interest) for each land-cover class were manually selected from multiple spatially distributed areas of the satellite images to capture the spectral variability of the main surface types (water, forest, soil, grass, and reeds). Care was taken to select representative samples from different parts of the lake shoreline in order to reduce potential bias in the classification process.
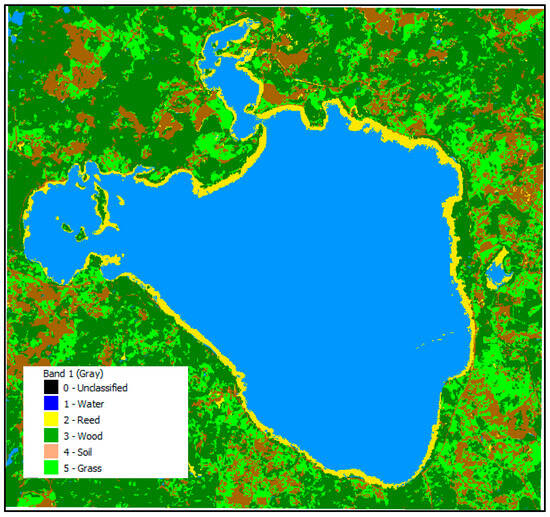
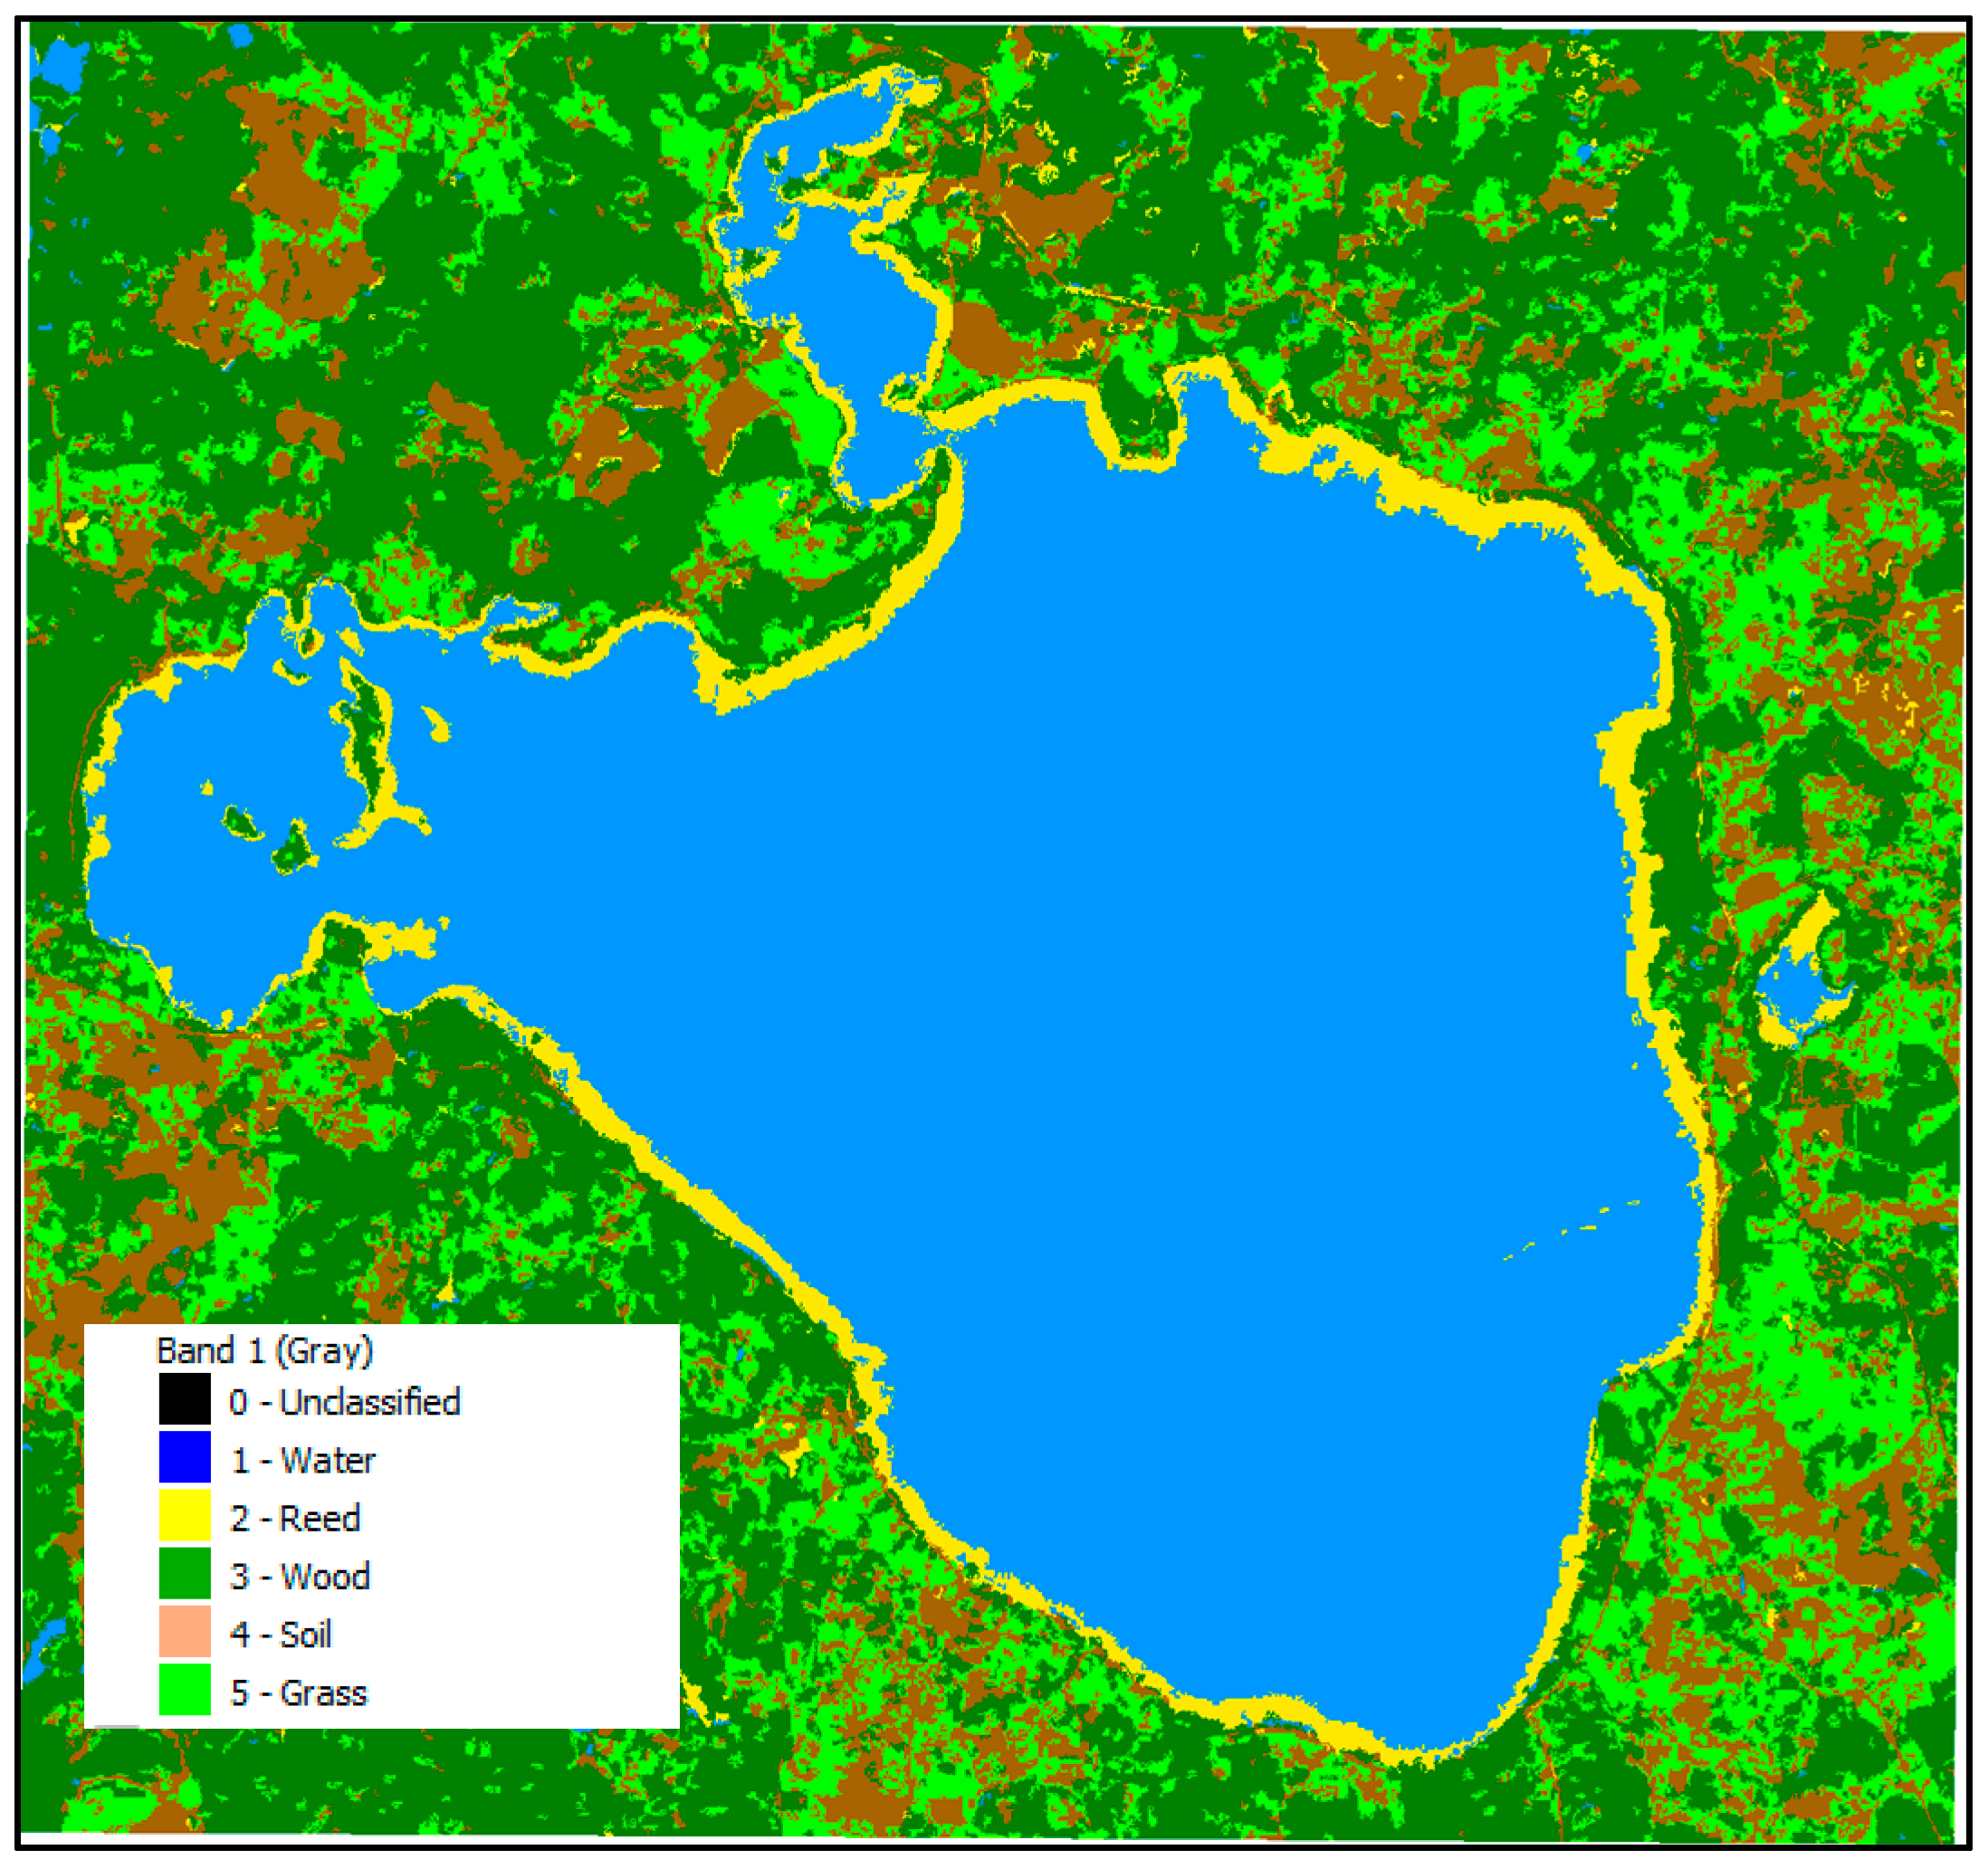
Once a high-quality image of the lake has been selected, object selection for classification is carried out to differentiate reeds in the lake from other surrounding objects. The following designations were used to classify the objects: 0—Unclassified objects, 1—Water, 2—Reed, 3—Wood, 4—Soil, 5—Grass. The designations of map objects are shown in Figure 4.
Figure 4.
Reeds (yellow) in the lake in 2020.
Of the many classification methods, two were experimentally selected to determine the most appropriate and accurate object for classification: Random Forest and Minimum Distance Algorithm. The Random Forest method is a decision-tree-based method for classification purposes [29]. Minimum distance Dijkstra’s algorithm is an algorithm for finding the shortest path between knots weighted in the graph. It can be used to find shorter paths from the source peaks for all the rest of the peaks, weighted in the graph. Minimum distance calculation is a statistical method model for adaptation data, which is used also for classification purposes [30].
3.3. Results of the First Stage
The following steps were performed sequentially in the study:
- Using the Copernicus, suitable lake maps with cloud cover of up to 5% are identified for the selected time period;
- Appropriate objects are identified for classification in the QGIS;
- An appropriate classification algorithm from SCP is selected;
- Classification is performed, and the results obtained are analyzed.
Maps of Lake Rāzna for the years 2020, 2021, 2023, and 2024 were obtained for the month of June, when reed growth has already ended. The initial parameters of the Random Forest algorithm were set to 2000 trees. Figure 4 illustrates the result for the year 2020. Results for the other years are available in the authors’ previous study [31].
Summary of the reed areas in Lake Rāzna over the years is shown in Table 4.
Table 4.
Results of the classification of reed areas in Lake Rāzna by year.
Thus, this is an opportunity to compare experimental results with data from [32], which estimated that in 2008, the reed area accounted for about 4% of the water surface area.
4. The Second Stage of Research—Method Validation
4.1. Research Object for Second Stage
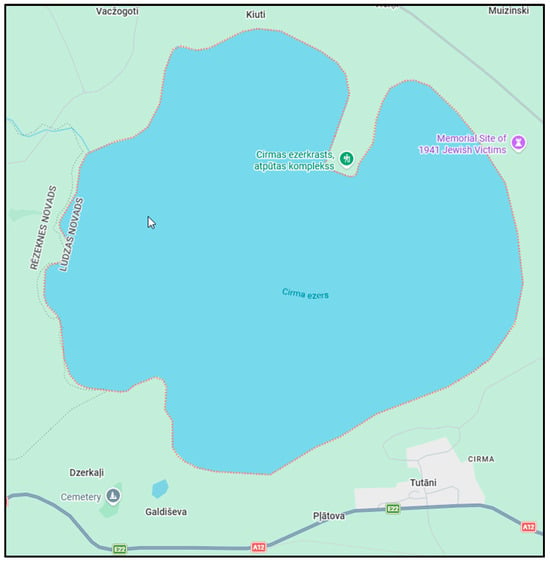
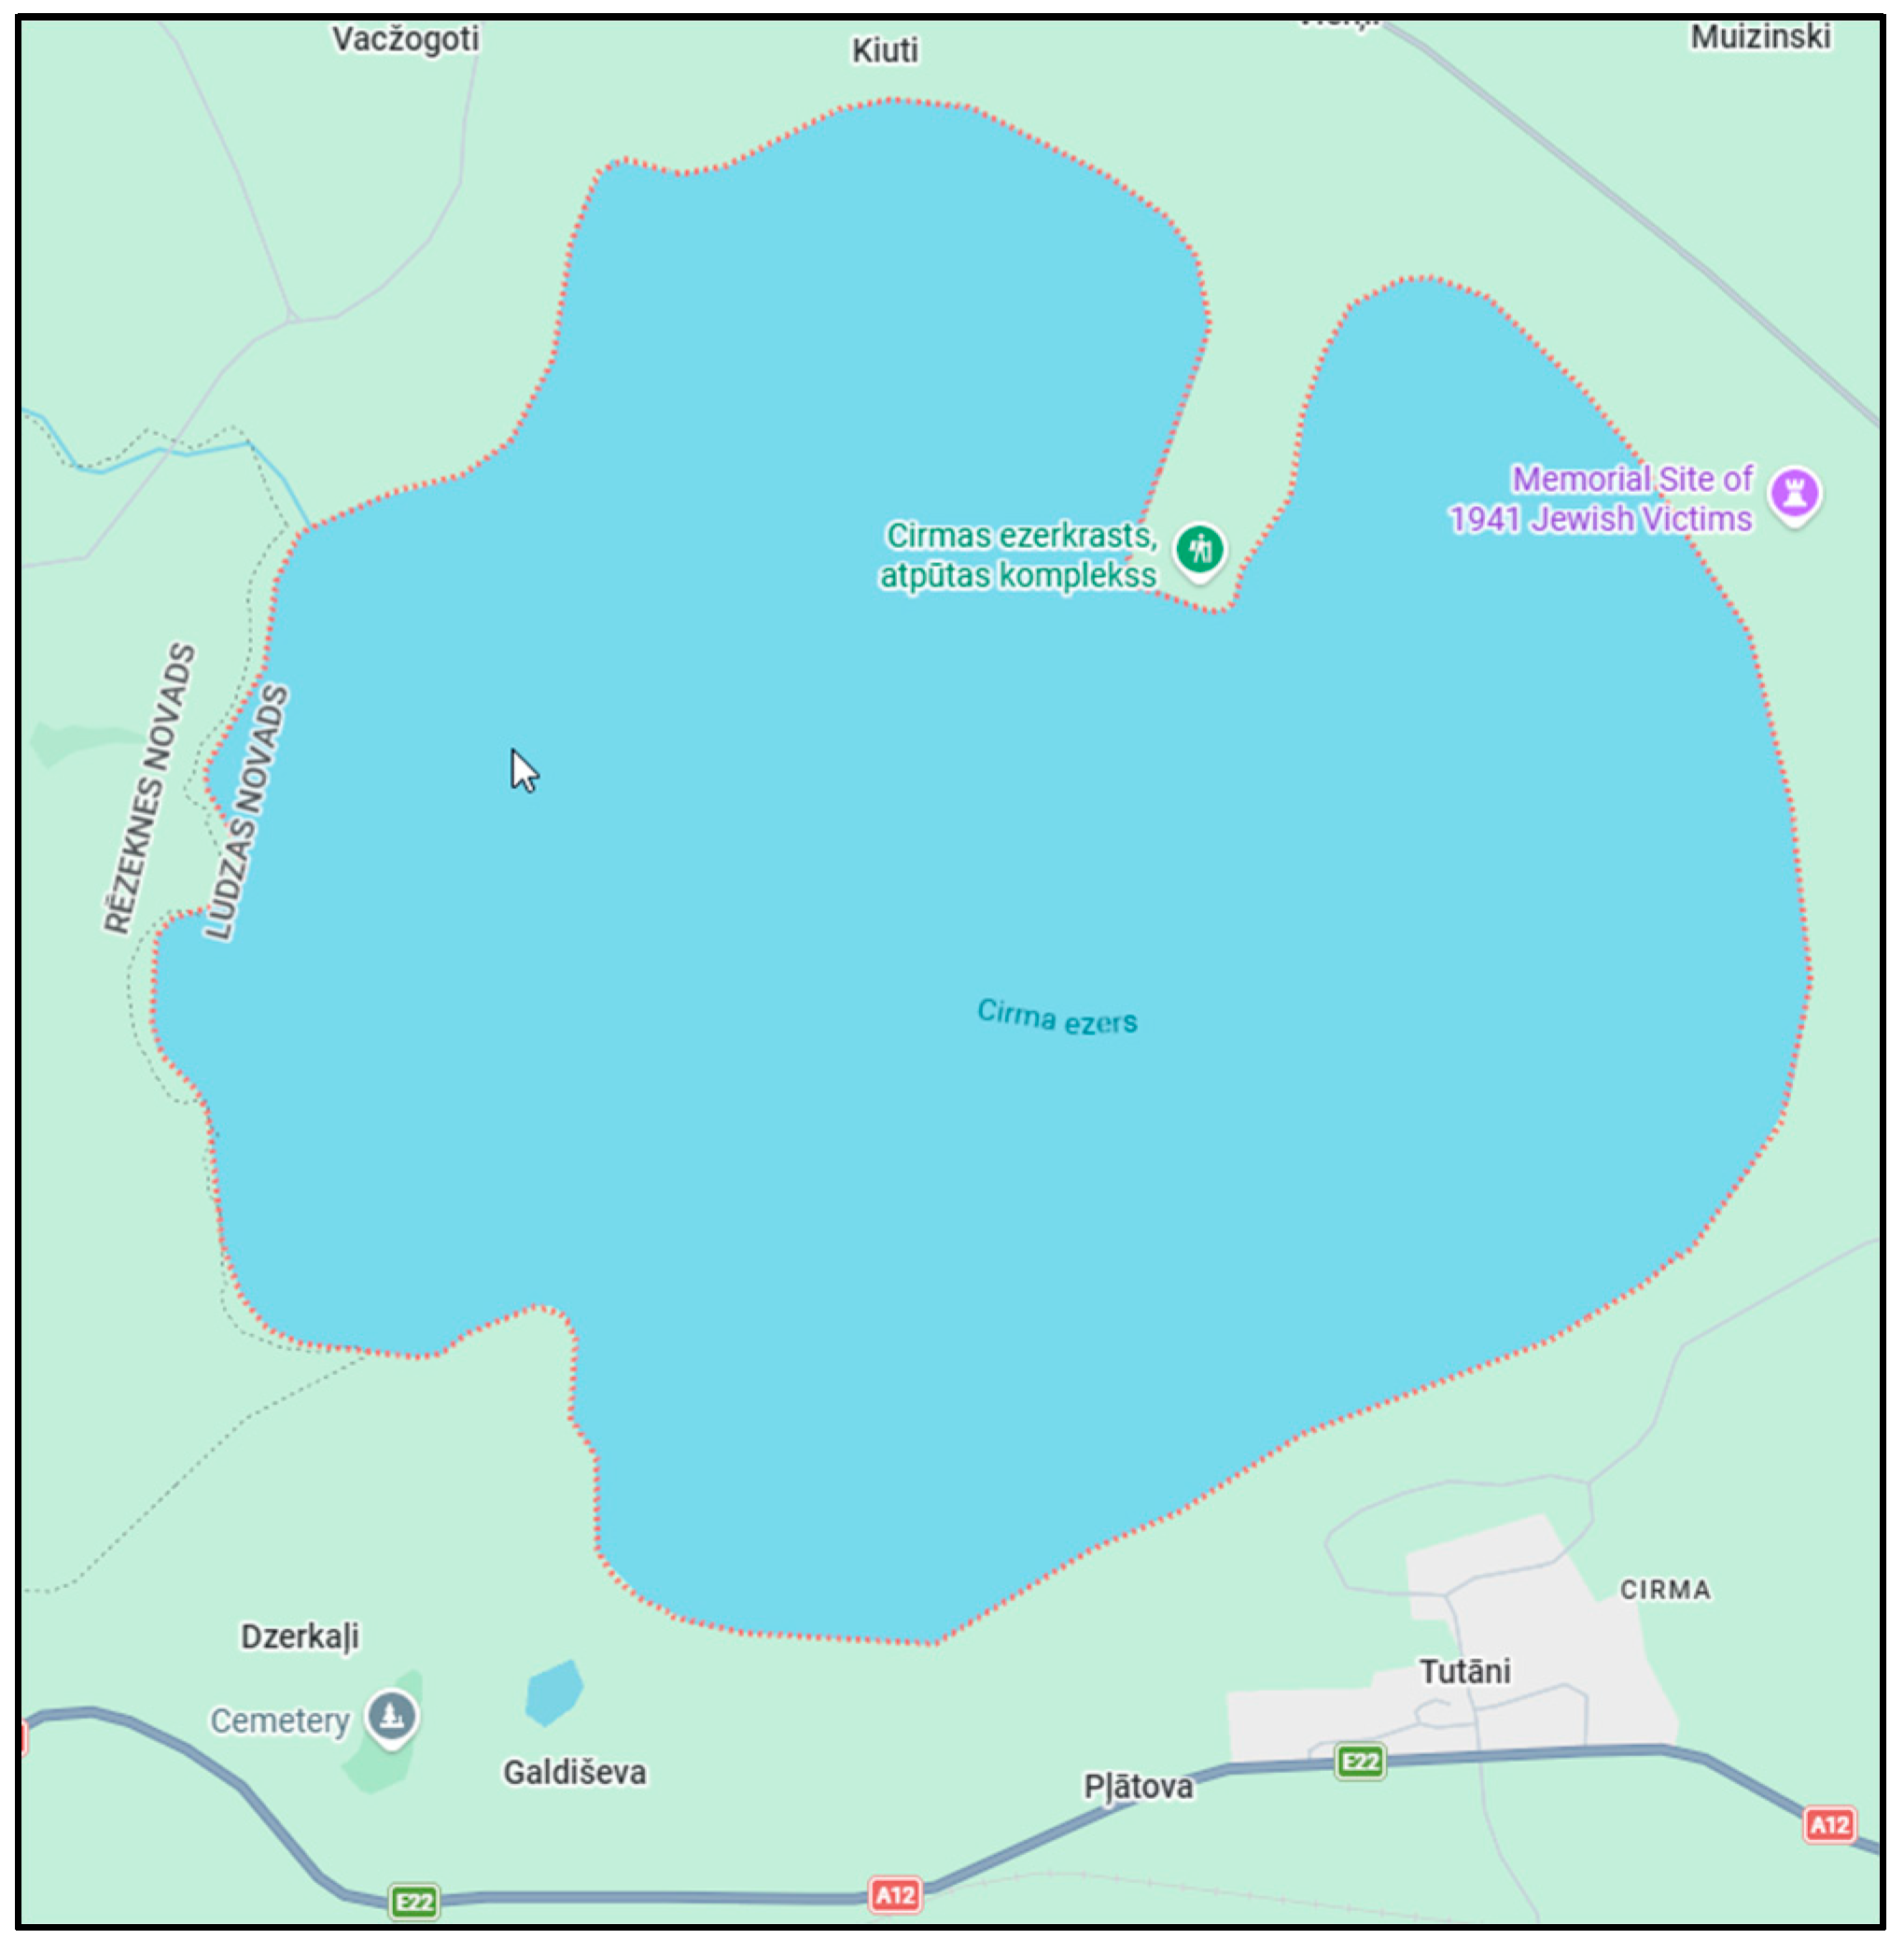
The developed model was also verified for other lakes in Latvia, and in the second stage of the study, Lake Cirma (Figure 5) was chosen, which is geographically close to Lake Rāzna—the distance between the lakes is approximately 30 km in a straight line. Lake Cirma is one of the largest lakes in Latvia. The characteristics of the lake are shown in Table 5.
Figure 5.
Location and satellite image of Lake Cirma used for reed classification analysis.
Table 5.
Lake Cirma characteristics.
4.2. Results of the Second Stage
In this research, the second stage does not represent a strict model validation based on independent ground reference data. Instead, the trained classification model was applied to another lake with similar ecological conditions to evaluate the transferability and stability of the method across different spatial contexts. Such a cross-site application allows assessing whether the developed classification approach produces consistent results when applied to comparable lake ecosystems.
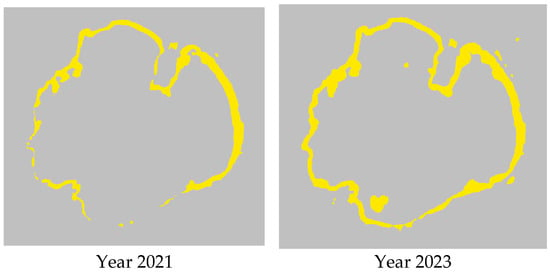
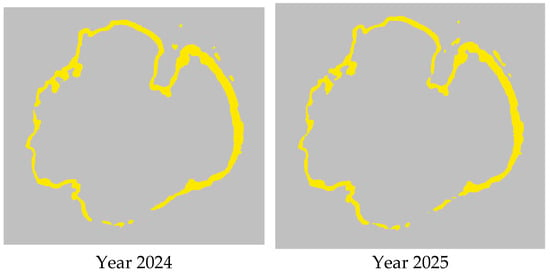
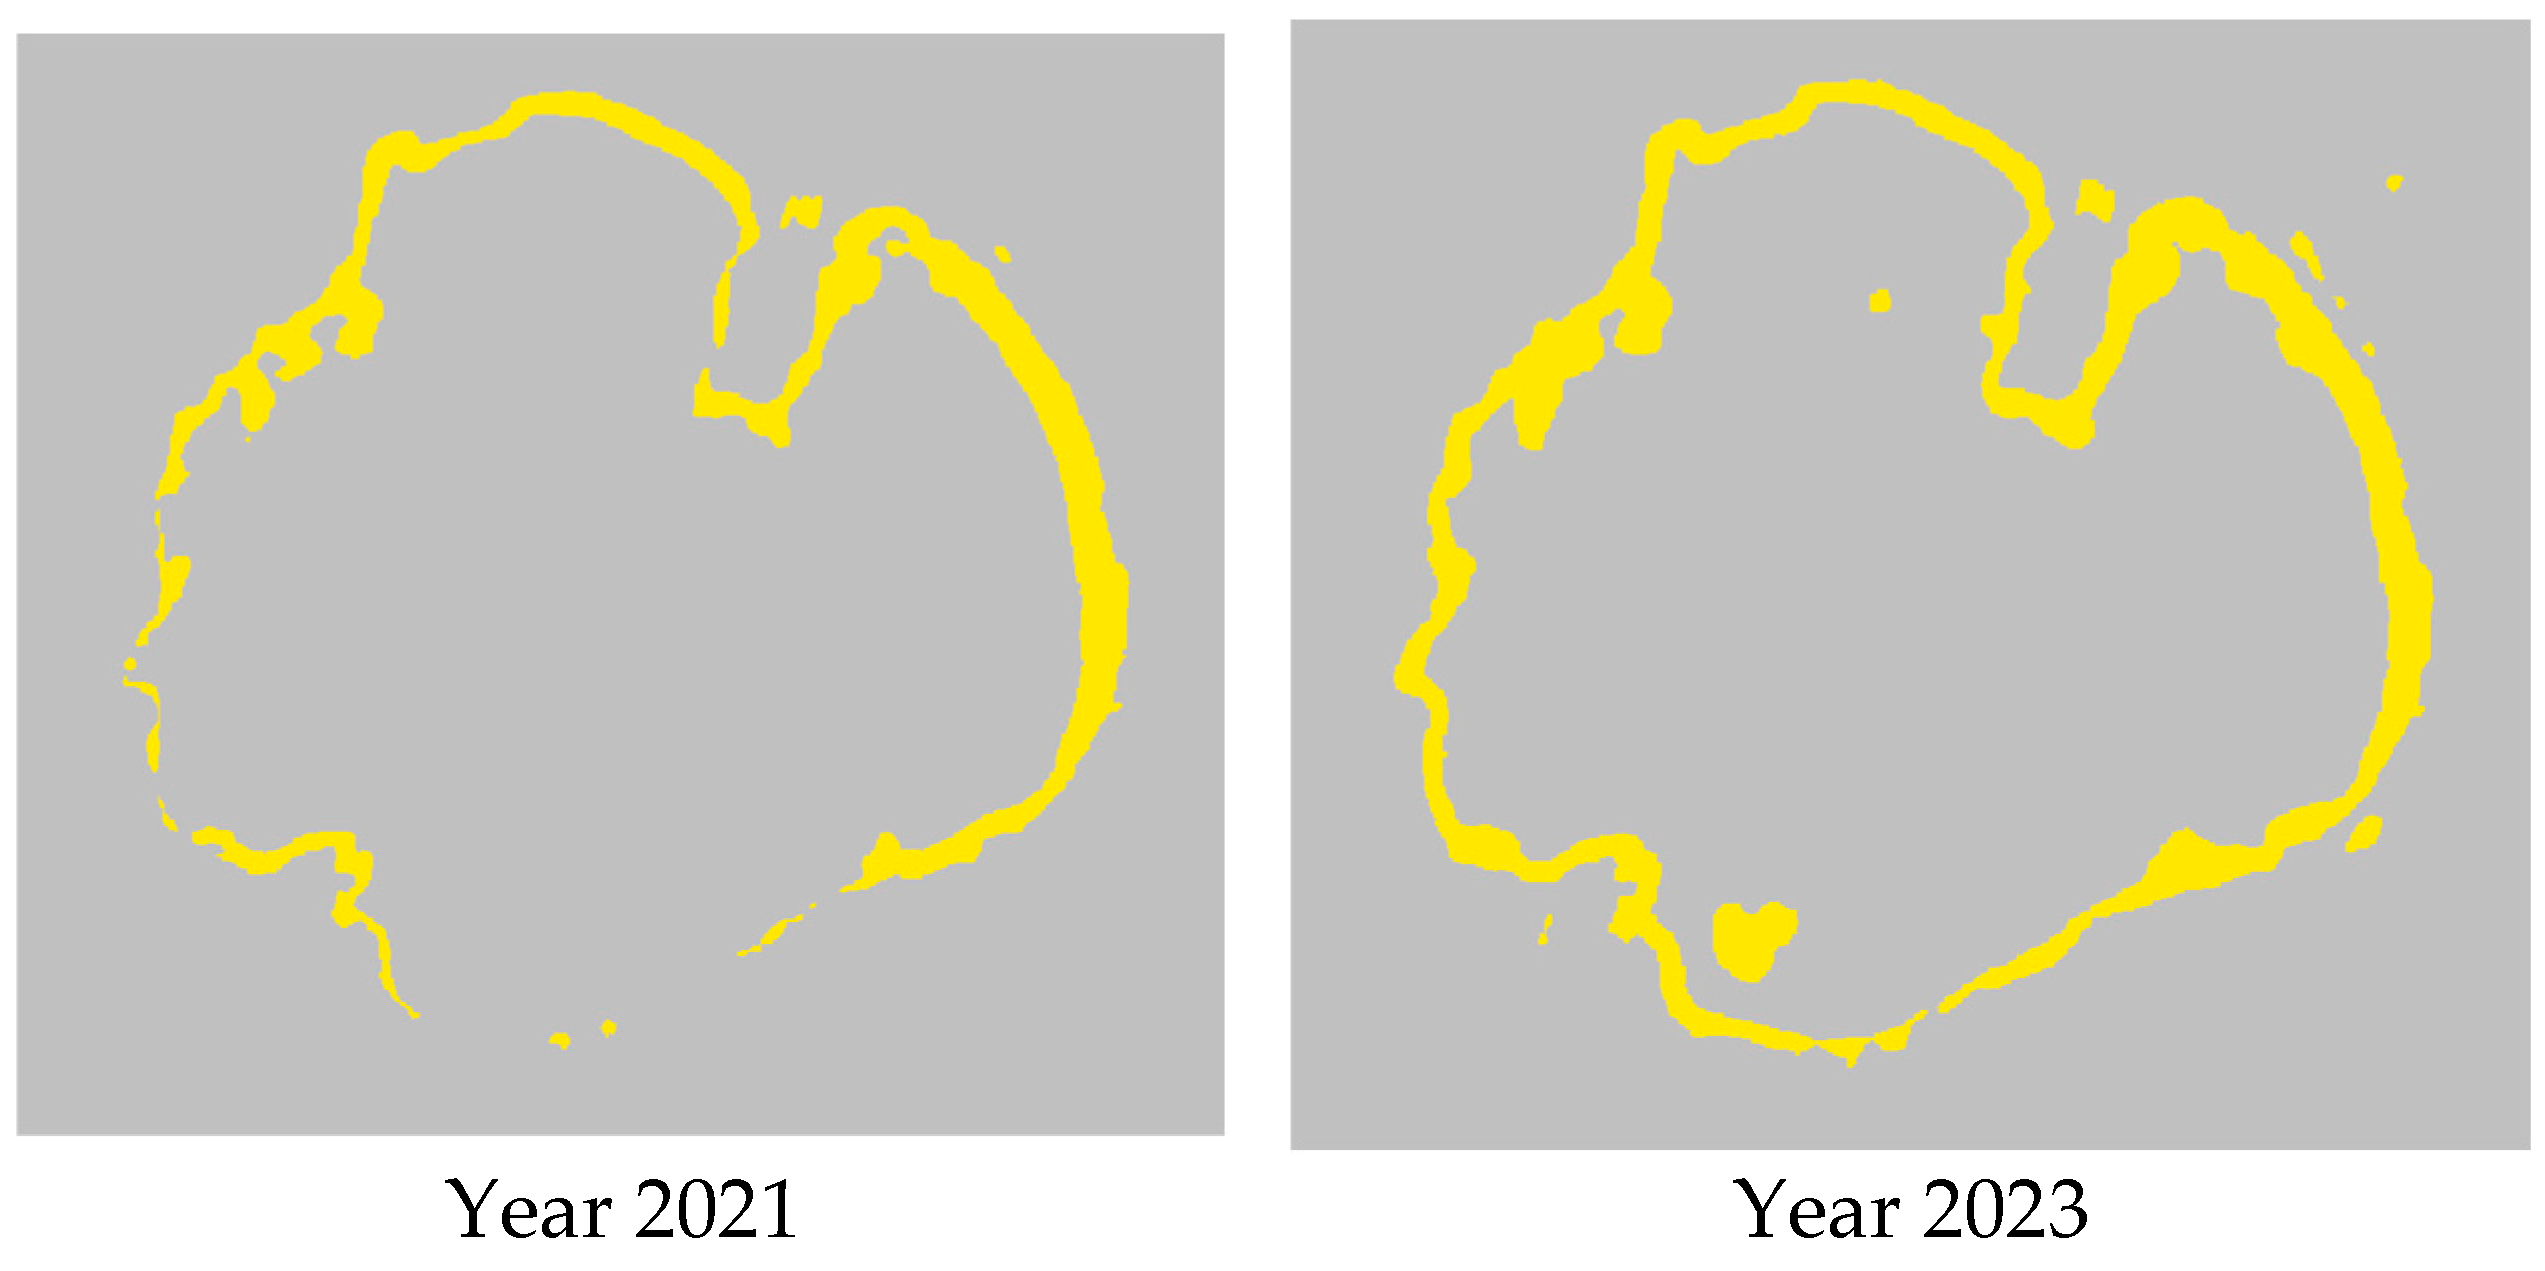
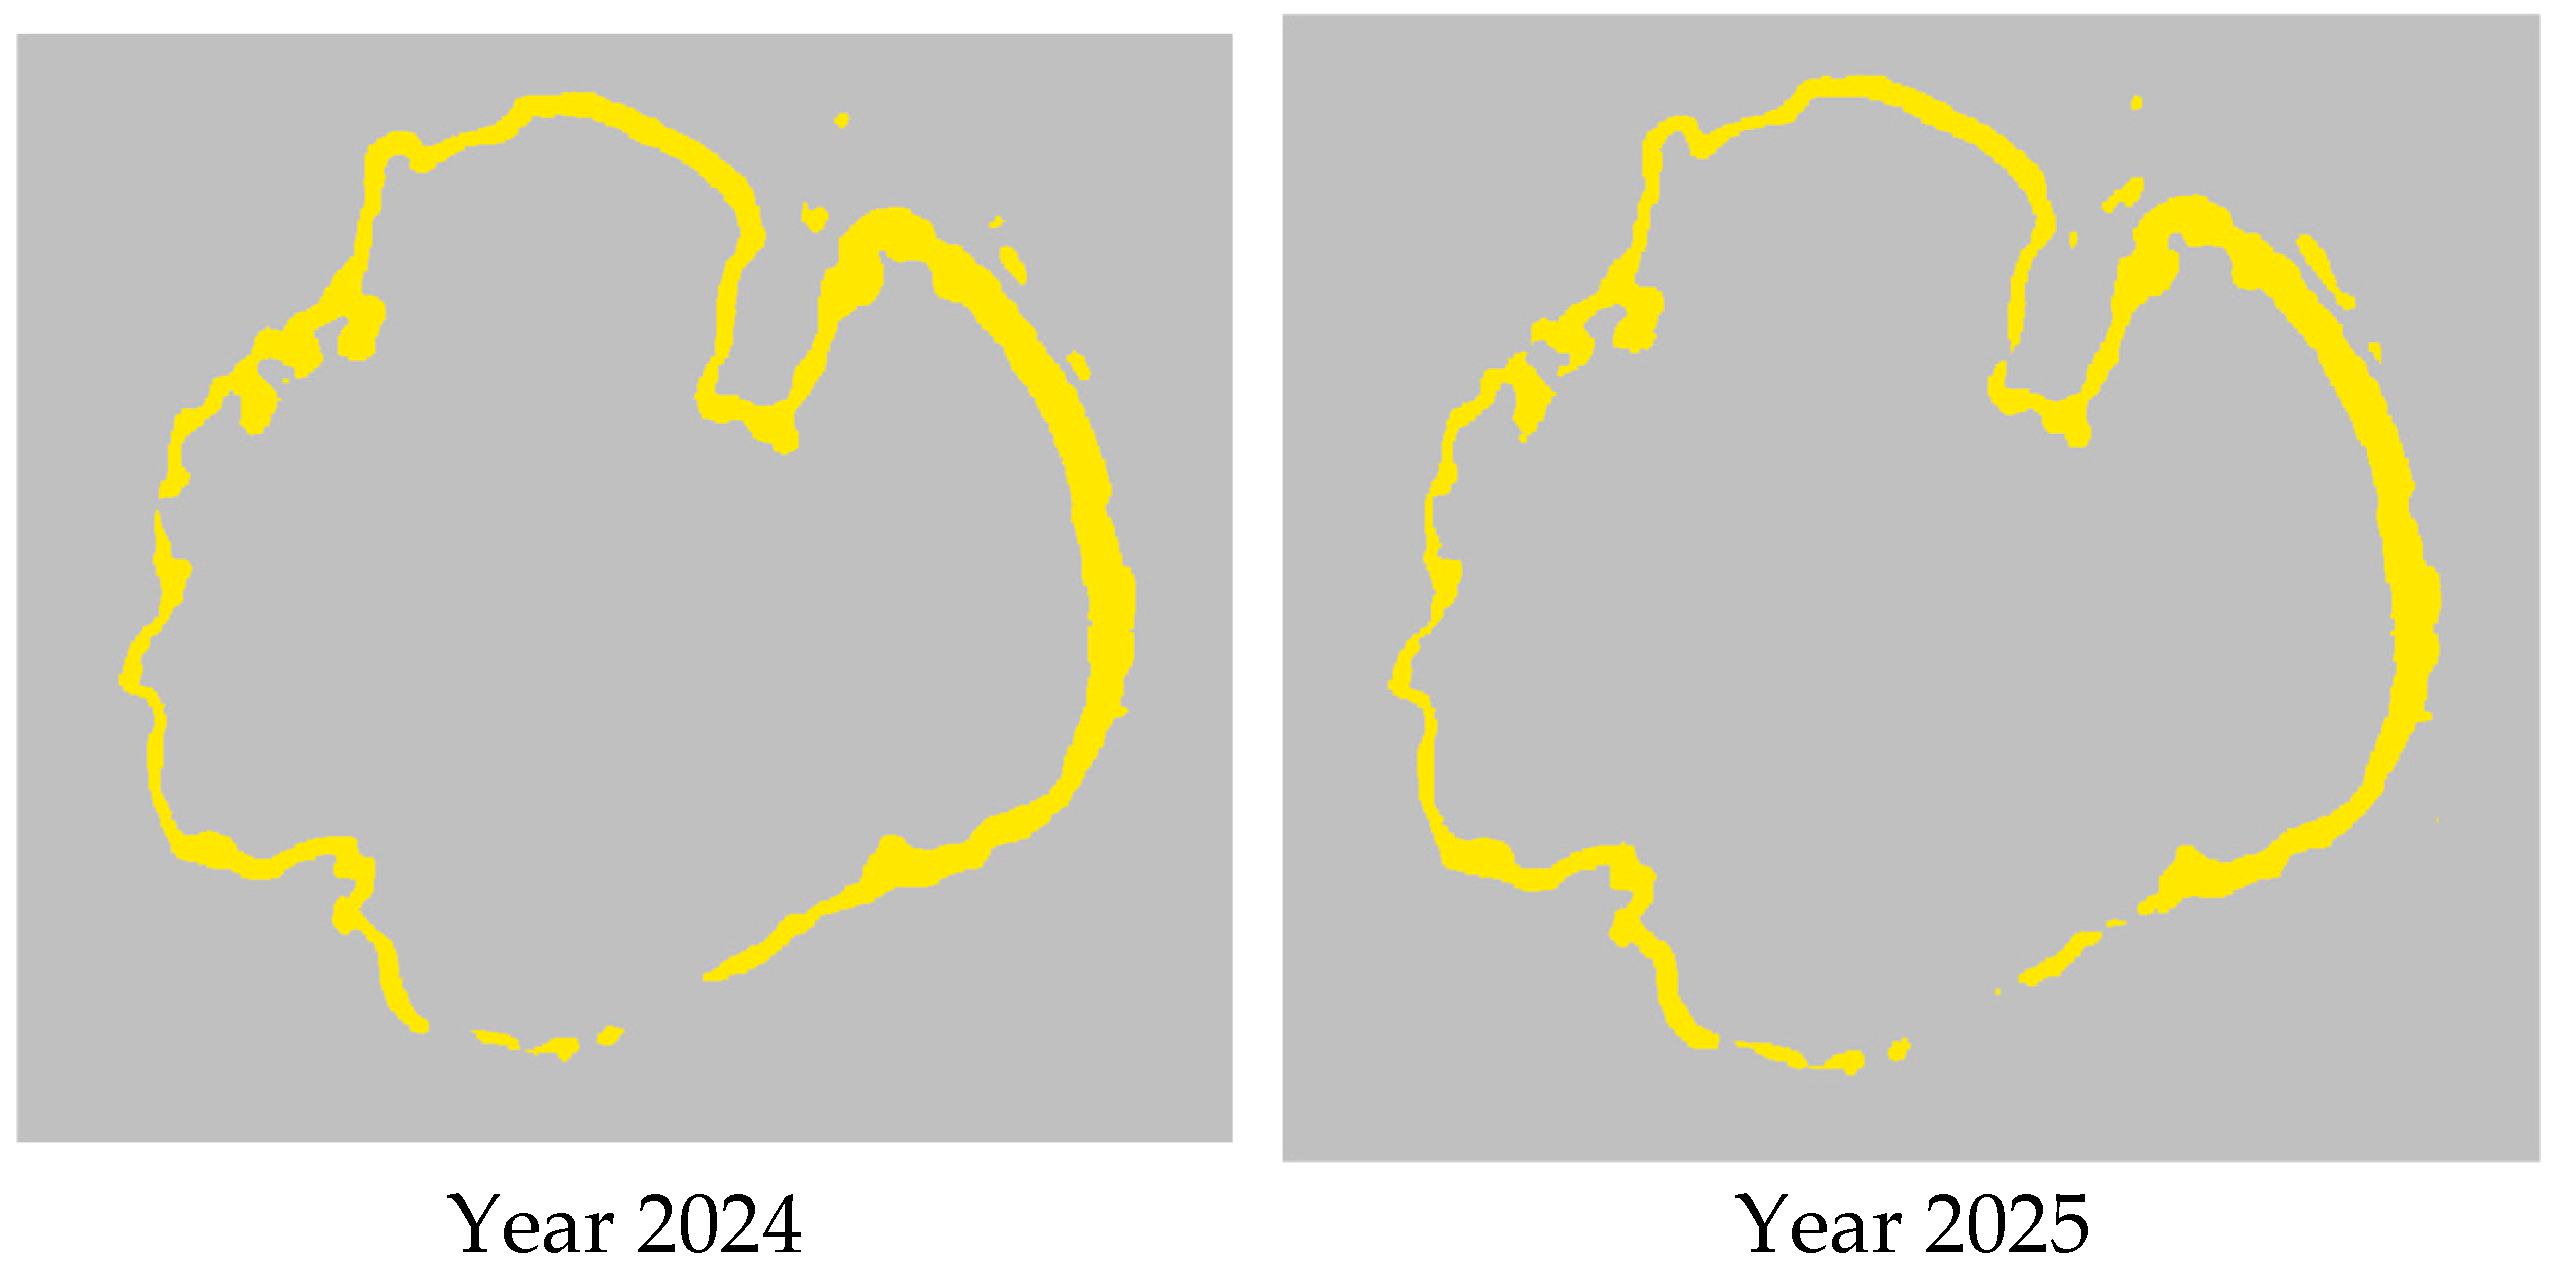
To verify the model, maps of Lake Cirma for the years 2021, 2023, 2024, and 2025 were acquired in October. No high-quality maps were found for 2022.
Figure 6.
Reeds in Lake Cirma.
Table 6.
Classification results for Lake Cirma.
These tabular data make it possible to assess changes in reed areas.
The model trained with the classification data from Lake Rāzna produced the following results: training accuracy: 98.39%; validation accuracy: 98.74%.
In the context of the research, the primary objective was not to develop a fully supervised land-cover classification model but rather to establish an integrated methodological framework for estimating reed biomass availability using satellite imagery and GIS tools and link these results with carbon footprint modeling.
The study relies on Sentinel-2 imagery and semi-automatic classification in the QGIS environment, where training samples were selected based on spectral characteristics of known reed areas. Because the study focuses on historical satellite data and large-scale lake environments, independent ground-truth datasets for the analyzed years were not available. For this reason, a traditional confusion matrix-based accuracy assessment could not be performed.
Instead, the reliability of the classification results was evaluated using two complementary approaches:
- 1.
- Method transferability test.
The trained model was applied to another lake (Lake Cirma) located in a similar ecological region. The model successfully identified reed areas and produced consistent spatial patterns across multiple years, demonstrating the robustness of the classification approach.
- 2.
- Comparison with independent literature data.
Because independent ground-truth datasets for the analyzed years were not available, a standard confusion matrix-based accuracy assessment could not be performed. Instead, the reliability of the classification results was evaluated through methodological transferability and comparison with the previously reported data. The estimated reed coverage in Lake Rāzna (approximately 3–4% of the lake area) is consistent with values reported in earlier studies [32], supporting the plausibility of the obtained classification results.
5. Determination of Reed Biomass
Along with the development of the world economy, the energy demand is increasing. Renewable energy resources are becoming increasingly important in energy supply because of their sustainability and lower levels of pollution compared with fossil energy sources. Among these resources, biomass is one of the most widely used. However, in recent years, increased attention has been directed toward the use of non-traditional biomass sources, such as cultivated energy crops and wood residues (stumps, branches, etc.), in order to reduce the reliance on forests.
One of the plants that could be used for energy production in Latvian conditions is reeds growing in natural and artificial water bodies. According to the Latvian Lakes Database, there are 17 lakes and artificial reservoirs in Latvia with an area of more than 1000 ha; in total, reeds can be used for energy production from more than 2000 lakes in Latvia [33].
In the literature, the properties of reeds are described with considerable variation. For instance, the amount of reed biomass obtained from winter harvesting ranges from 3 to 30 t/ha [34].
The density and height of reeds also vary in different water bodies. The high fluctuations in reed productivity in different countries and locations lead to the conclusion that it is necessary to research the productivity of reed stands growing in Latvia and the factors that influence it in order to evaluate their energy potential in each water body and in Latvia as a whole. The use of reeds is associated with several positive aspects: they grow on their own and do not require planting and fertilization, unlike cultivated energy crops; they grow in places that are not suitable for growing other crops and do not compete with the food production industry to any extent; and the extraction of reeds reduces CO2 and CH4 emissions into the atmosphere, as well as the concentration of nitrogen, phosphorus and heavy metals in natural waters and in the sediments of water bodies.
Reeds yield 40–60 t/ha of green matter or 7.5–13.0 t/ha of dry matter. The literature mentions that the productivity of reed stands can reach up to 30 t/ha of dry matter when mowing reeds in the winter period [34]. In reed stands used for wastewater treatment in Estonia, the dry matter of reeds varied from 3 to 17.6 t/ha. The wide variation in reed productivity in different studies around the world suggests that it is different and depends on the location and conditions of reed growth.
In this research, the objective was to estimate the potential biomass availability based on spatial reed distribution derived from satellite imagery. Because field survey data on biomass productivity were not available for the analyzed lakes, biomass density values were derived from the literature reporting typical productivity ranges for common reeds in similar climatic regions. To address the uncertainty associated with this parameter, the study does not rely on a single fixed value but instead applies a scenario-based approach using a biomass range of 8–18 t/ha, representing minimum, average, and maximum productivity scenarios. This approach allows the results to reflect possible variability in reed biomass productivity rather than assuming a single deterministic estimate.
Reed biomass productivity may vary considerably depending on environmental conditions such as water depth, nutrient availability, and sediment characteristics. Because site-specific field measurements were not available for the studied lakes, biomass density values were derived from the literature sources and applied as a range (8–18 t/ha) representing minimum, average, and maximum productivity scenarios. This scenario-based approach partially reflects uncertainty in biomass productivity in the biomass estimation results.
The amount of lake reed biomass, depending on the reed-covered area, is typically calculated using the average biomass density per unit area according to the following expression:
Biomass (t) = Area (ha) × Biomass per 1 ha (t/ha).
The climatic conditions of Lake Cirma are similar to those of other lakes in Latvia—moderately temperate, with nutrients at an average level. The most common average range in the region is ~8–18 t/ha for dry biomass. Assuming that the minimum biomass volume is 8 t/ha, the average value is 13 t/ha and the maximum volume is 18 t/ha. Table 7 shows the biomass volume in Lake Cirma.
Table 7.
Biomass volume in Lake Cirma.
6. Carbon Footprint
The GHG emission estimation outcomes derived from the integrated satellite–LCA framework were applied to Lake Cirma. These results allow an assessment of how spatial biomass variability and pathway selection influence the overall carbon footprint of reed-based bioeconomy options.
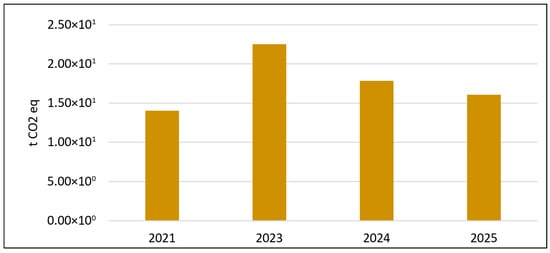
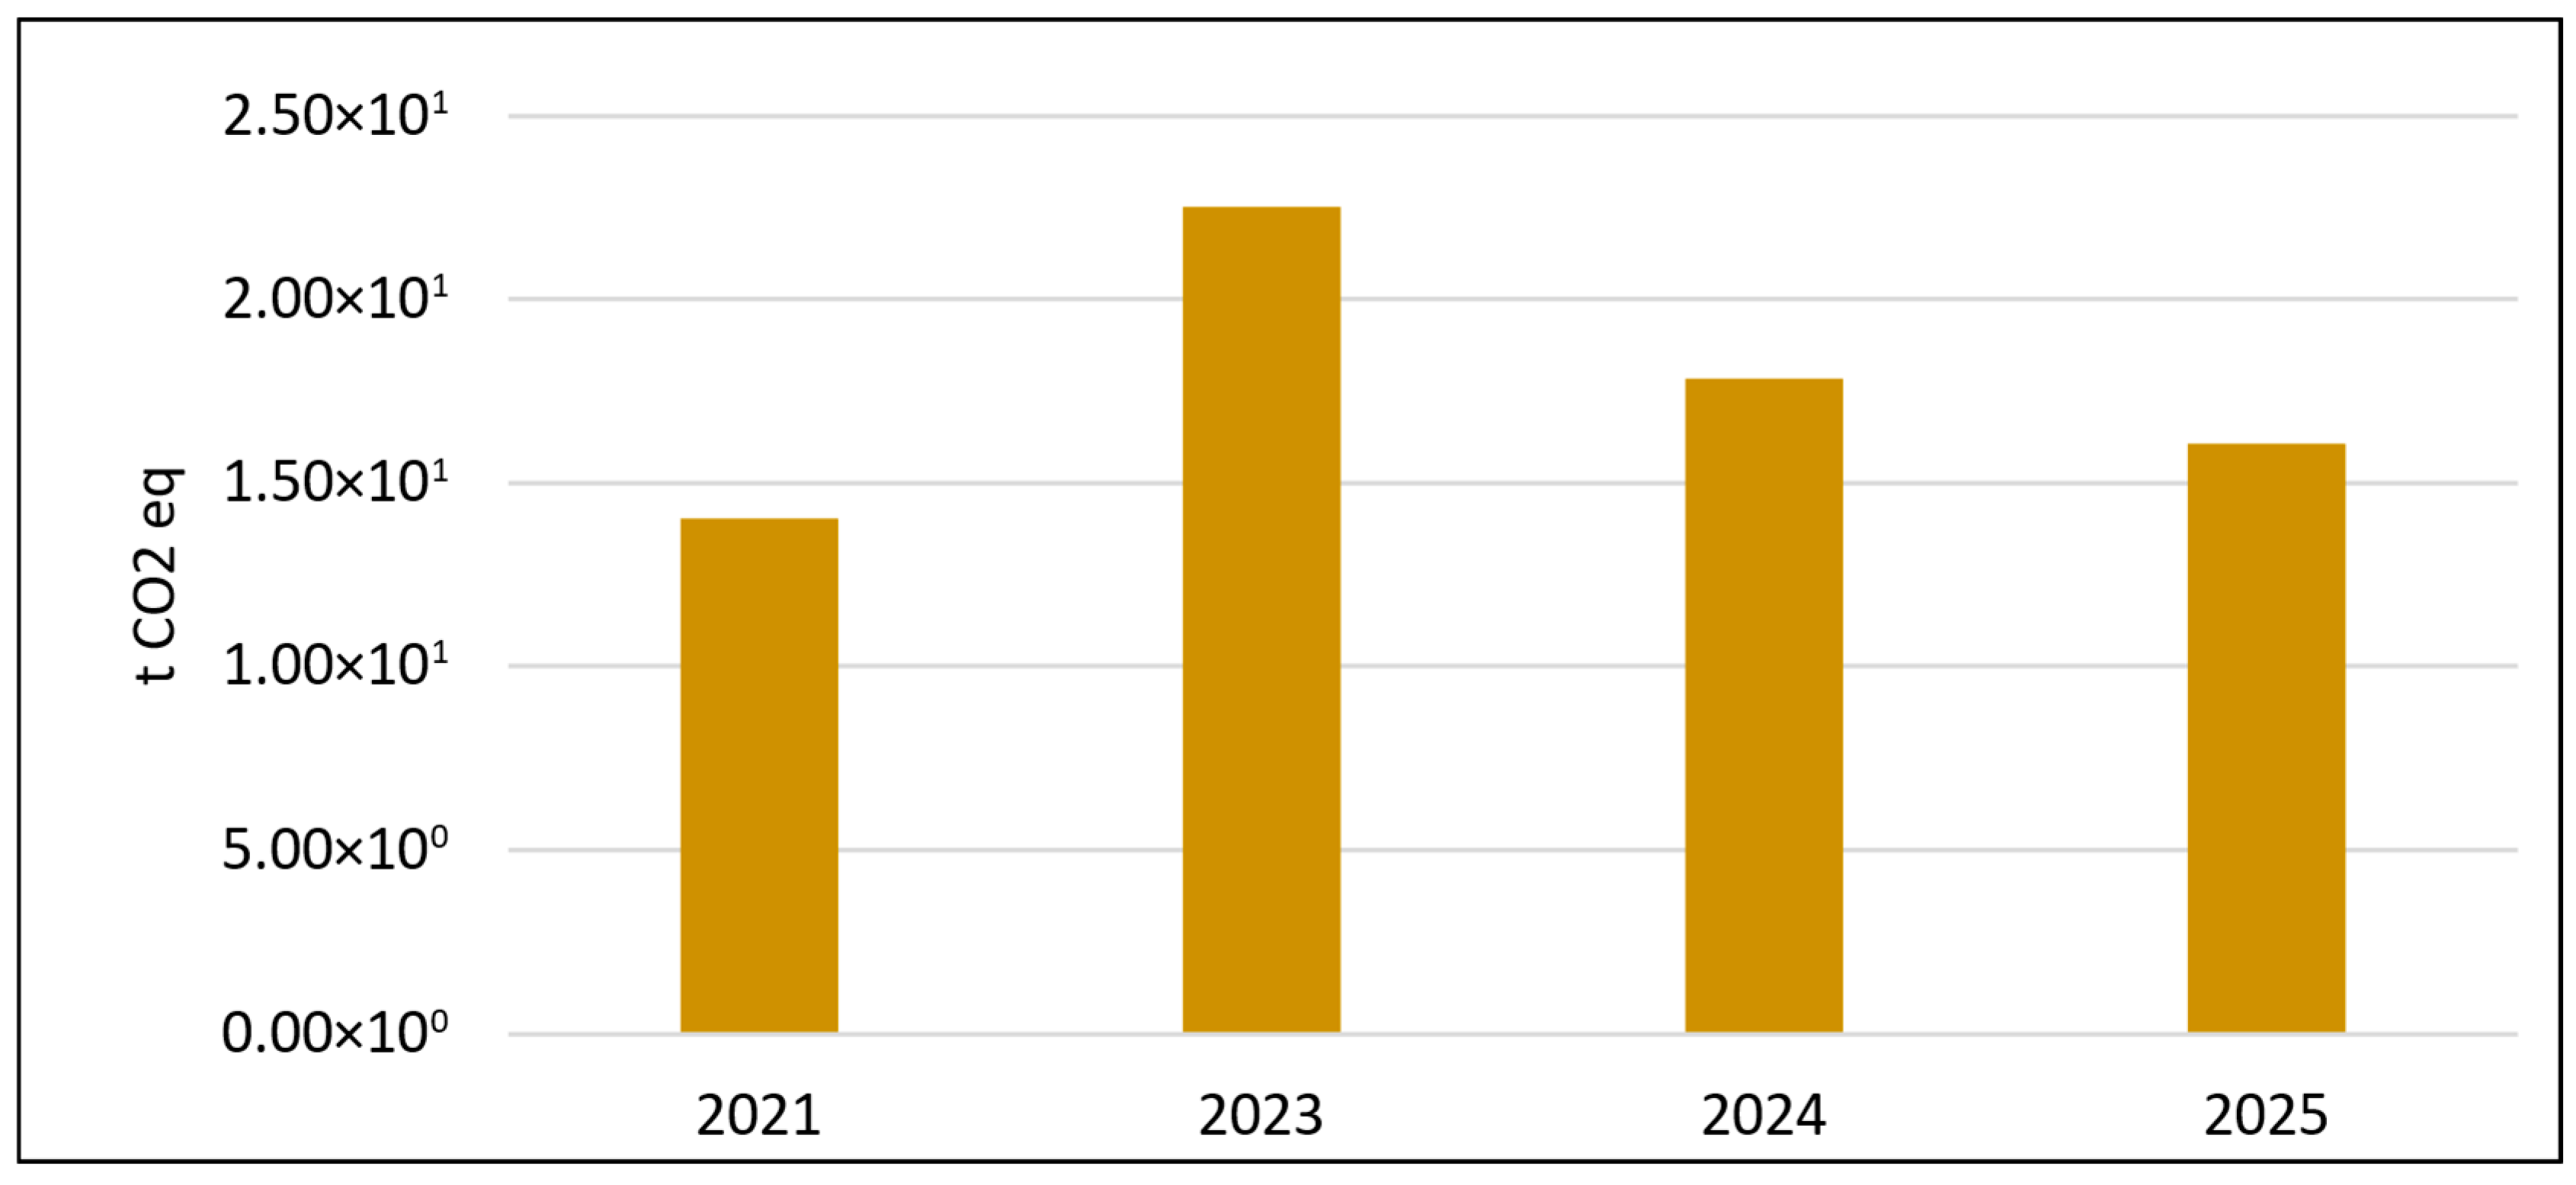
Figure 7 presents the potential GHG emissions associated with reed harvesting in Lake Cirma, calculated based on the estimated reed area derived from satellite classification results. The results demonstrate a direct proportional relationship between identified reed area and harvesting-related emissions. Consequently, years with a larger classified reed coverage (e.g., 2023) show higher potential harvesting emissions, while having a higher harvested reed amount. The variation in emissions across the analyzed years, therefore, reflects interannual changes in reed spatial distribution and does not account for differences in harvesting technology.
Figure 7.
Potential GHG emissions of reed harvesting in Lake Cirma based on the estimated reed area.
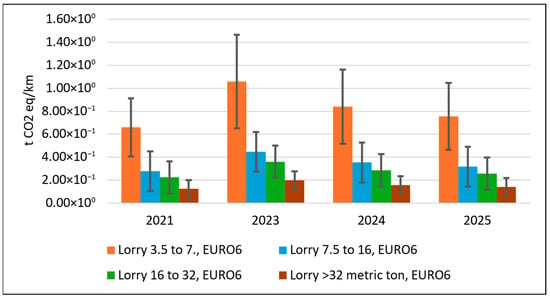
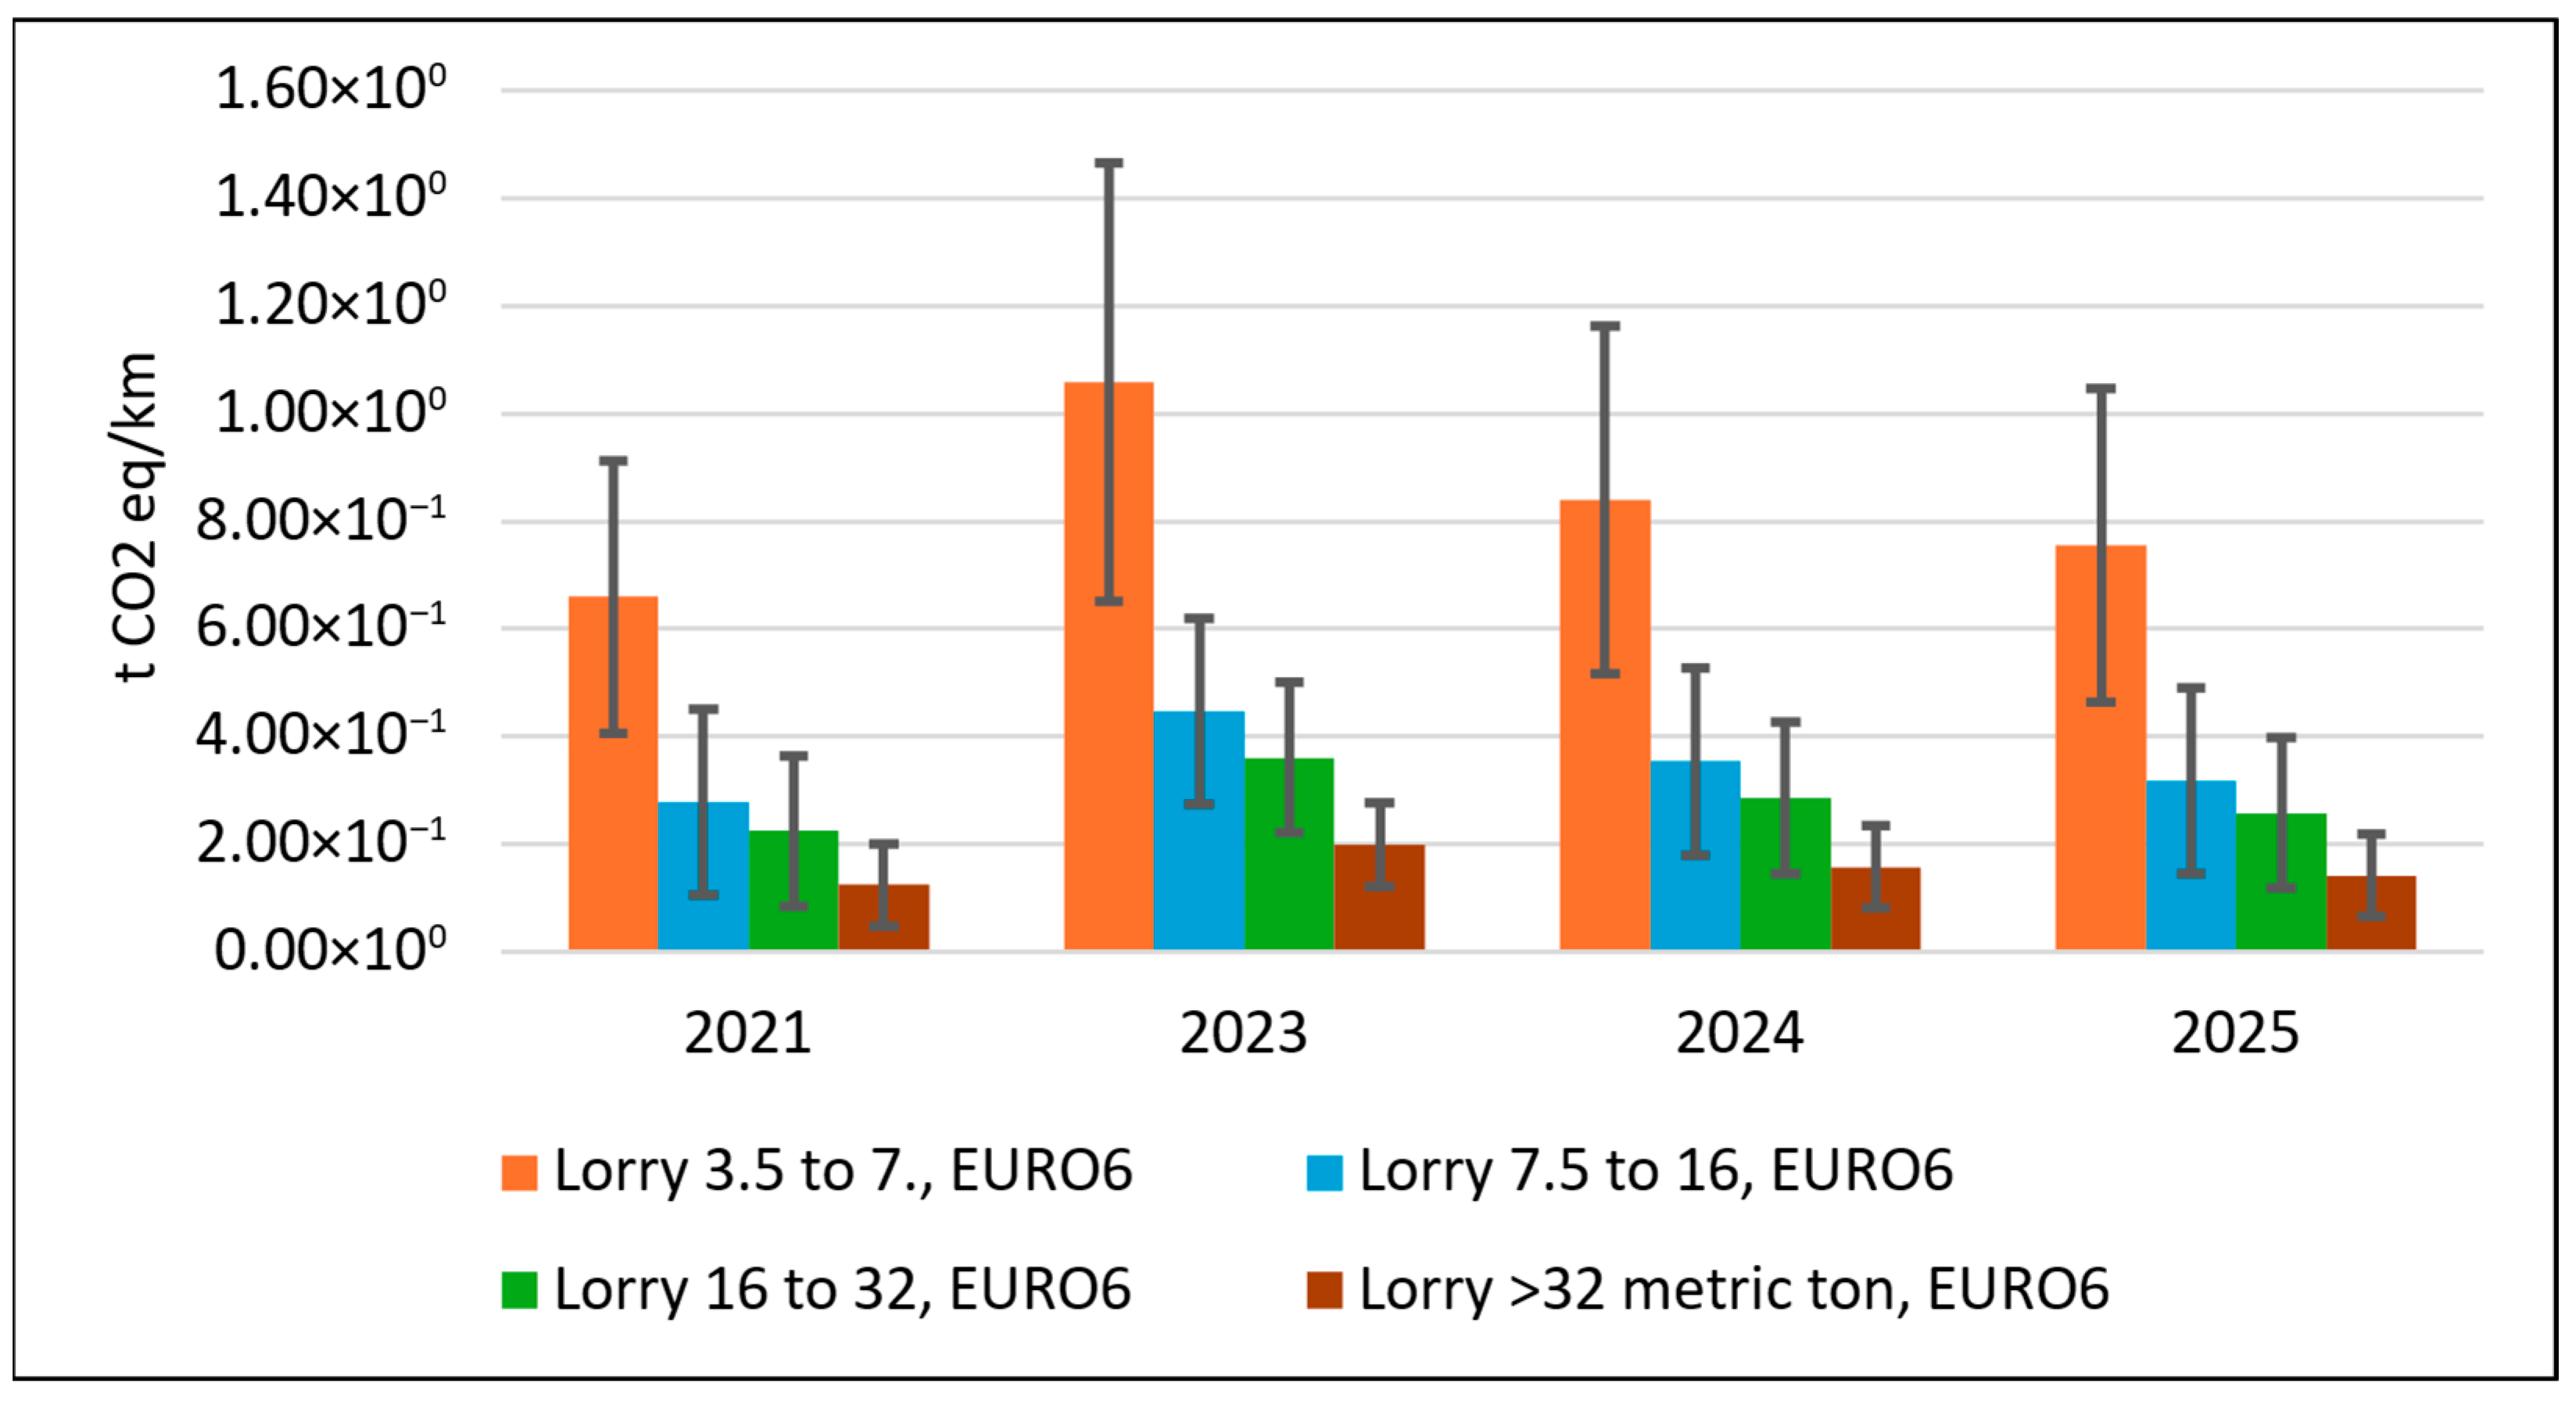
Figure 8 presents the potential GHG emissions associated with reed biomass transportation from Lake Cirma, based on harvested biomass scenarios, assuming a transport distance of 1 km. Error bars represent the minimum and maximum harvested biomass scenarios derived from the corresponding reed areas for each year, based on the biomass yield range provided in Table 7. Emissions were calculated using tonne-kilometer emission factors for different lorry categories (3.5–7.5 t, 7.5–16 t, 16–32 t, and >32 t) and multiplied by the corresponding biomass quantities estimated for each analyzed year (2021, 2023, 2024, and 2025).
Figure 8.
Potential GHG emissions of reed transportation from Lake Cirma based on estimated reed amount.
The results demonstrate a clear proportional relationship between harvested biomass amount and transport-related emissions across all vehicle categories. The maximum harvested biomass scenario consistently results in the highest transport emissions, while the minimum scenario shows the lowest values. Among vehicle types, larger-capacity lorries (>32 t) exhibit the lowest emissions per transported biomass amount due to lower emission intensity per tonne-kilometer, whereas light and smaller lorries generate comparatively higher emissions.
Annual variation reflects differences in estimated reed biomass quantities rather than emission coefficients, which were kept constant in the model. The results highlight that biomass quantity and vehicle selection significantly influence total transport-related GHG emissions. This indicates that appropriate vehicle capacity selection becomes increasingly important as reed valorization scales up.
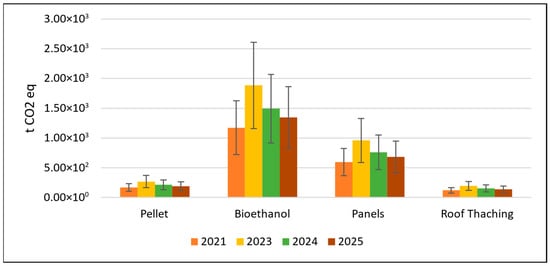
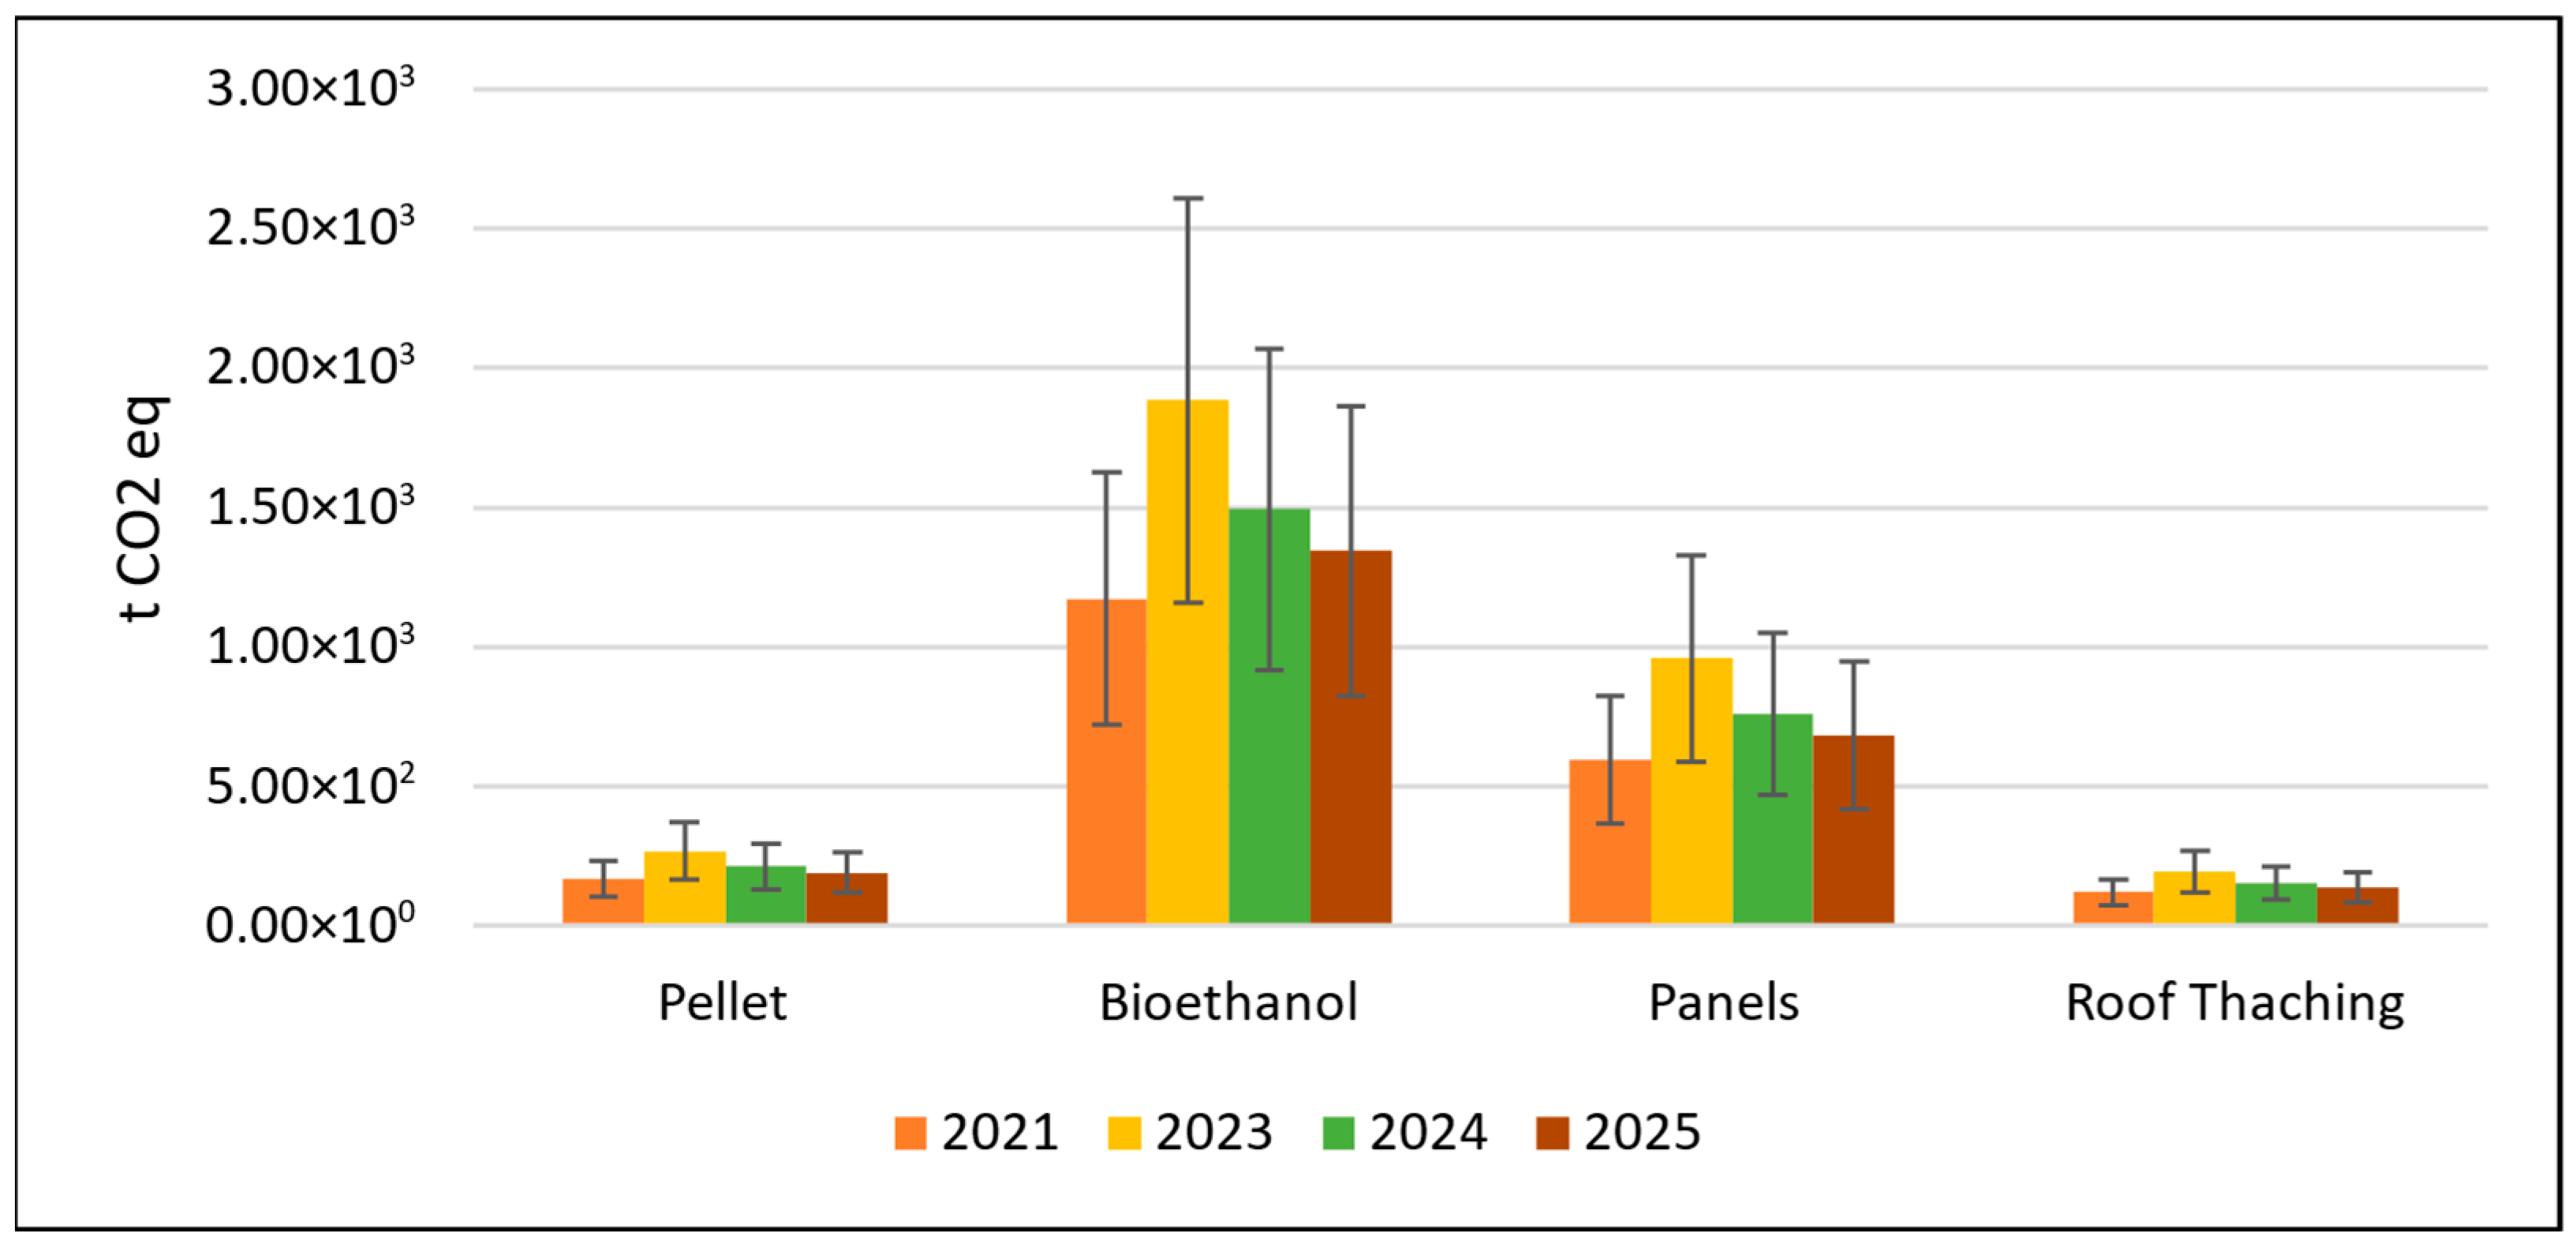
Figure 9 presents the potential GHG emissions associated with reed product manufacturing based on the estimated reed biomass amounts in Lake Cirma under minimum, average, and maximum harvested biomass scenarios for the analyzed years (2021, 2023, 2024, and 2025). The results are calculated by multiplying the harvested dry reed biomass by pathway-specific product manufacturing emission factors for pellet production, bioethanol production, insulation panel manufacturing, and roof thatching.
Figure 9.
Potential GHG emissions of reed product manufacturing based on estimated reed amount in Lake Cirma.
Bioethanol production exhibits the highest GHG emissions. Panel production shows intermediate emission levels, while pellet production and roof thatching demonstrate comparatively lower emissions per tonne of biomass input.
The results highlight that, under cradle-to-gate boundaries, the choice of valorization pathway by selecting transportation type and manufacturing scenario is a dominant factor influencing the total carbon footprint of manufactured products. The modeling approach allowed a sensitivity-type evaluation of carbon footprint performance across different valorization pathways by incorporating interannual variability in reed harvesting area, harvested biomass amount, transport selection, and pathway-specific production processes.
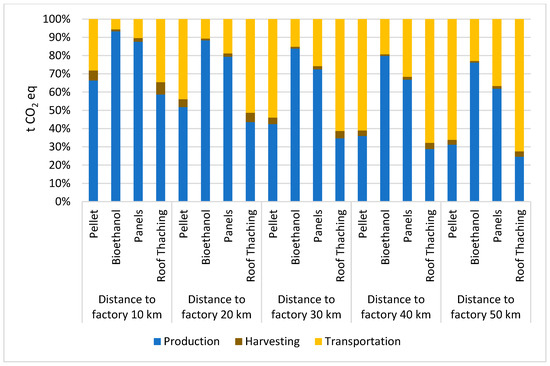
The sensitivity analysis of total GHG emissions for reed-based product pathways as a function of transport distance to the processing facility (10–50 km) is shown in Figure 10, representing total cradle-to-gate impact over observed years. The results indicate that transport distance has a progressively increasing influence on total emissions, particularly for pathways with lower production-stage emissions, such as pellet production and roof thatching. In contrast, for more emission-intensive pathways, such as bioethanol production, the relative contribution of transport remains smaller compared to production emissions, although it still increases with distance. These findings highlight that transport logistics are a critical factor in minimizing the overall carbon footprint, especially in regional bioeconomy systems where biomass is utilized in low-emission processing pathways. Conversely, more emission-intensive pathways, such as panel and bioethanol production, are less sensitive to transport distance, as their overall emissions are dominated by production processes, making the relative impact of transportation comparatively lower.
Figure 10.
Sensitivity analysis of total GHG emissions for reed-based product pathways as a function of transport distance to the processing facility.
By analyzing biomass conversion scenarios, the study examines how fluctuations in spatial biomass availability influence upstream emissions and pathway ranking. The transportation scenario is particularly important, as real transport distances to manufacturing facilities would significantly affect total emissions. Incorporating site-specific logistical distances in future analyses would allow a more detailed and realistic identification of the most climate-friendly reed bioeconomy pathways under regional conditions.
7. Discussion
The integrated GIS–LCA framework developed in this research allows the linking of spatial data on reed distribution with their potential use in bioeconomy processes, ensuring methodological continuity between resource identification, assessment of their availability, and environmental impact modeling. The results demonstrate that Sentinel 2 satellite images combined with QGIS classification tools (SCP, SegMap, QLEARN) are able to provide sufficient accuracy for the identification of lake reed belts. Similar approaches using Sentinel data for mapping wetlands and reed biomass have been demonstrated in previous remote sensing studies, where satellite imagery and automated classification techniques were successfully applied to detect reed distribution and monitor ecosystem changes [11,16]. However, other studies highlight that for smaller or fragmented reed stands, higher spatial resolution data—such as drone imagery or LiDAR—can provide improved accuracy and more detailed ecosystem characterization [10].
An important contribution is the demonstration that the results of training neural networks on data from one area allow for the successful classification of reeds in other lakes, which significantly reduces the amount of manual work and speeds up the resource mapping process. Similar machine learning approaches have been applied in other studies to estimate reed biomass using satellite imagery and Random Forest models, demonstrating strong predictive performance when combined with spatial environmental data [14]. Such an approach is especially important in Latvia, where reed areas are extensive, but systematic monitoring has not been carried out so far.
From a sustainable resource use perspective, the research shows that transportation distance is one of the most important factors determining carbon footprint. This finding is consistent with previous life cycle assessment studies of biomass utilization pathways, which show that transport intensity and harvesting logistics can significantly influence greenhouse gas emissions associated with biomass-based energy systems [15]. This is particularly important for low-emission products, such as reed pellets or roofing materials, where transportation emissions can become the dominant impact. The results indicate that decentralized or regionally optimized recycling systems can significantly improve both environmental and economic performance.
At the same time, ecological constraints must be taken into account, as well as nature conservation requirements, as some of the reed areas are located in specially protected areas. This means that biomass availability is not only a technical, but also an ecological and regulatory issue that must be integrated into future planning models.
The LCA results show that different uses of reeds have different emission intensities. Bioethanol production is the most intensive, while roofing materials and pellets show the lowest emission levels. These findings are consistent with the literature [15] that material use pathways are often more climate-friendly than energy pathways, especially if they provide long-term biogenic carbon storage.
An important observation emerging from the results is the apparent contrast between absolute emission intensity and sensitivity to additional emissions. The results demonstrate that optimal siting of processing facilities and transport planning can significantly influence the environmental performance of reed-based value chains, suggesting that spatially explicit LCA approaches are essential for realistic bioeconomy assessments. This appears counterintuitive, but considering the relative contribution of individual life cycle stages, the dominance of production emissions in high-intensity pathways reduces the proportional impact of logistics. This highlights the importance of interpreting results not only in absolute terms but also in terms of contribution analysis, as improvements in transport efficiency may yield greater relative benefits in low-emission pathways than in high-emission ones.
Overall, the research demonstrates that an integrated approach of satellite data, GIS, and LCA can serve as a practical tool for regional bioresource planning, especially in countries with extensive wetlands and high biomass potential, such as Latvia.
The most important limiting factors of the research are the following:
- Geographic limitations.
The research focuses on Latvian lake ecosystems, which may limit the applicability of results to regions with different climatic, hydrological, or ecological characteristics.
- Classification model limitations.
The neural network model trained using QLEARN was validated on a limited number of lake areas, which may reduce generalizability to other lakes with different hydrological or ecological conditions. Potential misclassification of vegetation may influence the estimated reed-covered area and, consequently, biomass calculations.
- Biomass estimation assumptions.
The research assumes homogeneous biomass distribution within classified reed areas, which may not reflect real-world variability. Harvesting constraints—such as protected areas, accessibility, and ecological restrictions—were not spatially modeled, although they significantly affect the practically harvestable biomass.
- Carbon footprint model boundaries.
Emission factors for harvesting and transport are based on generic Ecoinvent datasets, which may not fully reflect local machinery performance or operational practices in Latvia. Transport distances were modeled as fixed linear scenarios (10–50 km), without incorporating real road networks or multi-stop logistics. The allocation of biomass to different valorization pathways assumes idealized processing conditions and does not account for potential scale limitations of local industries.
8. Conclusions
This research offers a practically applicable methodological framework for assessing the availability of reed biomass and modeling the carbon footprint of its use.
An integrated GIS–LCA approach ensures spatially accurate and sustainable resource planning. Satellite data and QGIS classification tools allow for the identification of reedbed areas in lakes with sufficient accuracy, while LCA provides the opportunity to assess the climate impact of different use pathways.
Neural network models significantly reduce the amount of manual work. A trained model is able to successfully classify reeds in other lakes, which allows for the creation of a scalable and repeatable monitoring system.
Research results show that Sentinel-2 satellite imagery combined with classification tools using the QGIS environment enables effective identification of reed-covered areas in lake ecosystems. The classification results showed that reed stands occupy approximately 2.18–3.51% of the lake surface area in Lake Cirma, corresponding to 144–233 hectares of reed coverage depending on the analyzed year. The trained classification model achieved high performance (training accuracy of 98.39% and validation accuracy of 98.74%) and was successfully transferred from Lake Rāzna to Lake Cirma, demonstrating the potential scalability of the method for monitoring reed distribution across multiple lakes.
Based on the estimated reed areas and literature-based productivity values, the potential reed biomass availability in Lake Cirma was estimated to range from approximately 1158 to 4188 tonnes of dry biomass, depending on annual reed coverage and biomass productivity scenarios. These results highlight the significant biomass potential of lake reed ecosystems and demonstrate the applicability of remote sensing approaches for spatial biomass quantification in regions where field measurements are limited. The results also indicate that transport distance is a key factor influencing the total carbon footprint. Increasing the transport distance from 10 to 50 km can significantly increase total emissions.
Future research should focus on improving biomass estimation accuracy through field validation, higher-resolution remote sensing data, and the integration of additional environmental variables influencing reed growth dynamics.
The developed framework is suitable for further expansion. It can be supplemented with economic analysis, higher resolution data (LiDAR, drones), as well as end-of-life scenarios to provide a full life cycle assessment.
Author Contributions
Conceptualization, P.G. and M.F.; methodology, P.G., J.M. and M.F.; software, J.M. and M.F.; validation, L.A. and F.R.; formal analysis, M.Z. and N.P.; data curation, N.P., L.A. and F.R.; writing—original draft preparation, P.G.; writing—review and editing, M.Z.; project administration, P.G. All authors have read and agreed to the published version of the manuscript.
Funding
This research was funded by Riga Technical University, grant number RTU-PA-2024/1-0077 (1 October 2024 to 31 January 2026), “Towards a sustainable bioeconomy: assessing reed biomass potential and applications (ReedREvolution)”.
Data Availability Statement
The original contributions presented in the research are mainly included in the article; further requests can be directed to the corresponding author.
Conflicts of Interest
The authors declare no conflicts of interest.
References
- Plant Family. Available online: https://www.britannica.com/plant/Poaceae/Distribution-and-abundance (accessed on 15 February 2026).
- Köbbing, J.F.; Thevs, N.; Zerbe, S. The utilisation of reed (Phragmites australis): A review. Mires Peat 2013, 13, 1. [Google Scholar] [CrossRef] [Scilit]
- Ivanova, T.A.; Paramonova, K.; Talipov, O.; Tanyrbergenov, N.; Zhakupov, T.; Akayev, A. Assessment of Phragmites australis biomass suitability for solid biofuels production. Sustainability 2024, 16, 7378. [Google Scholar] [CrossRef] [Scilit]
- Shuai, W.; Chen, N.; Li, B.; Zhou, D.; Gao, J. Life cycle assessment of common reed (Phragmites australis (Cav) Trin. ex Steud) cellulosic bioethanol in Jiangsu Province, China. Biomass Bioenergy 2016, 92, 40–47. [Google Scholar] [CrossRef] [Scilit]
- Asdrubali, F.; Bianchi, F.; Cotana, F.; D’Alessandro, F.; Pertosa, M.; Pisello, A.L.; Schiavoni, S. Experimental thermo-acoustic characterization of innovative common reed bio-based panels for building envelope. Build. Environ. 2016, 102, 217–229. [Google Scholar] [CrossRef] [Scilit]
- Guidebook of Reed Business. Available online: https://www.eby.ee/roostik/trykivaljanded/Guidebook%20Cofreen.pdf (accessed on 15 February 2026).
- Dirma, V.; Neverauskiene, L.O.; Tvaronavičiene, M.; Danilevičiene, I.; Tamošiūne, R. The Impact of Renewable Energy Development on Economic Growth. Energies 2024, 17, 6328. [Google Scholar] [CrossRef] [Scilit]
- Čížková, H.; Kučera, T.; Poulin, B.; Kvet, J. Ecological basis of ecosystem services and management of wetlands dominated by common reed (Phragmites australis): European perspective. Wetl. Ecol. Manag. 2023, 15, 629. [Google Scholar] [CrossRef] [Scilit]
- Berner, R.; Neumann, M.; Muller, M.; Hollaus, M.; Maier, A.; Zechmeister, T.; Glatzel, S. Prescribed burning as a potential regeneration technique for reed stands: A pilot study in the reed belt of Lake Neusiedl, Austria. Wetl. Ecol. Manag. 2025, 33, 52. [Google Scholar] [CrossRef] [Scilit]
- Buchsteiner, C.; Baur, P.A.; Glatzel, S. Spatial Analysis of Intra-Annual Reed Ecosystem Dynamics at Lake Neusiedld Using RGB Drone Imagery and Deep Learning. Remote Sens. 2023, 15, 3961. [Google Scholar] [CrossRef] [Scilit]
- Tiškus, E.; Vaičiūtė, D.; Bučas, M.; Gintauskas, J. Evaluation of common reed (Phragmites australis) bed changes in the context of management using earth observation and automatic threshold. Eur. J. Remote Sens. 2022, 56, 100–114. [Google Scholar] [CrossRef] [Scilit]
- Sciuto, L.; Licciardello, F.; Barbera, A.C.; Cirelli, G. A GIS-based multicriteria decision analysis to reduce riparian vegetation hydrogeological risk and to quantify harvested biomass (Giant reed) for energetic retrieval. Ecol. Indic. 2022, 144, 109548. [Google Scholar] [CrossRef] [Scilit]
- Baier, S.; Meneses, N.C.; Geist, J.; Schneider, T. Assessment of Aquatic Reed Stands from Airborne Photogrammetric 3K Data. Remote Sens. 2022, 14, 337. [Google Scholar] [CrossRef] [Scilit]
- Baibagyssov, A.; Magiera, A.; Thevs, N.; Waldhardt, R. Resource Characteristics of Common Reed (Phragmites australis) in the Syr Darya Delta, Kazakhstan, by Means of Remote Sensing and Random Forest. Plants 2025, 14, 933. [Google Scholar] [CrossRef] [Scilit] [PubMed]
- Svedovs, O.; Sturmane, A.; Feofilovs, M.; Kirsanovs, V.; Romagnoli, F. Comparative cradle-to-grave life cycle assessment of wood and alternative biomass pellet feedstocks for decentralized heating using experimental data. Biomass Bioenergy 2026, 208, 108880. [Google Scholar] [CrossRef] [Scilit]
- Zhao, Y.; Mao, D.; Zhang, D.; Wang, Z.; Du, B.; Yan, H.; Qiu, Z.; Feng, K.; Wang, J.; Jia, M. Mapping Phragmites australis aboveground biomass in the Momoge Wetland Ramsar site using Sentinel-1/2. Remote Sens. 2022, 14, 694. [Google Scholar] [CrossRef] [Scilit]
- EUR Lex. Access to European Union Law. Available online: https://eur-lex.europa.eu/legal-content/EN/TXT/?uri=celex:52018DC0673 (accessed on 15 February 2026).
- The European Green Deal. Available online: https://www.elni.org/fileadmin/elni/dokumente/Green_Deal-Sustainable_Products_Policy_2019-12-18_engl_fin.pdf (accessed on 15 February 2026).
- EUR Lex. Access to European Union Law. Available online: https://eur-lex.europa.eu/eli/reg/2021/1119/oj/eng (accessed on 15 February 2026).
- EUR Lex. Access to European Union Law. Available online: https://eur-lex.europa.eu/legal-content/EN/TXT/?uri=CELEX%3A52021DC0550 (accessed on 15 February 2026).
- Copernicus Project. Available online: https://www.copernicus.eu/en (accessed on 15 February 2026).
- SentiWiki Home Page. Available online: https://sentiwiki.copernicus.eu/web/ (accessed on 15 February 2026).
- QGIS Project. Available online: https://qgis.org/project/overview/ (accessed on 15 February 2026).
- ISO 14040:2006; Environmental Management—Life Cycle Assessment—Principles and Framework. ISO: Geneva, Switzerland, 2006. Available online: https://www.iso.org/standard/37456.html (accessed on 15 February 2026).
- ISO 14044:2006; Environmental Management—Life Cycle Assessment—Requirements and Guidelines. ISO: Geneva, Switzerland, 2006. Available online: https://www.iso.org/standard/38498.html (accessed on 15 February 2026).
- IPCC Sixth Assessment Report. Available online: https://www.ipcc.ch/report/ar6/wg1/ (accessed on 15 February 2026).
- ISO 14067:2018; Greenhouse Gases—Carbon Footprint of Products—Requirements and Guidelines for Quantification. ISO: Geneva, Switzerland, 2018. Available online: https://www.iso.org/standard/71206.html (accessed on 15 February 2026).
- Latvian Lakes Database. Available online: https://www.ezeri.lv/?l=en (accessed on 15 February 2026).
- Breiman, L. Random Forests. Mach. Learn. 2001, 45, 5–32. [Google Scholar] [CrossRef] [Scilit]
- Li, F.; Klette, R. Euclidean Shortest Paths: Exact or Approximate Algorithms; Springer: Berlin/Heidelberg, Germany, 2011. [Google Scholar]
- Grabusts, P.; Musatovs, J.; Teirumnieka, Ē. Modeling the Distribution of Lake Reeds Using GIS. In Proceedings of the 16th International Scientific and Practical Conference Environment, Technology, Resources, Rezekne, Latvia, 19–20 June 2025. [Google Scholar] [CrossRef] [Scilit]
- Čubars, E.; Noviks, G. Influence of Different Factors on Productivity of Reed Growths. In Proceedings of the 9th International Scientific and Practical Conference Environment, Technology, Resources, Rezekne, Latvia, 20–22 June 2013. [Google Scholar] [CrossRef] [Scilit]
- Kronbergs, A.; Kronbergs, E.; Siraks, E.; Dalbins, J. Cutting properties of arranged stalk biomass. Environ. Sci. Agric. Food Sci. 2012. Available online: https://llufb.llu.lv/conference/Renewable_energy_energy_efficiency/Latvia_Univ_Agriculture_REEE_conference_2012-145-149.pdf (accessed on 15 February 2026).
- Ikkonen, I.; Hagelberg, E. Reed up on Reed; Southwest Finland Regional Environment Centre: Ratapihankatu, Turku, 2007; Available online: https://www.doria.fi/handle/10024/134765 (accessed on 15 February 2026).

Disclaimer/Publisher’s Note: The statements, opinions and data contained in all publications are solely those of the individual author(s) and contributor(s) and not of MDPI and/or the editor(s). MDPI and/or the editor(s) disclaim responsibility for any injury to people or property resulting from any ideas, methods, instructions or products referred to in the content. |
© 2026 by the authors. Licensee MDPI, Basel, Switzerland. This article is an open access article distributed under the terms and conditions of the Creative Commons Attribution (CC BY) license.