Abstract
Per- and polyfluoroalkyl substances (PFAS) are a group of emerging organic contaminants receiving rising attention due to the threat they may pose to human health and their strong persistence in the environment, determined by their widespread use in the market as additives, reactants, or coverings. Since the most common end-of-life of products is landfill, countless case studies have confirmed the presence of PFAS in leachates. This work aims to evaluate and compare the environmental impacts of four different PFAS removal techniques from landfill leachate through a life cycle assessment performed on laboratory tests. Global warming, particulate matter formation, and human toxicity were examined and discussed in detail, since they represent most of the final single-score impact. The toxicity contribution of the residual PFAS in the matrix was investigated, resulting almost negligible. The results highlight activated carbon, sludge disposal, and sulfuric acid as major environmental hotspots for all categories. The clariflocculation followed by activated carbon adsorption results in the least impactful technique with promising PFAS removal efficiencies, between 44.3% and 82.2% depending on carbon dosage. Very precise correlations in the trends of the impact categories and the use of different functional units were also analysed.
Keywords:
PFAS; landfill leachate; flocculation; active carbons; Fenton; wastewater treatment; LCA; toxicity 1. Introduction
Per- and polyfluoroalkyl substances (PFAS) are a broad class of emerging organic contaminants that have received increasing attention in recent decades due to their specific chemical and physical characteristics that determine both their success in the market and their long permanence within the environment [1,2,3]. Perfluorooctanoic acid (PFOA) and perfluorooctane sulphonate (PFOS) are the most studied and well-known compounds of this class, and their precursors are among the most important sources of contamination due to these emerging pollutants. Due to their very high chemical, physical, and heat resistance, they are classified as PBT substances (persistent, bioaccumulative, and toxic) and are widely used as reactants, coatings, and additives in the varnish, food packaging, waterproof clothing, pot covering, and fire extinguisher sectors [4,5]. Since some of these products find their end-of-life fate in landfills, these substances are often detected in landfill leachate all around the globe [6,7,8]. This highly contaminated liquid fraction is generated by rain infiltration and moisture condensation from the waste, which leads to the dissolution and concentration of several substances in the leachate stream. These streams are usually collected and properly treated in a wastewater treatment plant (WWTP) [9,10,11]. Since the goal of wastewater treatment is to remove pollutants from, or reduce their concentration in, the leachate and consistently decrease the associated impact on the environment, in this work, we applied a life cycle assessment (LCA), intending to estimate and compare the potential environmental consequences of four different PFAS removal techniques from landfill leachate. Nowadays, there are many case studies on PFAS abatement techniques in liquid matrices and their effectiveness, such as clariflocculation, evaporation, reverse osmosis, nanofiltration, and active carbon adsorption, which show variable results and efficiency depending on the chemical characteristics and complexity of the sample. Among the various possible options, we decided to focus on the techniques that can be most easily and quickly integrated into the current landfill leachate treatment processes in Italy, which, in the vast majority of cases, use chemical–physical precipitation techniques (clariflocculation) followed by different technologies depending on the fraction being treated. These processes were developed at the laboratory scale, trying to simulate the working conditions of a full-scale plant as accurately as possible, allowing the collection of primary data.
The first approach to the study consisted of the analysis of the most common chemical–physical treatment applied in WWTP: clariflocculation. Several studies confirm encouraging removal rates of clariflocculation processes at the lab scale from surface water, while examples involving landfill leachate are lacking [12,13,14]. For this reason, an extensive analysis was performed on this technique with the use of FeCl3 as a coagulating agent and Ca(OH)2 as a precipitating agent, simulating the working conditions of a full-scale plant. One of the possible treatment technologies that could be easily implemented in the clariflocculation-based plants currently in operation is the technique based on activated carbon (AC) adsorption processes. Many studies have demonstrated that activated carbons are effective in removing PFAS from wastewater matrices at both laboratory and full scale [8,15]. Two different AC-based procedures and frameworks were tested to evaluate the most suitable technique, also evaluating their environmental sustainability. The first approach involved the adsorption on the AC surface during the clariflocculation process and the following deposition of the carbons in the sludge. In the second approach, the adsorption on the AC involved only the clarified fraction resulting from the clariflocculation step, enabling the collection and the recovery of the carbons. All the following environmental impact implications are accounted for and described in the following sections. Finally, since modified Fenton-based advanced oxidation processes (AOPs) reveal promising PFAS abatement efficiency through the use of very cheap and common chemicals such as hydrogen peroxide (H2O2) and ferrous chloride (FeCl2), several tests were performed on landfill leachate samples using this removal technique to evaluate suitability and environmental impacts [16,17,18].
A fundamental aspect of the environmental impact assessment in the abatement of pollutants is the toxicity, which can be associated with both contamination and the abatement process. Since PFAS have proven negative health effects, we decided to investigate the toxicity contribution due to the residual fraction of PFAS in the treated liquid matrix that would be discharged onto the superficial water stream after each removal process, comparing it with the other contributions within the system.
Another challenge in environmental impact assessment in the field of wastewater treatment is defining the functional unit (FU). Many examples of different FUs adopted in studies about leachate treatments [19,20,21] and PFAS removal processes [22,23,24,25] can be found in the literature. Most of the FUs used comprise a quantitative description of the volume treated or obtained after the process (typically 1 m3), and sometimes a qualitative description of the fraction (i.e., safe drinking water, remediated groundwater). Only very few examples reported the quantity of pollutant removed [6]. In this work, we decided to define two different FUs, referring to both of the aspects identified in the literature, to assess their fitness for the sector. The definition of the FUs is reported in Section 2.2.1, and observations in Section 4.
2. Materials and Methods
In this section, the laboratory procedures are briefly listed, summarised, and described. According to the parameters and conditions described in Section 1, we decided to proceed with the simulation of the working conditions of a full-scale plant as accurately as possible, and analysis, in the laboratory, of the following abatement techniques:
- Clariflocculation, described in Section 2.1.2. It consists of a chemical–physical treatment where pollutants and suspended substances are aggregated and deposited thanks to charge interactions through the use of specific coagulating and precipitating agents, FeCl3 and Ca(OH)2 in this case. Several studies have demonstrated that flocculation and coagulation processes reduce the concentration of PFAS in the water matrices by exploiting their adsorption onto flocs via hydrophobic interactions and enhancing their removal [12,13].
- Clariflocculation in the presence of PAC in a single-step process (PAC SS), described in Section 2.1.3. The tested amounts of PAC were 7.3 g/L, 17 g/L, and 33 g/L. This process exploits the primary removal mechanism of PAC, which consists of the physical adsorption of pollutants onto the highly porous surface, mainly through hydrophobic and electrostatic interactions [26,27].
- Clariflocculation and PAC adsorption in a double-step process (PAC DS), described in Section 2.1.4. The tested amounts of PAC were 3.3 g/L, 5 g/L, 7.3 g/L, and 8.7 g/L. In this framework, the PAC only comes into contact with the clarified fraction resulting from the clariflocculation step. This should decrease the PAC poisoning due to the organic and inorganic contaminants that could negatively affect their adsorption capacity. This approach also allows the collection and recovery of the PAC at the end of the process since it is not included in the previous steps’ sludges.
- Fenton oxidation (main reactants: FeCl2 and H2O2), described in Section 2.1.5. This process is one of the most common techniques in wastewater and leachate treatment worldwide. Thanks to the production of highly reactive hydroxyl radicals (•OH) and hydrogen (•H), this technique is effective in the removal and abatement of organic content and pollutants [28,29].
In accordance with analytical standards and LCA methodology, the calculation and assessment of PFAS removal efficiency (Section 2.1.1) were performed, and the environmental impacts (Section 2.2) of each technique were analysed. A schematic representation of the overall workflow and the detailed PFAS analysis procedure are available in the SI (Scheme S1). Results are shown in Section 3.
2.1. Laboratory Procedures
2.1.1. PFAS Analysis Procedure
The analysis was performed on each sample of leachate before and after each treatment, applying the ASTM (Advancing Standards Transforming Markets) Method D7979-19 integrated with an appropriate sample preparation necessary for the complexity of such matrices [30]. This is a worldwide, consensus-standard liquid chromatography/tandem mass spectrometry test method for the analysis of 21 PFAS in non-potable water. The samples must be held in polypropylene containers, and those with high turbidity must undergo dilution to avoid possible problems with the efficiency of the instrumentation. The samples must undergo filtration with a polypropylene filter to remove any suspended solids and, subsequently, acidification using CH3COOH, which is necessary to allow the release of the dissociated form of PFAS. The concentration of PFAS was determined by the liquid chromatography–tandem mass spectrometry (LC-MS/MS) technique. The equipment used was the WATERS ACQUITY™ UPLC™ I-Class PLUS System (Waters Corporation, Milford, MA, USA) with an ACQUITY™ UPLC™ BEH C18 1.7 μm 2.1 × 100 mm IVD column (Waters Corporation, Milford, MA, USA), coupled with a WATERS XEVO™ TQ-S MICRO (Waters Corporation, Milford, MA, USA) for mass spectrometry (MS). The ion source used in the MS analysis was electrospray ionisation with negative polarity, and the acquisition mode was Multiple Reaction Monitoring (MRM), which detects the transition from precursor to product. The operator followed the operating sequence and quality controls of the analytical procedure established by the EPA 537 regulatory method [31]. Nowadays, for leachate fraction analysis, the use of the most high-performance instrumentation enables reaching the quantification limits (LOQ) of 10 ng/L. An in-depth explanation of the PFAS analysis procedure is available in the SI (Scheme S1).
The PFAS removal efficiency (%) was calculated as follows (Equation (1)):
2.1.2. Clariflocculation
The clariflocculation treatment involves an initial acidification phase of 300 mL of leachate with 3.6 mL of H2SO4 50% w/w (dilution of Sigma-Aldrich sulfuric acid 99.999%, St. Louis, Missouri, USA). Next, the coagulation phase takes place through the addition of 0.6 mL of FeCl3 40% w/w (Sigma-Aldrich), which is intended to break down any colloids present and allow clots to form. The coagulation step was carried out by stirring the system for 5 min. Next, 4.6 mL of 15% w/w Ca(OH)2 (Sigma-Aldrich) was added until a pH of 8.5 was reached to obtain precipitation of metals in the form of hydroxides. Then, 0.3 mL of anionic polyelectrolyte was added to allow flake formation, and the system was kept under gentle agitation for 15 min. After 20 min of decanting, the clear liquid was collected for residual PFAS analysis [32].
2.1.3. Clariflocculation in Presence of PAC in a Single-Step Process (PAC SS)
The treatment involves an initial acidification phase of 300 mL of leachate with 3.6 mL of H2SO4 40% w/w. Next is the coagulation phase through the addition of 0.6 mL of FeCl3 40% w/w. The system was stirred for 5 min. Then, 7.3 g of powdered activated carbon was added, and the system was stirred for 5 min to allow PFAS and other organic pollutants to adsorb onto the carbons. The procedure was repeated, adding increasing amounts of powder. The tested amounts were 7.3 g, 17 g, and 33 g. Then, varying amounts of 15% w/w Ca(OH)2 were added to achieve precipitation of metals in the form of hydroxides. The amount of Ca(OH)2 decreases as the dosage of activated carbon increases because the pH tends to be less acidic. Then, 0.3 mL of anionic polyelectrolyte was added as a flocculant, and the system was kept under gentle agitation for 15 min. After 20 min of decanting, the clear liquid was collected for residual PFAS analysis [32].
2.1.4. Clariflocculation and PAC Adsorption in a Double-Step Process (PAC DS)
The clariflocculation treatment was carried out as mentioned above in Section 2.1.1. A total of 50 mL of clarified water was taken by syringe, then transferred to a new container for subsequent addition of activated carbon. The tests were carried out using increasing concentrations of activated carbon powder: 3.3 g/L, 5 g/L, 7.3 g/L, and 8.7 g/L. Once the activated charcoal was added, the system was stirred for 5 min and allowed to decant for the time necessary for the deposition of solid residues. The obtained clarified solution was subjected to analysis for the determination of residual PFAS [32].
2.1.5. Fenton Oxidation
Fenton treatment involves the addition of 10 mL of H2O2 35% (SAFC) v/v and 30 mL of FeCl2 9% w/w (Sigma-Aldrich) in Fe to 300 mL of the leachate sample. The dosing of ferrous chloride should be performed slowly to control the reaction kinetics that cause the formation of a brown foam that tends to rise in the beaker. Next, the system was stirred for a time equal to 4 h. Approximately 30 mL of 15% w/w Ca(OH)2 was added to bring the system to a pH of 8.5, and the anionic polyelectrolyte was added to allow the flakes to form. Next, given the high presence of sludge that makes it difficult to collect the liquid phase, centrifugation was required. The supernatant obtained was then taken and analysed to determine the content of residual PFAS [32].
2.2. Life Cycle Assessment
LCA is a worldwide recognised methodology, standardised by ISO 14040 and ISO 14044 [33,34], which allows for calculating the potential environmental impact of a product or process, considering its entire life cycle, applying a cradle-to-grave approach when possible [35]. It includes different steps: goal and scope definition, life cycle inventory (LCI), life cycle impact assessment (LCIA), and interpretation. Since PFAS and their degradation products’ exposure are associated with negative health effects such as immune and thyroid dysfunction, liver and kidney disease, lipid and insulin dysregulation, adverse reproductive and developmental outcomes, and cancer [36,37], we decided to further investigate the toxicity contribution of PFAS; in particular, the impact due to the residual fraction of PFAS in the treated liquid matrix discharged onto the superficial water stream after each removal process. A real case of a post-treatment discharge of leachate was simulated, including the concentration of other ions in the computation (Table S47). The USEtox model (version 2.14) was used in the calculation, and PFAS characterisation factors (CF) are taken from the literature. USEtox is a scientific consensus model endorsed by the UNEP/SETAC (United Nations Environment Programme, Society of Environmental Toxicology and Chemistry) for the toxicity assessment of chemicals and the calculation of the CFs for human toxicity (cancer and non-cancer) and ecotoxicity (freshwater) through a fate-exposure-effect model that simulates the behaviour and impacts of the contaminants [38,39].
2.2.1. Goal and Scope Definition
The scope of this study is to calculate and compare the environmental impact of four different PFAS removal techniques from landfill leachate, also investigating sludge incineration and landfilling. Since different techniques resulted in variable PFAS removal efficiencies, we decided to include the potential toxicity impacts associated with the release of PFAS into the environment in the evaluation. The characterisation factors adopted for the estimation of the environmental impact due to PFAS release were drawn from Holmquist et al. (2020) [40] and Aggarwal (2025) [41], which provided estimation by employing the USETox model. USEtox is a dedicated method specifically designed to support the toxicity assessment in LCA methodologies, including the impact due to the residual fraction of PFAS in the discharge (superficial water stream). We adopted the two most common FUs in the field in order to assess their accomplishments in the quantification of the function for our case study and better understand and consider their use in different situations [20,42,43], i.e., “the treatment of 1 m3 of leachate” and “the removal of 1 g of PFAS from the leachate.” The choice of the FUs and the main limitations are discussed in Section 4. The stages of the process included in the system boundaries are chemical production and transportation, electricity (EE) use during the treatment, sludge management (with the consideration of different scenarios), and release into the environment of the treated liquid fraction. The studied system, along with all the processes included within its boundaries, is represented in Figure 1.
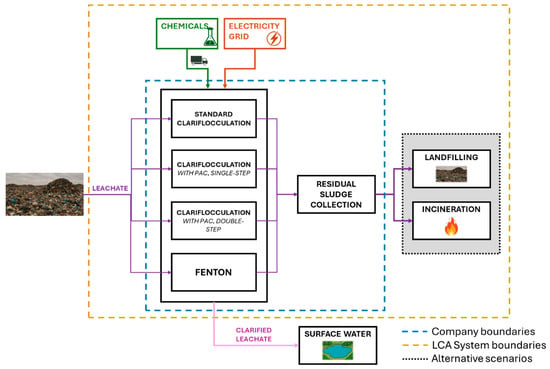
Figure 1.
Graphical representation of system boundaries and flowchart of the steps involved.
2.2.2. Life Cycle Inventory Analysis
The data regarding the experimental procedures and the removal efficiencies are provided by the laboratory report drafted by the test executor (primary data). The complete inventory dataset is reported in the SI (Tables S1–S4), referring to 1 m3 of leachate entering the process.
The values of EE consumption are provided by the plant manager (i.e., primary data), from which the samples of leachate are derived. The EE value used refers to the electricity consumption due to the treatment of 1 m3 in a chemical–physical precipitation full-scale module (Table S5). It was decided to add the EE contribution of the centrifugation step for the Fenton process, since the necessity of this separation step in the laboratory experiments was observed. The system has been modelled using the Italian electricity mix (2020), since the research group ran all the experiments in Italy and the plants providing data and samples are located in Italy, such as the company that made its laboratories available for analysis. The data regarding the discharge chemical characteristics model were provided by the plant manager (primary data), who also provided the leachate samples. The characterisation factors necessary for the toxicity assessment of the residual PFAS fraction and the discharge are taken from the USEtox database (v.2.14) (mercury, lead, arsenic, cadmium, chromium, nickel) and from the literature (PFAS) [40,41].
To obtain the data corresponding to the second FU (the removal of 1 g of PFAS), the values calculated for the first functional unit, specific to each treatment technique, are multiplied by the volume of leachate (in m3) required to remove 1 g of PFAS from the stream. The multiplication factors are as follows: clariflocculation (139.41 m3), PAC7.3 SS (40.64 m3), PAC17 SS (28.09 m3), PAC33 SS (26.23 m3), PAC3.3 DS (60.32 m3), PAC5 DS (49.84 m3), PAC7.3 DS (37.30 m3), PAC8.7 DS (31.71 m3), and Fenton (46.72 m3).
Some assumptions have been made to deal with data gaps. The first one concerns the sludge composition, which is considered constant in all treatments. Specifically, the compositions are considered representative of average sludges produced by a typical European wastewater treatment plant, as documented in ecoinvent, because they showed identical water content and no additional physical and chemical characteristics were analysed, and even if such data had been available, it would not have been possible to take them into account due to the lack of such precise data in the databases used for background information provision. Considering the high content of water and low concentrations of volatile organic compounds (VOCs), the impacts caused by direct emissions via evaporation or volatilisation of the fractions were not included in the model. The transportation of chemicals and sludge was assumed to be 100 km by freight lorry, according to the information provided by the plant manager, who estimated an average distance considering the chemical suppliers and the sludge transfer landfill. The recovery efficiency of the spent PAC in the double-step process was assumed as 90% performed via thermal treatments [25,43]. The authors are aware that the reliability and representativeness of a full-scale plant, starting from data at laboratory scale, is one of the most common challenges in the LCA of a small-scale system. Most of these challenges are due to the difference in the quantity of electricity used and in the apparatus efficiencies between different scales, as found by Piccinno et al. (2016) [44] and Arfelli et al. (2023) [45]. For this reason, we decided to use primary electricity data from the full-scale plant provided by the plant manager, opting for the medium-voltage electricity impact proxy from ecoinvent. To better match a full-scale scenario, representativeness was also considered in the transportation phase, where a freight lorry (16–32 metric tons, diesel, EURO 5) was used, as well as in the end-of-life stage of the sludges (incineration and landfilling scenarios).
The product system was modelled on SimaPro (version 12.0.0) [46], and background information was drawn from ecoinvent (version 3.10), which was selected as the reference database [47]. SimaPro is a dedicated LCA software designed for collecting, analysing, and monitoring the environmental performance of products and services, enabling the modelling and analysis of life cycles, identifying environmental hotspots, and evaluating impact contributions. ecoinvent is a life cycle inventory (LCI) database that provides well-established and revised information about several products, processes, and systems used by LCA practitioners to complete background information of their models (e.g., cradle-to-gate impacts related to the Italian energy mix).
2.2.3. Life Cycle Impact Assessment
In this phase, all the data obtained in the inventory analyses were processed and converted into the corresponding potential environmental impacts. The environmental impacts of the whole system were calculated by employing the ReCiPe 2016 (Hierarchical perspective/V1.08/World2010) as the LCIA method [48]. This is one of the most comprehensive and widely used impact assessment methods for environmental evaluation, providing midpoint and endpoint results with an adopted perspective representative of the system under scrutiny. The study primarily focused on the identification of the most impactful and responsible categories for each technique and scenario (incineration and landfilling of sludge). The analysis of each technique was performed following two different FUs and two different fates for sludge (incineration and landfilling). The authors decided to also analyse the toxicity contribution of the residual fraction of PFAS in the discharge for each technique using USEtox, a dedicated toxicity LCIA model.
2.2.4. Uncertainty Analysis
Uncertainty evaluations were performed for the midpoint impact category results within two different scenarios: PAC 8.7 DS and Fenton, since their inventories encompass the highest number of parameters and all the possible factors within the study case. We may reasonably assume that these scenarios are associated with the greatest uncertainty among those examined in this case study. The analysis was performed in line with the guidelines provided in UNI 11698:2017 [49]. The study was mainly modelled with primary data, directly measured in the system under study. Very few assumptions were made regarding transport and PAC recovery efficiency. These data can be considered highly reliable and meet the highest standards for data quality criteria commonly applied in LCA, including reliability, completeness, temporal, geographical, and technological correlation. For a quantitative determination of uncertainties associated with each inventory parameter, we referred to the data quality pedigree matrix [50]. The score for the reliability related to high-quality data (score = 1) was assigned to all the LCI parameters except for PAC recovery and transport, since they are, respectively, taken from the literature (score = 2) and based on information provided by the plant manager (score = 3). Regarding completeness, a score equal to 1 was assigned to every LCI parameter except for PAC recovery (score = 2) and transport (score = 3). A score of 2 was assigned to every LCI parameter concerning temporal correlation, evaluating the year of difference from our reference year. A score equal to 1 was assigned to each parameter concerning the geographical correlation, since the data used were considered representative of the system under study. The technological correlation of all inventory data was evaluated with a score equal to 1, except for PAC recovery, since this was taken from the literature (score = 2). A Monte Carlo simulation with 1000 runs was performed to determine the intrinsic variability of the parameters and how the quality of the data provided in the case study may affect the results. The complete pedigree matrix is available in the SI (Figure S1), and the results are available in the SI (Tables S45 and S46) and commented on in Section 3.2.
3. Results
3.1. Removal Efficiency of PFAS
The abatement techniques were performed with five different leachate samples, and the removal efficiency was calculated by applying Equation (1) reported in Section 2.1.1. All the values reporting the initial and the final PFAS concentration of each test are shown in Table S10, while the average PFAS removal efficiency, calculated as the mean of each treatment test result for each technique, is reported in Table 1.

Table 1.
Average PFAS removal efficiency (%) for each technique. PAC = powdered activated carbon; SS = single-step (clariflocculation in the presence of PAC); DS = double-step (clariflocculation is followed by PAC adsorption).
The results show that clariflocculation does not allow for a significant removal of PFAS. The literature suggests that a slightly higher abatement is achieved for long-chain compounds with respect to shorter ones, but it not sufficient to obtain a satisfactory reduction yield. Other studies obtained comparable removal efficiency with sensibly lower coagulant dosage; Wang et al. (2025) reached a removal of PFOA and PFOS of 5% and 20%, respectively, dosing 33 mg/L of Fe2(SO4)3 [12]. Maroli et al. (2024), with a dose of 100 mg/L of FeCl3, obtained a PFOA and PFOS abatement of 28% and 36% [13]. The removal ratios obtained by Bao et al. (2014) for PFOS and PFOA were 32% and 12% when 50 mg/L of FeCl3 was used as a coagulant [14]. The better performances of the other studies could be explained by the fact that all the experiments were carried out using surface water samples that, as reported in the articles, present a much lower chemical complexity than that typical of landfill leachate (chemical oxygen demand, organic content, suspended solids, etc.). The lack of literature regarding clariflocculation PFAS removal yield from landfill leachate samples leads to a non-trivial comparison between different case studies.
The treatment with activated carbon (i.e., PAC SS) resulted in significantly higher removal rates compared to the clariflocculation process. The tests were conducted using increasing amounts of carbon, focusing on dosages compatible with a potential scale-up. In general, an increase in abatement yields was observed as the quantity of PAC used increased. While this trend is easily observable at low PAC dosage, the increase in removal efficiency becomes marginal with high dosage. Furthermore, no correlation was observed between the initial PFAS concentration and PFAS removal efficiency within the same technique (Table S10). Compared to PAC SS treatment, the PFAS removal efficiency obtained with 7.3 g/L in the PAC DS is higher, 70.2% vs. 64.2%, probably due to the higher availability of active sites in the carbon, as it is added after the clariflocculation process, which has already removed some of the organic pollutants typically associated with active carbon poisoning [51,52,53]. It can be noted that the PAC-DS process achieves PFAS removal efficiency higher than clariflocculation even at low dosages. Several studies obtained comparable or better removal performances with lower PAC utilisation, probably due to lower PFAS concentration and simpler matrix characteristics, since most of them were conducted on drinking water plant samples or lightly PFAS-contaminated wastewater and leachates [8,15,54]. The most comparable case study obtained 60% of ΣPFAS11 removal with a dose of 400 mg/L and 90% with 1100 mg/L, starting from a PFAS concentration of 1122 ng/L [55].
Fenton oxidation treatments have achieved an average PFAS removal yield of 62.3 ± 4.8%. In general, these processes result in a substantial reduction in pollutant concentration due to the formation of radical reactions, but these processes have not yet been applied for PFAS removal due to the high costs and complexity of the reactions involved, which can lead to the formation of PFAS precursors that, when re-emitted in the environment, could re-transform into toxic and dangerous compounds. This technique also produced a high amount of well-suspended sludge, which makes the centrifugation necessary for the separation from the clarified leachate fraction (Table S4) [32]. Very few studies have tried to assess the removal efficiency of this technique, and they suggest that although the hydroxyl radicals play a primary role in PFAS oxidation, it is generally believed that they alone cannot effectively decompose perfluorinated compounds [56]. Mitchell et al. obtained a degradation of 89% of the initial concentration of 100,000 ng/L produced in the laboratory starting from deionised water using 34.03 g/L of H2O2 and 0.028 g/L of Fe3+ [57]. The abatement decreases to 24% with the addition of OH scavengers. The research is now focusing on Fenton-based advanced oxidative processes, where UV (ultra-violet) radiation or a catalyst is applied.
3.2. Life Cycle Assessment Results
The results of the single score, available in the SI (Tables S6–S9) (Figures S2 and S3), show that global warming (GW), particulate matter formation (PMF), human carcinogenic toxicity (HTc), and human non-carcinogenic toxicity (HTnc) are by far the most contributing categories, representing about 97% of the contribution to the single score (perspective H). The authors decided to proceed by focusing on these categories in order to identify the major environmental hotspots in the system.
The environmental impacts for each scenario and category are reported in the SI (Tables S11–S44). The results regarding the GW contribution, HTc and HTnc, and PMF are summarised in Figure 2.
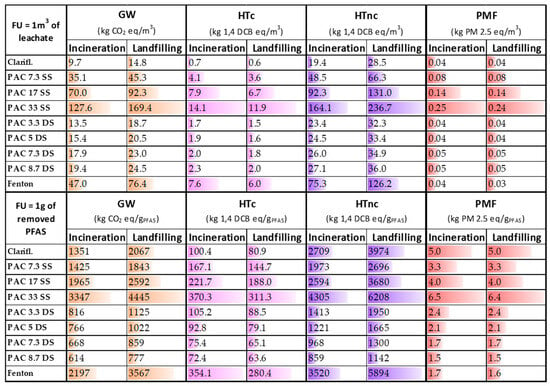
Figure 2.
Results of global warming (GW), human carcinogenic (HTc) and non-carcinogenic toxicity (HTnc), and particulate matter formation (PMF) for each PFAS removal technique. The results are differentiated depending on the two different FUs used and the fate of sludge (incineration and landfilling). SS = single-step; DS = double-step.
The differences between the two scenarios are entirely attributable to the distinct end-of-life pathways of the sludge generated during the treatment. The treatments with higher sludge production are those that register the highest differences. The impacts calculated with reference to the two different functional units (i.e., 1 m3 of treated water and 1 g of PFAS removed), as illustrated in Table 1, reflect the efficiency of the removal process. For example, the relative difference between the Fenton process and the PAC 33 SS process, identified as the process with the highest impact on GW, decreases from 63% and 55% (in the incineration and landfill scenarios, respectively) to 34% and 20%, thereby indicating a lower removal efficiency. In addition, in the landfilling scenario, an increase in the impact contribution from 27 to 62% can be observed for GW, and from 33 to 67% for the human non-carcinogenic toxicity, as well as a decrease from 12% to 21% for the HTc, and from 1% to 7% in the PMF category, depending on the removal technique.
The results of the impacts on GW, HTc, HTnc, and PMF of each technique are correlated with the corresponding PFAS removal efficiency and are represented in Figure 3.
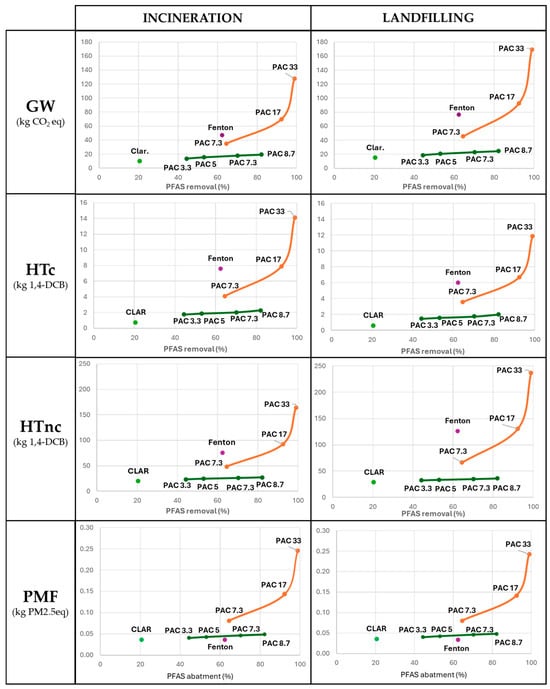
Figure 3.
Results on global warming (GW), human carcinogenic toxicity (HTc), human non-carcinogenic toxicity (HTnc), and particulate matter formation (PMF) obtained according to the treatment of 1 m3 of leachate as FU and correlated to the PFAS removal efficiency (%) for each technique. The results are presented in two columns, representing the two possible end-of-life pathways for the sludge: incineration on the left and landfilling on the right. The orange line links and highlights the trend followed by the PAC SS (single-step) processes. The green line follows the trend set by the PAC DS (double-step) processes.
The reason for focusing on GW, PMF, HTc, and HTnc is due to their influence on the single score. Indeed, PMF contributes 44% and 38% to the single score within the incineration and landfilling scenarios, respectively. It is followed by GW (30% and 36%), HTc (13% and 10%), and HTnc (11% and 13%). It is specified that results related to all 17 categories are reported in the ESI (Tables S11–S44).
Concerning GW, according to the first FU, the clariflocculation results in the least environmentally burdensome solution, thanks to the limited use of chemicals and the non-use of PAC. The limited PFAS removal efficiency of this process provokes an important increase in the impact, according to the second FU, and the overcoming of all the PAC DS techniques. The use and quantity of PAC result in the most influential and impactful parameters, representing, on average, 56% and 42% of the impact of the techniques that involve them for incineration and landfilling scenarios, respectively. Since the landfilling of the sludge resulted in the least preferable fate, the amount of sludge produced and its disposal became an important parameter in the GW contribution, representing, on average, 32% of the impact for this scenario. The normalisation to the second FU (1 g of PFAS removed) demonstrates that the removal efficiency is accounted for and influences the results, relatively increasing the impact of the technique with lower performance, and decreasing those with higher efficiency. According to this FU, the PAC DS processes are the least impactful. The increase in the amount of PAC used led to an increase in the removal efficiency and a subsequent decrease in the number of m3 necessary to be treated for the abatement of 1 g of PFAS. The results of the PAC impact on GW are in line with the values present in the literature involving full-scale treatment plants assuming the same quantity used [42].
Adopting the second FU, the HTc impact of the Fenton process significantly increases, and the trend regarding the double-step active carbons adsorption impact reverses. The most impactful phases are the PAC production, representing on average 40% of the contribution within the techniques involving them, and the sulfuric acid production, representing on average 17% of the impact. In the landfilling scenario, most of the impact is due to the same processes, with an average contribution of 47% and 20%, respectively. PAC DS techniques registered, like in the global warming contribution, the lowest impact with high removal efficiency, demonstrating it as the most promising technology.
Concerning HTnc, an increase in the impact can be observed in the landfilling of the sludge with respect to incineration. Thanks to the low involvement of chemicals and the low production of sludge, clariflocculation results in the least impactful technique, while adopting the second FU, it overcomes the other processes, resulting in the third most impactful alternative. According to the second FU, the most impactful techniques are PAC33 SS and the Fenton process. Sludge disposal and PAC production are the most crucial steps in the system, representing, respectively, 34% and 29% for the incineration scenario and 53% and 21% for the landfilling one.
Finally, the most impactful phases regarding the PMF category within the system are sulfuric acid and PAC production, which represent about 45% and 42% of the contribution, respectively. No significant differences are observable in the results since sludge management contributes only 2% to the impact. Like in the other impact categories, the PAC DS processes demonstrated the most promising compromise between environmental and removal performances.
The details and results of the uncertainty analysis are included in the SI (Tables S45 and S46). The authors decided to perform the analysis on two different techniques: PAC 8.7 DS and Fenton (landfilling scenarios), since their inventories encompass the highest number of parameters and all the possible flows within the study case, through a Monte Carlo simulation with 5000 runs carried out with the dedicated tool in the SimaPro software (version 12.0.0) with a confidence interval of 95%. The consideration of the standard deviation, in addition to the obtained results, does not change the consideration about GW (10.8% for PAC 8.7 DS, 17.6% for Fenton) and PMF (10.6% for PAC 8.7 DS, 11.9% for Fenton) in the comparison among the different techniques, while it significantly affects the discussion regarding the toxicity. The high uncertainty associated with HTc and HTnc represents an obstacle in the estimation and stating of a preference among the alternatives with certainty. The uncertainty may depend on both the inventory data quality and the selected LCIA method. Our data is mainly derived from the ad hoc model, which can be considered primary information, reflecting high-quality input data for the foreground system. In addition, the ReCiPe 2016 method imported into SimaPro does not include information related to the uncertainty associated with the LCIA method. For this reason, the notable uncertainty could be justified by the standard deviation assigned to the background flows. This supposition is consistent with previous studies (Chen et al., 2021; Rossi et al., 2024) [58,59]. Specifically, several factors (i.e., chemical–physical characteristics of the substances, mobility and transport inside and between environmental compartments, persistence, exposure models and interactions with sensitive targets, and response of the sensitive target) may have an impact on the cause-and-effect model associated with toxicity behaviour of a substance.
The authors decided to further explore the correlation between the results of the various impact categories by performing a correlation study, drawing a trend line and calculating the correlation coefficient. It is emphasised that these results do not imply a cause-and-effect relationship, but they may suggest that different categories may be affected equally or proportionately by the same cause, as explained before. The coefficients of correlation are explicit in Table 2, while graphics and calculations are available in the SI (Figures S4–S7). Graphics representing a comparison of the trend for each technique and impact category are also available in the SI (Figures S8 and S9). A strong correlation was found between GW and human toxicity impacts, probably due to the high percentage contribution of PAC for both categories. In general, weaker correlations comprise PMF impacts, in particular, those related to the second FU (removal of 1 g of PFAS). This could be due to the higher contribution of sulfuric acid production to the impact in the last category, which is much lower in the others.
Table 2.
Coefficients of correlation (R2) between different impact categories results within every scenario and FU. Red values indicate a coefficient under 0.7 (low correlation); yellow values indicate a coefficient between 0.7 and 0.9 (medium correlation); light-green values indicate a coefficient between 0.9 and 0.99 (high correlation); green bold values indicate a coefficient over 0.99 (very high correlation). GW = global warming; HTc = human carcinogenic toxicity; HTnc = human non-carcinogenic toxicity; PMF = particulate matter formation.
The correlation study proceeds by analysing the link between the most impactful parameters, as determined by our results, and each impact category, following the same framework explained before. The coefficients (R2), illustrated in Table 3, demonstrate a strong correlation with the amount of virgin PAC used and the amount of sludge produced within the process. These parameters could be considered good indicators for a qualitative environmental assessment of the removal process. Some exceptions can be observed in the influence of the quantity of sludge produced on the PMF category, whose contribution is minimal, as stated before. Complete calculations and graphics (Figures S8 and S9) are available in the SI.
Table 3.
Coefficients of correlation (R2) between the amount of virgin PAC used, the amount of sludge produced, and each impact category contribution within every scenario. Red values indicate a coefficient under 0.7 (low correlation); yellow values indicate a coefficient between 0.7 and 0.9 (medium correlation); light-green values indicate a coefficient between 0.9 and 0.99 (high correlation); green bold values indicate a coefficient over 0.99 (very-high correlation).
Since it is proven that PFAS have negative outcomes on human health and ecosystems, and each technique demonstrated different PFAS removal efficiency, the authors decided to assess the toxicity contribution of the residual PFAS fraction in the discharge. Characterisation factors, sources, calculations, and results are fully reported in the SI (Tables S49–S54). The analyses reported that the most prevalent PFAS in the discharge sample are PFOA (perfluoroctanoic acid), PFBA (perfluorobutanoic acid), PFBS (perfluorobutanesulfonic acid), and PFHxA (perfluorohexanoic acid), representing 55.8%, 14.6%, 13.9%, and 6.8%, respectively. They are assumed to be the only PFAS compounds present in the discharge for modelling toxicity to facilitate the identification of characterisation factors and calculations (Table S48). Other substances and molecules were inserted in the model to simulate the chemical characteristics of a real discharge situation (Table S47). The chemicals’ concentration and characterisation are taken from the annual plant report that the leachate samples came from, involving the following substances: mercury, lead, arsenic, cadmium, chromium, and nickel (the limits meet all legal requirements regarding surface discharges).
The results show that the release of PFAS contributes to the overall toxicity impacts of the system, less than 1% in each category, both at the midpoint and endpoint level. The only significant contribution registered from PFAS toxicity is regarding the midpoint (human health, non-cancer) category [cases/kg emitted] (freshwater compartment), where they represent 29.7% of the discharge contribution. The total discharge toxicity contribution represents around 4% of the total system impact for human health (HH) cancer midpoint and human health endpoint, and less than 1% for ecotoxicity (EC) categories. The ecotoxicity contribution of PFAS was calculated using the characterisation factors provided by Holmquist et al. (2020) [40] based on USEtox version 2.1 and Aggarwal (2025) [41] based on USEtox version 2.13. The authors of those works applied the so-called PFAS-adapted model, where some consensus variations to the regular USEtox methodology were applied, such as the use of Koc instead of Kow for the chemical partitioning modelling to better suit their peculiar amphiphilic properties and the consideration of the degradation into other potentially toxic products. No significant variation in the results was detected in this case study due to the low contribution of PFAS toxicity to the system.
4. Discussion and Conclusions
The study successfully identified major environmental hotspots of each leachate treatment technique, evaluating the most promising process in terms of the sustainability of clariflocculation (chemical–physical precipitation), followed by the physical adsorption of contaminants on particulate active carbons of the clarified fractions (PAC DS). The dosage of PAC influences the PFAS removal efficiency and the environmental performance of the process, although higher dosages also entail greater environmental impacts. Comparing data from previous abatement tests resulted in a complex scope, as very few PFAS abatement studies have been performed directly on leachate as it is. The complexity and variability of this matrix make the abatement of micropollutants a challenging task. The authors focused on four different impact categories to take as broad a view as possible of the environmental impacts of the processes examined. Landfilling of sludge registered an increase in the impact on GW and HTnc, and a decrease in the impact on HTc and PMF compared to incineration. These values and trends are also confirmed with the adoption of the other FU. The major environmental hotspot results from the production of PAC, which overcomes electricity and other flows, resulting in the most impactful parameter for three out of four categories discussed in this work, confirming the trends identified from past studies where the production and treatment of PAC represented the most important and challenging environmental challenge for the processes in which PAC is involved [60].
Analysing all the other categories considered by the ReCiPe method, the results confirm that the double-step adsorption on active carbon treatment (PAC DS) is the most promising technique regarding the environmental impact. Trends similar to those discussed in the study can be observed for all the other impact categories with every scenario and technique. The landfilling of the sludge results in the most impactful end-of-life scenario in the following categories: freshwater eutrophication (FE), freshwater ecotoxicity (Ftox), marine ecotoxicity (Mtox), and land use (LO), while it resulted in the most sustainable option in the others.
Considering all the other impact categories analysed by the ReCiPe method, the most impactful environmental hotspots for the clariflocculation technique are the iron (III) chloride production and the sludge management, which are major contributors to stratospheric ozone depletion (SOzD), ionising radiation (IR), ozone formation (OzF), land use (LO), and mineral resource scarcity (MRSc), and freshwater eutrophication (FE), freshwater ecotoxicity (Ftox), and marine ecotoxicity (Mtox), respectively.
The major environmental hotspot for the techniques involving PAC is still its production, followed by the contribution due to the iron (III) chloride when a limited amount of carbon is added in the treatments. The production of the polyelectrolyte and the sludge management consist of the most impactful phase within the Fenton system, considering all the other impact categories, due to the high amount necessary in the treatment (six times more than in other techniques).
Several considerations and strategies can be evaluated to decrease the environmental impacts, such as the adoption of less impactful alternatives for the adsorption step, like biochar, which, unfortunately, to date, does not seem to guarantee the same removal performance as PAC [61]. A promising alternative might be the implementation of higher-performance PAC recovery processes, reducing the input amount, including the environmental burdens associated with the recovery in the evaluation or considering a different active carbon source, such as coconut and wood, which have demonstrated lower impacts [62]. It is reasonable to deduce that the impact assessment of these techniques at full scale may result in a higher percentage contribution from electricity, as reported in several studies [25,42]. This is because in this study, unlike the use of chemicals, electricity consumption has already been optimised using primary data from existing treatment plants. To better analyse and comprehend the role and contribution of the electricity grid in the overall impact of the system, the authors performed a sensitivity analysis involving the most sustainable scenarios (PAC DS), where the influence of different national electricity grids was assessed. The impact assessment was performed adopting two very different electricity mixes: the Polish national grid (0.88 kgCO2eq/kWh) and the Swedish national grid (0.04 kgCO2eq/kWh). Extensive results are available in the SI (Tables S55–S58). The analysis revealed a maximum fluctuation in the overall system impact results between −2% and +4% depending on the scenario and impact category taken into consideration. This component and its underlying assumptions, as well as the sustainable practices that could be implemented to reduce the electricity grid impact, should be carefully considered and discussed within systems where energy consumption is critical.
The analysis of the toxicity contribution of the discharge and the relative PFAS content, performed through the USEtox model, shows their negligible impact compared to the other steps of the system that represent 95.4% (midpoint HH, cancer), 98.1% (midpoint HH, non-cancer), 96.2% (endpoint HH), and 100% for EC (midpoint and endpoint) of the total contribution, respectively. Further research and investigation are necessary for the refinement of PFAS characterisation factors. Nowadays, only the USEtox model is able to evaluate their fate pathway and toxicity, but very few works are already available, and results significantly vary among them. The authors tried to identify and use the most recent and updated values in the literature. To better comprehend the role and influence of the pollutant concentration in the discharge (other than PFAS) and its toxicity contribution, the authors decided to implement a sensitivity analysis, where the highest allowed concentrations of metals (mercury, lead, arsenic, cadmium, chromium, and nickel) are modelled in the discharge and differences were detected and assessed. Extensive results and reporting are available in the SI (Tables S59–S63). The results did not demonstrate sensible variation in the EC (midpoint and endpoint) categories, while significant variations were registered in the HH categories. The overall impact of the systems increased by a mean of +164% (midpoint HH, cancer) and +297% (midpoint HH, non-cancer), with few fluctuations depending on the end-of-life phase and involved technique. These variations were also reflected in the endpoint HH categories, which registered a mean increase of +204%. This analysis highlighted the importance of the discharge pollutant concentration contribution in the scenarios involving the treatment of the heavily polluted fractions, such as landfill leachate, since its contribution to the overall toxicity increased to 26.6% (midpoint HH, cancer), 37.8% (midpoint HH, non-cancer), and 31.6% (endpoint HH).
The coefficients of correlation shown in Section 3.2 demonstrate that different impact categories can be proportionally or similarly influenced by the same factor, such as a chemical or the amount of waste produced, and that very few parameters are able to strongly influence the results of the entire system and be successfully used as preliminary qualitative parameters for the environmental assessment of a process.
The results obtained in the abatement tests confirm the difficulties that the treatment of such a polluted and complex wastewater matrix could lead to, as also reported in the studies already described, which demonstrate better PFAS removal yield with similar or lower chemical requirements.
Some existing technologies have already been applied in the treatment of landfill leachate within a full-scale plant for the removal of PFAS, such as nanofiltration (NF) and reverse osmosis (RO), but very few and conflicting case studies have been analysed so far. These techniques exhibit excellent PFAS abatement efficiencies, but they are energy-intensive, and their cost and environmental sustainability strongly depend on the electricity mix impact and cost and contaminants’ concentration [6]. Their use is generally preferred and exploited in emergencies, where high concentrations of contaminants are registered and rapid adaptation to legislation is required. The use of these techniques in situations involving normal routine activities with pollutant concentrations within the norm and their environmental performance should be further investigated, since they already consist of a technology that is successfully used around the globe.
The results of the study are reported according to two different FUs to highlight the differences and considerations regarding their use depending on the scope and the desired information. The authors decided to adopt two different FUs to stimulate the debate and the observations arising from the results. The second FU (removal of 1 g of PFAS) could be considered more accurate because it includes a more precise quantification of the function, evaluating and incorporating the performance of the removal, and answering the question “How well?” which is a fundamental and indispensable aspect of an FU. According to this FU, the PAC SS process, the Fenton oxidation, and the clariflocculation result in the most impactful techniques. The results obtained with the first FU (treatment of 1 m3 entering the process) need to be plotted and ordered according to each removal efficiency to express significant data. Actually, in some cases, this FU may be the most suitable to adopt, since the most suitable FU strongly depends on the goal of the study and on the information required.
In the case that the researchers already know the minimum removal efficiency needed for a treatment and their goal is to identify the least impactful technique that guarantees this performance, “treatment of 1 m3 entering the process” may be the most suitable as the other FU overlooks this aspect.
In the case that the study aims to identify the least impactful technique for the removal of a certain quantity of contaminants (i.e., sampling campaign), “removal/collection of 1 g of PFAS” is the most suitable FU, because the other overlooks the amount of m3 of leachate necessary to be treated for the accomplishment of the task.
The authors therefore recommend a careful consideration of the background and the FU definition process.
Supplementary Materials
The following supporting information can be downloaded at https://www.mdpi.com/article/10.3390/environments13010035/s1.
Author Contributions
F.B.: conceptualization, methodology, software, formal analysis, writing—original draft preparation, visualisation; F.A.: validation, writing—review and editing, visualisation; M.P.: methodology, chemical analysis, laboratory reports, resources; M.F.: conceptualization, validation, supervision; L.C.: methodology, supervision; D.C.: validation, writing—review and editing, visualisation; F.P.: supervision, project administration, funding acquisition. All authors have read and agreed to the published version of the manuscript.
Funding
Herambiente Servizi Industriali s.r.l., Viale Berti Pichat 2/4 40127 Bologna (BO), Italy, (F.C. 03675900280, P.I. 03819031208) partly funded the doctoral scholarship of Federico Bedogni, decreed by DM 117 on 2 March 2023, as part of the “National Recovery and Resilience Plan”, Mission 4, Component 2, Investment 3.3. This research received no dedicated additional funding, and the results obtained from this research could not have influenced current and future funding allocations in any way.
Data Availability Statement
The original contributions presented in this study are included in the article/supplementary material. Further inquiries can be directed to the corresponding author.
Acknowledgments
The authors extend their sincere gratitude to HERA Group’s society for their support in various capacities: Heratech s.r.l. for providing the equipment and space necessary for laboratory testing and analysis; Herambiente S.p.A. for industrial plant information; and Herambiente Servizi Industriali s.r.l. for financial support and for permission to publish this study.
Conflicts of Interest
Matteo Picchietti, and Massimo Facchini were employed by the company Herambiente Servizi Industriali. The authors declare the previous financial interests which may be considered as potential competing interests. As stated also in under Funding, Fabrizio Passarini declares that Herambiente Servizi Industriali s.r.l., Viale Berti Pichat 2/4 40127 Bologna (BO), Italy, partly funded the doctoral scholarship of Federico Bedogni, but this research received no dedicated additional funding, and the results obtained from this research could not have influenced current and future funding allocations in any way. As stated in the manuscript, Matteo Picchietti and Massimo Facchini were involved in the chemical analysis, laboratory reports, conceptualization, and supervision of the work. The other authors declare no conflicts of interest.
Abbreviations
The following abbreviations are used in this manuscript:
| SI | Supporting information |
| LCA | Life cycle assessment |
| PFAS | Per- and polyfluoroalkyl substances |
| PFOA | Perfluorooctanoic acid |
| PFOS | Perfluorooctainoicsulfonic acid |
| PFBA | Perfluorobutanoic acid |
| PFBS | Perfluorobutanoicsulfonic acid |
| PFHxA | Perfluorohexanoic acid |
| WWTP | Wastewater treatment plant |
| PAC | Particulate activated carbon |
| ASTM | Advancing standards transforming markets |
| UPLC | Ultra-performance liquid chromatography |
| LOQ | Limit of quantification |
| ISO | International standardisation and organisation |
| LCI | Life cycle inventory |
| LCIA | Life cycle impact assessment |
| UNEP | United Nations Environment Programme |
| SETAC | Society of Environmental Toxicology and Chemistry |
| CF | Characterisation factor |
| FU | Functional unit |
| EE | Electrical energy |
| SS | Single-step |
| DS | Double-step |
| VOC | Volatile organic compound |
| H | Hierarchical |
| GW | Global warming |
| HTc | Human carcinogenic toxicity |
| HTnc | Human non-carcinogenic toxicity |
| PMF | Particulate matter formation |
| HH | Human health |
| EC | Ecotoxicity |
References
- Goldenman, G.; Fernandes, M.; Holland, M.; Tugran, T.; Nordin, A.; Schoumacher, C.; McNeill, A. The Cost of Inaction: A Socioeconomic Analysis of Environmental and Health Impacts Linked to Exposure to PFAS; Nordic Council of Ministers: Copenhagen, Denmark, 2019. [Google Scholar]
- Gaines, L.G.T. Historical and current usage of per- and polyfluoroalkyl substances (PFAS): A literature review. Am. J. Ind. Med. 2023, 66, 353–378. [Google Scholar] [CrossRef]
- European Chemicals Agency. Per-and Polyfluoroalkyl Substances (PFAS) Legislation. Available online: https://echa.europa.eu/hot-topics/perfluoroalkyl-chemicals-pfas (accessed on 14 December 2025).
- Clara, M.; Scheffknecht, C.; Scharf, S.; Weiss, S.; Gans, O. Emissions of perfluorinated alkylated substances (PFAS) from point sources—Identification of relevant branches. Water Sci. Technol. 2008, 58, 59–66. [Google Scholar] [CrossRef] [PubMed]
- Glüge, J.; Scheringer, M.; Cousins, I.T.; DeWitt, J.C.; Goldenman, G.; Herzke, D.; Lohmann, R.; Ng, C.A.; Trier, X.; Wang, Z. An overview of the uses of per-And polyfluoroalkyl substances (PFAS). Environ. Sci. Process. Impacts 2020, 22, 2345–2373. [Google Scholar] [CrossRef]
- Feng, D.; Song, C.; Mo, W. Environmental, human health, and economic implications of landfill leachate treatment for per-and polyfluoroalkyl substance removal. J. Environ. Manag. 2021, 289, 112558. [Google Scholar] [CrossRef]
- Zhang, H.; Chen, Y.; Liu, Y.; Bowden, J.A.; Townsend, T.G.; Solo-Gabriele, H.M. Do PFAS changes in landfill leachate treatment systems correlate with changes in physical chemical parameters? Waste Manag. 2022, 151, 49–59. [Google Scholar] [CrossRef]
- Chen, Y.; Zhang, H.; Liu, Y.; Bowden, J.A.; Tolaymat, T.M.; Townsend, T.G.; Solo-Gabriele, H.M. Concentrations of perfluoroalkyl and polyfluoroalkyl substances before and after full-scale landfill leachate treatment. Waste Manag. 2022, 153, 110–120. [Google Scholar] [CrossRef] [PubMed]
- Fang, D.; Wang, J.; Cui, D.; Dong, X.; Tang, C.; Zhang, L.; Yue, D. Recent Advances of Landfill Leachate Treatment. J. Indian Inst. Sci. 2021, 101, 685–724. [Google Scholar] [CrossRef]
- Moravia, W.G.; Amaral, M.C.S.; Lange, L.C. Evaluation of landfill leachate treatment by advanced oxidative process by Fenton’s reagent combined with membrane separation system. Waste Manag. 2013, 33, 89–101. [Google Scholar] [CrossRef]
- Bandala, E.R.; Liu, A.; Wijesiri, B.; Zeidman, A.B.; Goonetilleke, A. Emerging materials and technologies for landfill leachate treatment: A critical review. Environ. Pollut. 2021, 291, 118133. [Google Scholar] [CrossRef]
- Wang, P.; An, G.; Carra, I.; Hassard, F.; Moreno, P.C.; Sakar, H.; Jodkowska, M.; Wang, D.; Jefferson, B.; Chu, W.; et al. Removal of perfluorooctanoic acid (PFOA) and perfluorooctanesulfonic acid (PFOS) by coagulation: Influence of coagulant and dosing conditions. Sep. Purif. Technol. 2024, 355, 129562. [Google Scholar] [CrossRef]
- Maroli, A.S.; Zhang, Y.; Lubiantoro, J.; Venkatesan, A.K. Surfactant-enhanced coagulation and flocculation improves the removal of perfluoroalkyl substances from surface water. Environ. Sci. Adv. 2024, 3, 1714–1721. [Google Scholar] [CrossRef]
- Bao, Y.; Niu, J.; Xu, Z.; Gao, D.; Shi, J.; Sun, X.; Huang, Q. Removal of perfluorooctane sulfonate (PFOS) and perfluorooctanoate (PFOA) from water by coagulation: Mechanisms and influencing factors. J. Colloid Interface Sci. 2014, 434, 59–64. [Google Scholar] [CrossRef]
- Pan, C.G.; Liu, Y.S.; Ying, G.G. Perfluoroalkyl substances (PFASs) in wastewater treatment plants and drinking water treatment plants: Removal efficiency and exposure risk. Water Res. 2016, 106, 562–570. [Google Scholar] [CrossRef]
- Walker, T.; Milligan, K.A. From persistence to progress: Assessing per-and polyfluoroalkyl substances (PFAS) environmental impact and advances in photo-assisted fenton chemistry for remediation. Front. Environ. Chem. 2025, 6, 1591290. [Google Scholar] [CrossRef]
- Nhu, H.D.H.; Van Tri, D.; Le Luu, T.; Trippel, J.; Wagner, M. Degradation of 29 per-and polyfluoroalkyl substances (PFAS) in water using fenton-assisted electrochemical oxidation process. Sep. Purif. Technol. 2025, 362, 131908. [Google Scholar] [CrossRef]
- Schlesinger, D.R.; McDermott, C.; Le, N.Q.; Ko, J.S.; Johnson, J.K.; Demirev, P.A.; Xia, Z. Destruction of per/poly-fluorinated alkyl substances by magnetite nanoparticle-catalyzed UV-Fenton reaction. Environ. Sci. Water Res. Technol. 2022, 8, 2732. [Google Scholar] [CrossRef]
- Ribera-Pi, J.; Badia-Fabregat, M.; Espí, J.; Clarens, F.; Jubany, I.; Martínez-Lladó, X. Decreasing environmental impact of landfill leachate treatment by MBR, RO and EDR hybrid treatment. Environ. Technol. 2021, 42, 3508–3522. [Google Scholar] [CrossRef]
- Di Maria, F.; Sisani, F. A life cycle assessment of conventional technologies for landfill leachate treatment. Environ. Technol. Innov. 2017, 8, 411–422. [Google Scholar] [CrossRef]
- Zhang, L.; Bai, H.; Zhang, Y.; Wang, Y.; Yue, D. Life Cycle Assessment of Leachate Treatment Strategies. Environ. Sci. Technol. 2021, 55, 13264–13273. [Google Scholar] [CrossRef] [PubMed]
- Boyer, T.H.; Ellis, A.; Fang, Y.; Schaefer, C.E.; Higgins, C.P.; Strathmann, T.J. Life cycle environmental impacts of regeneration options for anion exchange resin remediation of PFAS impacted water. Water Res. 2021, 207, 117798. [Google Scholar] [CrossRef]
- Li, G.; Dunlap, J.; Wang, Y.; Huang, Q.; Li, K. Environmental Life Cycle Assessment (LCA) of Treating PFASs with Ion Exchange and Electrochemical Oxidation Technology. ACS EST Water 2022, 2, 1555−1564. [Google Scholar] [CrossRef]
- Emery, I.; Kempisty, D.; Fain, B.; Mbonimpa, E. Evaluation of treatment options for well water contaminated with perfluorinated alkyl substances using life cycle assessment. Int. J. Life Cycle Assess. 2019, 24, 117–128. [Google Scholar] [CrossRef]
- Ellis, A.C.; Boyer, T.H.; Fang, Y.; Liu, C.J.; Strathmann, T.J. Life cycle assessment and life cycle cost analysis of anion exchange and granular activated carbon systems for remediation of groundwater contaminated by per-and polyfluoroalkyl substances (PFASs). Water Res. 2023, 243, 120324. [Google Scholar] [CrossRef]
- Cantoni, B.; Turolla, A.; Wellmitz, J.; Ruhl, A.S.; Antonelli, M. Perfluoroalkyl substances (PFAS) adsorption in drinking water by granular activated carbon: Influence of activated carbon and PFAS characteristics. Sci. Total Environ. 2021, 795, 148821. [Google Scholar] [CrossRef]
- Kim, G.; Mengesha, D.N.; Choi, Y. Adsorption dynamics of per-and polyfluoroalkyl substances (PFAS) on activated carbon: Interplay of surface chemistry and PFAS structural properties. Sep. Purif. Technol. 2024, 349, 127851. [Google Scholar] [CrossRef]
- Deng, Y.; Englehardt, J.D. Englehardt, Treatment of landfill leachate by the Fenton process. Water Res. 2006, 40, 3683–3694. [Google Scholar] [CrossRef]
- Umar, M.; Aziz, H.A.; Yusoff, M.S. Trends in the use of Fenton, electro-Fenton and photo-Fenton for the treatment of landfill leachate. Waste Manag. 2010, 30, 2113–2121. [Google Scholar] [CrossRef] [PubMed]
- ASTM D7979-19; Standard Test Method for Determination of per-and Polyfluoroalkyl Substances in Water, Sludge, Influent, Effluent, and Wastewater by Liquid Chromatography Tandem Mass Spectrometry (LC/MS/MS). US Department of Health and Human Services: Washington, DC, USA, 2020.
- Method 537.1; Determination of Selected Per- and Polyfluorinated Alkyl Substances in Drinking Water by Solid Phase Extraction and Liquid Chromatography/Tandem Mass Spectrometry (LC/MS/MS). National Exposure Research Laboratory; Office of Research and Development; U.S. Environmental Protection Agency: Cincinnati, OH, USA, 2018.
- Picchietti, M.; Facchini, M.; Passarini, F. Processi di Abbattimento dei PFAS Nei Percolati di Discarica; Alma Mater Studiorum—University of Bologna: Bologna, Italy, 2021. [Google Scholar]
- ISO 14040:2006; Environmental Management—Life Cycle Assessment—Principles and Framework. International Organization for Standardization: Geneva, Switzerland, 2006.
- ISO 14044:2006; Environmental Management—Life cycle Assessment—Requirements and Guidelines. International Organization for Standardization: Geneva, Switzerland, 2006.
- Hauschild, M.Z.; Rosenbaum, R.K.; Olsen, S.I. Life Cycle Assessment—Theory and Practice; Routledge: London, UK, 2018. [Google Scholar]
- Fenton, S.E.; Ducatman, A.; Boobis, A.; DeWitt, J.C.; Lau, C.; Ng, C.; Smith, J.S.; Roberts, S.M. Per-and Polyfluoroalkyl Substance Toxicity and Human Health Review: Current State of Knowledge and Strategies for Informing Future Research. Environ. Toxicol. Chem. 2021, 40, 606–630. [Google Scholar] [CrossRef] [PubMed]
- Cao, Y.; Ng, C. Absorption, distribution, and toxicity of per-and polyfluoroalkyl substances (PFAS) in the brain: A review. Environ. Sci. Process. Impacts 2021, 23, 1623–1640. [Google Scholar] [CrossRef]
- USEtox. Available online: https://usetox.org/ (accessed on 14 December 2025).
- Rosenbaum, R.K.; Bachmann, T.M.; Gold, L.S.; Huijbregts, M.A.; Jolliet, O.; Juraske, R.; Koehler, A.; Larsen, H.F.; MacLeod, M.; Margni, M.; et al. USEtox—The UNEP-SETAC toxicity model: Recommended characterisation factors for human toxicity and freshwater ecotoxicity in life cycle impact assessment. Int. J. Life Cycle Assess. 2008, 13, 532–546. [Google Scholar] [CrossRef]
- Holmquist, H.; Fantke, P.; Cousins, I.T.; Owsianiak, M.; Liagkouridis, I.; Peters, G.M. An (Eco)Toxicity Life Cycle Impact Assessment Framework for Per-And Polyfluoroalkyl Substances. Environ. Sci. Technol. 2020, 54, 6224–6234. [Google Scholar] [CrossRef]
- Aggarwal, R. Freshwater ecotoxicity characterization factors for PFASs. Integr. Environ. Assess. Manag. 2025, 21, 208–219. [Google Scholar] [CrossRef]
- Postacchini, L.; Ciarapica, F.E.; Bevilacqua, M. Environmental assessment of a landfill leachate treatment plant: Impacts and research for more sustainable chemical alternatives. J. Clean. Prod. 2018, 18, 1021–1033. [Google Scholar] [CrossRef]
- Igos, E.; Mailler, R.; Guillossou, R.; Rocher, V.; Gasperi, J. Life cycle assessment of powder and micro-grain activated carbon in a fluidized bed to remove micropollutants from wastewater and their comparison with ozonation. J. Clean. Prod. 2021, 287, 125067. [Google Scholar] [CrossRef]
- Piccinno, F.; Hischier, R.; Seeger, S.; Som, C. From laboratory to industrial scale: A scale-up framework for chemical processes in life cycle assessment studies. J. Clean. Prod. 2016, 135, 1085–1097. [Google Scholar] [CrossRef]
- Arfelli, F.; Pizzone, D.M.; Cespi, D.; Ciacci, L.; Ciriminna, R.; Calabrò, P.S.; Pagliaro, M.; Mauriello, F.; Passarini, F. Prospective life cycle assessment for the full valorization of anchovy fillet leftovers: The LimoFish process. Waste Manag. 2023, 168, 156–166. [Google Scholar] [CrossRef] [PubMed]
- SimaPro—PRé Sustainability, B.V. Available online: https://simapro.com/ (accessed on 14 December 2025).
- Ecoinvent—Data with Purpose. Available online: https://ecoinvent.org/ (accessed on 14 December 2025).
- Huijbregts, M.A.J.; Steinmann, Z.J.N.; Elshout, P.M.F.; Stam, G.; Verones, F.; Vieira, M.; Zijp, M.; Hollander, A.; van Zelm, R. ReCiPe2016: A harmonised life cycle impact assessment method at midpoint and endpoint level. Int. J. Life Cycle Assess. 2017, 22, 138–147. [Google Scholar] [CrossRef]
- UNI 11698:2017; Gestione Ambientale di Prodotto—Stima, dichiarazione e Utilizzo Dell’incertezza dei Risultati di una Valutazione di Ciclo di Vita—Requisiti e Linee Guida. Ente Italiano di Normalzione: Milano, Italy, 2017.
- Weidema, B.P.; Wesnæs, M.S. Data quality management for life cycle inventories-an example of using data quality indicators. J. Clean. Prod. 1996, 4, 167–174. [Google Scholar] [CrossRef]
- Wang, Q.; Lechtenfeld, O.J.; Rietveld, L.C.; Schuster, J.; Ernst, M.; Hofman-Caris, R.; Kaesler, J.; Wang, C.; Yang, M.; Yu, J.; et al. How aromatic dissolved organic matter differs in competitiveness against organic micropollutant adsorption. Environ. Sci. Ecotechnol 2024, 21, 100392. [Google Scholar] [CrossRef]
- Karanfil, T.; Kitis, M.; Kilduff, J.E.; Wigton, A. Role of Granular Activated Carbon Surface Chemistry on the Adsorption of Organic Compounds 2 Natural Organic Matter. Environ. Sci. Technol. 1999, 33, 3225–3233. [Google Scholar] [CrossRef]
- Matsui, Y.; Fukuda, Y.; Inoue, T.; Matsushita, T. Effect of natural organic matter on powdered activated carbon adsorption of trace contaminants: Characteristics and mechanism of competitive adsorption. Water Res. 2003, 37, 4413–4424. [Google Scholar] [CrossRef]
- Travar, I.; Uwayezu, J.N.; Kumpiene, J.; Yeung, L.W. Challenges in the PFAS Remediation of Soil and Landfill Leachate: A Review. Adv. Environ. Eng. Res. 2021, 2, 1–40. [Google Scholar] [CrossRef]
- Malovanyy, A.; Hedman, F.; Bergh, L.; Liljeros, E.; Lund, T.; Suokko, J.; Hinrichsen, H. Comparative study of per-and polyfluoroalkyl substances (PFAS) removal from landfill leachate. J. Hazard. Mater. 2023, 460, 132505. [Google Scholar] [CrossRef] [PubMed]
- Zhang, K.; Sumita; Li, C.; Sun, C.; Marmier, N. A Review of the Treatment Process of Perfluorooctane Compounds in the Waters: Adsorption, Flocculation, and Advanced Oxidative Process. Water 2022, 14, 2692. [Google Scholar] [CrossRef]
- Mitchell, S.M.; Ahmad, M.; Teel, A.L.; Watts, R.J. Degradation of Perfluorooctanoic Acid by Reactive Species Generated through Catalyzed H2O2 Propagation Reactions. Environ. Sci. Technol. Lett. 2013, 1, 117–121. [Google Scholar] [CrossRef]
- Chen, X.; Matthews, H.S.; Griffin, W.M. Uncertainty caused by life cycle impact assessment methods: Case studies in process-based LCI databases. Resour. Conserv. Recycl. 2021, 172, 105678. [Google Scholar] [CrossRef]
- Rossi, E.; Arfelli, F.; Barani, L.; Cespi, D.; Ciacci, L.; Passarini, F. Improving the waste management system in an Italian footwear district applying MFA and LCA. Sci. Total Environ. 2024, 955, 177289. [Google Scholar] [CrossRef]
- Maga, D.; Aryan, V.; Bruzzano, S. Environmental Assessment of Various End-of-Life Pathways for Treating Per-and Polyfluoroalkyl Substances in Spent Fire-Extinguishing Waters. Environ. Toxicol. Chem. 2021, 40, 947–957. [Google Scholar] [CrossRef]
- Thompson, K.A.; Shimabuku, K.K.; Kearns, J.P.; Knappe, D.R.U.; Summers, R.S.; Cook, S.M. Environmental Comparison of Biochar and Activated Carbon for Tertiary Wastewater Treatment. Environ. Sci. Technol. 2016, 50, 11253–11262. [Google Scholar] [CrossRef]
- Vilén, A.; Laurell, P.; Vahala, R. Comparative Life Cycle Assessment of Activated Carbon Production from Various Raw Materials. J. Environ. Manag. 2022, 324, 116356. [Google Scholar] [CrossRef] [PubMed]


Disclaimer/Publisher’s Note: The statements, opinions and data contained in all publications are solely those of the individual author(s) and contributor(s) and not of MDPI and/or the editor(s). MDPI and/or the editor(s) disclaim responsibility for any injury to people or property resulting from any ideas, methods, instructions or products referred to in the content. |
© 2026 by the authors. Licensee MDPI, Basel, Switzerland. This article is an open access article distributed under the terms and conditions of the Creative Commons Attribution (CC BY) license.